Ocean Science
surface — clearly informing Canadians about complex issues while helping to guide decision making for related policies and programs.
The Canada’s Oceans Now reports provide a comprehensive summary of the current status and trends in Canada’s oceans and marine ecosystems. These reports for Canadians are part of the Government of Canada’s commitment to inform its citizens on the current state and potential future state of Canada’s oceans.
The report’s primary audiences are:
• Senior policy makers at the federal level and in other departments
• Decision-makers at municipal and provincial levels and in the international community
• Industry, academia, NGOs, and university researchers
• Members of the public
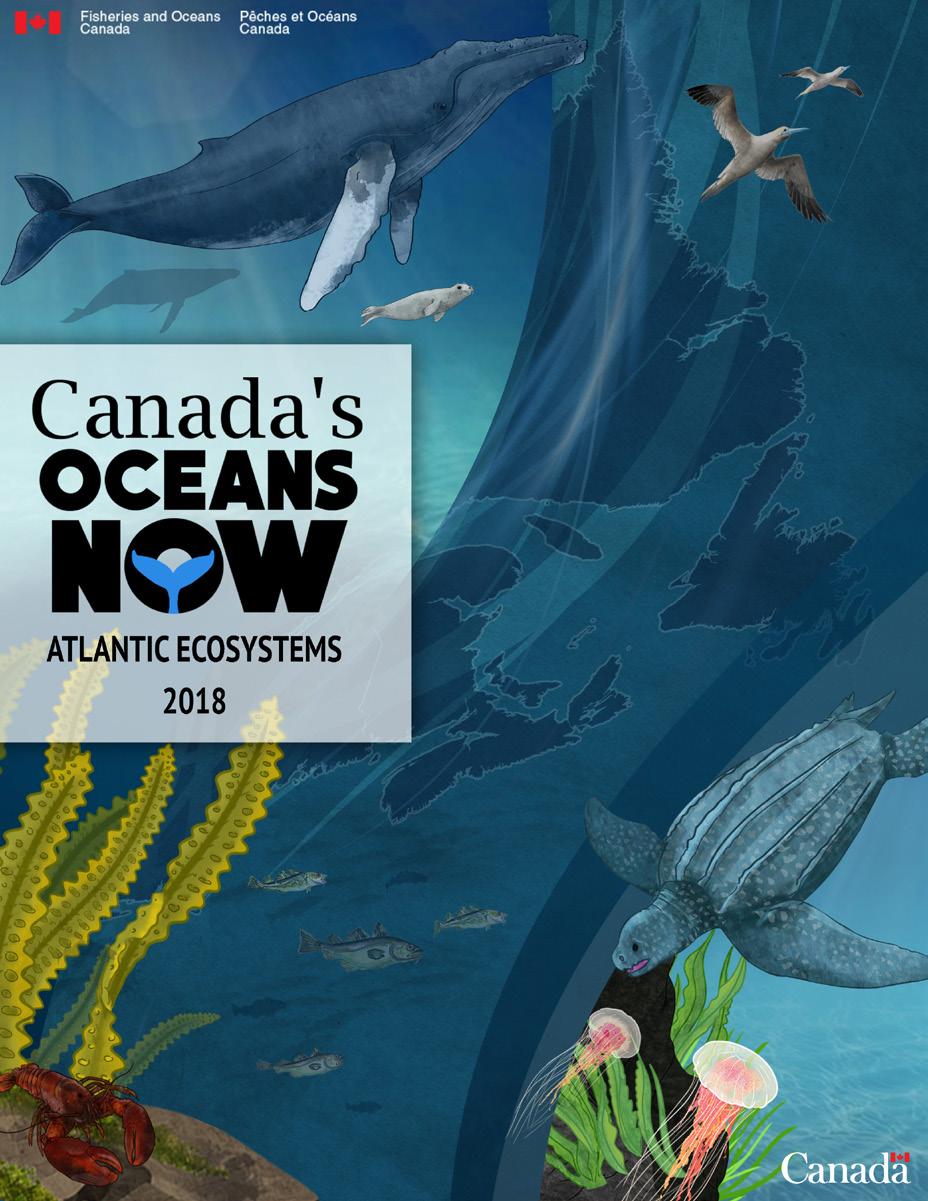
Working collaboratively with DFO scientists, science advisors, and communications professionals, NIVA provided a comprehensive suite of services to develop this inaugural report in the Canada’s Oceans Now series. We met with DFO scientists to gain an understanding of the scope of their research, and we worked with them to identify the key messages that needed to be emphasized from that research.
We wrote the plain language content that formed the core of the report, turning the key messages from the science into a clear, easy-to-understand narrative. We developed the report’s design, created data visualizations to help a broad audience understand the numbers and crafted stunning illustrations to engage the report’s target audiences.
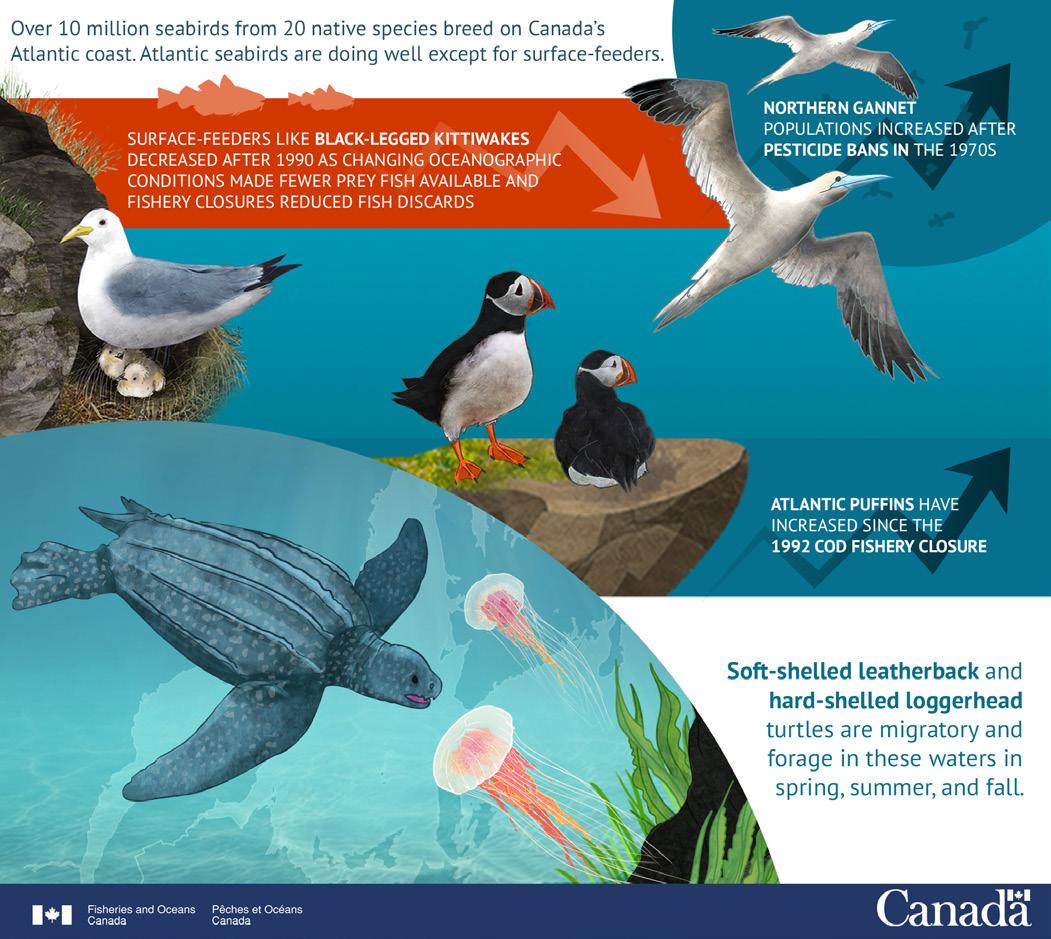
Our work on the main report served as jumping off point to create content that would support the delivery of key messages on social media. Our project team created 11 high impact infographics describing some of the most significant issues covered by the report — they served as a first point of contact for the broadest possible audience, driving readers to main report and other collateral materials.

Engage. Inform. Motivate. Communicate with impact.
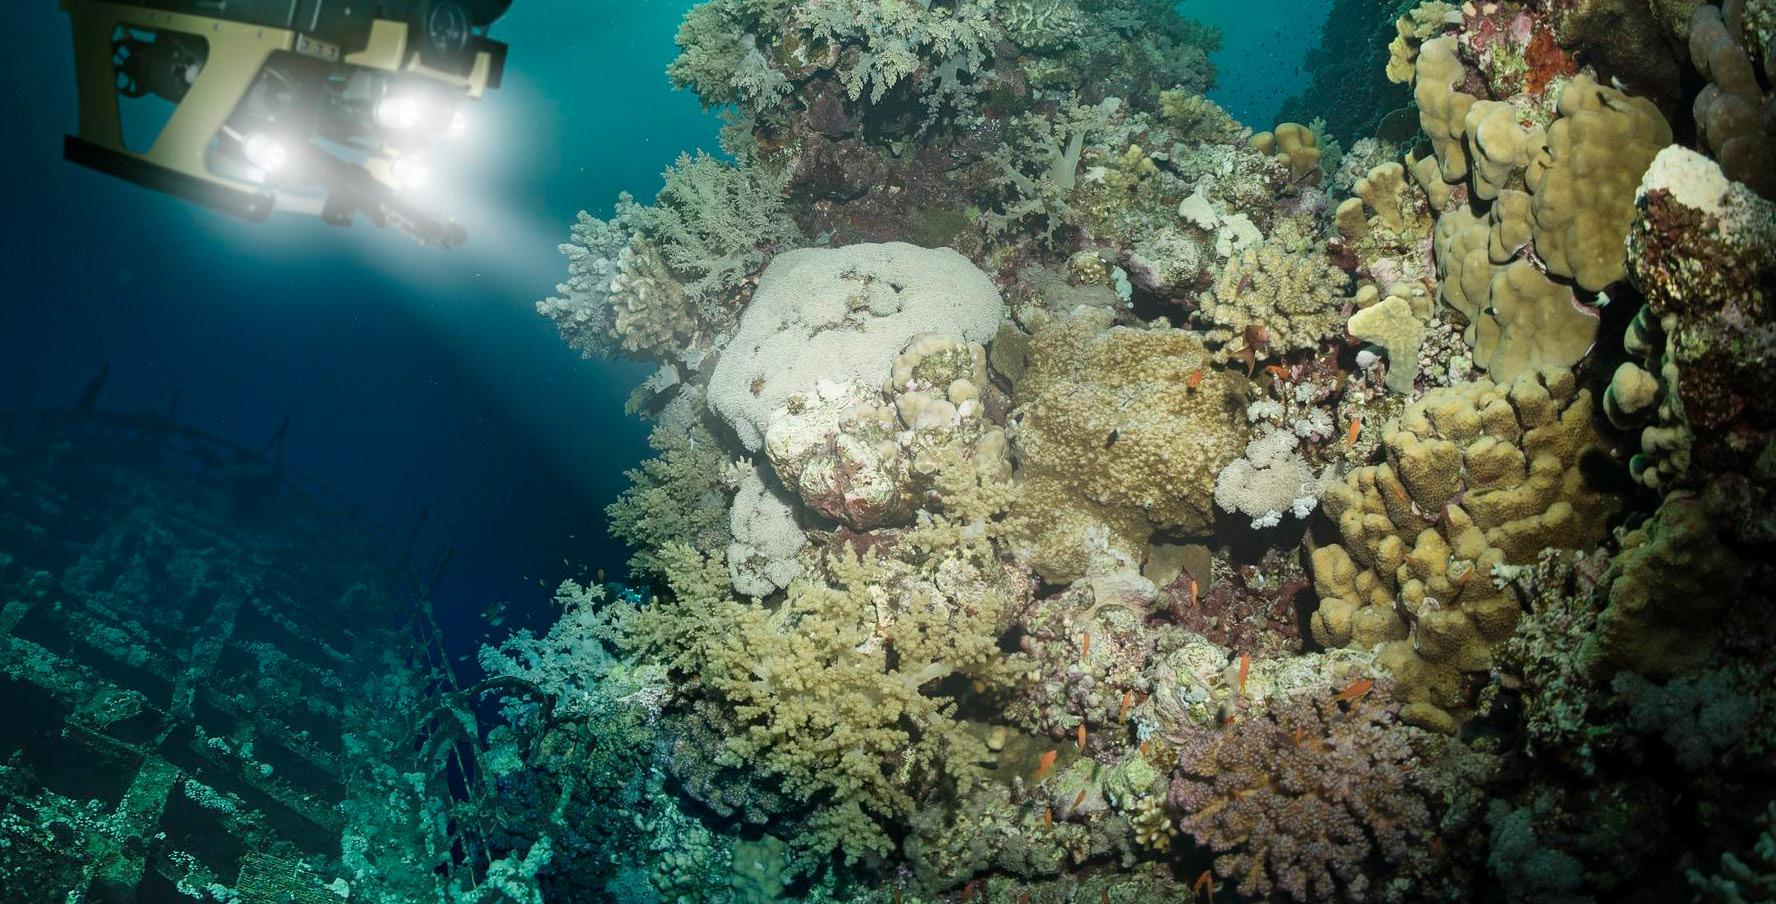
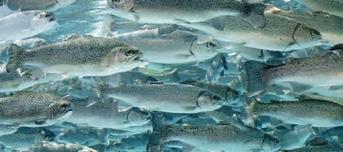
Climate Change
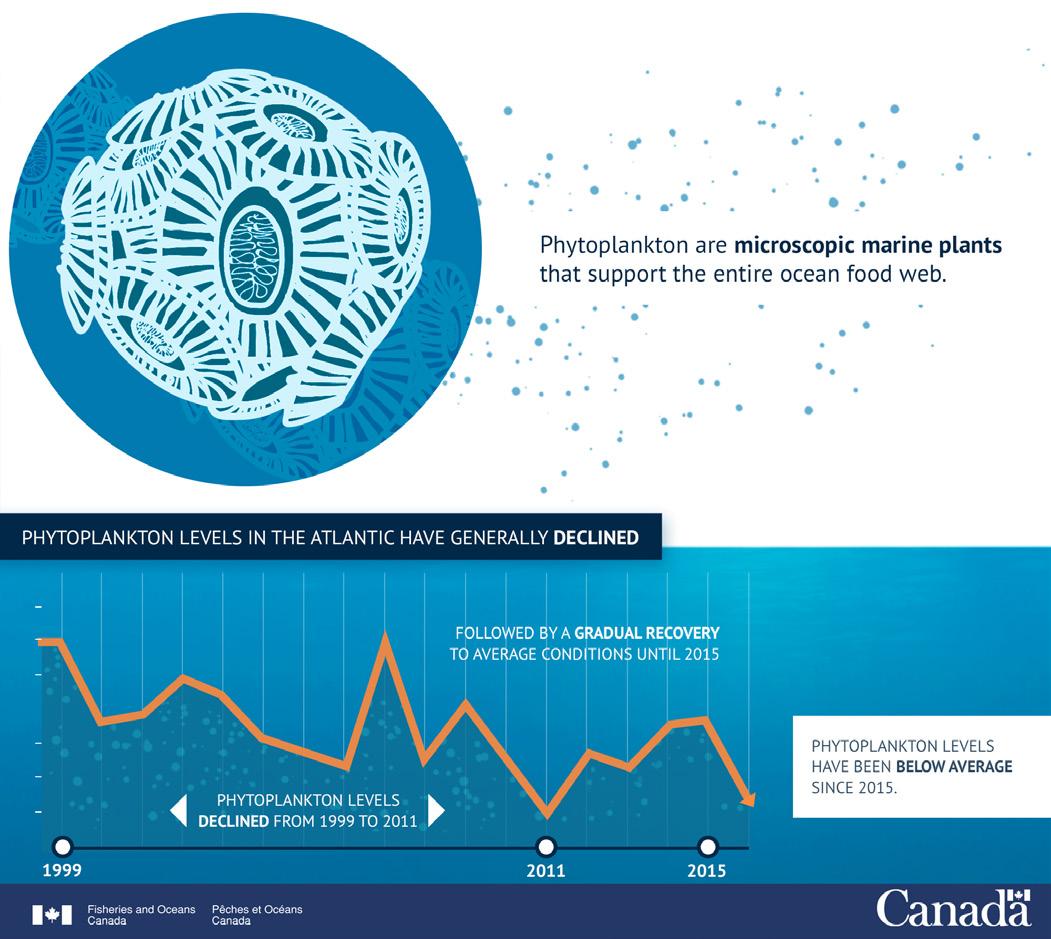
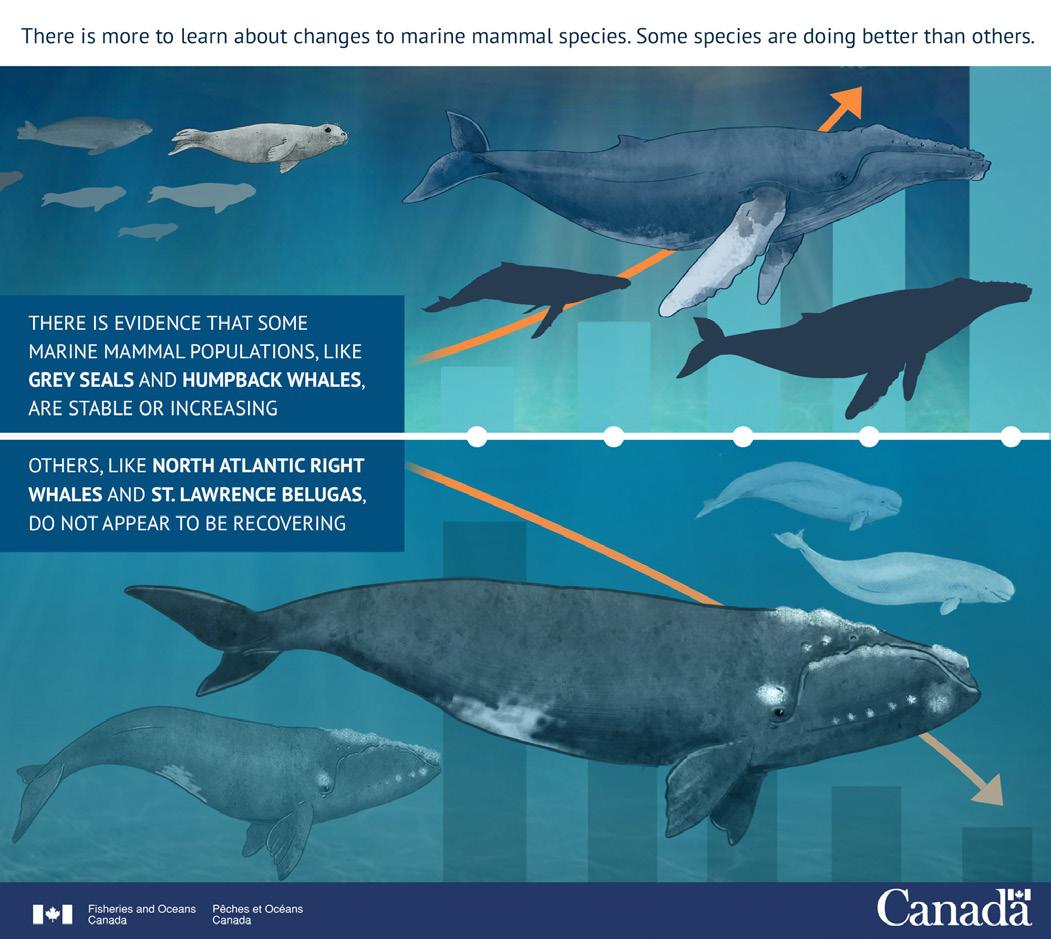
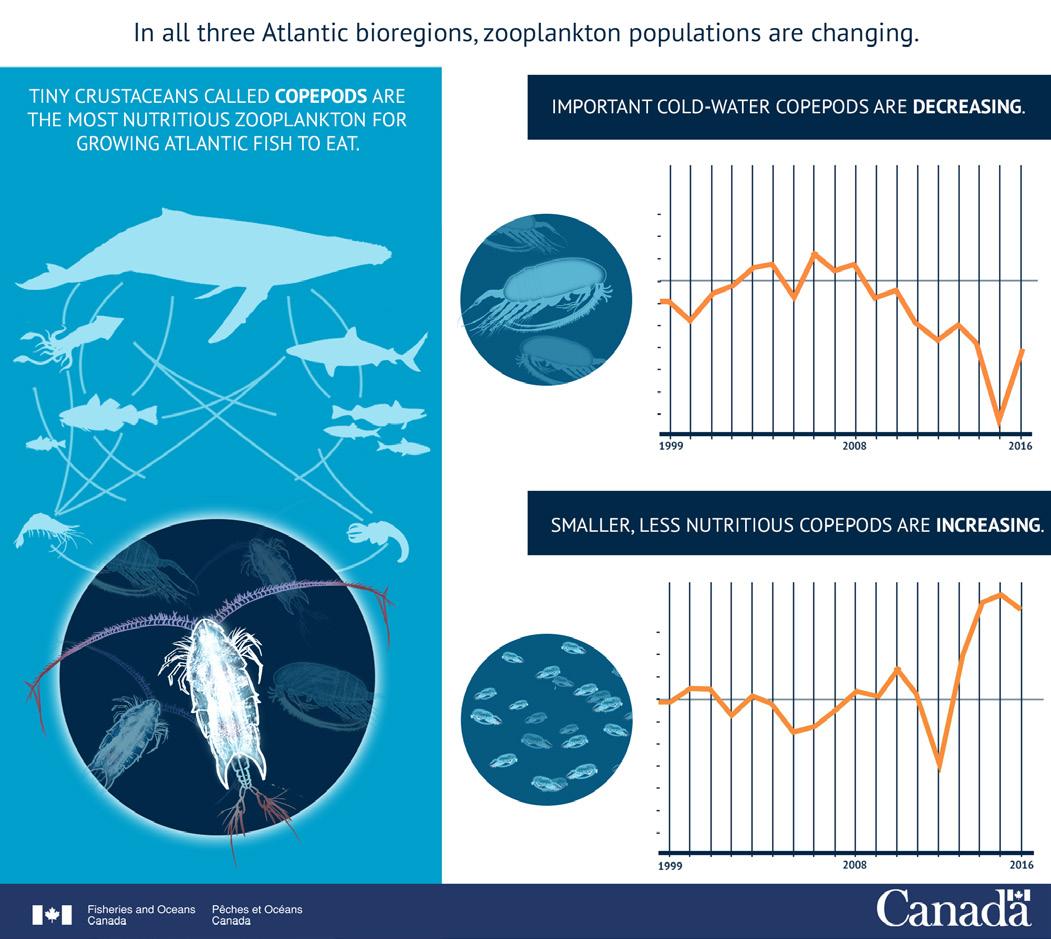
Focused on changes to the Atlantic Ocean that are being driven by climate change, the often complex information required illustrations that were not only accurate in their depictions of the subject matter, but also helped convey key messages to a general audience.
Our ability to create effective, accurate, and beautiful depictions of the subject matter, coupled with the capacity of our team to work quickly, while producing high quality work, led to a high impact series of infographics. Ongoing interactions with scientists and members of the project team formed a system to validate the accuracy of the information and intent of their messages.
We worked with scientific representatives to understand the key messages they wanted to tell. Why was this data collected? Why is it important to do so? What does the analysis say? Why is it important to Canadians? We then developed concepts that were reviewed by our client to ensure the right look and feel was achieved. We checked in with technical experts to ensure that the images were represented in a technically accurate way throughout the process. Illustrations were chosen over a traditional graphic design approach to provide the report with a warmer, more emotional overtone, and mirroring memorable scenery found in storybooks.
Engage. Inform. Motivate. Communicate with impact.
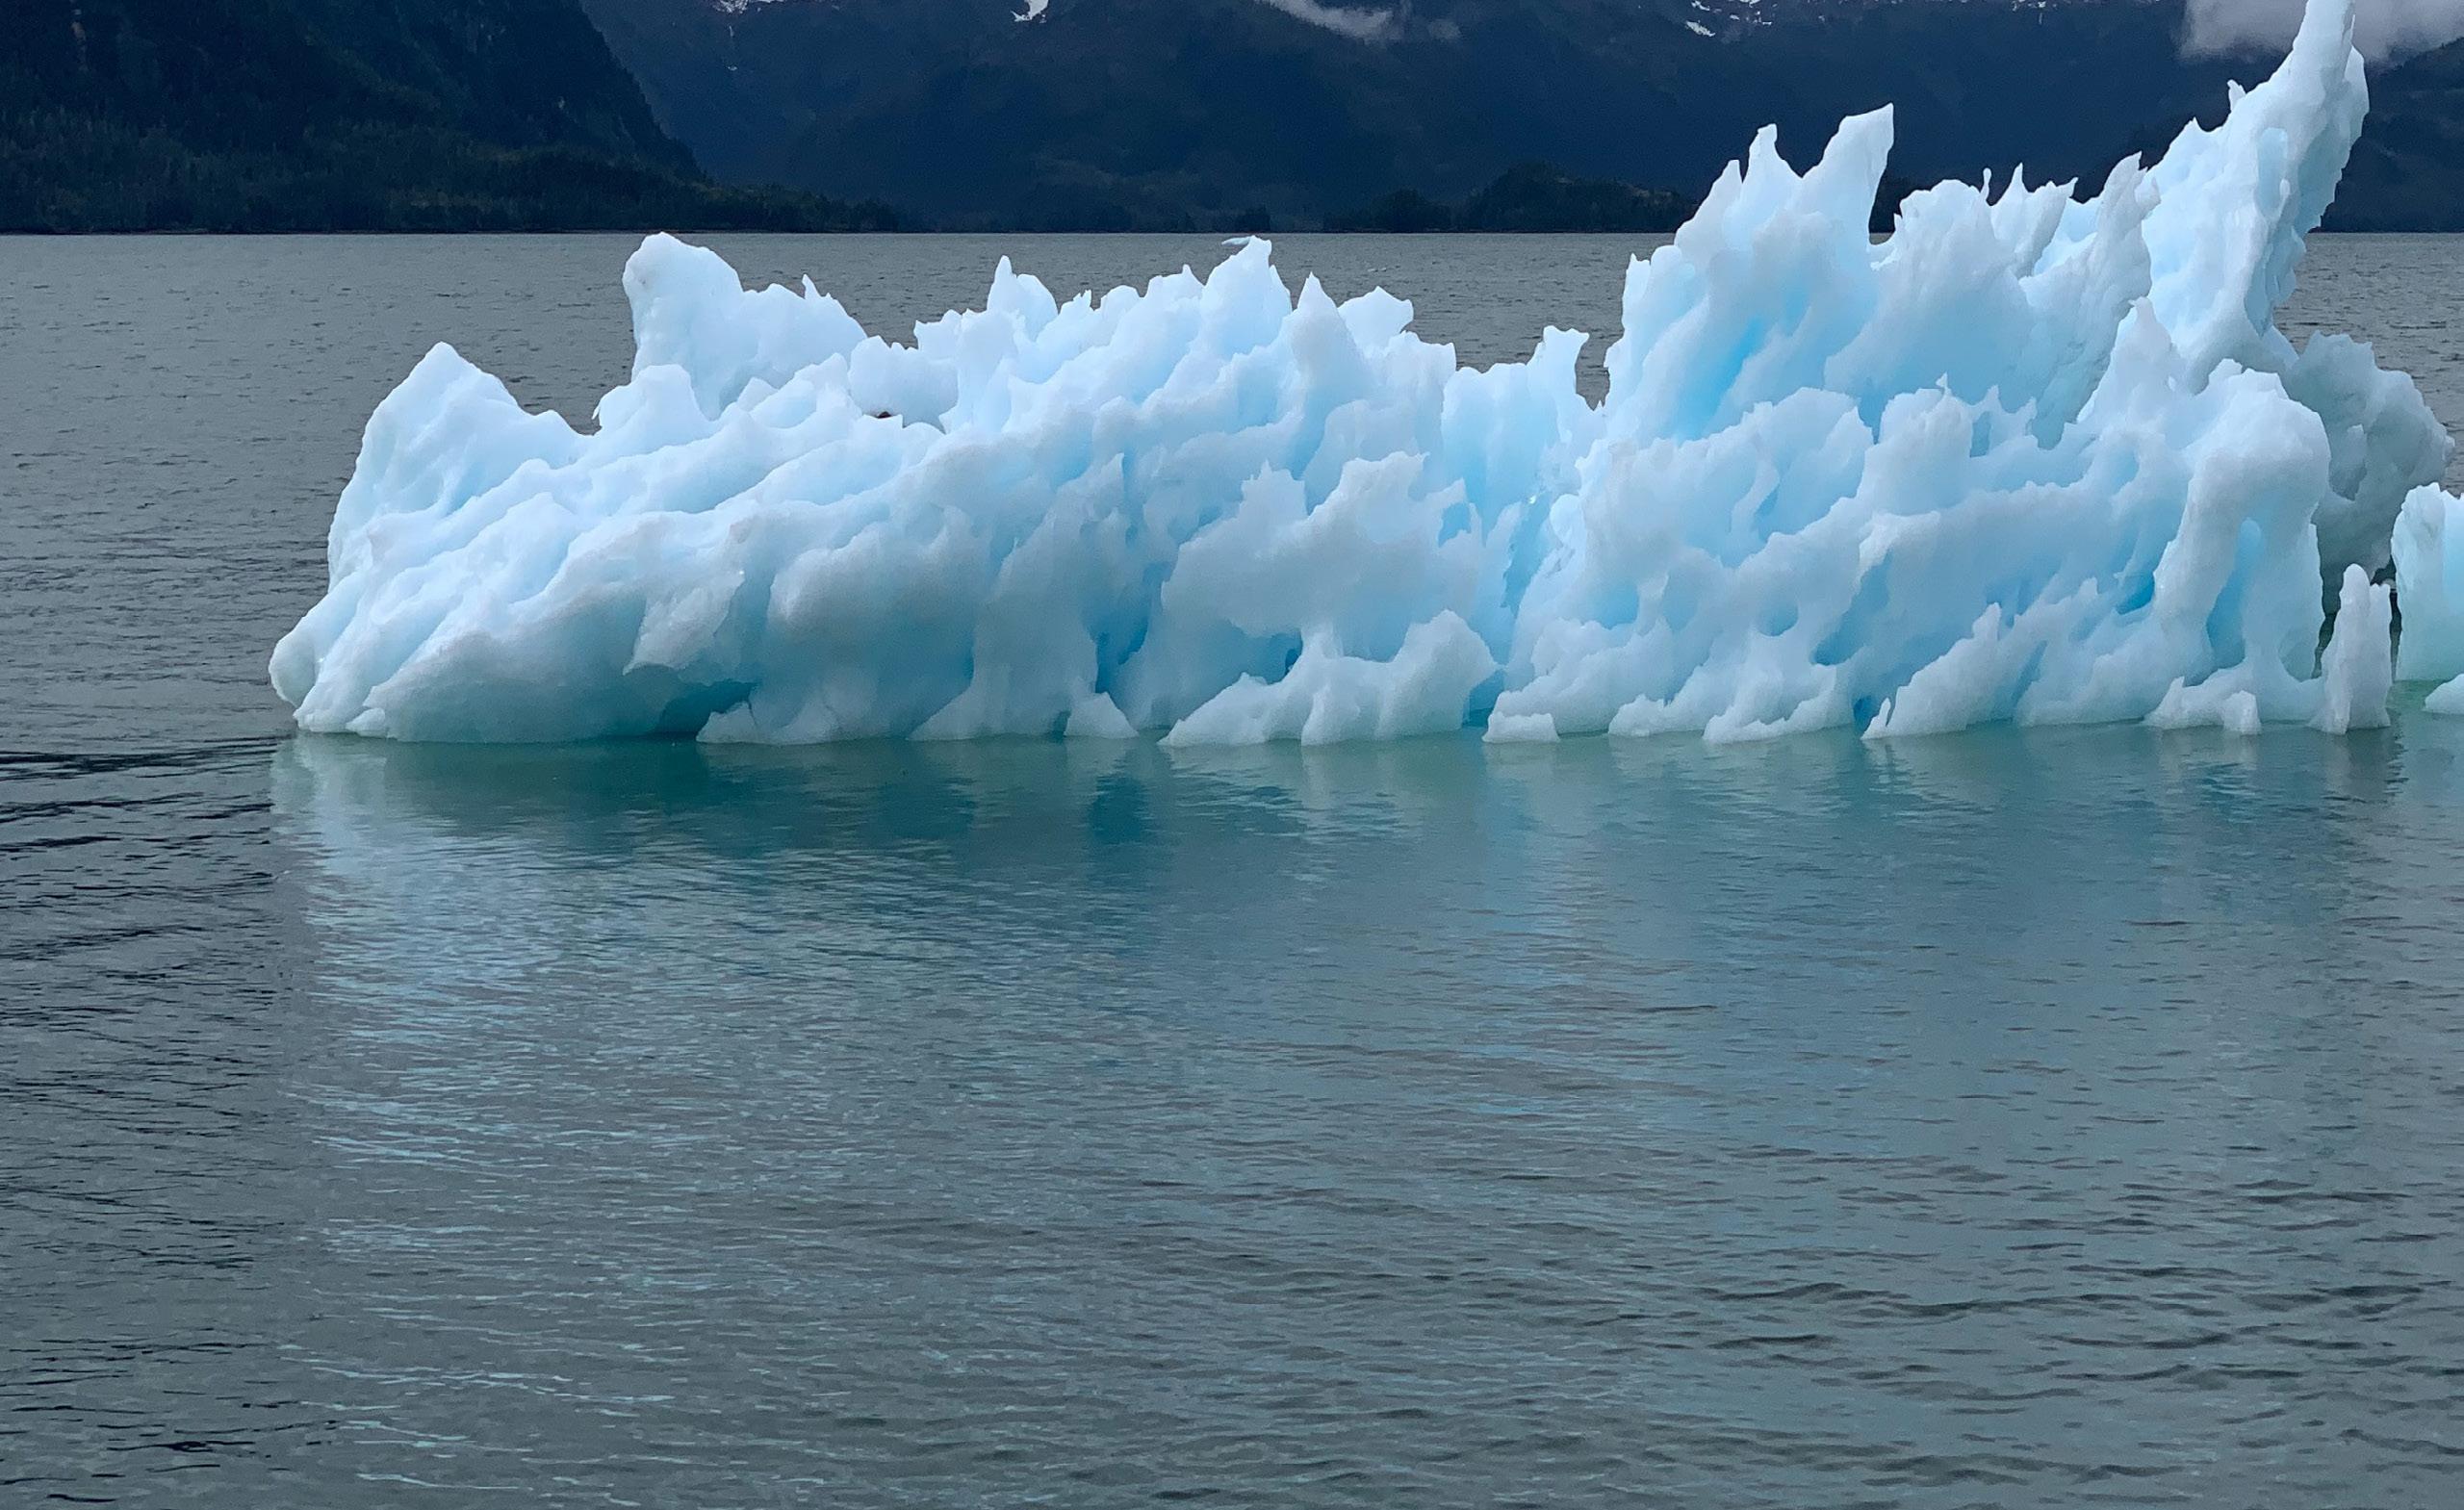
Climate Change
like “how is the loss of sea ice affecting whales?” or “how are temperature changes affecting populations of phytoplankton?” We sketched out the infographics to tell these stories in a progressive manner, had our concepts approved to ensure that they would be technically accurate, and then implemented the concept. In this case, the art that was used in the infographics was developed by hand using a drawing tablet.
To develop these illustrations, we worked with the scientists and experts to understand exactly what they wanted to depict, and then came up with strategies that would make it both visually appealing as well as focus attention on the key messages and emotionally engaging the audience.
Before any creative work commenced, we developed a project plan/schedule to map out all tasks and milestones, as well as interactions with all project participants Our very collaborative relationship with the client at both the communications and technical levels was a key to the success of the project. There were initial in-person meetings to help develop the right kind of working relationship. We had regular meetings as the project progressed to obtain feedback, provide updates on progress, and solve any issues that arose.
Obstacles included difficulty getting access to the scientists and technical experts because of their busy schedules. However, we worked with them and DFO communications colleagues to implement a process that would be convenient for them while allowing us to meet our scheduled deadlines. We developed a very good rapport with them to facilitate this process, to maximize efficiency, and to make the process as effective as possible.
The work is regarded It received widespread mainstream media attention (including the CBC) as well as engagement on DFO’s social media channels. It has been described as providing a very clear picture of the state of the Atlantic Ocean that is easily accessible to a broad range of Canadians as well as being visually stunning. The infographics continue to be used to support DFO messaging.
Fisheries and Oceans Canada is monitoring direct and indirect feedback received from the public, communities, and other levels of government. There has also been great feedback obtained via social media. The government website, on which these materials are posted, is also a significant source of feedback. As a firm, we are also monitoring the success of the work, and have received positive feedback from interactions at meetings, conferences, via social media, and requests for similar work based on this example.
Engage. Inform. Motivate. Communicate with impact.
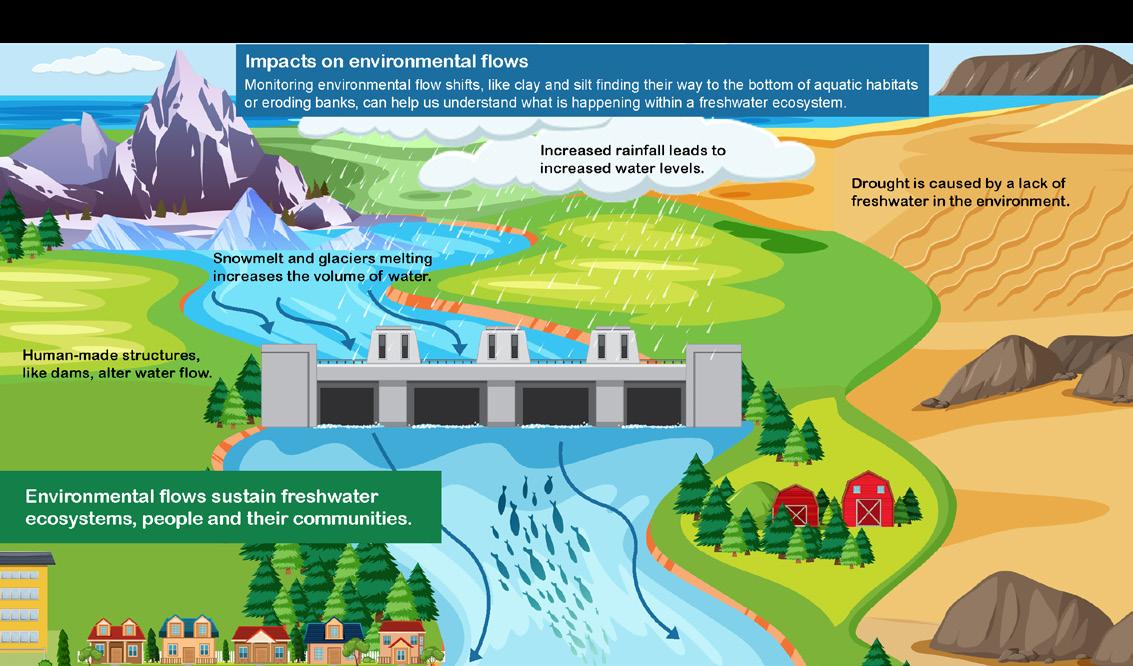
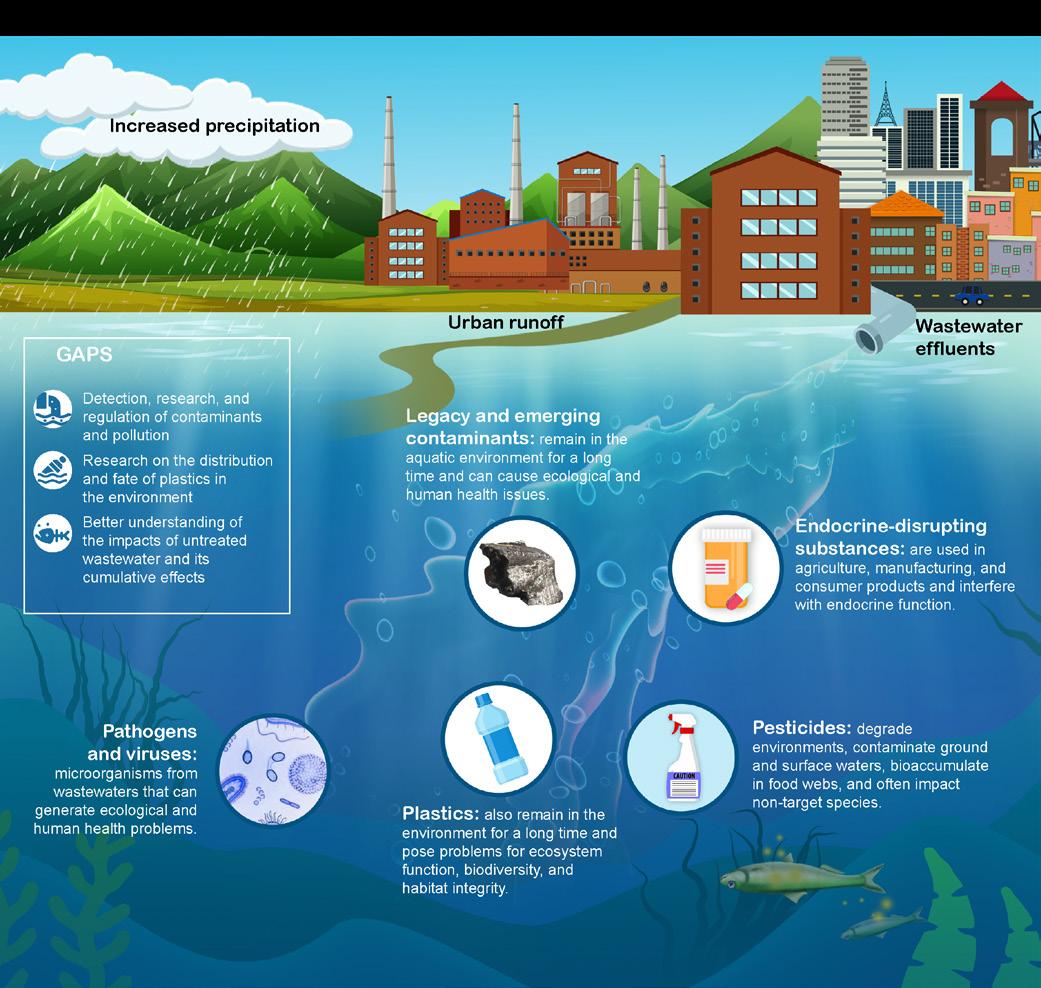
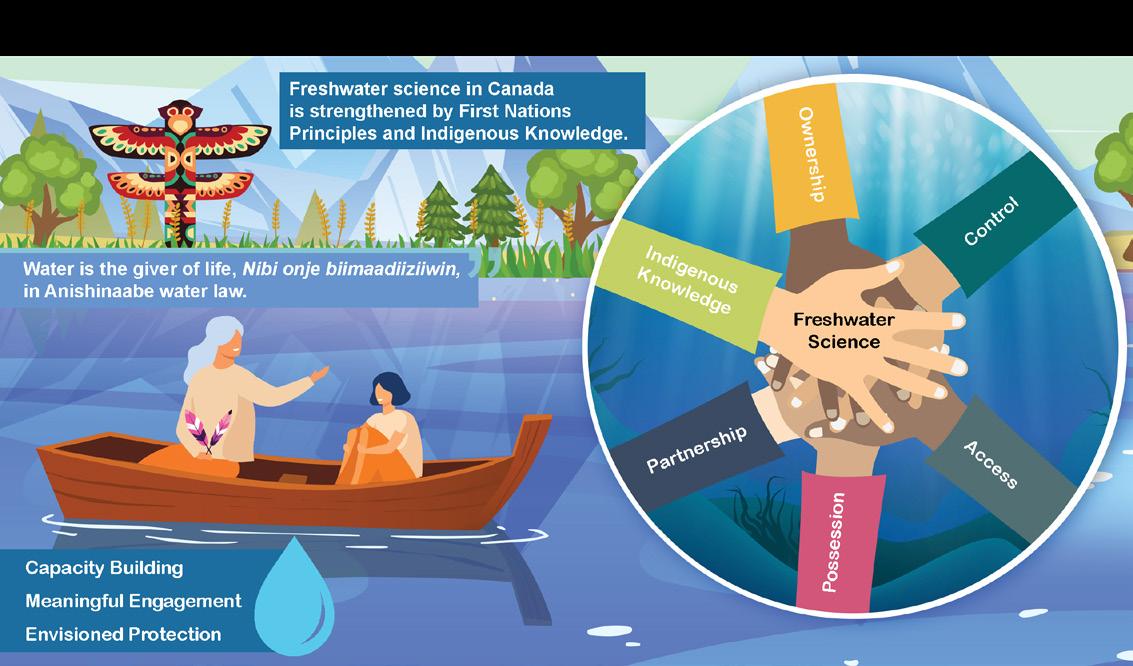
Freshwater Science

PROJECT TITLE:
Plain Language Summaries and Infographics for Canada Water Agency Science Themes
In early 2021, NIVA facilitated engagement workshops to gather input on freshwater science needs to support the new Canada Water Agency.
We were asked to develop plain language summaries (and accompanying infographics) for each of these themes to insert within the report’s Executive Summary for Decision Makers and Science Users to provide them an easy-to-grasp overview of the freshwater science work along with an engaging and informative visualization of related concepts. These plain language summaries (and infographics) were also to be repurposed in other communication products that will be more public-facing, and so they were developed with a broader audience in mind. The challenge was to simplify this very scientific and technical information for the ‘average person’ to understand without losing the technical integrity of the information and sufficient relevant details for decision makers and scientists to act upon.
CLIENT ORGANIZATION:
Environment and Climate Change Canada
Engage. Inform. Motivate. Communicate with impact.
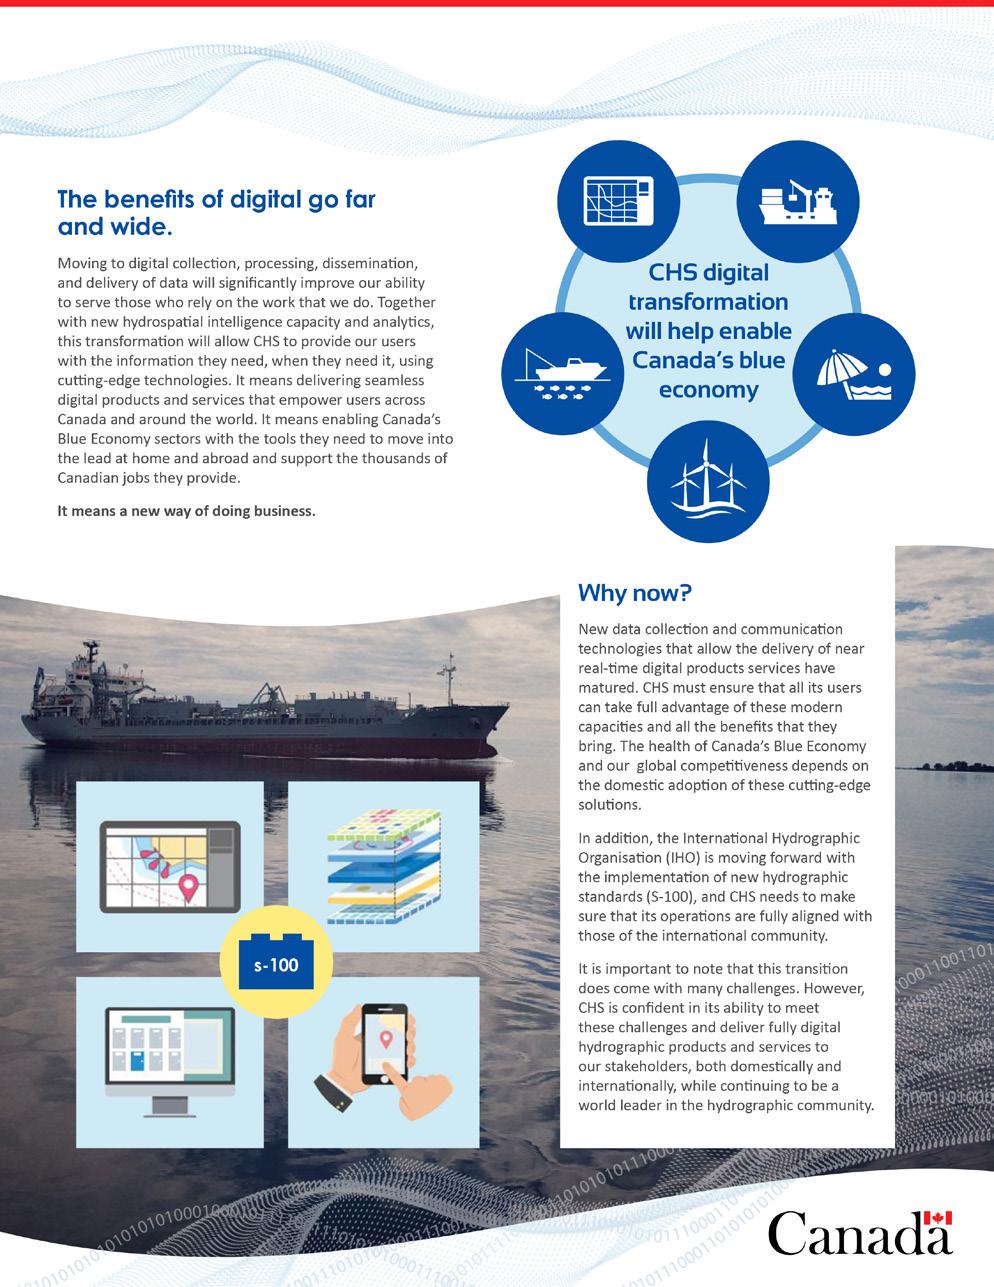
Blue Economy

PROJECT TITLE: CLIENT ORGANIZATION:
Communication Strategy, Stakeholder Engagement, and Supporting Materials for the Digital Transformation Initiative
The Canadian Hydrographic Service (CHS) provides up-todate, authoritative, standardized geospatial information, in part to produce and deliver nautical charts.
CHS operations support maritime transportation, bolster Canadian maritime boundaries and sovereignty, monitor coastal natural hazards, and use the latest technology for ocean and freshwater mapping. CHS publication products include Canadian tide and current tables, Sailing Directions, Notices to Mariners, critical information for ice navigation, and Canadian aids to the navigation system, among many others.
To remain a relevant and efficient organization, and to support its vision to be a world-class authority and supplier of geospatial information, CHS is modernizing its approach to service delivery to meet the rapidly evolving needs of its end users and other stakeholders. This will entail a transformation that moves CHS away from an organization based on paper products to a fully digital enterprise. This digital renewal will provide CHS with the capacity to deploy a data-centric service model and cutting-edge digital outputs that align with the demands of current and future users who want and deserve to have access to the most advanced navigational technologies available.
Canadian Hydrographic Service
NIVA created and implemented a comprehensive engagement and consultation plan that encouraged and motivated both external and internal stakeholders to become actively involved in the digital transformation process, share insights and perspectives, and directly participate in associated projects. We developed a change management-focused communication strategy to obtain buy-in and promote the CHS digital transformation, both externally and internally, including recommendations for effective tools and implementation tactics.
Our team also produced numerous communication materials and other tools as recommended in the communication plan, including targeted key messages, digital and social media content, fact sheets, presentations, and a suite of customized graphic assets for engaging CHS stakeholders about their digital transformation with a cohesive visual identity.
Engage. Inform. Motivate. Communicate with impact.
Marine Transportation
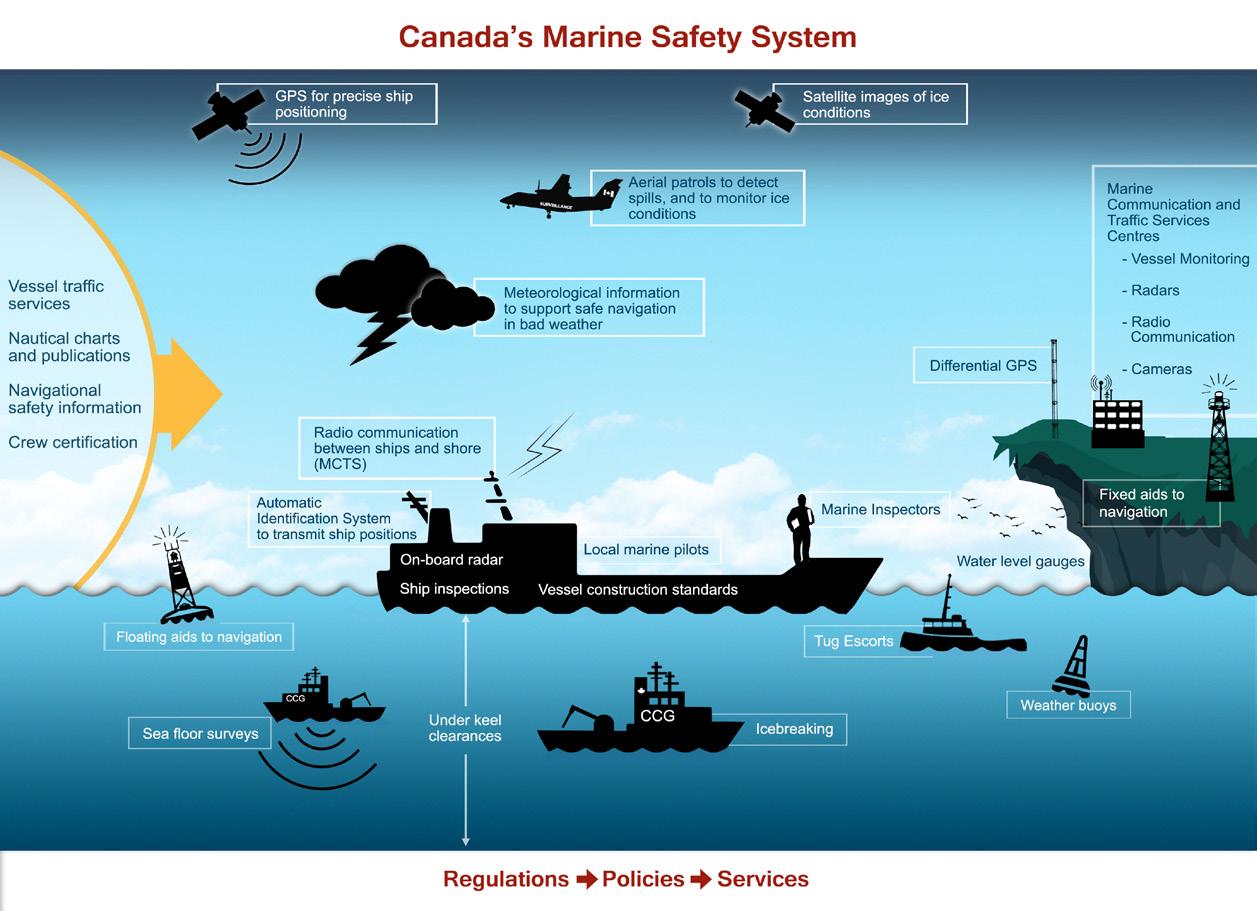
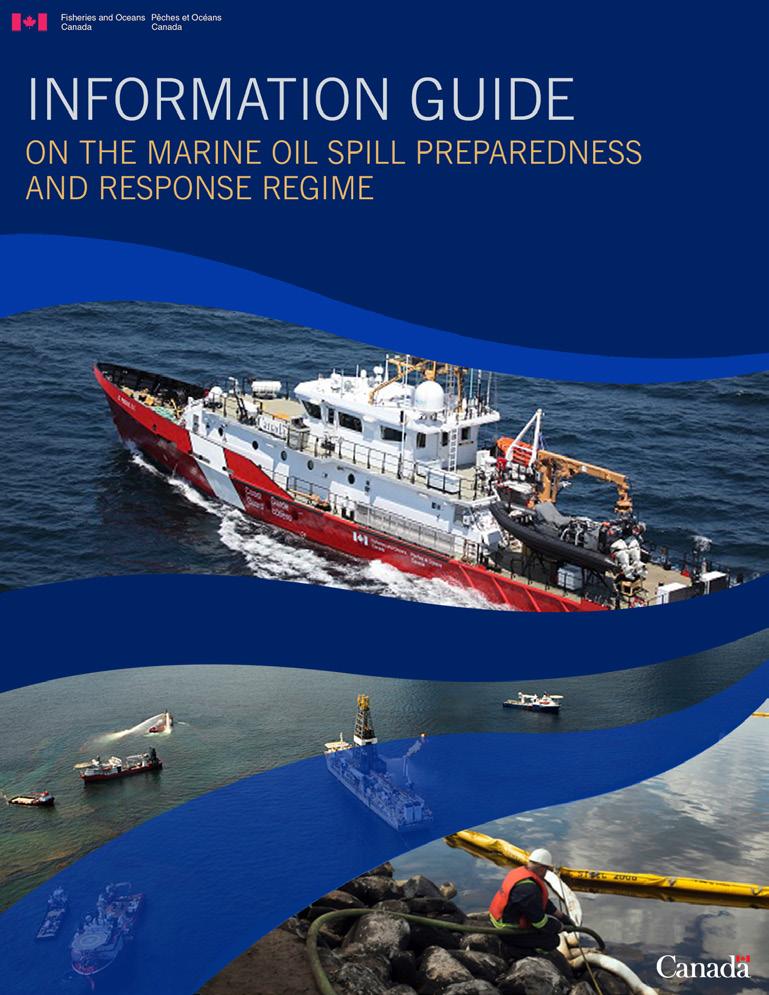
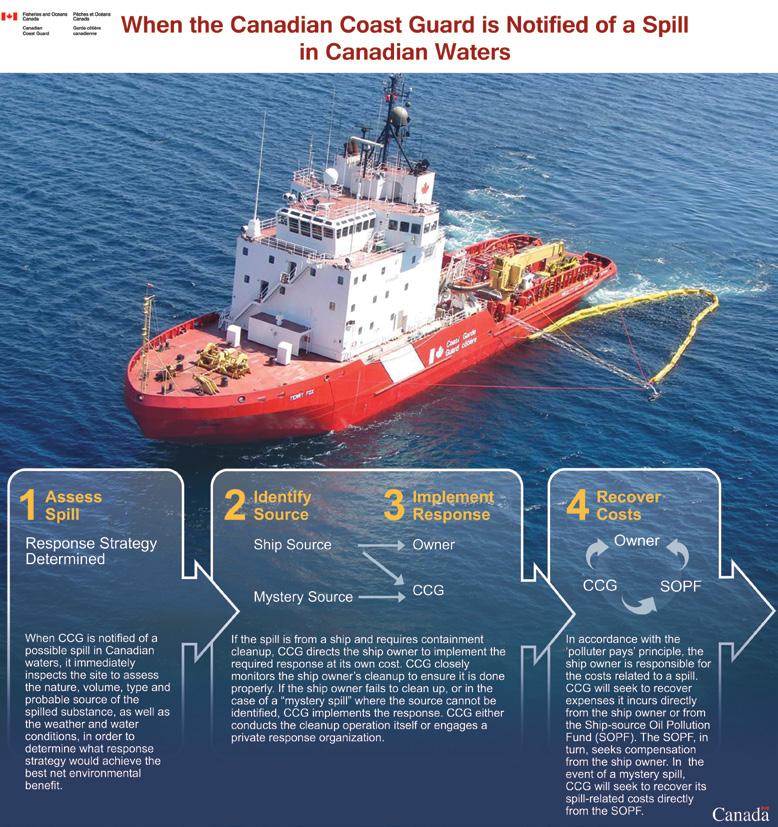
Information Guide on Marine Oil Spill Preparedness and Response
NIVA was contracted to develop an information guide to help the Canadian Coast Guard explain Canada’s ship-source oil spill preparedness and response regime. The goal was to build confidence among affected populations that the Government of Canada is committed to protecting Canadian waters and communities from these incidents and has the capacity to respond effectively.
The guide was developed using plain language principles and was targeted at people living in the coastal and Indigenous communities most affected by marine traffic, as well as other marine stakeholders.
We also produced a series of Canadian Coast Guard Indigenous Bulletins, which provided information on key topics regarding marine and environmental safety. In addition, NIVA was asked to develop several infographics to help clearly communicate important information about the Canadian Coast Guard to a public audience through their social media channels.
Canadian Coast Guard
Engage. Inform. Motivate. Communicate with impact.
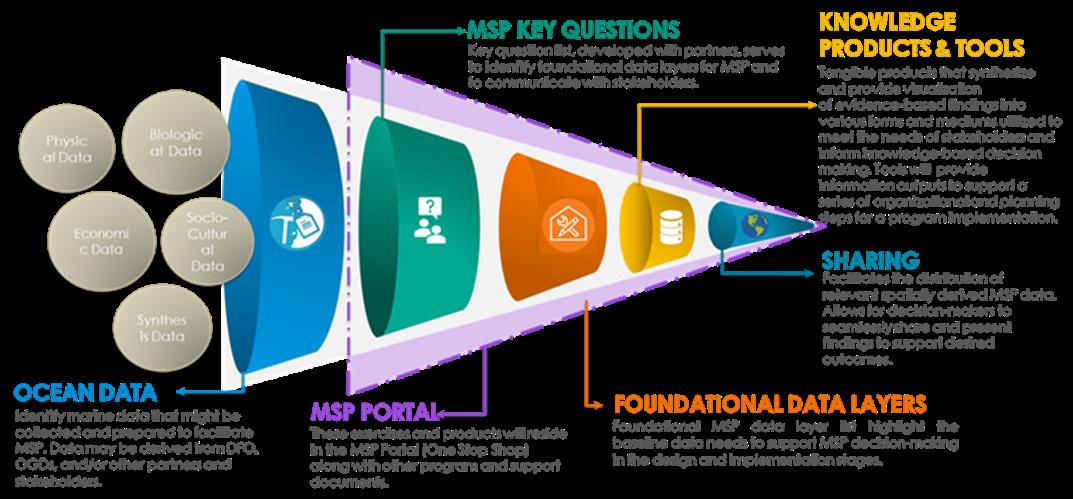
Marine Spatial Planning

approach to managing ocean spaces that helps to balance the increased demand for human activities with the need to protect marine ecosystems. By taking into account all activities and partners in an area, informed decisions can be made on how to manage ocean spaces transparently while minimizing conflicts, promoting synergies among its various uses, and protecting the environment.
In Canada, the Oceans Act provides a framework for current and future oceans management initiatives, including integrated management of ocean resources and activities. As a result, Fisheries and Oceans Canada leads the development and implementation of plans for the integrated management of all activities or measures in or affecting estuaries, coastal waters, and marine waters that form part of Canada, or in which Canada has sovereign rights under international law. NIVA was contracted to apply our expertise in effectively communicating key information on MSP by providing plain language writing for presentations, fact sheets and reports. This includes information on relevant program policies and the framework to implement MSP.
Tasks covered three main areas of focus:
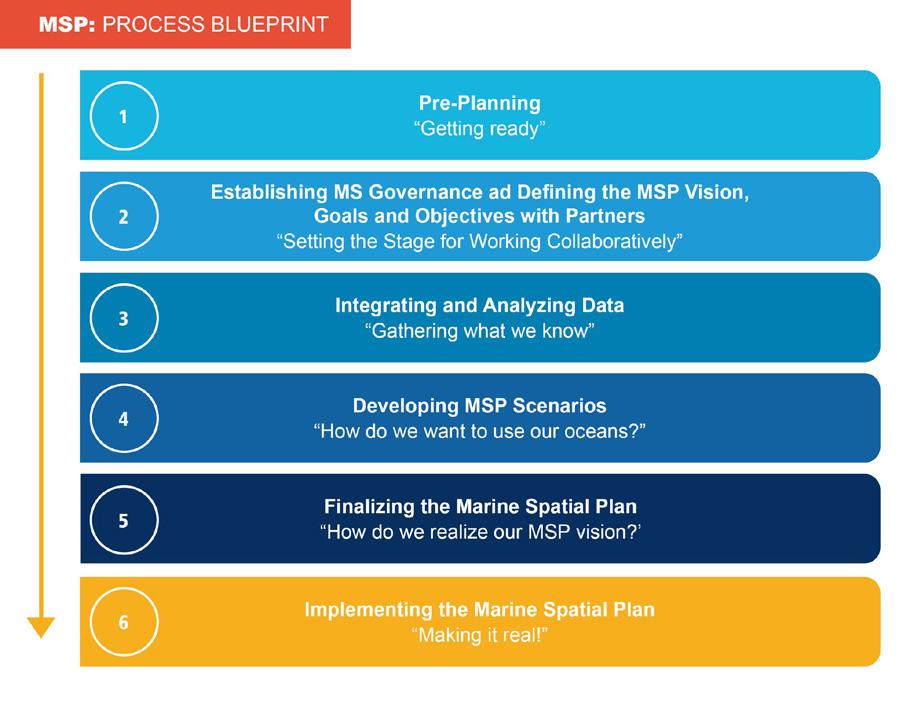
• MSP Operational Policy Framework—gathering information through meetings and review of information materials to first develop an annotated table of contents (i.e., content outline) for the framework, developing clear, plain language content for the framework through an iterative writing and review process, and presenting the draft document to regional MSP practitioners, managers, and directors for their input.
• National MSP Program Questions and Answers—editing the draft version of the questions and answers to produce a clear, plain language final product through an iterative editing/writing and review process, and presenting the revised questions and answers to several working groups/committees for input.
• Presentations and fact sheets—developing engaging presentations and fact sheets to support the roll out of other essential documents.
Our design staff was also engaged to develop compelling graphic components, charts, and maps to engage audiences that ranged from interested members of the public to ocean stakeholders to government policy-makers.
Engage. Inform. Motivate. Communicate with impact.
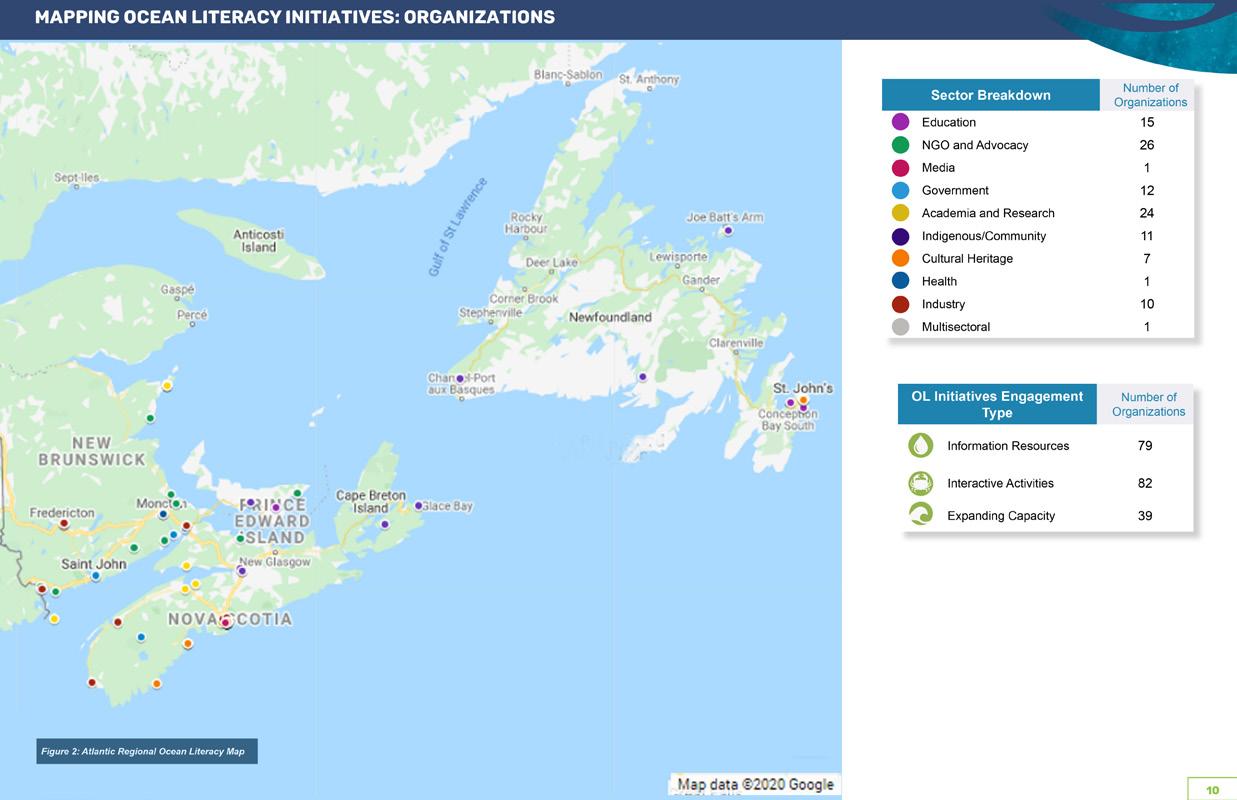
Ocean Literacy
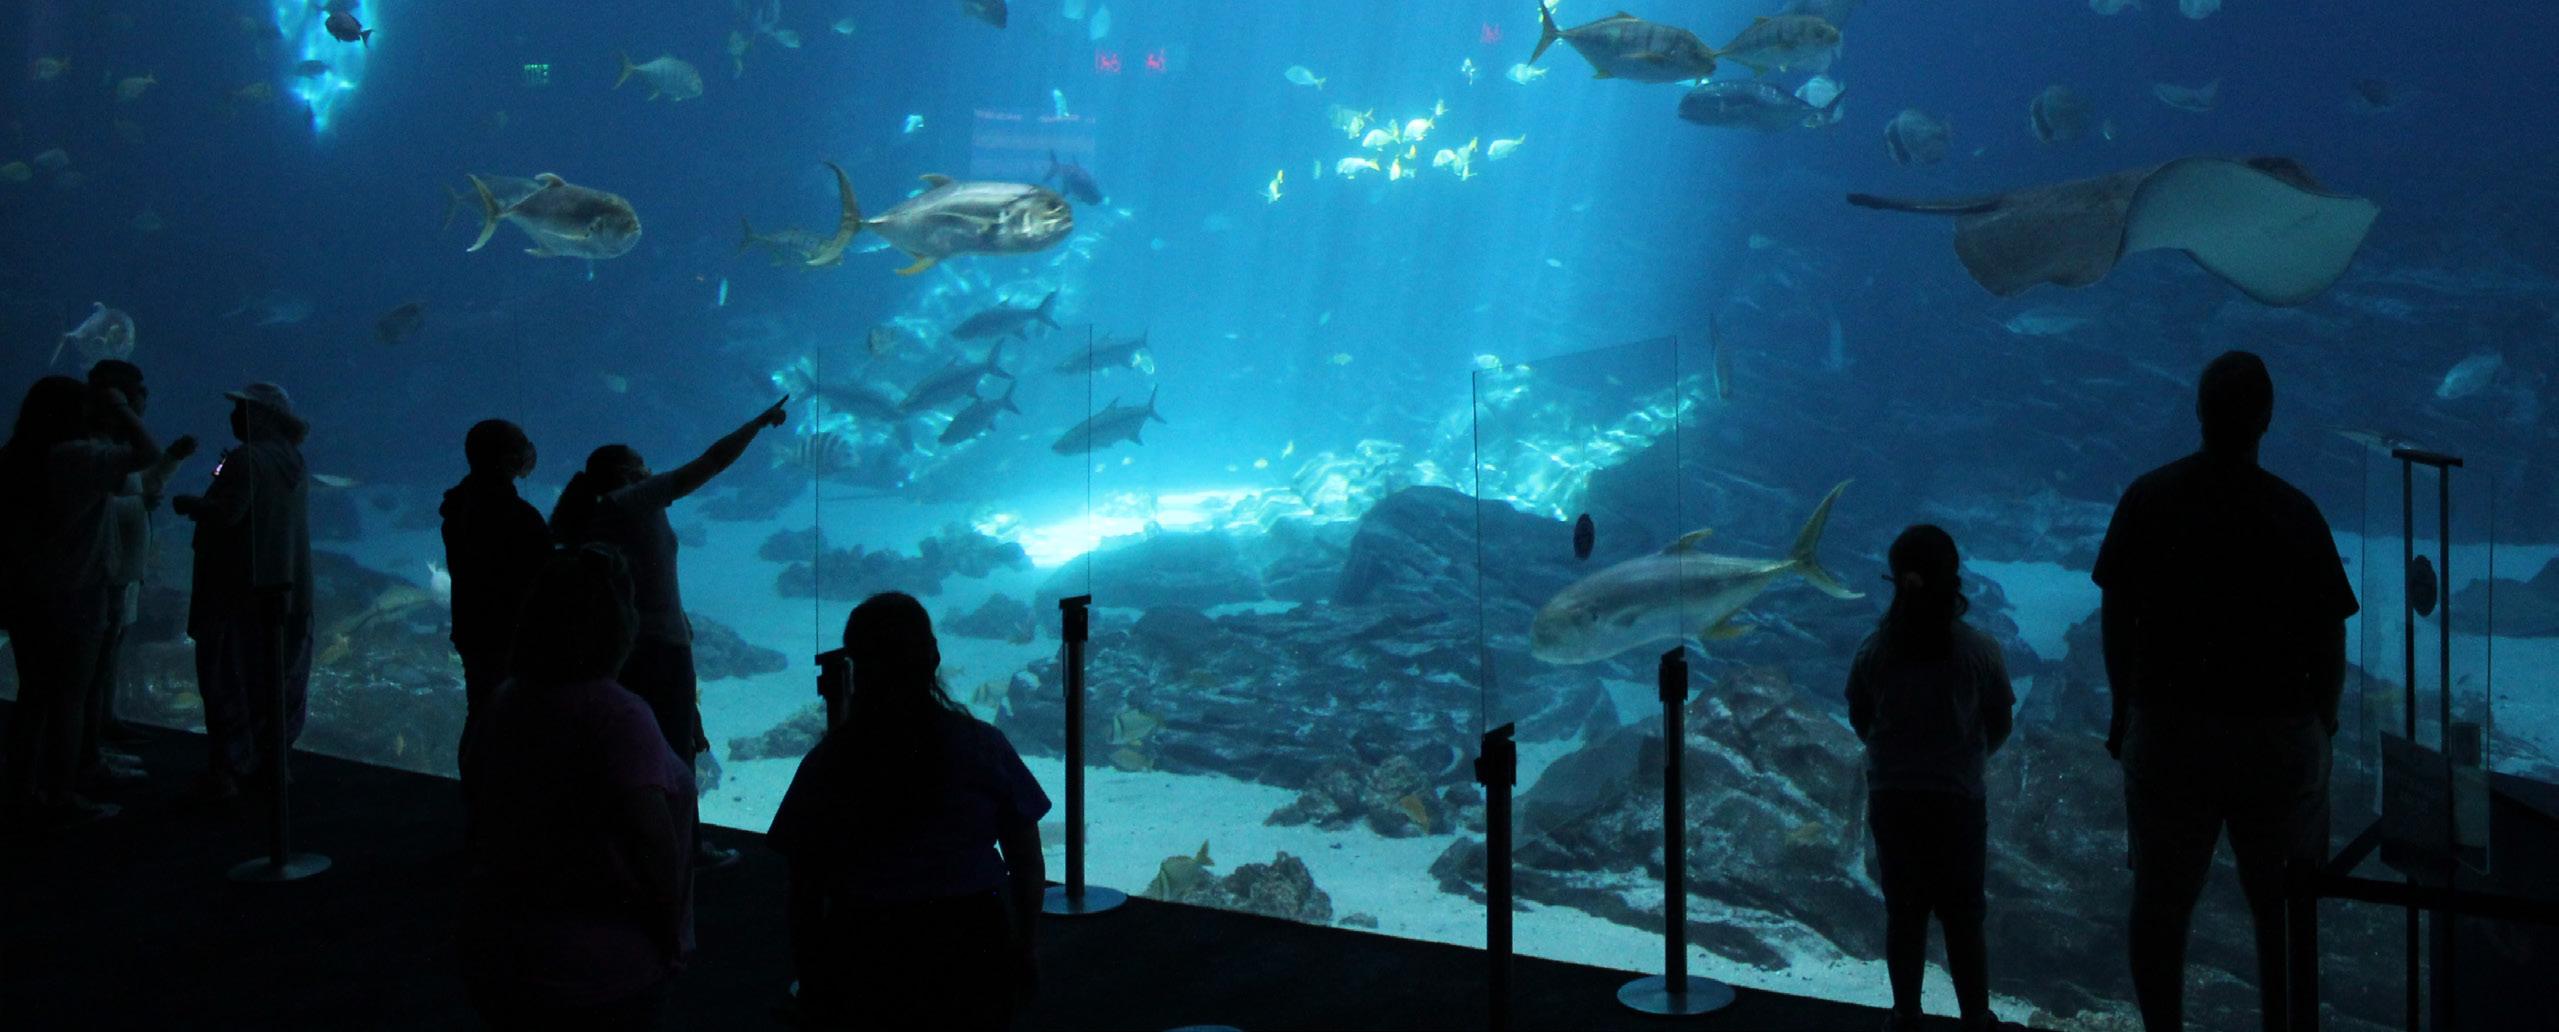
The Canadian Ocean Literacy Coalition (COLC) is an alliance of organizations, networks, institutions, and communities working together to better understand and advance ocean literacy in Canada.
As a member of COLC, NIVA was proud to provide communication support services to the organization with their recently released series of national and regional research reports on Understanding Ocean Literacy in Canada.
The NIVA team was responsible for writing plain language content for these reports and advising COLC on communicating complex ocean-related subject matter.
Our staff formatted this content into compelling documents aimed at engaging a broad audience with high-impact visual elements that highlight key concepts and further enable readers to understand complex information.
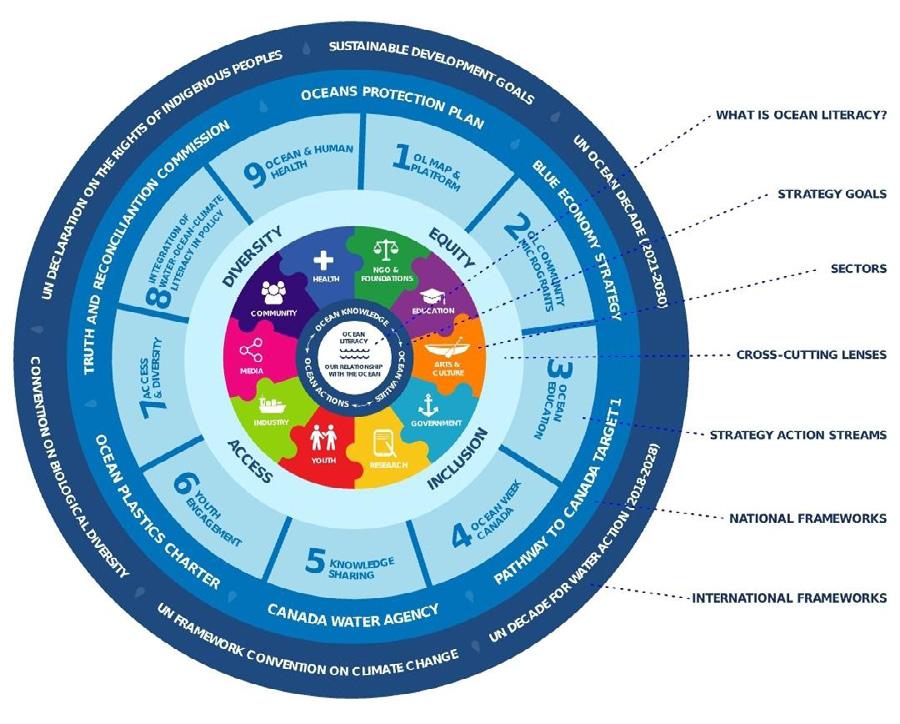
To help enable the national coordination of ocean literacy activities, NIVA created an engaging interactive online map and database where stakeholders can add their initiatives and learn about what other organizations are doing. We also created an interactive graphic to allow users to explore elements of the Canada Ocean Literacy Strategy.
Engage. Inform. Motivate. Communicate with impact.
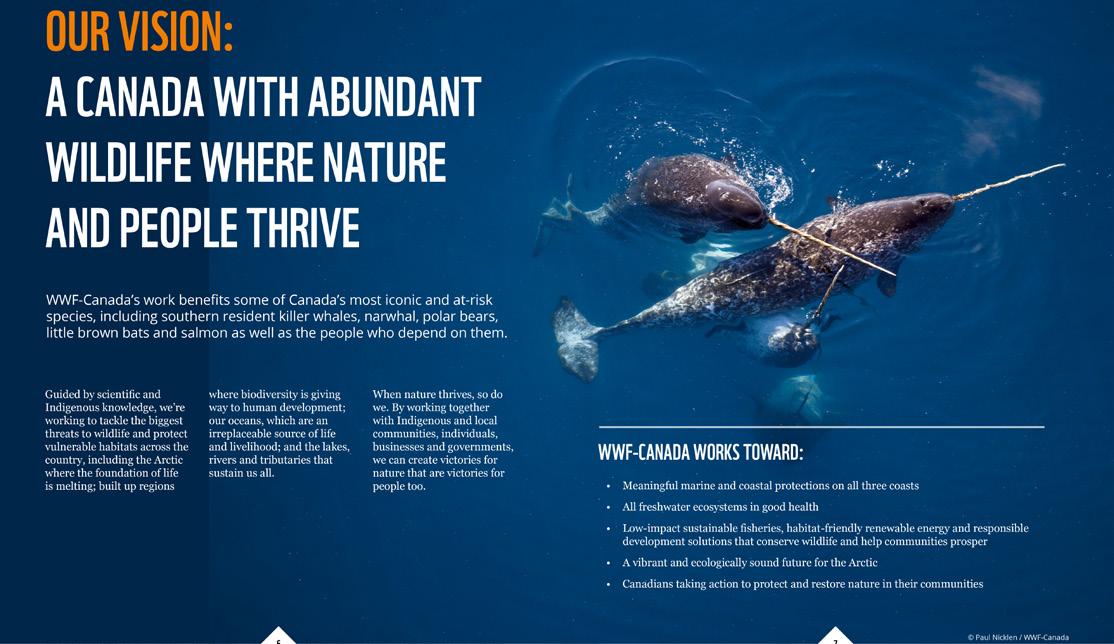
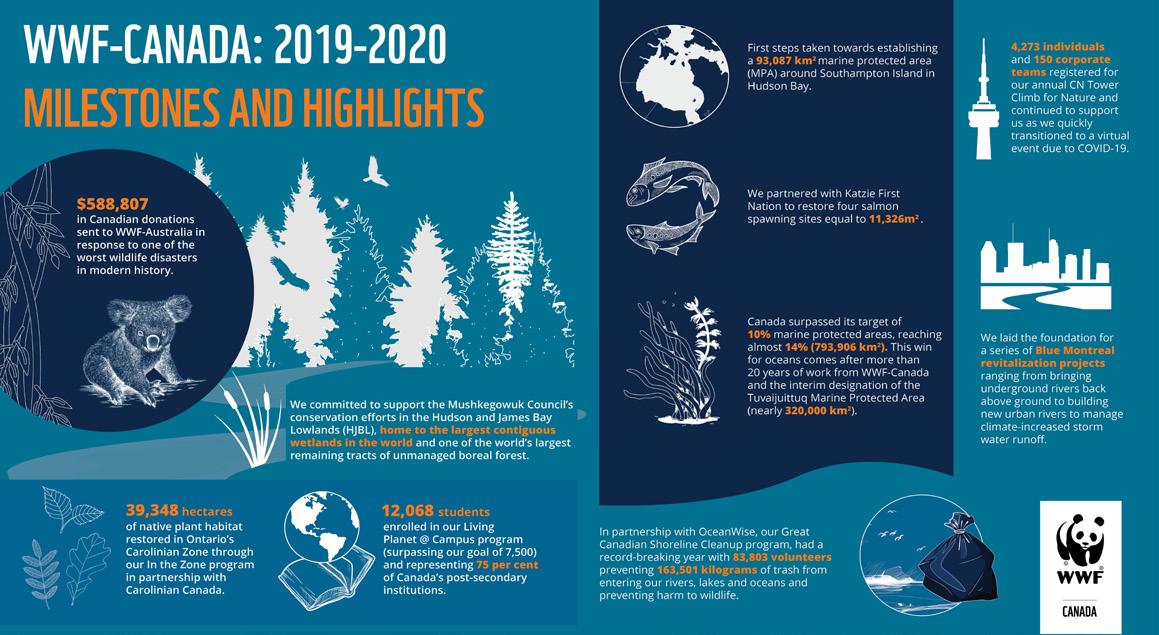
Conservation and Biodiversity
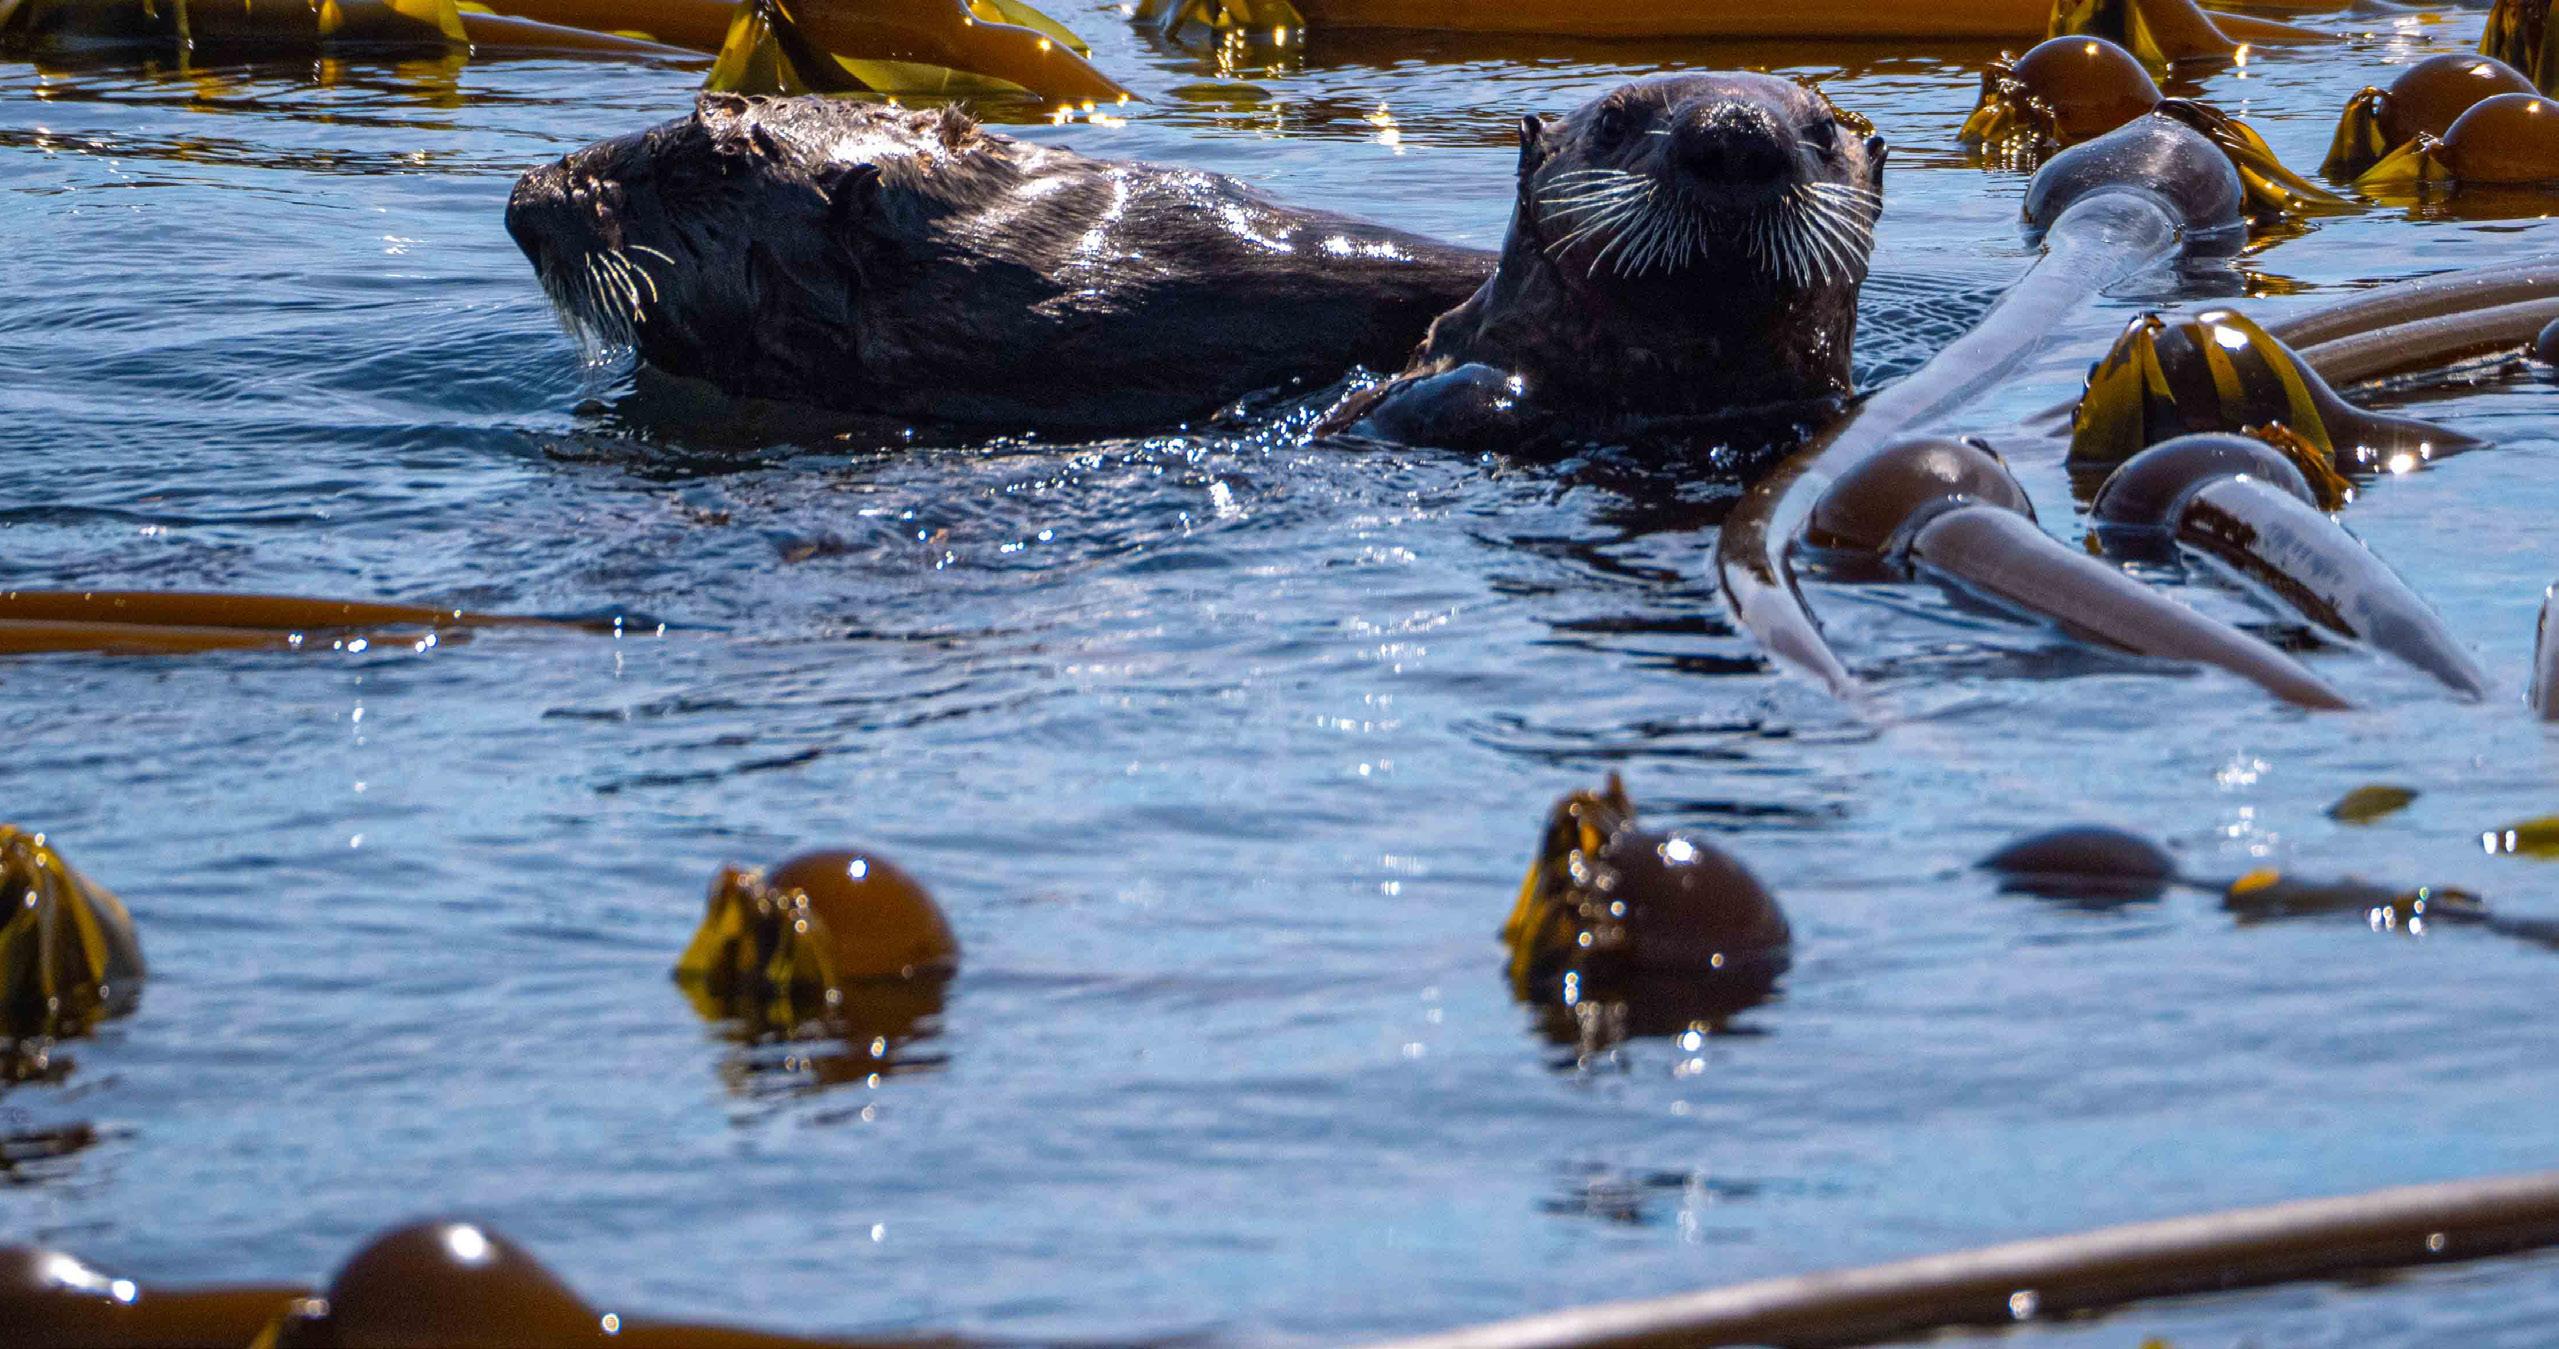
had been achieved over the past year, and about the major impacts obtained from the generous support they receive.
We were responsible for the full spectrum of requirements from the creation of design concepts, image sourcing, formatting, quality assurance, and file optimization.
Special attention was made with image selection to spotlight key species and habitats of concern across the country and the communities that depend on them, as well as making an emotional connection with the audience.
The project included the development of an infographic overview to help WWF-Canada highlight key outcomes and promote the report on their social media and other digital channels.
Engage. Inform. Motivate. Communicate with impact.
Protected Areas
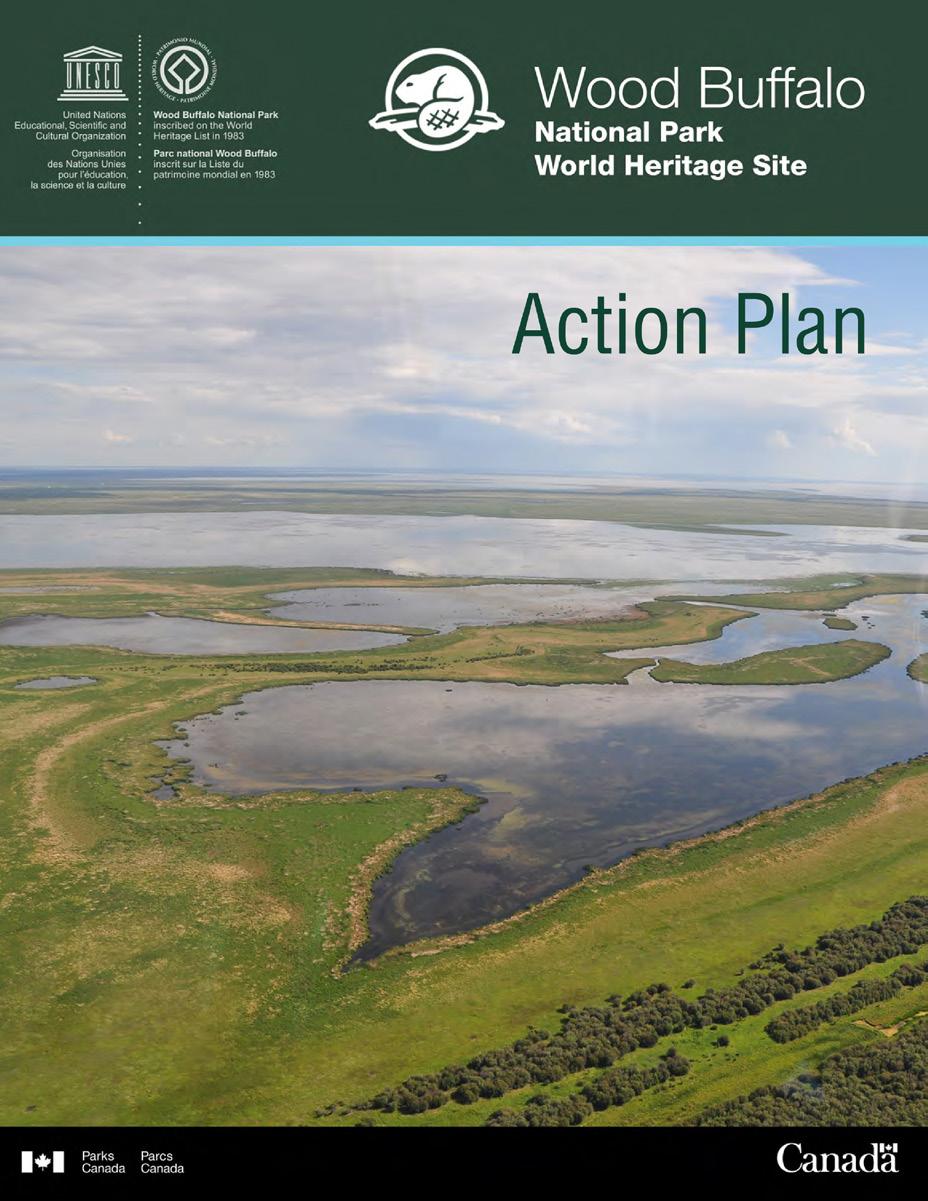
Wood Buffalo National Park World Heritage Site Action Plan Report
In response to a requirement from UNESCO, Parks Canada commissioned NIVA to assist with developing their Action Plan for the Wood Buffalo National Park World Heritage Site. The Action Plan report was developed to present information to UNESCO on how the park will be maintained, to support the international UNESCO meeting where the report was being presented. NIVA also designed a six-panel tri-fold brochure for participants that summarizes and complements the main document, making figures, tables and other technical content easy to read and understand.
For this project, the inclusion of Indigenous Knowledge was made a top priority to ensure that we fully integrated related information and design considerations. Also, due to the number of authors, we fully revised the text that was sourced with a view of communicating its contents in plain language and written from a single voice.
This very high project showcased Canada’s reputation as a leader in conservation and environmental protection. Our primary goal was to enable the Parks Canada to convey critical information to a wide audience in a clear, cohesive manner, using easily understandable content. Together with a clean design, this set the right tone for the context of related decision making.
Parks Canada
To complete this project, we copyedited, designed, and formatted the entire report and accompanying brochure, specifically:
• Performed technical editing of all scientific content to ensure accuracy and consistency.
• Shaped and synthesized content into plain language for a broad audience.
• Developed cover and document design concepts and overall graphic design.
• Produced a promotional brochure based on the approved design.
Given the high priority nature of this report, approvals for this project were required to be obtained at the senior management level. There was great sensitivity to image selection, and we managed several rounds of approval from different stakeholders.
Engage. Inform. Motivate. Communicate with impact.
Research Communication and Knowledge Mobilization

PROJECT TITLE:
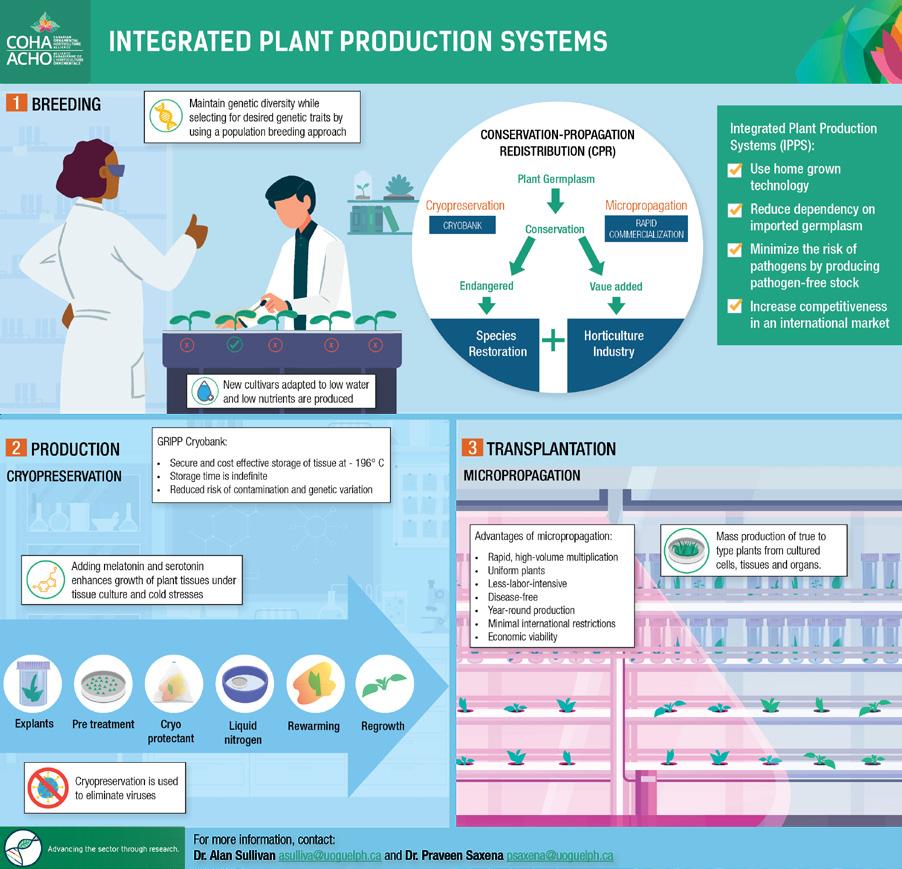
Communication of Results from COHA’s 3rd Research Cluster

Research Clusters AgriScience Program:
Summary Report
The Canadian Ornamental Horticulture Alliance (COHA) is a coalition of three industry organizations that represent the interests of Canada’s ornamental horticulture value chain. COHA identified the need for an external communication firm to help communicate the results of its research cluster activities and mobilize this knowledge toward meaningful actions.
To complete this project, NIVA’s Knowledge Impact and Design teams produced a knowledge mobilization strategy and an extensive set of communication materials to help them engage with their key target audiences (policymakers, growers, researchers, and the public).
This work included:
• New visual identifier logo and tagline to be applied to all research-related outputs.
• Plain language research summaries.
• Detailed fact sheets targeting grower audiences.
• High-impact infographics visualizing key research processes and findings.
• Full summary report synthesizing all research cluster communication materials.
CLIENT ORGANIZATION:
Canadian Ornamental Horticulture Alliance (COHA)


Engage. Inform. Motivate. Communicate with impact.

Plain Language Infographic Fact Sheets
Genome Canada is an independent, federally funded not-for-profit organization and a national leader for Canada’s genomics ecosystem. Working in partnership and across sectors, we invest in, and coordinate, genomics research, innovation, data and talent to generate solutions for today’s biggest challenges.
They came to us with highly-technical stakeholder consultation reports that required key information to be extracted and made accessible to non-specialist audiences. Senior decision makers and the public required information tools that presented this complex information in a clear and understandable manner.
NIVA was brought in to apply plain language principles and highimpact design to achieve these goals. This included developing a series of plain language fact sheets that showcase how genomics has been applied to each sector and the potential opportunities for future impact.


Canada
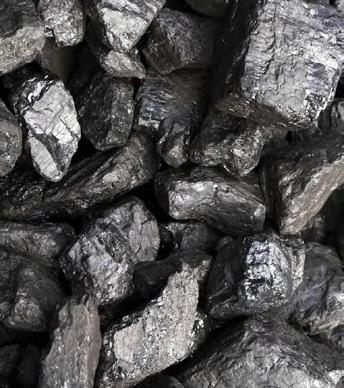
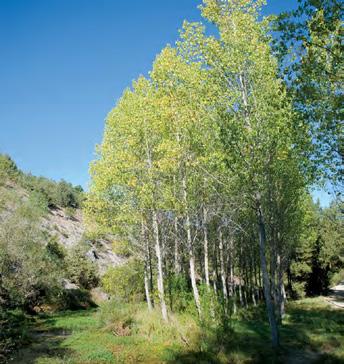
ORGANIZATION: Engage. Inform. Motivate. Communicate with impact. PROJECT TITLE: Genomics Genomics for fisheries and aquaculture Genomics is supporting a strong, competitive and sustainable fisheries and aquaculture sector in Canada. Fisheries and aquaculture: A sector of strategic importance to Canada* Figures from Canadian Fisheries & Aquaculture – How genomics 25% Proportion of the world’s coastline owned by Canada $14.7 billion aquaculture to the Canadian economy 130,000 1% 16% Projected increase global fish consumption (between 2011 and 2021), implying significant potential gains the Canadian economy he science that aims to decipher and understand the entire genetic information of an organism. Finding ways to increase production efficiency and product quality Ensuring production is sustainable, which includes maintaining healthy eco-systems. Providing afe products. Ecosystem sustainability. acceptance of genomics-based technologies. “Canada’s commitment to genomics-based research and development in priority areas…has helped to create a competitive, innovative environment in which to operate.” Keng Pee Ang, Vice-President, Research, Cooke Aquaculture Inc. challenG es facinG the fisheries and aquaculture sector today Genomics is helpin o: nhance production through selective breeding programs, optimizing fish diets and making mprove fish health management, understanding infectious diseases and parasites and the relationship between environmental stressors and fish health. rotect conservation and fish populations through better monitoring of wild fish migration, stocks as well as population health and species abundance. Maintain ecosystem integrity by supporting species survival and genetic variation, as well as the sustainability coastal and inland Why canada can lead in fisheries and quaculture G nomics: people, science and technology) make the country global leader fish and shellfish genomics. Canadian scientists conduct cutting-edge research on how genomics can be applied to traditional species (e.g., halibut, salmon) and Canadian advances provide the potential for low-cost biotechnology applications that are more sensitive, more accurate, faster, and more efficient. How we apply our genomics researc capacity to improving product quality, environmental conservation, and biodiversity protection gives us competitive advantage in the global market. Genomics Boosting the sector in many ways Canada’s Opportunity Canada can leverage genomics in the fisheries and aquaculture sector for more productive and competitive industry growth, while protecting wild stocks and ecosystems for the benefit of Canadians. Opportunities for the sector are detailed the recent strategy Aquaculture—How Genomics Can Address Sector Challenges www.genomecanada.ca/en/sectorstrategies b ildin on success aquaculture genomics to date have resulted in significant developments, including: marker-assisted selection to develop strains of pancreatic necrosis. Population health researchers identified the genomic signature associated with increased research on infectious diseases among wild stocks. tock management researchers developed microarray chip to monitor wild salmon stocks, which being used by the Department of Fisheries 20 per cent reduction in grow-out time for halibut because of genomic research results. Genomics for AGri-food Genomics is helping Canada’s agri-food sector develop innovative products and processes to increase global market share. $40.3 exports he science that aims to decipher and understand the entire genetic information of an organism. 8% Figures from Agriculture and Agri-Food Canada, 2011 6th exporter of 2.1 1.4% nnu G owth Agri-food sector: a pillar of the Canadian economy* ffects of clim chA e Severe weather, disease and pests are threatening ompetitiveness d risin costs Costs of production are rising faster than gross Consumer demand for non-conventional agricultural practices driving up costs and lowering utd ed re u ions Outdated regulations slow the adoption of new supply shortages. mp ts on the economy n heA thc r system increasing rates of obesity, high blood pressure, type diabetes and cancer, and these health challenges reduce economic productivity. ust ined fundin Longer-term public funding needed to support ducA ion A d w reness Societal misconceptions about the use new traceability can slow their uptake and effectiveness. chAllenG es fAci nG th e AG ri-food sector in cAnAdA Genomics is helpin to: Improve food quality Increase yields. Produce hardier crops and livestoc Improve human and animal health. why cA d n le d in i- ood Genomics: capacity (people, infrastructure and technology) research in many areas. Canada has regulatory system that is generally well-regarded internationally. Genomics Generating competitive production systems and innovative products “Genomics is key to a healthy, safe food supply and to maintaining a vibrant, profitable and sustainable farming industry in Canada.” Canada’s Opportunity Genomics opens the door to new opportunities for Canada’s agri-food sector to remain globally competitive through innovation. Opportunities for the sector are detailed in the recent strategy paper The Opportunity for Agri-Food Genomics in Canada: Ours for the Making uildin on success Canada is leading a number of national and international genomics-based initiatives that are producing results, namely: agricultural production, and food and water safety. Building science clusters focused on beef, dairy pork/swine, poultry, canola/flax, pulse, wheat breeding, edible horticulture, ornamental horticulture and organic agriculture. Creating DNA-based library of every species on earth (a database of thousands of species has already food fraud and manage pests and invasive species. Reducing common diseases that threaten commercial pig production. Creating oilseeds with improved yield, composition and quality. Developing the sunflower as new biofuel source. Studying important wine varieties and yeasts used in wine production. Shaping public policy and streamlining regulations Genomics for forestry Genomics is making Canada’s forest sector more profitable and sustainable. $57.1 revenues $26.4 billion total wood 192 forest dependent $24 (1.9% share of Forests: Essential to the Canadian economy* Data from Statistics Canada, 2012 593,200 enomics he science that aims to decipher and understand Job losses and mill closures due to market forces Decline demand for wood products. Emerging low-cost competitors in some areas. environmental challenGes More frequent and severe insect and disease outbreaks, wildfire, droughts, and storms leading nsect pests spruce budworm and emerald ash borer in the East, have destroyed large forest areas, with devastating economic and environmental impacts. blic forest policy Regulation and policy directives create financial burden and disincentive for long-term investments by private sector. of forestry research due to forest growth cycle of 40 to 120 years. challenG es facinG canada’s forest sector today Genomics is helpinG o: processes out of wood products. Resolve trade issues by rapidly identifying pathogens or pests in Canadian (and foreign) wood products that may threaten cross-border or interprovincial trade. Equip foresters to identify manage and mitigate forests, and prepare for future disease and pest Maximize forest regeneration and sustainability by informing tree planting based on knowledge of how trees are adapting to climate change. why anada can lead in forest G nomics: 9 Canadian forest genomics researc pest research. have excellent genomics research capacity throughout the country. have internationally-competitive large-scale technology platforms and R&D centres across the country with proven ability to serve the 9 common forest priorities means we can jointly leverage new forest technologies and applications, identify gaps and share best practices. Genomics An emerging solution for more productive and healthy forests “We believe that genomics is powerful enabler for objectives of FPInnovations as they relate to diversifying the forest industry from pulp, paper and lumber into a high-margin bioproducts-based industry.” — Pierre Lapointe, President and Chief Executive Officer, FPInnovations Canada’s Opportunity The time ripe to advance genomic-based solutions for healthier, more productive and sustainable forests in Canada. Opportunities for the sector are detailed in the recentlypublished strategy paper Forest Sector Challenges, Genomic Solutions available on Genome Canada’s website at www.genomecanada.ca/en/sectorstrategies Investments in Canadian forest genomics research to date have resulted in the following technological advancements and forest management tools: bioenergy feedstock. oak death to certify Canadian nurseries as free of Insect virus product to control the balsam fir sawfly Newfoundland and Labrador. Identification of blister rust-resistance genes in western white pine and using pollen from resistant Array-based tools used to test hybrid poplars for pest/pathogen sensitivity and genetic transmission as well as ash die back. Immunization of healthy elms with non-virulent strains of Dutch elm disease, with commercial field trials in Genomics for enerGy and mininG Enhancing hydrocarbon energy, coal and metal mining operations through genomics can help boost Canada’s outputs and advance international leadership in field already worth $1.25 trillion. $126 $880 energy resources Importance of the energy and mining sector to Canada* Figures from Advancing Canada’s Energy and Mining Sector through State-of-the-Art Genomics Applications Genome Canada, 2013. 11% 1.4 Million Canadians (5% Canadian workforce) 40% Growth of world’s oil $500 Billion provincial royalties the Canadian government stands to gain as Canada generates nearly 5% $370 6th Largest oil producer in #1 enomics he science that aims to decipher and understand challenGes facinG the sector, which Genomics can help address peline corrosion and well sourinG involved in souring and corrosion. However, more research required to translate these discoveries into commercial biotechnologies. Recovery of metals and the conversion of residual (unrecoverable) oil to value added compounds or products (e.g., methane, alcohols, bioplastics) remains challenge. acceleratin remediation Genomic research has identified many microorganisms which can treat toxic compounds. Additional research a sessment, monitorinG and compliance is difficult to develop regulations that accurately reflect today’s complex environments. Recovery of metals and minerals is declining in older deposits, which may cause extraction operations to close prematurely. As high-grade reserves are depleted and oil reservoirs are water flooded, using microorganisms to leach valuable metals is becoming increasingly important. cid rock and mine drainaG mines containing heavy metals is expensive. Greenhouse ses ponds and the microbes capable of consuming Future genomics research needed to create il/hydrocarbon spills Selected microbes have the potential to biodepathways involved in the highest biodegradation rates required to develop effective approaches for each situation. Genomics can help the sector to: Meet regulatory requirements. Manage and mitigate risk. Support responsible and sustainable why anada can lead in ener and mininG orld-leading expertise in hydrocarbon and petroleum microbiology. Plentiful natural resources and substantial processing and infrastructure capabilities 9 operations, facilities and offices Canada. ax incentives for investing exploration. platforms and R&D centres across the country. Genomics Providing technology to meet fundamental challenges “Genomics is an area of great potential for breakthrough technologies in the energy industry.” S “We are very excited about the prospects for genomic applications in the mining sector, particularly in environmental management and sustainability of operations and in reclamation and closure of mining sites.” — Chris Hodgson, President, Ontario Mining Association Canada’s Opportunity The power of genomic technologies only beginning to be recognized in the energy and mining sectors. Now the time to greatly expand the use of these tools to improve operational practices Advancing Canada’s Energy and Mining Sector through State-of-the-Art Genomics Applications available on Genome Canada’s website www.genomecanada.ca/en/sectorstrategies wide range of biological tools and technological advancements that benefit the energy and mining sector have resulted from Canadian genomics research investments. Notable promising discoveries include: Improved remediation of oil ands tailings. Greener production and extraction of hydrocarbon energy, including souring control, tailings pond ools for monitoring and improving mine involved in breakdown of pollutants at contamiEnhanced ‘biomonitoring’ to better describe and understand biological diversity and mitigate environmental threats. Exploring how organisms respond at genetic
Genome
CLIENT
Data Visualization

PROJECT TITLE:
Graphic Design and Data Visualization Services
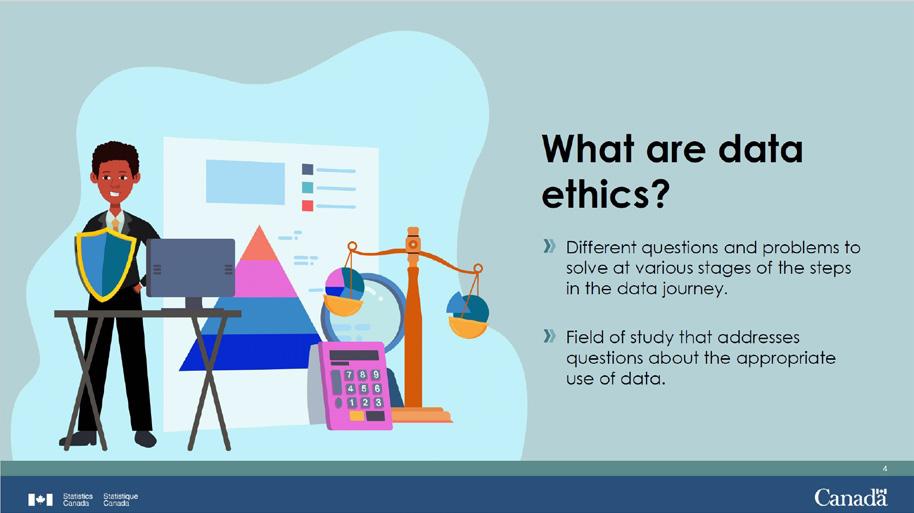
Statistics Canada is the country’s national statistical office. The agency ensures Canadians have the key information on Canada’s economy, society, and environment that they require to function effectively as citizens and decision makers. In a long-term service arrangement, NIVA works closely with Statistic Canada’s communications team to produce infographics and other digital content (e.g., survey brochures, logos, graphic overlays, etc.) that reflect information design, data visualization, and data storytelling principles and adhere strictly to agency design and branding guidelines.
For infographics, Statistics Canada’s primary objectives are to quickly communicate key messages, simplify the presentation of substantial amounts of data, highlight patterns and relationships in the data, and enable the monitoring of changes over time to the public.
We have also created a series of animated PowerPoint presentations to support the agency’s data literacy training program.
CLIENT ORGANIZATION:
Statistics Canada

Engage. Inform. Motivate. Communicate with impact.
www.statcan.gc.ca 1. Natural increase is the number of births minus the number of deaths. 2 A ording Publi Health Agen y f Canada as f June 30 2020 https // b.archi e.org/ eb/20200701023526/https //health-in obase.canada.ca/ vid-19/epidemiological-summary- vid-19-cases.html ). Sour Statistics Canada, Annual Demographi Estima Canada P vin es and Terri ories 2020. Catalogue number: 11-627-M ISBN: 978-0-660-35741-6 © Her Majes y the Queen in Right o Canada as represented b the Minister o Industr 2020 While Canada has welcomed record numbers of permanent and temporary immigrants since 2015/2016, international migratory growth decreased sharply from April 1 to June 30, 2020, following the border restrictions introduced as a result of the pandemic. ...the population in this age group grew by 38,758 to total 1,663,666 on July 1 2020 driven by population aging. Despite the fact that 72% (6,164)2 of Canadians who died of COVID-19 were aged 80 and older Given the size of the Canadian population, COVID-19 has had a limited effect on the country’s age and sex profile. International migration Jul/Sept Oct/Dec Jan/Mar Apr/Jun 2017/2018 2018/2019 2019/2020 0 20,000 40,000 60,000 80,000 100,000 120,000 140,000 160,000 180,000 -0.3% N.L. +1.5% P.E.I. +1.0% N.S. +0.6% N.B. +0.9% Que. +1.3% Ont +0.7% Man. +0.5% Sask. +1.4% Alta. +1.1% B.C. +1.4% Y T +0.3% N.W.T. +1.9% Nvt. +1.1% Canada Population growth 2019/2020 Population growth in Canada and most provinces slowed by COVID-19 Higher than in 2018/2019 Lower than in 2018/2019 Canada recorded its lowest natural increase1 ever (+74,571). This was expected because of the overall aging of the population, but it was also amplified by the impacts of the COVID-19 pandemic, with more deaths being reported. CANADA’S POPULATION | JU LY 1, 2020 Canada’s population reached the 38-million mark between April 1 and July 1, 2020. However, the annual increase of 411,854 was the lowest since 2015/2016 due to international migration being slowed by COVID-19. www.statcan gc ca Source: Infrastructure Economic Account Human Resource Module. Catalogue number: 11-627-M ISBN: 978-0-660-36030-0 g p y y jobs in Canada Immigrants Non-immigrants 29.4% 70.6% 10.8% Full-time ullPa -time P -ti College diploma Se da (high) diploma 36.8% T ades 8.0% Uni e si y deg high 23.4% 2.7% 28.3% 31.9% 38.3% 19.4% 22.0% 2010 2011 2012 2013 2014 2015 2016 2017 2018 $29.28 $24.13 $30.00 $25.07 $31.07 $26.13 $30.54 $26.34 $31.18 $ $32.48 $27.86 $33.38 $ $33.41 $28.14 $33.23 $27.96 2019 $3 11 $28 48 139,937 187 943 $3 43 How many workers are involved and how does the average hourly wage vary across Canada (2019)? How does that average hourly wage vary over time and by sex? 26.7% of infrastructure jobs were held by females and they were more likely than males to work part-time jobs. The largest share of workers had high school diploma or less. Women were more likely than men to hold a college diploma or university degree. Immigrants represented 25.4% of all workers in infrastructure, with female immigrant workers having a larger share than non-immigrant workers. Jobs related to infrastructure include direct employment, such as the construction worker building a bridge and the engineer supplying the plans, but also indirect, such as the manufacturer supplying the steel and the restaurant worker supplying the meals. A portrait of infrastructure-related Canada 608,318 workers in Canada total $32.04 Average hourly wage Intergenerational income mobility: The lasting effects of growing up in a lower-income family New data from the Longitudinal and International Study of Adults on a cohort of Canadians born between 1963 and 1979 reveal differences in their life course, depending on whether they grew up in a lower or higher income family. 1. The data cover anadians born bet en 1963 and 1979 ept immigrants who arri ed at 16 ears of age or la 2. Lower- and higher-income families are identified by ranking all families according to the parents’ average pre-tax family income when the children were between 15 and 19 years of age. Lower-income families are those where income was in the bottom 20% of all families, and higher-income families are those where income was in the top 20% of all families. 3. The propo tion Canadians whose mother or father ha uni ersit d Income is measured as average pre-tax family income at the age of 30 to 34 years. These values are then averaged across individ from higher-income families. ongitudinal and In © Her Majes the Queen in Right Canada as represented b the Minister Industr 2020 www.statcan.gc.ca were less likely to have parents with a unive sity deg ee3 were more like y o ha e parents with sity d g lik y to h - fficial language as a mother ongue lik y o h - fficia language as a mother tongue were less like y to live with bo h parents at age 15 were mo e like y o live with both parents at age 15 were les like y o have a university degree were more likely to have a un ve sity deg ee were less like y o be married o cohabitating as adults were more likely to be marr ed or cohabitating as adults were mo e like y to repor t be ng n poor or fair health as adults were ess like y o repor be ng n poor or fair health as adults had lower family income as adults had higher family income as adults CANADIANS WHO HAD OWER FAMI Y INCOME WHEN THEY WERE HI DREN CANADIANS WHO HAD HIGHER AM Y INCOME WHEN THEY WERE CHI DREN Catalogue number: 11-62 -M ISBN: 978-0-660-35662-4 14.0% 57.5% 9.6% 3.4% 71.9% 90.6% 25.3% 65.8% 62.0% 75.3% 5.4% 10.5% $81,400 $48,600
Public Health

PROJECT TITLE:
Plain Language Web Content and Infographics (CANVax)
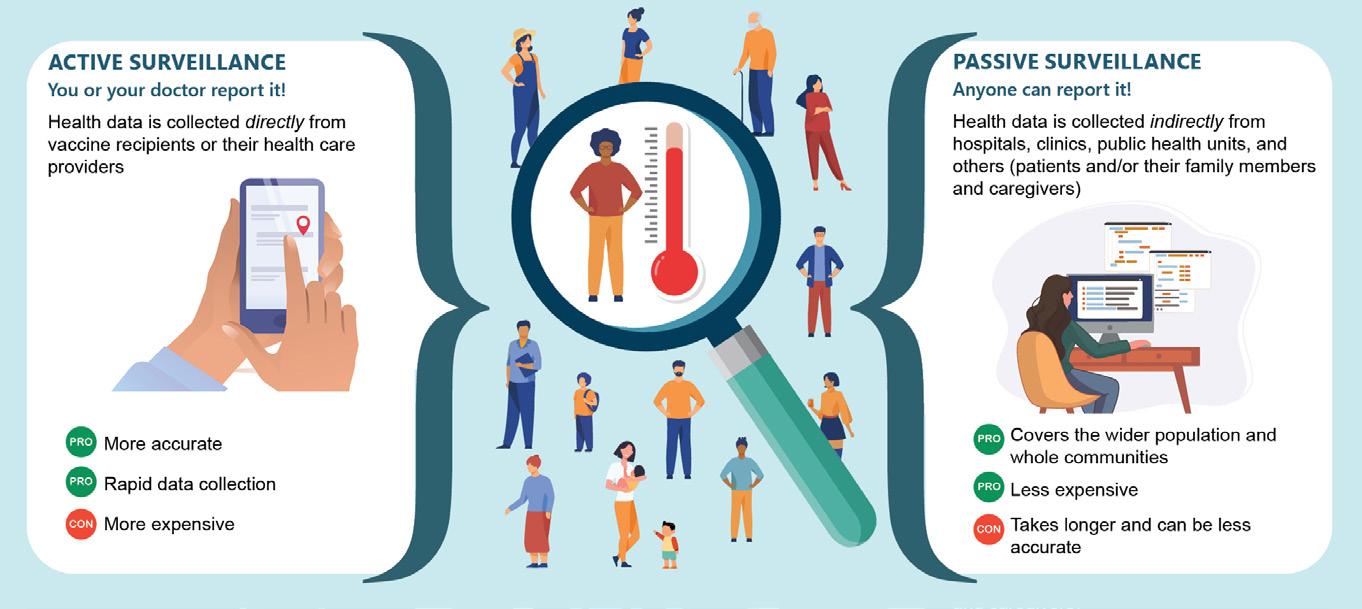
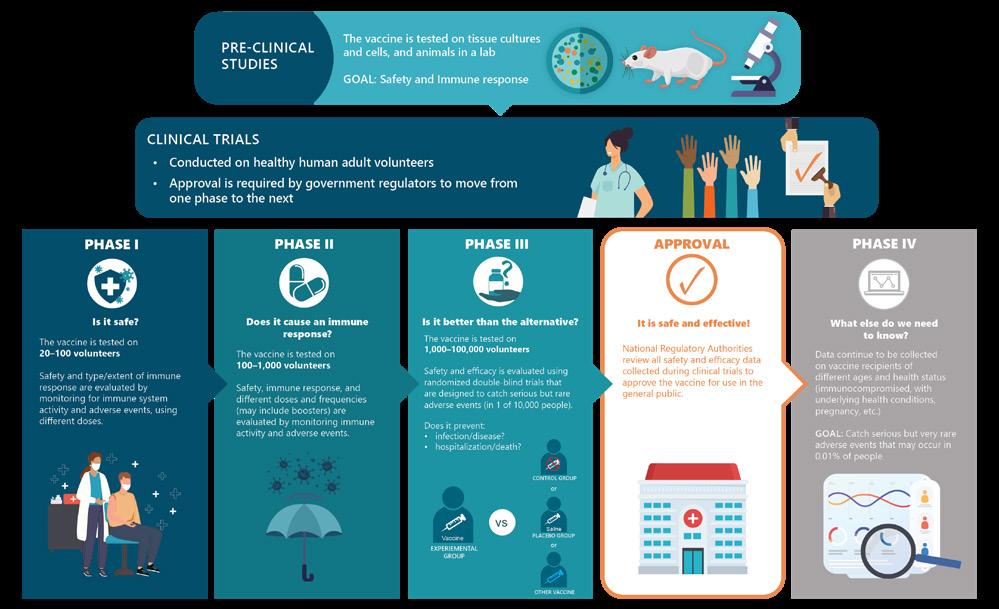
CPHA’s Canadian Vaccination Evidence Resource and Exchange Centre (CANVax) is an online database of curated resources to support immunization program planning and promotional activities to improve vaccine acceptance and uptake in Canada.
As an online resource centre, CANVax aims to increase access to evidence-based products, resources, and tools to inform public health professionals in immunization program planning and promotion. One of the key offerings on the CANVax website is a set of COVID-19 Vaccine Questions and Answers aimed to support Healthcare Providers.
CPHA recognized that the existing Q&A section on CANVax.ca would benefit from a plain-language approach to communicating information to benefit both non-healthcareprofessional visitors to the site, as well as healthcare providers who are looking for tools to explain technical information about vaccination to their patients more effectively.
CLIENT ORGANIZATION:
Canadian Public Health Association (CPHA)
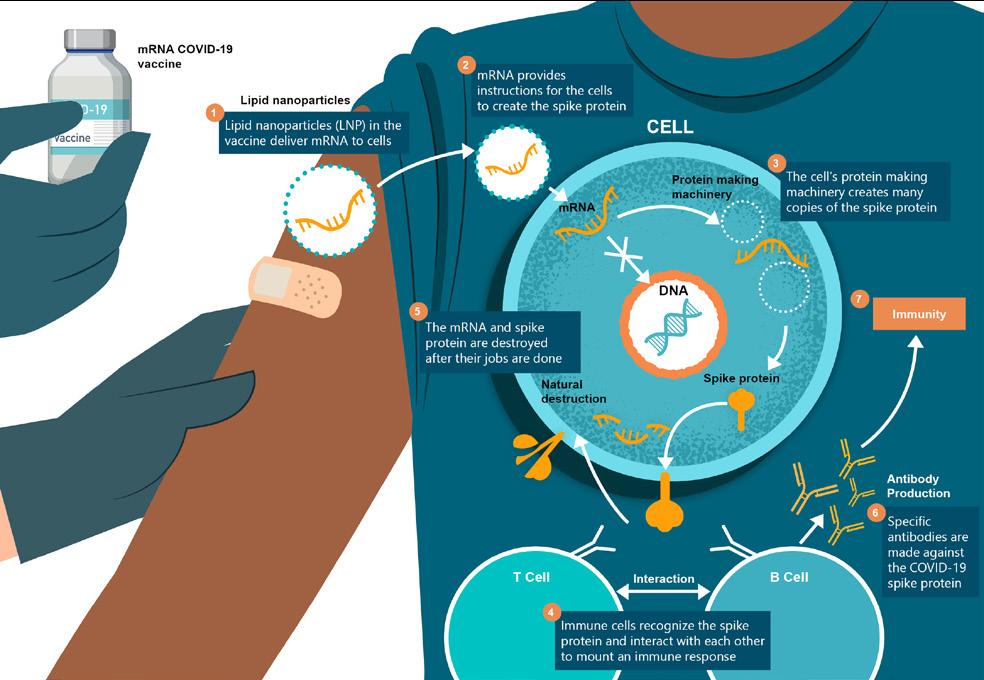
CPHA required the advice and support of experienced science communication professionals to assess existing Q&A content on the website, determine an approach to communicating answers in plain language, adapt existing content to this approach, and assist with the development of new questions and answers, as well as visualization tools such as infographics, to help communicate CANVax-related subject matter.
Engage. Inform. Motivate. Communicate with impact.
Indigenous Health

PROJECT TITLE:
Graphic Design and Publication Support Services
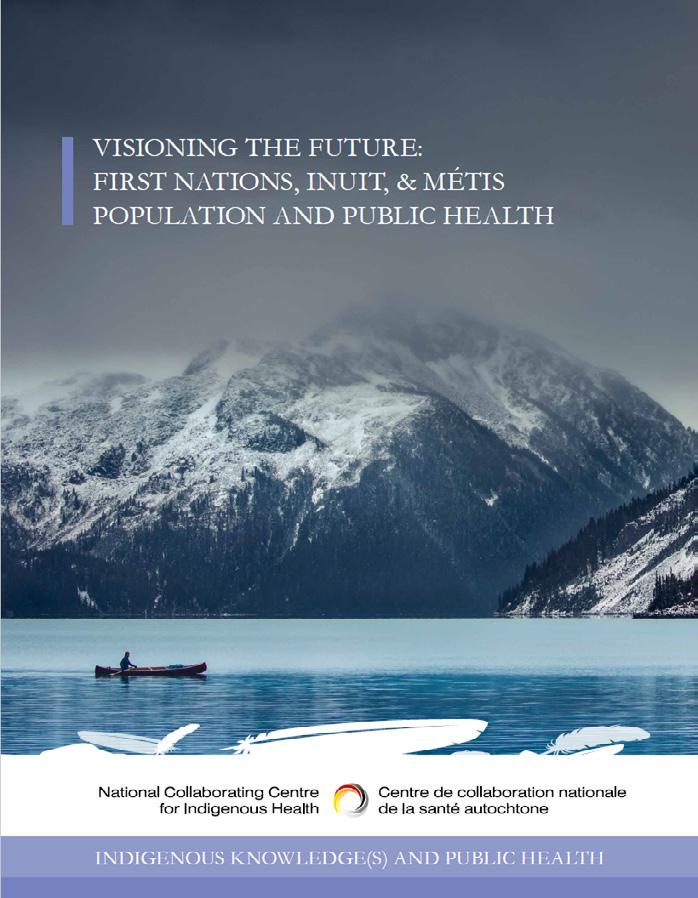
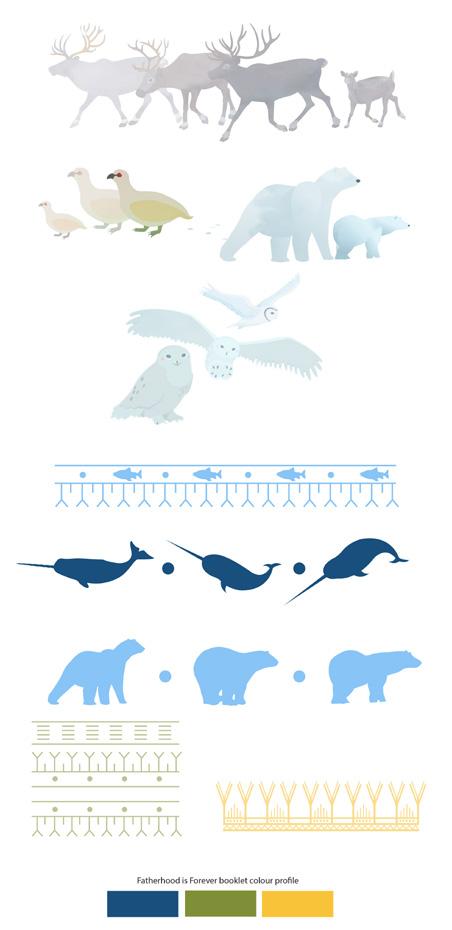
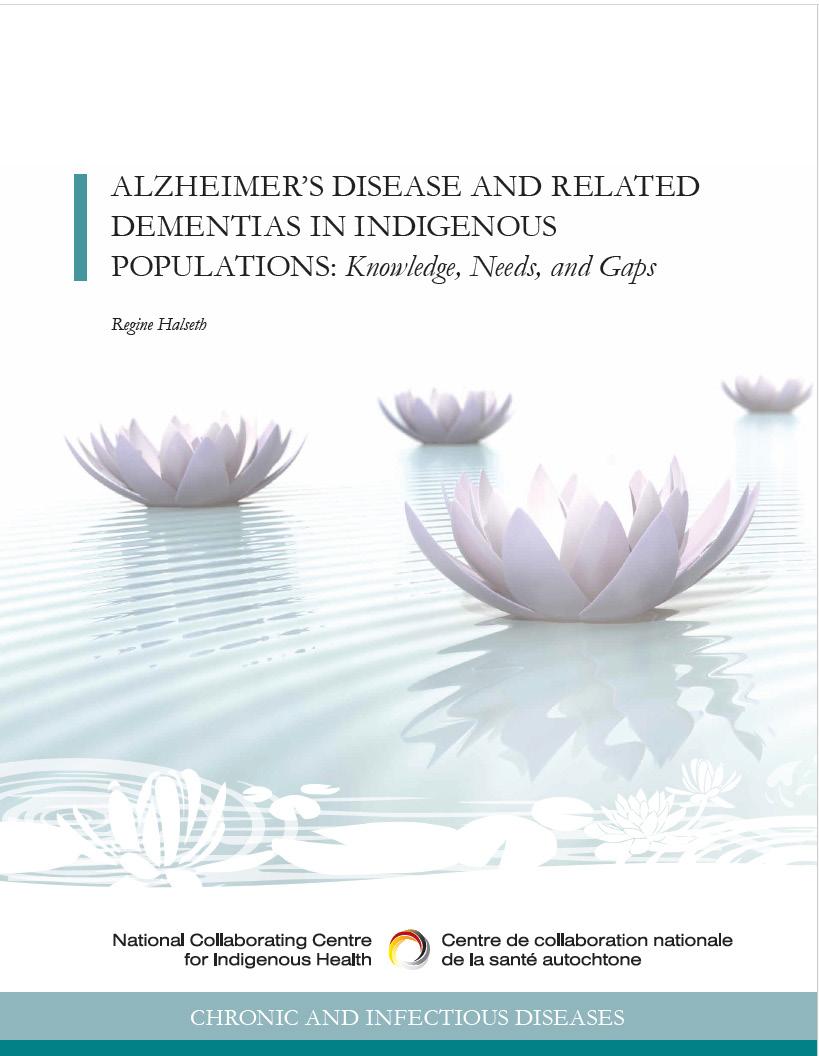
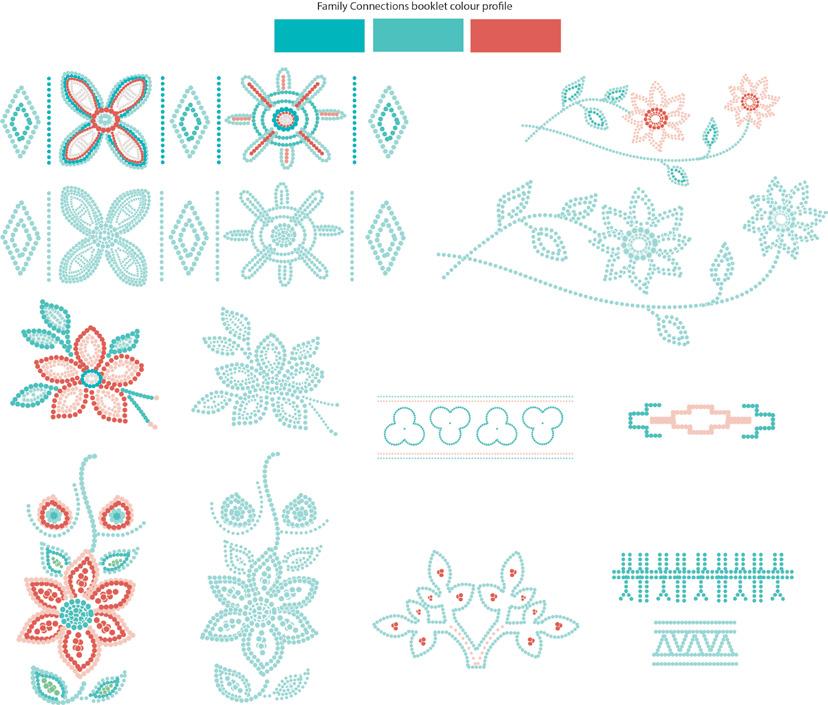
With a long-term service agreement, we were honoured to be the agency of record for graphic design that supported the NCCIH in carrying out its mandate through the digital publication of many key reports, fact sheets, brochures, and other informational materials.
Our services included creating initial design concepts, graphic elements (such as vector overlays and infographics), source and select images, comprehensive document formatting, file optimization, and other publication support as required.
To highlight the important and sensitive content of these documents, we worked with NCCIH’s team to ensure a strong focus on appropriate, respectful, and culturally meaningful image selection, as well as developing graphic elements that align with the interpretation of document themes and accurate representations of First Nations, Inuit, and Métis Peoples.
CLIENT ORGANIZATION:
National Collaborating Centre for Indigenous Health (NCCIH)
Engage. Inform. Motivate. Communicate with impact.
Defence

PROJECT TITLE:
Communication and Publication Support Services
The Science and Technology Organization (STO) is a NATO subsidiary body created to meet the collective Science and Technology needs of the NATO Alliance and its partner nations. It does this by generating, sharing, and disseminating advanced scientific knowledge, technological developments, and innovation.
NIVA is the exclusive long-term service provider responsible for editing, formatting, and designing all scientific publications produced by NATO’s Science and Technology Organization (STO). We are also involved with developing communication products that help STO better tell the story of who they are and what they do. We help them to both demonstrate their value and help attract new researchers from around the world and mobilize knowledge to decision makers.
Our team ensures that all STO scientific, strategic, and promotional publications adhere to the established language and stylistic standards, that all content is expressed in a clear manner and free of grammar errors, and that formatting is aligned with NATO templates and design standards. We deliver graphic design and layout services to prepare high-impact, visually engaging, and accessible report documents for print, digital, and social media publications.


CLIENT ORGANIZATION:
NATO Science and Technology Organization (STO)


Engage. Inform. Motivate. Communicate with impact.
The strength to refine and employ new technologies has for decades provided countries in the NATO alliance with a multitude of cutting-edge capabilities to ensure military advantage, provide security to our societies, and protect the sovereignty of our democracies. Global technological leadership has been the foundation upon which NATO’s ability to deter and defend against potential threats ultimately rests. The NATO Science and Technology Organization (STO) has a rich history dating back to 1952, dedicated to ensuring that NATO maintains this technological and military edge over competitors and adversaries. Throughout these 70 years, STO and its predecessor organizations have fostered an international community of world class scientists, engineers, and military operators to meet the challenges and opportunities driven by rapidly evolving technologies through an exchange of knowledge, experiences and perspectives across NATO. NATO Science Committee The desire of NATO Heads of Government to improve the coordination and effectiveness of the Alliance’s scientific and technological resources leads to creation of the NATO Science Committee, along with the joint post of Science Advisor to the Secretary General and Assistant Secretary General for Scientific Affairs. 1958 70 YEARS OF COLLABORATIVE SCIENCE AND TECHNOLOGY A rich history of scientific and technological advancement paved with important milestones Defence Research Director’s Committee (DRDC) 1963 The Defence Research Director’s Committee (DRDC) becomes permanent and independent committee of NATO. attempts to bridge both the civil and military aspects of science at NATO. DRDC provides scientific and technical advice to NATO’s Military Authorities on the formulation of operational requirements. Science and Technology Organization (STO) 2012 The current STO structure is established on July 2012, bringing with it renamed Centre for Maritime Research and Experimentation (CMRE) and Collaboration Support Office (CSO), and the new Office of the Chief Scientist (OCS) to combine 60 years of expertise and a legacy of achievements that continues today. NATO Research and Technology Organization (RTO) 1998 The need for more cohesion and cost-effectiveness, and a single focus in NATO for air, land, sea and space research activities, results in AGARD and DRG merging to form the NATO Research and Technology Organization (RTO). Defence Research Group (DRG) Major NATO reorganization in cooperative action for research and technology leads to abolishment of the DRDC. Its responsibilities are taken up by the Defence Research Group (DRG), which reports to the NATO military Authorities and the newly established Conference of Armaments Directors (CNAD) 1967 Modelling & Simulation Group (NMSG) and Coordination Office (MSCO) The NATO Modelling & Simulation Group and Modelling & Simulation Coordination Office (MSCO) are created to help improve the cost-effectiveness of Alliance operations (e.g., defence planning, training, exercises, support to operations, research, technology development and armaments acquisition). 1999 Launch of NATO 2030 2021 NATO 2030 is an ambitious agenda focused on making sure NATO remains ready, strong, and united for new era of increased global competition and increased threats, including new disruptive technologies and climate change. STO has a critical role in delivering innovation, advice, and science and technology solutions to meet NATO’s ever-changing needs and ensuring that NATO maintains its technological edge. Advisory Group for Aerospace Research and Development (AGARD) 1952 Led by Professor Dr. Theodore von Kármán and his collaborative vision, AGARD is founded in April 1952 to foster the interchange of information relating to aerospace research and development between NATO nations and provide scientific and technical advice and assistance to the NATO Military Committee. Our founder was driven by a wise philosophy: Scientific results cannot be used efficiently by soldiers who have no understanding of them, and scientists cannot produce results useful for warfare without an understanding of the operations. — Dr. Theodore von Kármán The end of the Cold War led to reductions in NATO member military budgets and the drive toward better coordination of pooled resources and avoidance of duplicated efforts. 2003 In 2003 the SACLANT Undersea Research Centre became NURC – NATO Undersea Research Centre. Finally, in 2012 the name was changed to the current CMRE – Centre for Maritime Research and Experimentation. 1987 In 1987 SACLANT ASW Research Centre changed its name to the SACLANT Undersea Research Centre. It reflected both changes within the NATO military organization (end of Cold War) and changing priorities in the research program. 1959 The SACLANT ASW Research Centre was established in 1959 to provide scientific and technical advice to the Supreme Allied Commander Atlantic (SACLANT) in the field of antisubmarine warfare and to respond to the needs of NATO nations and maritime commands.
and Security
