2 minute read
mapping atmosphere


mapping sunlight
Since my project mainly focuses on the sunlight element, I need to find a site that perfectly serves my interest in creating light phenomena.
Advertisement
Initially, I was struggling a lot to find an ideal site as most of the time, the morning weather was either not enough sunny or the sun was too subtle, in other words, or densely cloudy and gloomy.
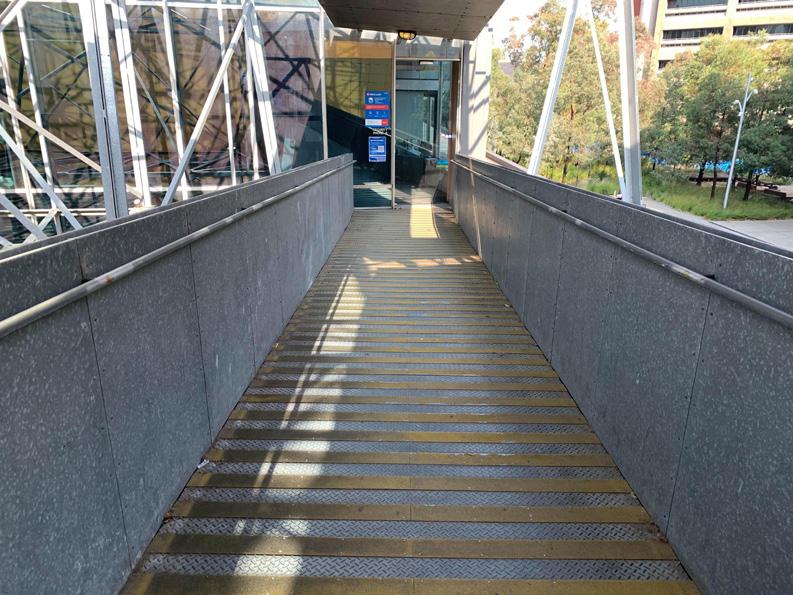
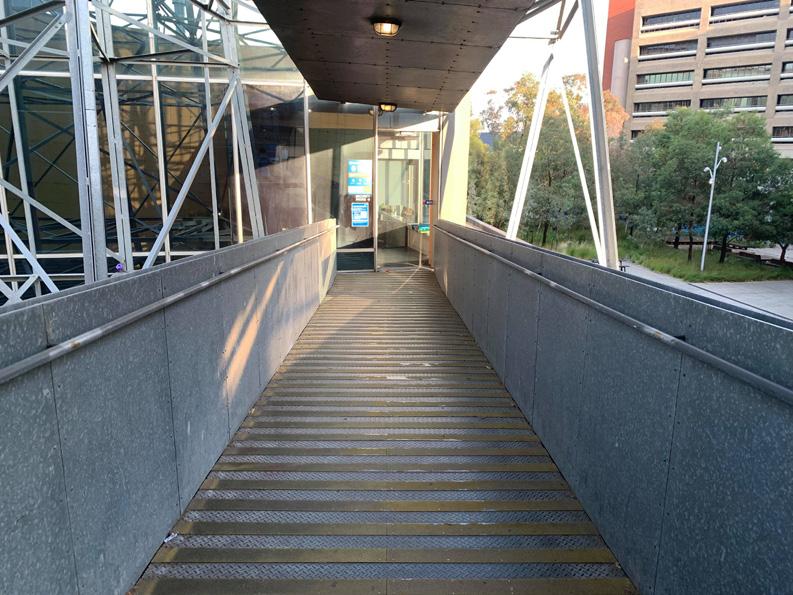
Therefore, throughout the project, I kept going back and forth at more than one site (the bridge between building G and F and the window corner of building F) to finalize which one worked the best at what time the sun was the strongest.
After some experimentation and observation, I was able to learn where the sun traveled throughout the day in the following sun plan and sun map. While the bridge works the best from 11 am to 13 pm, the other one is more ideal in the afternoon, specifically from 13 pm to 17 pm, depending on occassions when the likelihood of the weather is sunny or overcast.
Site plan recording sun path over a day


2 pm
3 pm
4 pm
5 pm

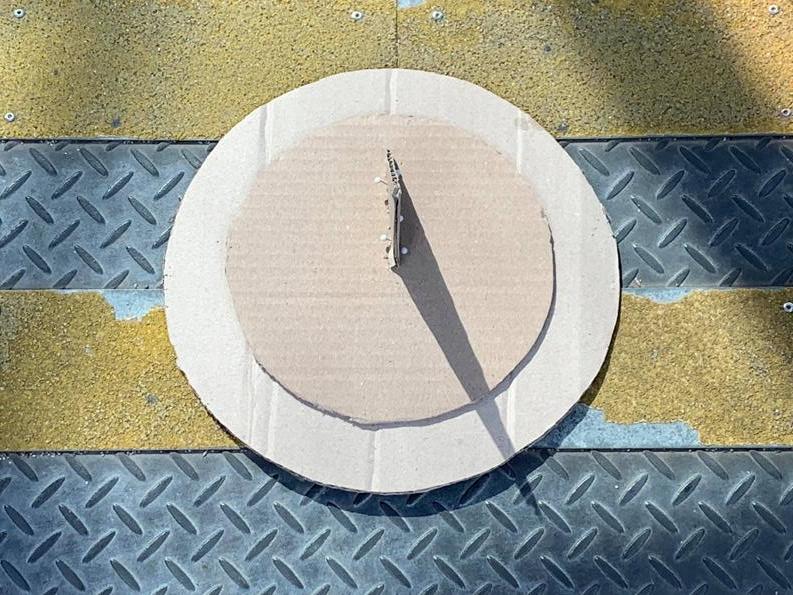


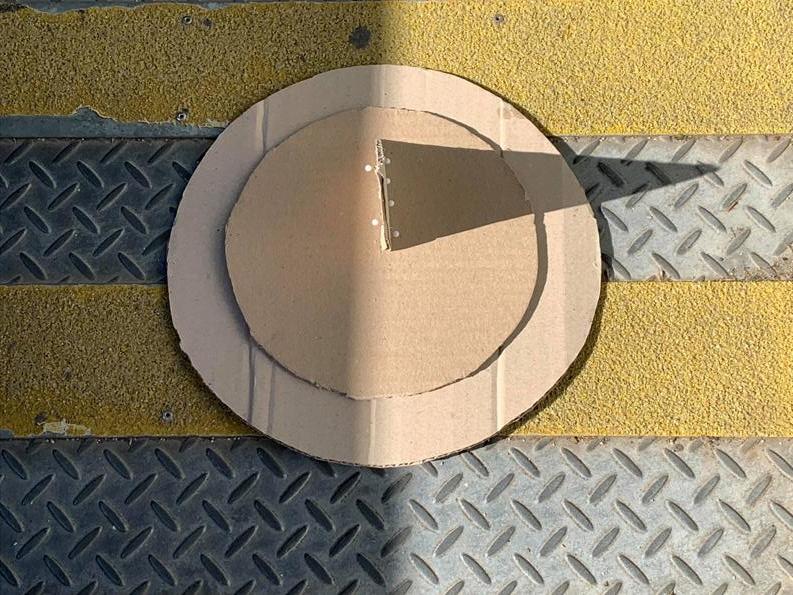
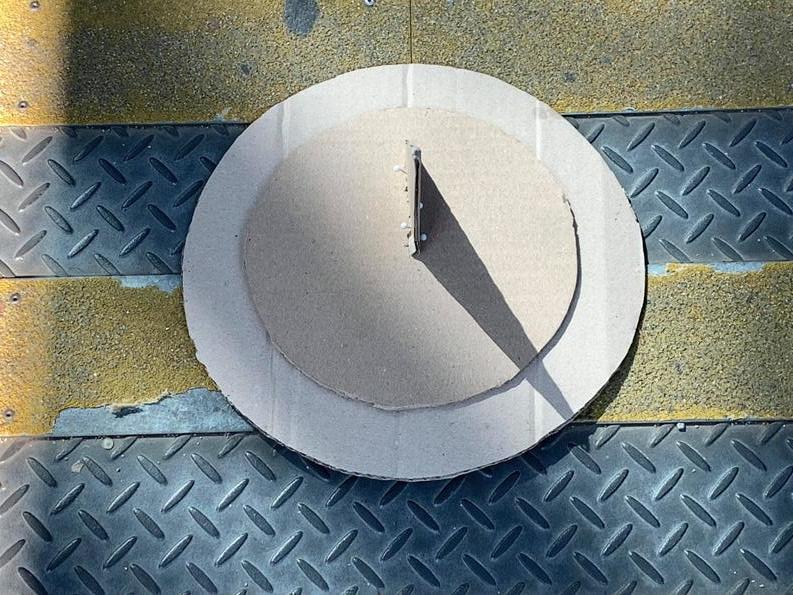
Time-lapse photographs of the site bridge & sundial recording sunlight & shadow from 9am to 6pm. 7

In this sunlight mapping, I used a hand-made sundial as a guide to trace the change of light and shadow on the bridge from morning to evening. This change was then crucially recorded into a series of time-lapse photographs to distinctively show the difference between each time period.
Afterward, as suggested by my tutor, I also digitally traced out the light and shadow on each sundial recorded and put it into a circular path to actually mimic like a clock, a sun clock.
To give better understanding and notion of what time the site works the best during sunny days, I also put together the sun mappings recorded at different time events in a more simplified form.
The bright yellow represents the zone where the sun shines the brightest, while the darker zone displays when the sun reflection weakens with the striped shadows on it.