2021 Tapestry Segmentation Area Profile


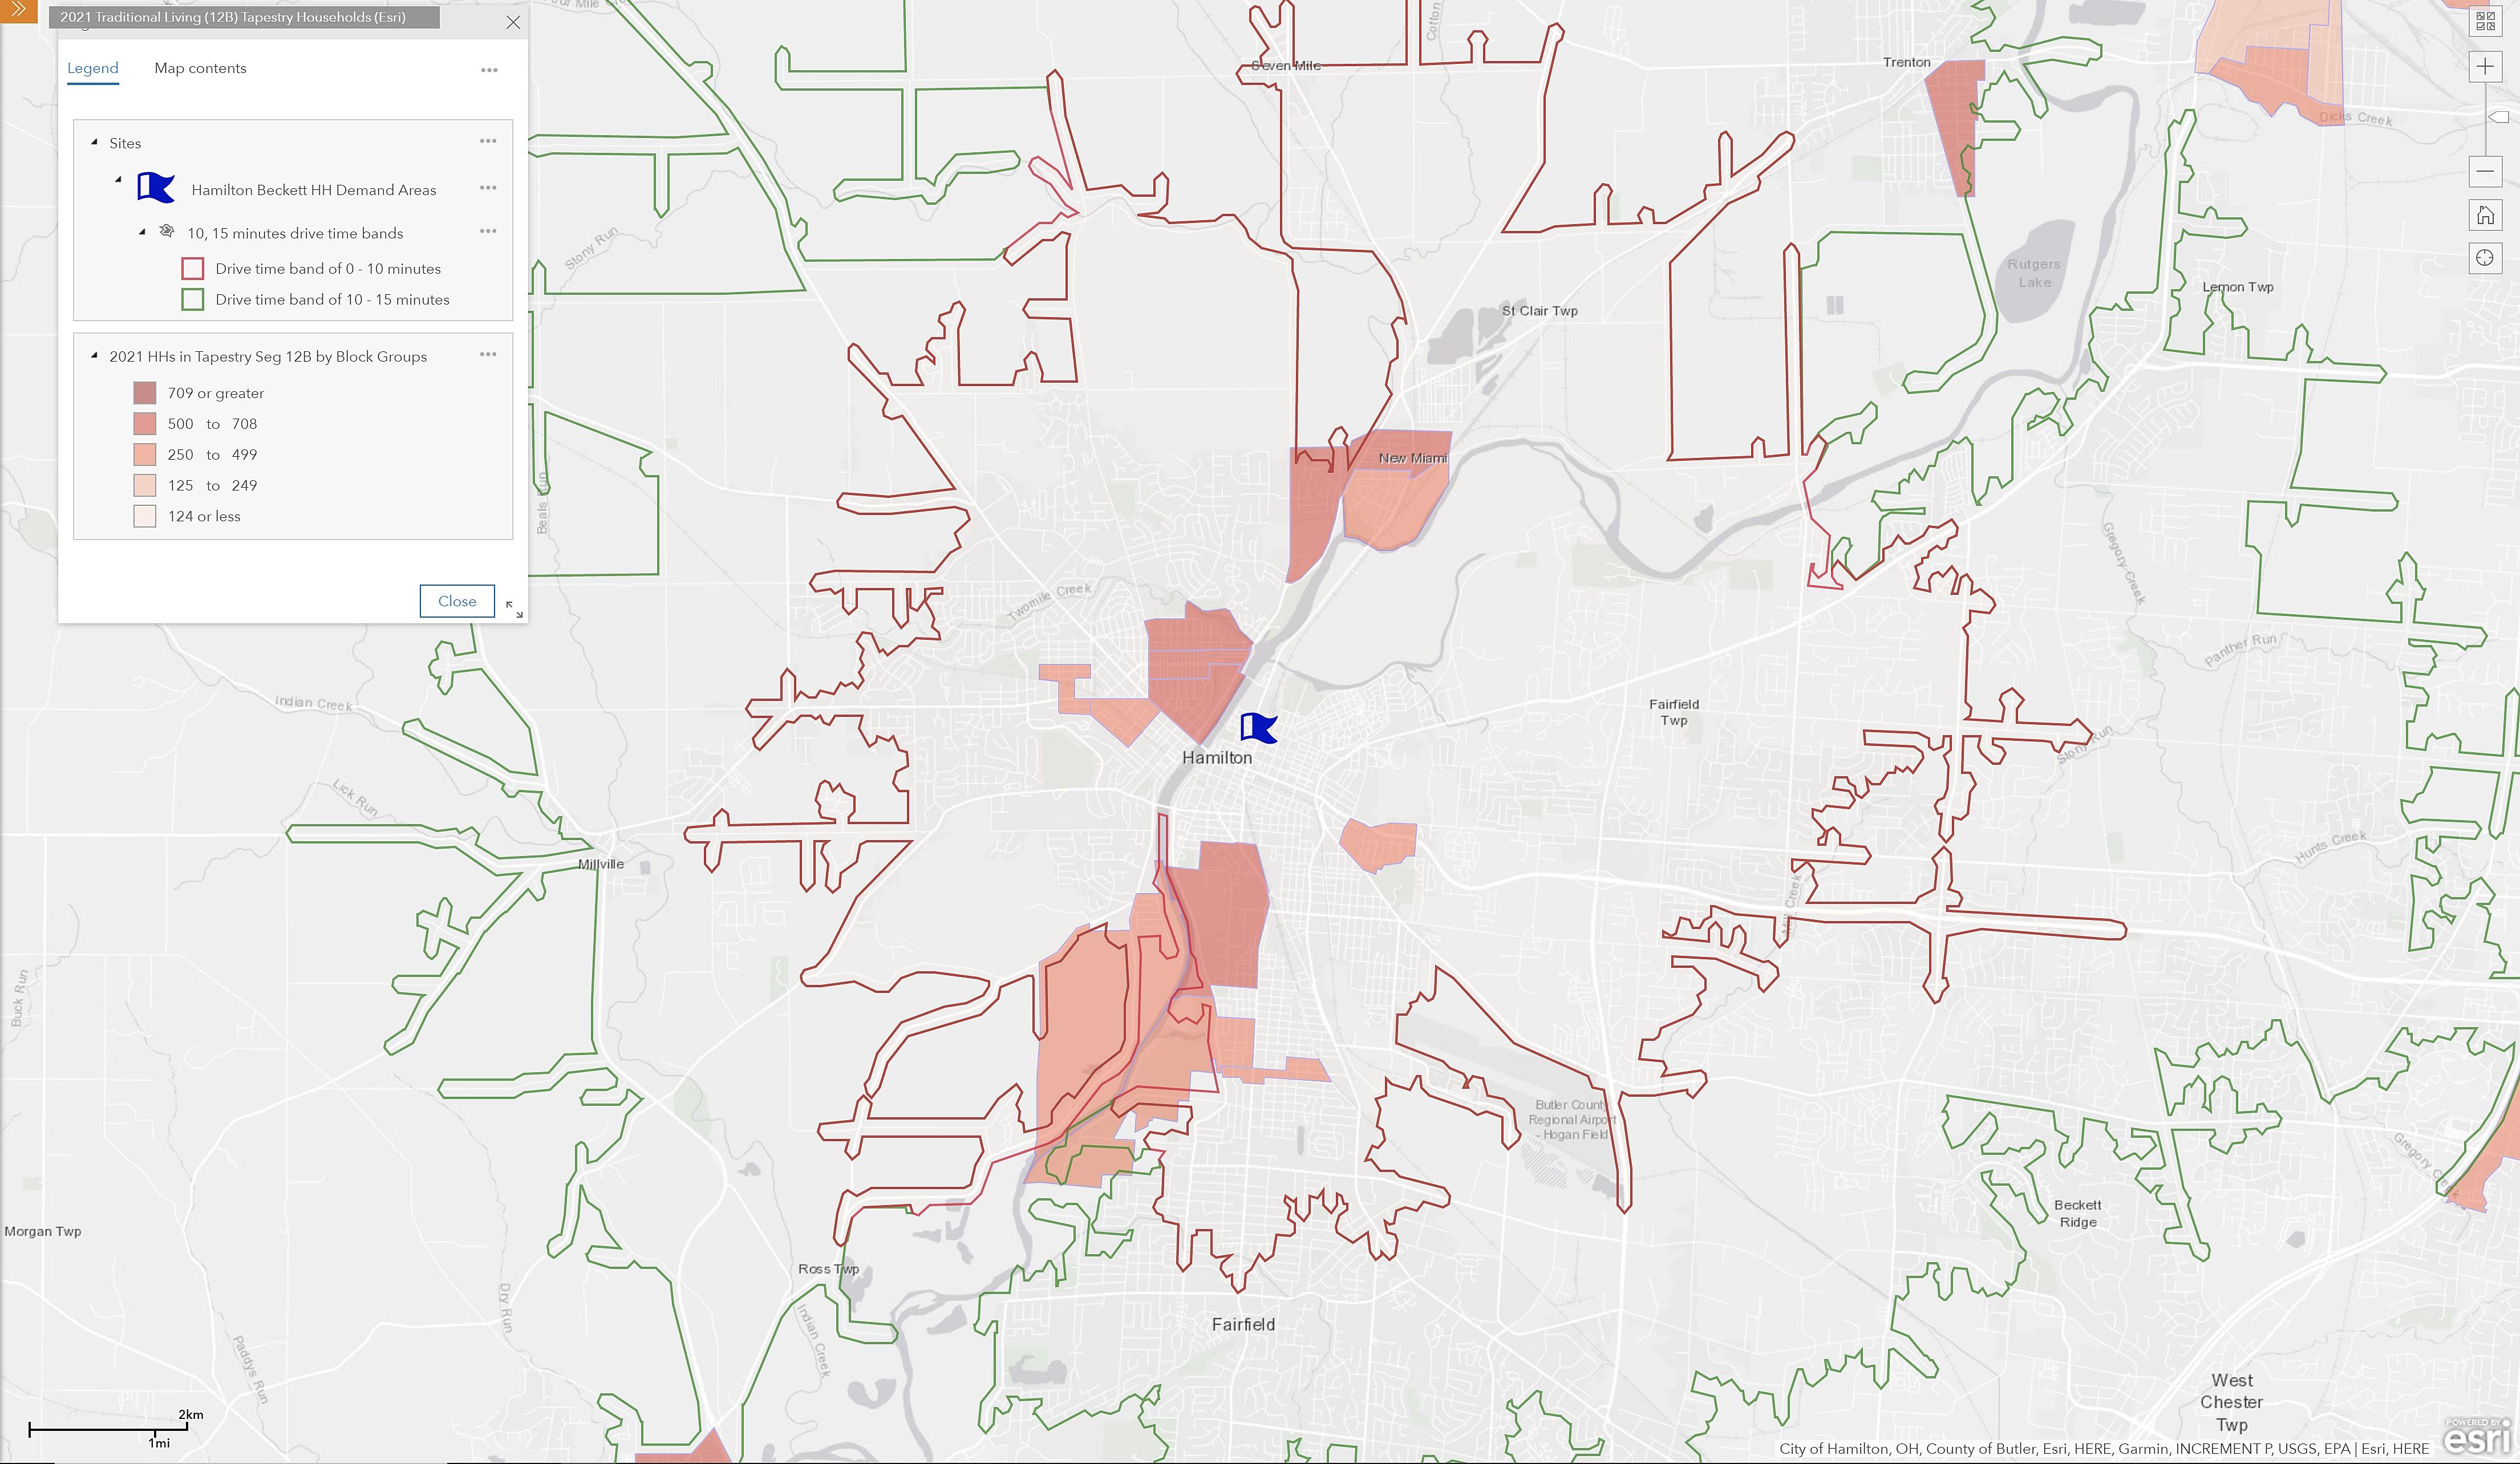
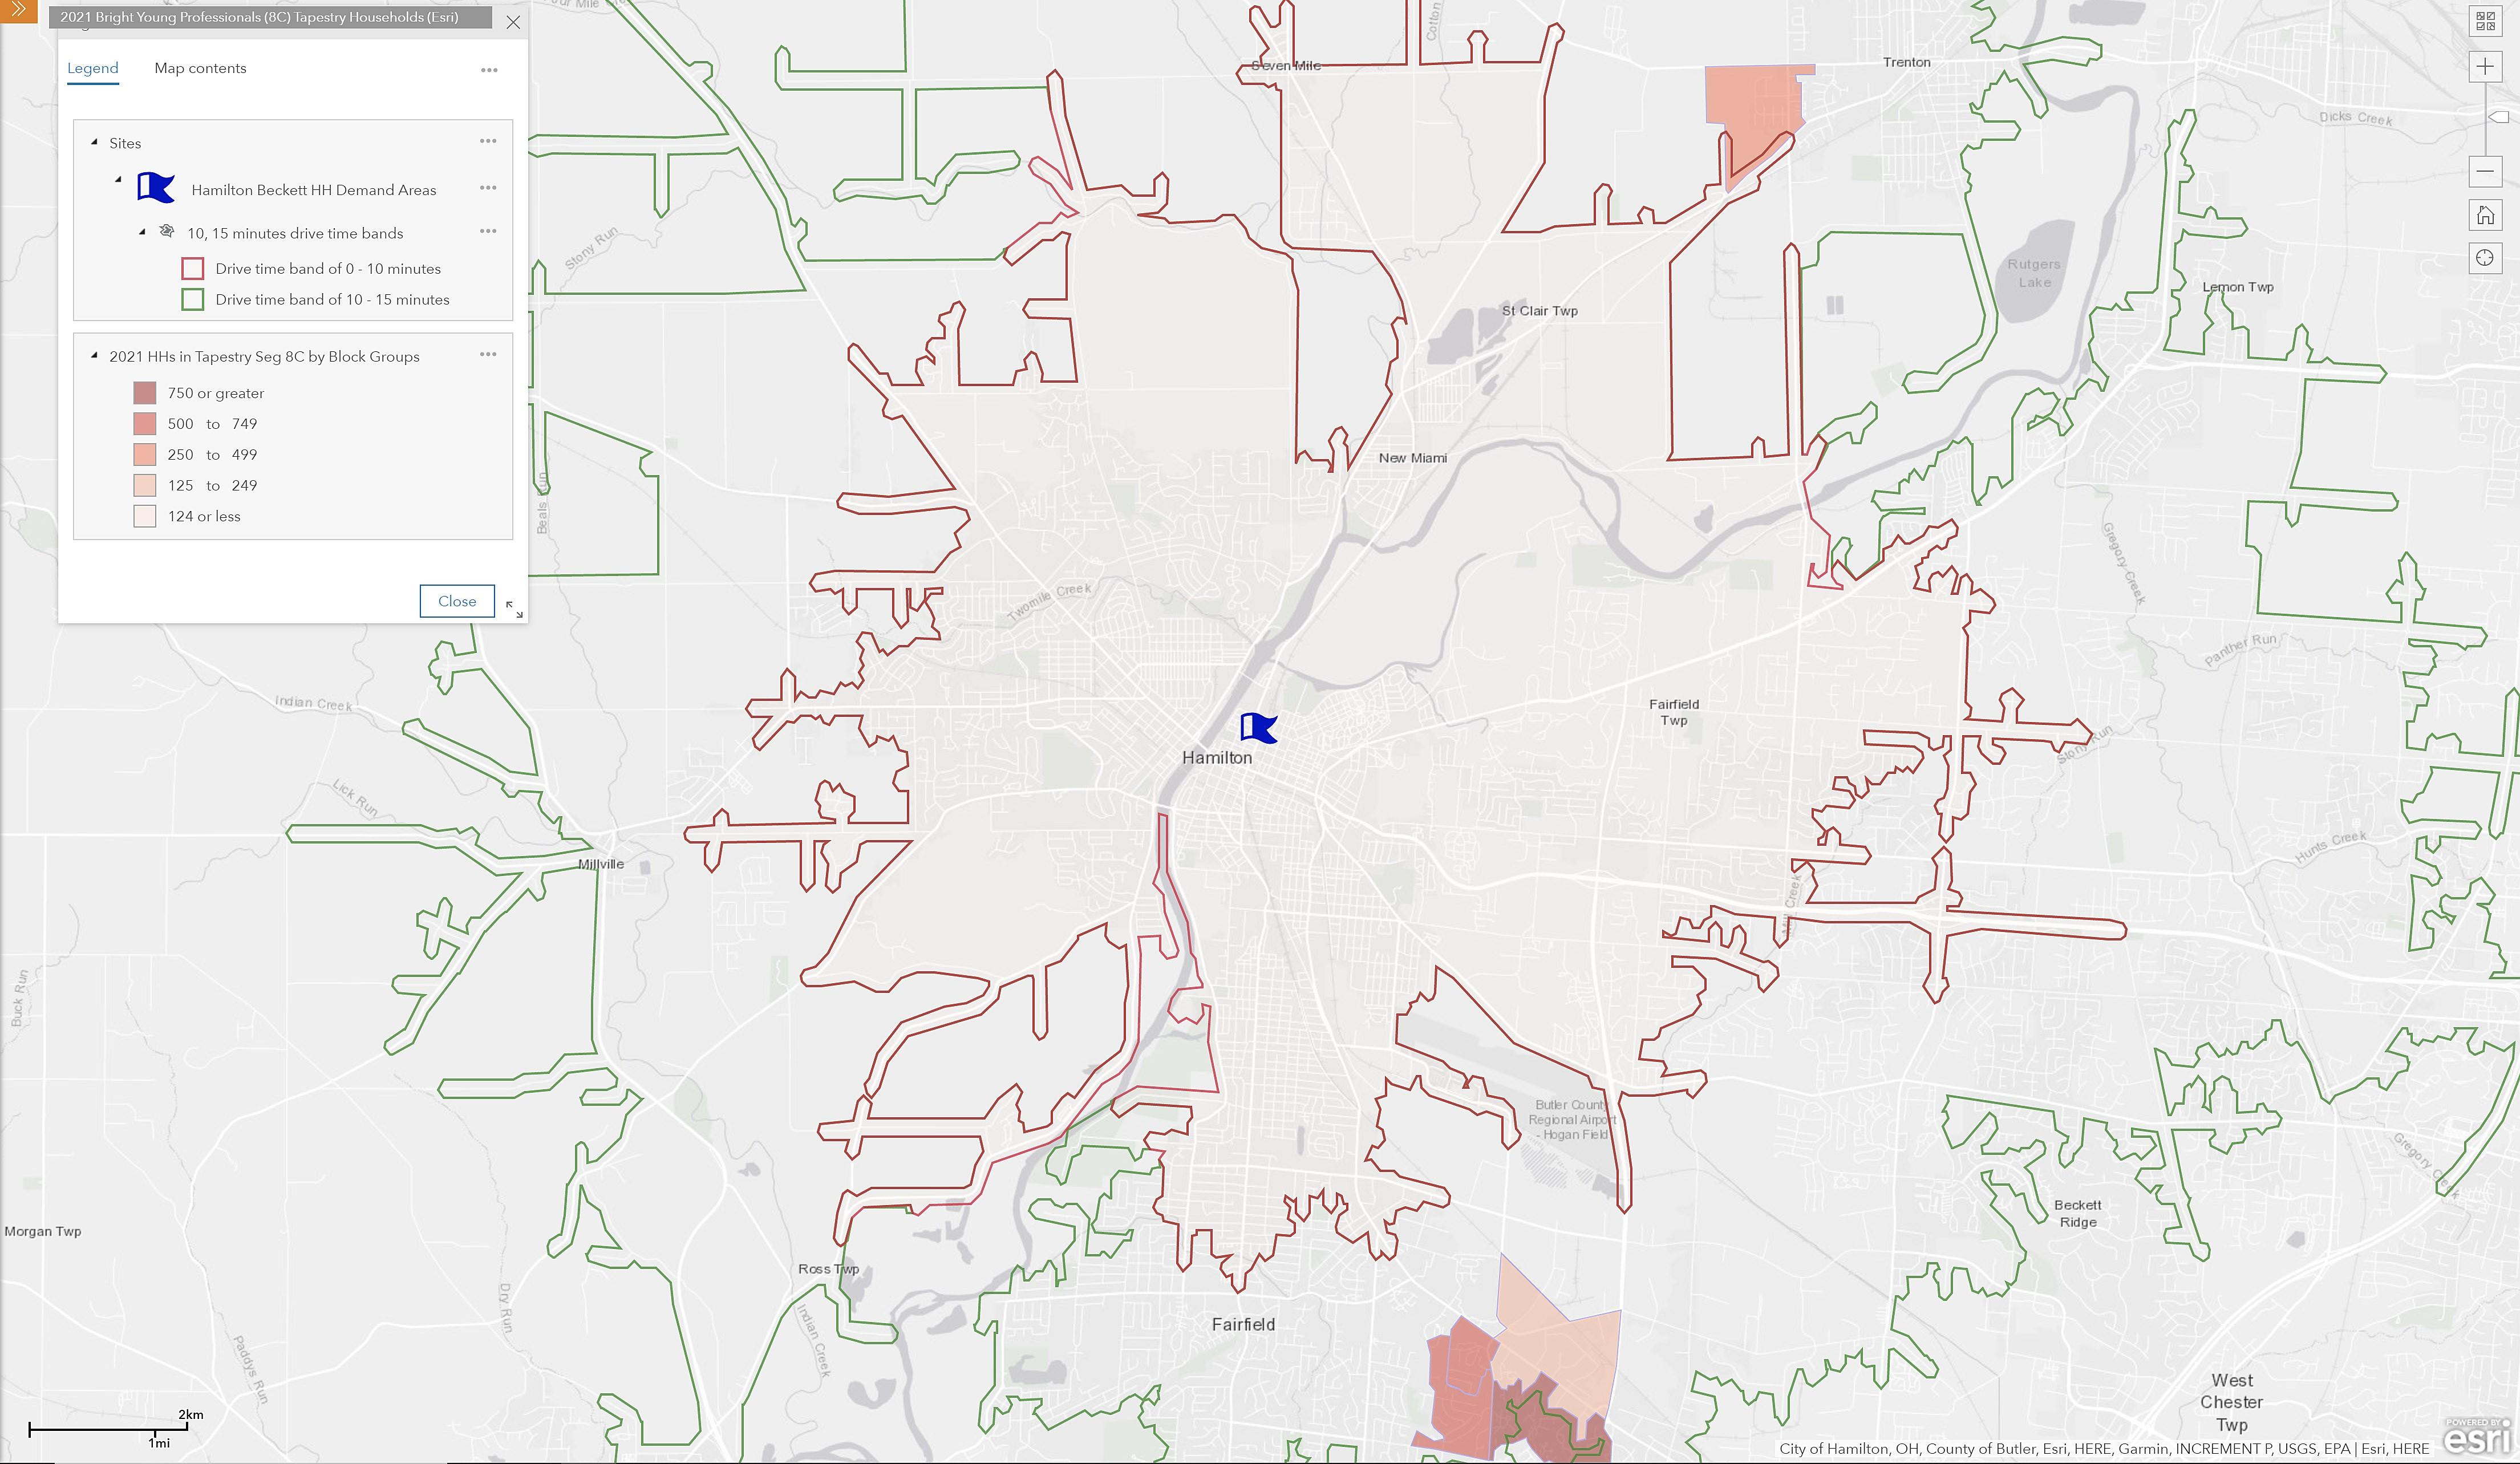
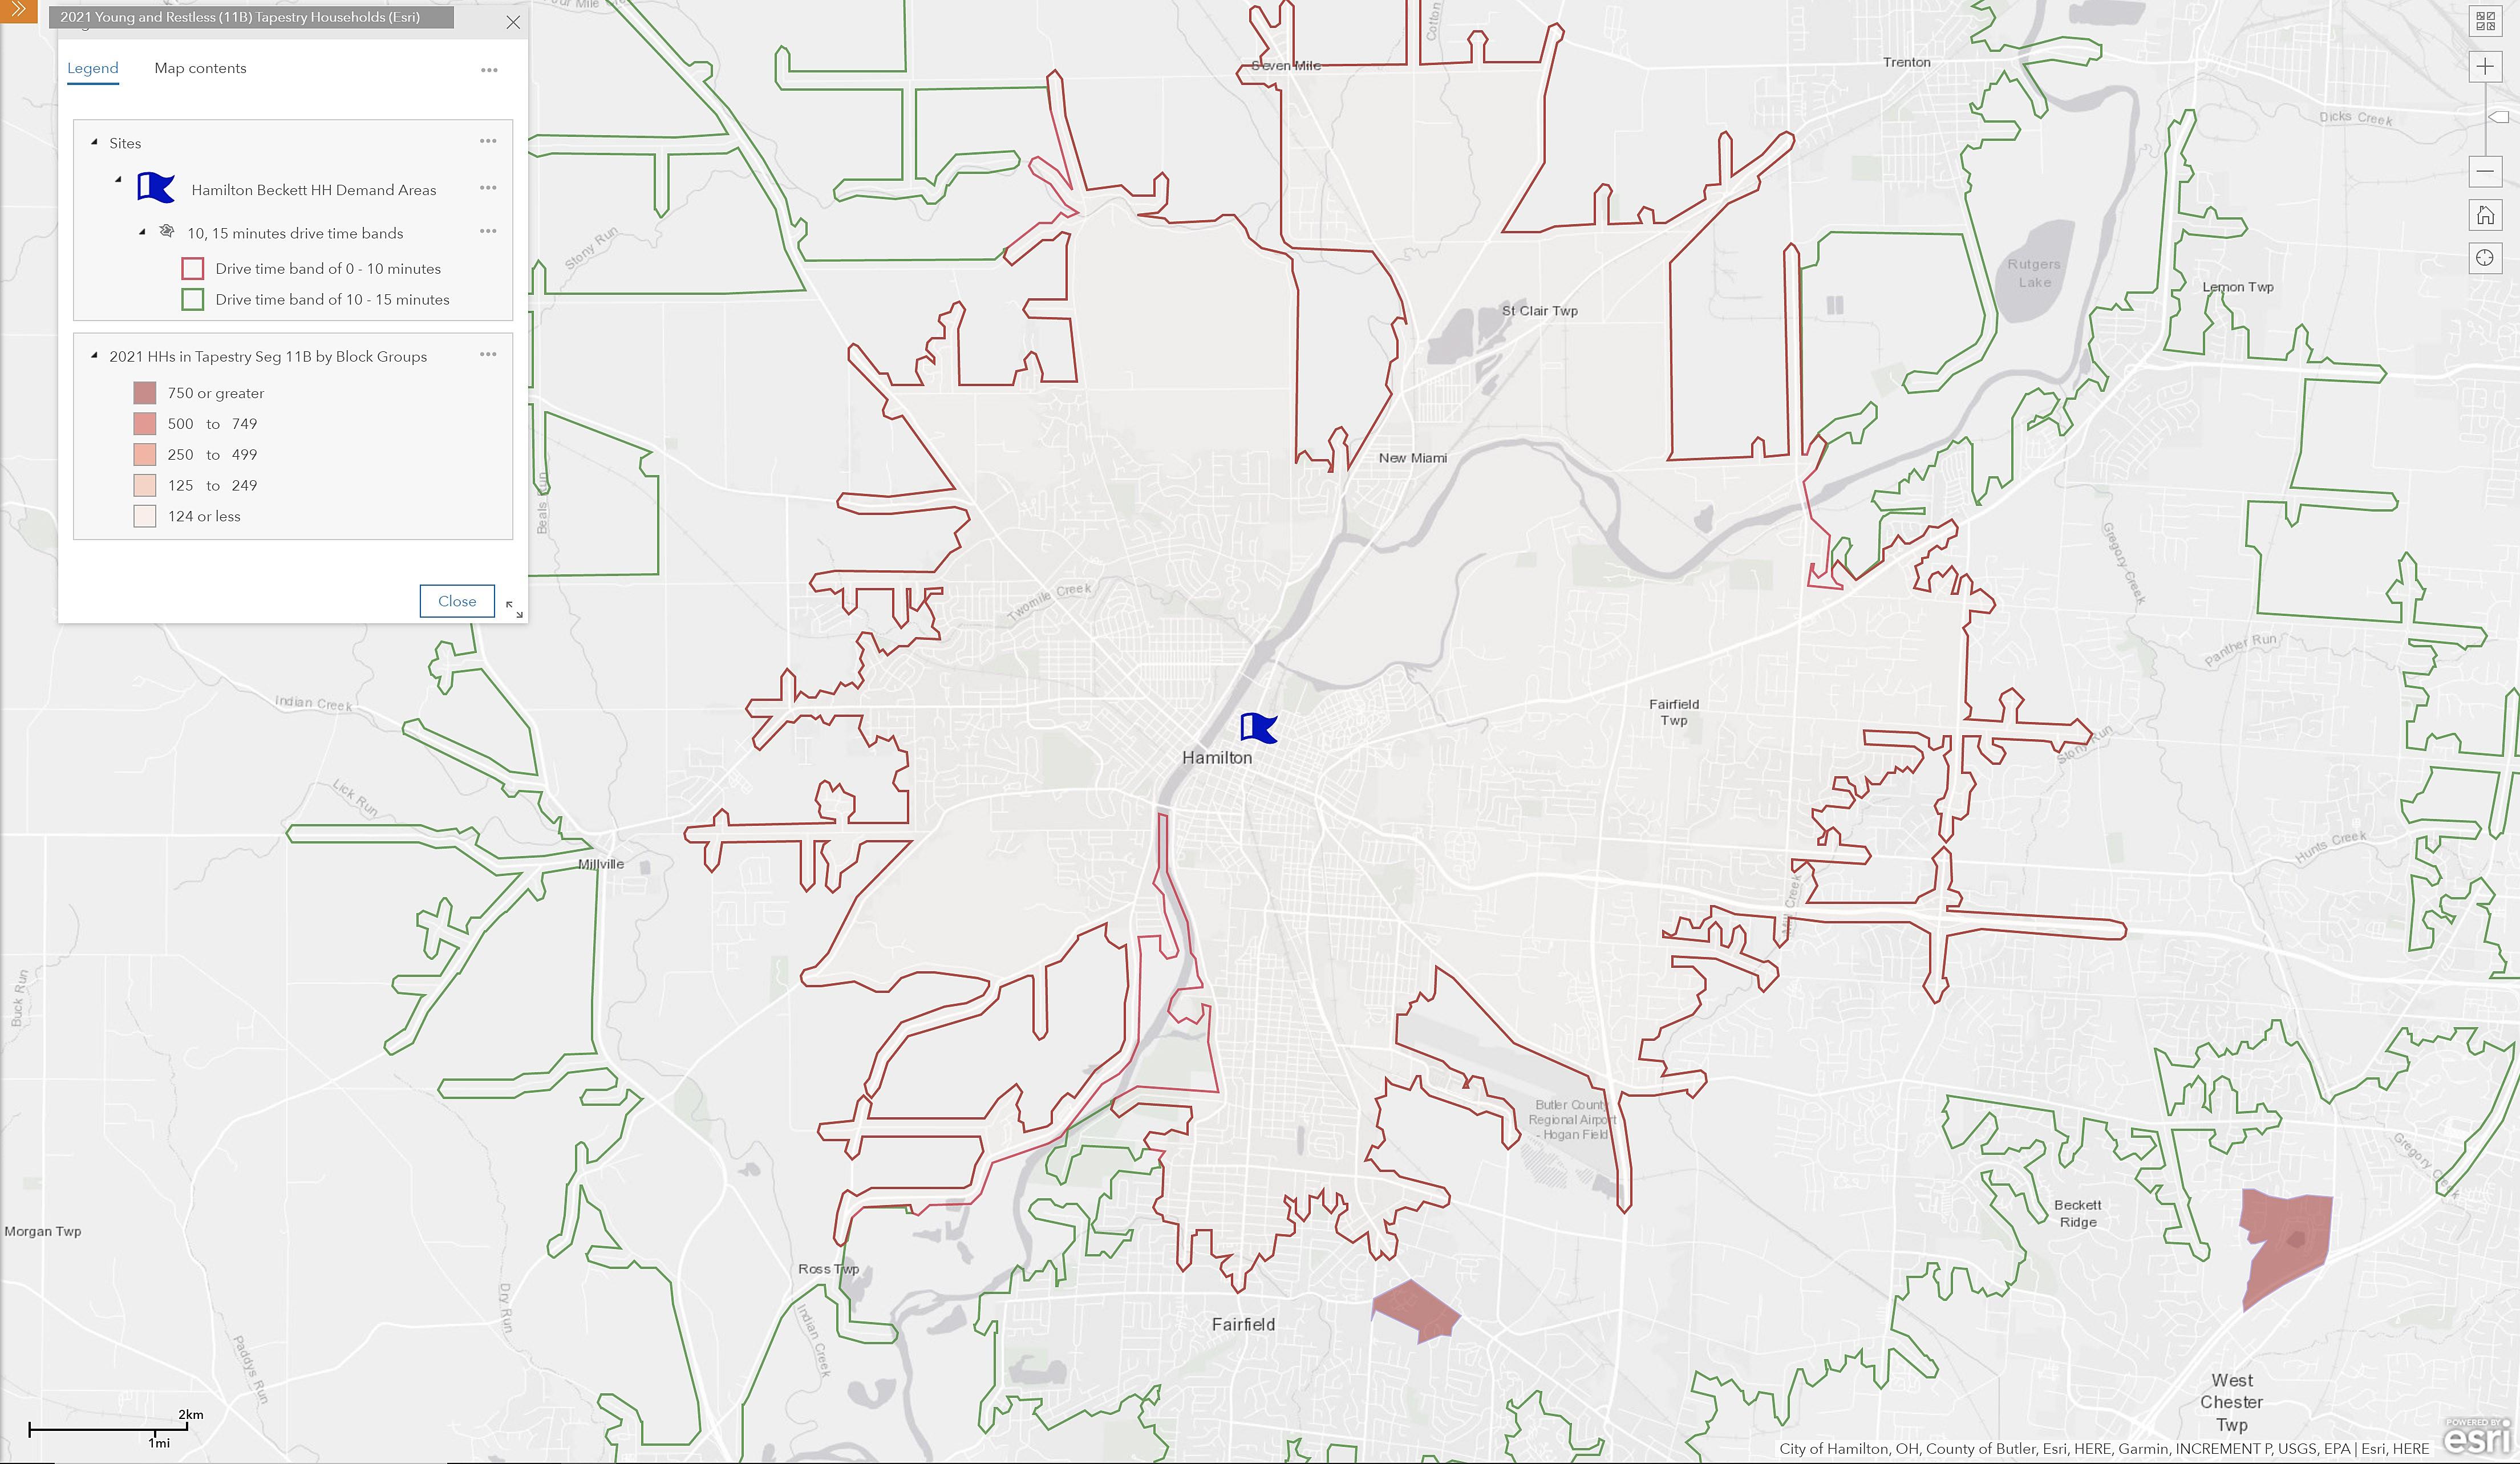
0 Dorms to Diplomas (14C) 0 0.0% 0 0 0.0% 0 College Towns (14B) 0 0.0% 0 0 0.0% 0 Military Proximity (14A) 0 0.0% 0 0 0.0% 14. Scholars and Patriots 0 0.0% 0 0 0.0% 0 0 High Rise Renters (13E) 0 0.0% 0 0 0.0% 0 Fresh Ambitions (13D) 194 0.5% 82 0 0.0% 0 NeWest Residents (13C) 0 0.0% 0 0 0.0% 0 Family Extensions (13B) 0 0.0% 0 0 0.0% 0 Diverse Convergence (13A) 0 0.0% 0 0 0.0% 0 13. Next Wave 194 0.5% 14 0 0.0% 0 Modest Income Homes (12D) 351 0.9% 73 0 0.0% 157 Small Town Simplicity (12C) 768 2.0% 112 0 0.0% 0 Traditional Living (12B) 4,876 13.0% 684 1,042 3.0% 50 Family Foundations (12A) 0 0.0% 0 0 0.0% 0 12. Hometown 5,995 16.0% 265 1,042 3.0% 0 City Commons (11E) 444 1.2% 136 0 0.0% 1 Set to Impress (11D) 850 2.3% 164 0 0.0% 0 Metro Fusion (11C) 1,418 3.8% 269 6 0.0% 0 Young and Restless (11B) 0 0.0% 0 878 2.5% 143 City Strivers (11A) 0 0.0% 0 0 0.0% 11. Midtown Singles 2,712 7.2% 117 884 2.5% 41 157 Rural Bypasses (10E) 0 0.0% 0 0 0.0% 0 Down the Road (10D) 54 0.1% 12 637 1.8% 0 Economic BedRock (10C) 0 0.0% 0 0 0.0% 0 Rooted Rural (10B) 0 0.0% 0 0 0.0% 23 Southern Satellites (10A) 212 0.6% 18 23 0.1% 2 10. Rustic Outposts 266 0.7% 9 660 1.9% 0 Social Security Set (9F) 290 0.8% 96 0 0.0% 0 Retirement Communities (9E) 2,707 7.2% 601 16 0.0% 4 Senior Escapes (9D) 0 0.0% 0 0 0.0% 0 The Elders (9C) 0 0.0% 0 0 0.0% 0 Golden Years (9B) 0 0.0% 0 0 0.0% 1 Silver & Gold (9A) 0 0.0% 0 0 0.0% 0 9. Senior Styles 2,997 8.0% 138 16 0.0% 78 Hometown Heritage (8G) 5,930 15.8% 1,327 324 0.9% 103 Old and Newcomers (8F) 603 1.6% 70 0 0.0% 0 Front Porches (8E) 375 1.0% 64 565 1.6% 250 Downtown Melting Pot (8D) 0 0.0% 0 0 0.0% 0 Bright Young Professionals 0 0.0% 0 1,978 5.7% 0 Emerald City (8B) 0 0.0% 0 0 0.0% 0 City Lights (8A) 0 0.0% 0 0 0.0% 8. Middle Ground 6,908 18.4% 170 2,867 8.2% 76 Index Total: 37,584 100.0% 34,931 100.0% Tapestry LifeMode Groups 2021 Households 0-10min Drive 2021 Households 10-15min Drive Number Percent Index Number Percent Hamilton Beckett HH Demand Areas Market Foresight, Inc. 339 Village St, Hamilton, Ohio, 45011 Latitude: 39.40355 Longitude: -84.55679
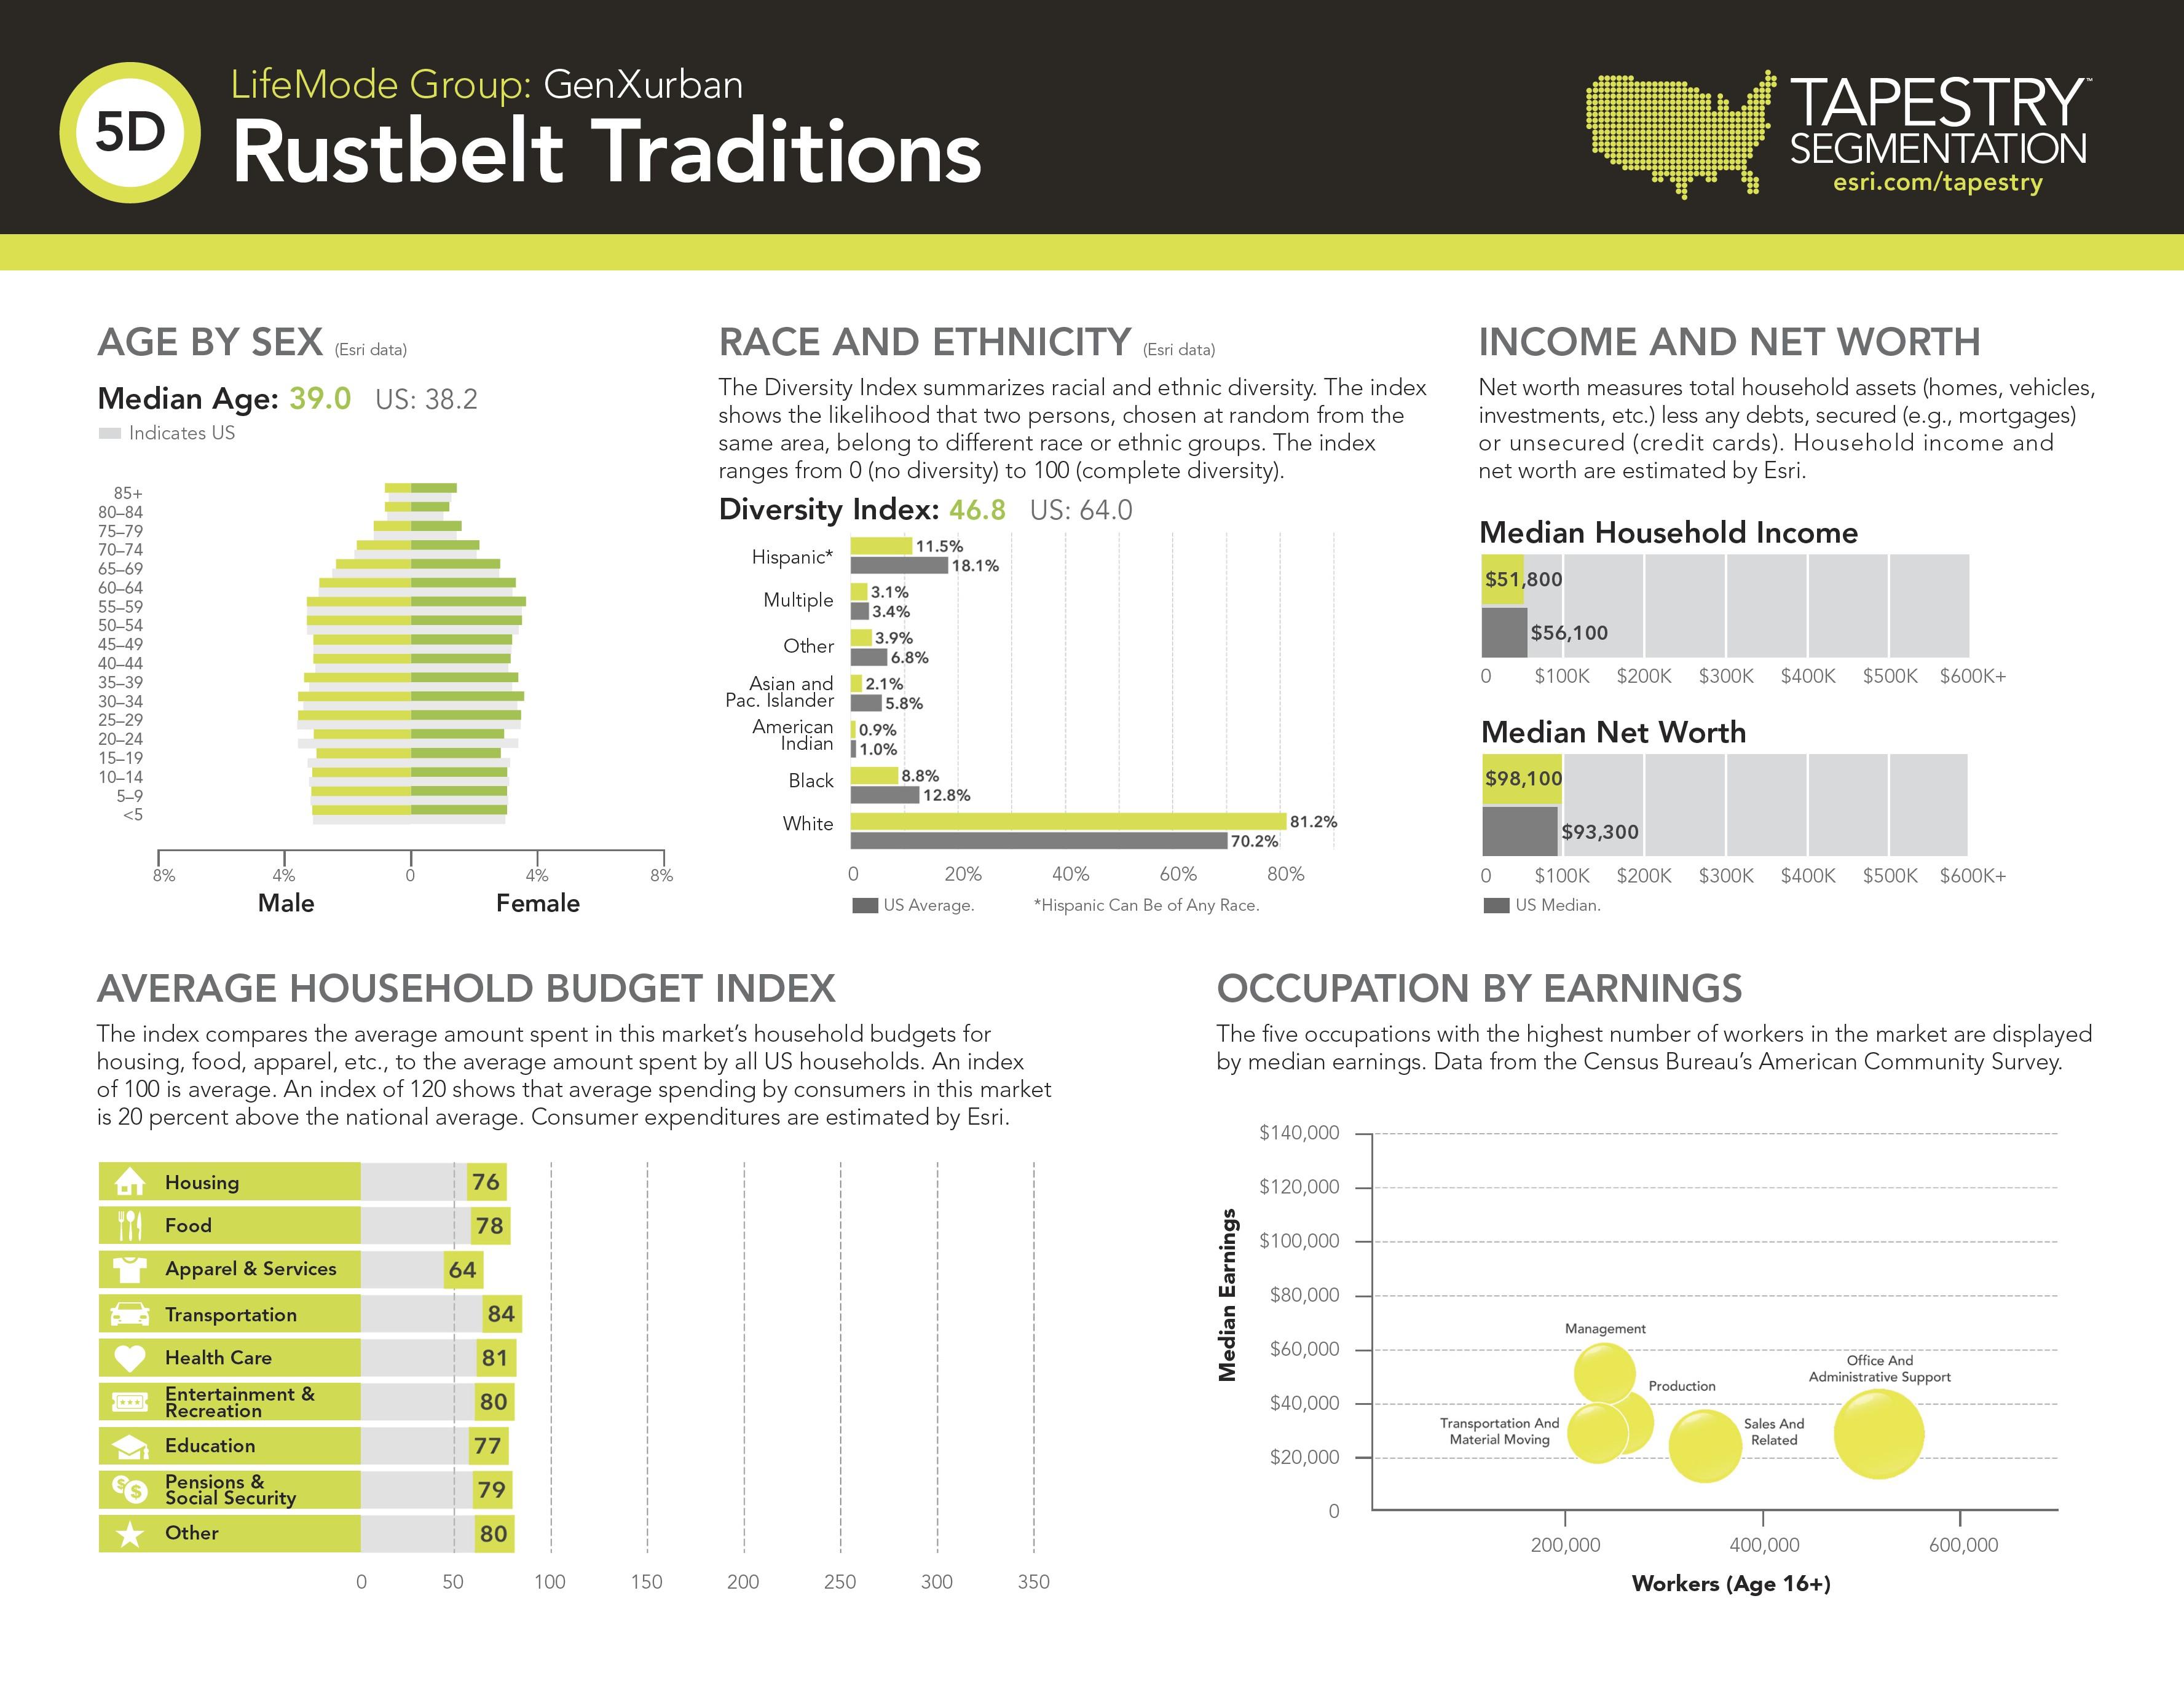
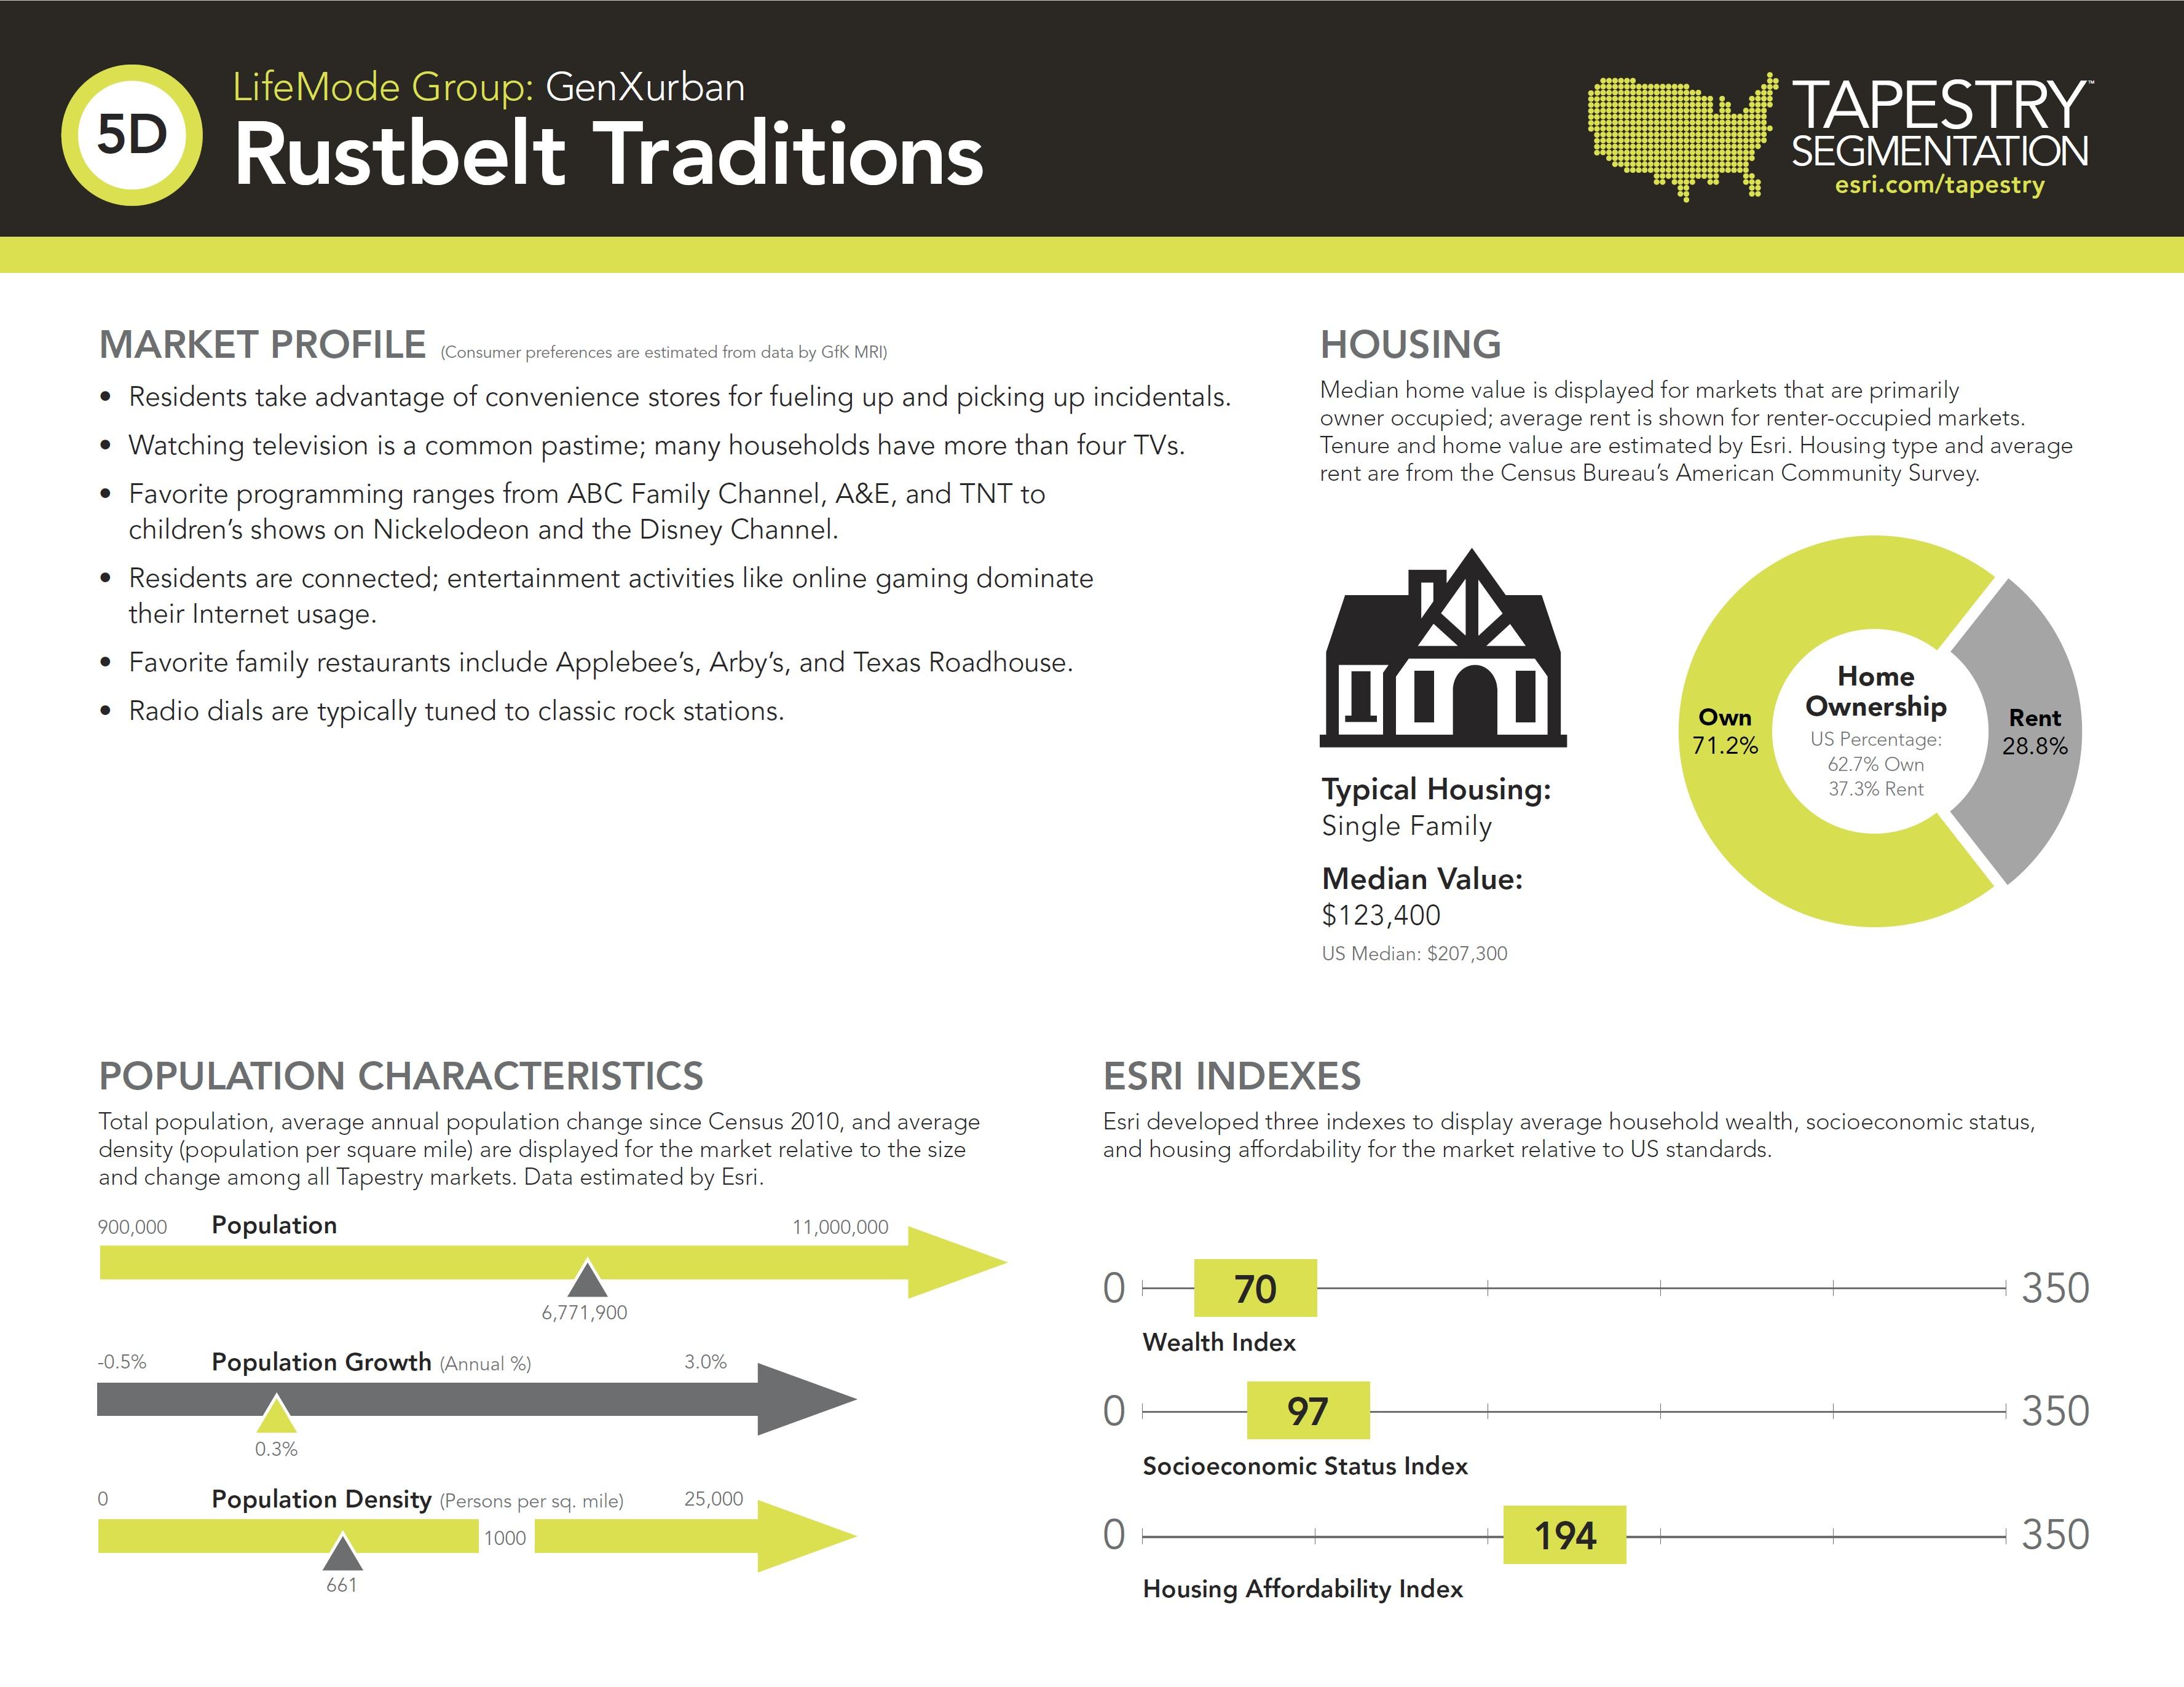
-
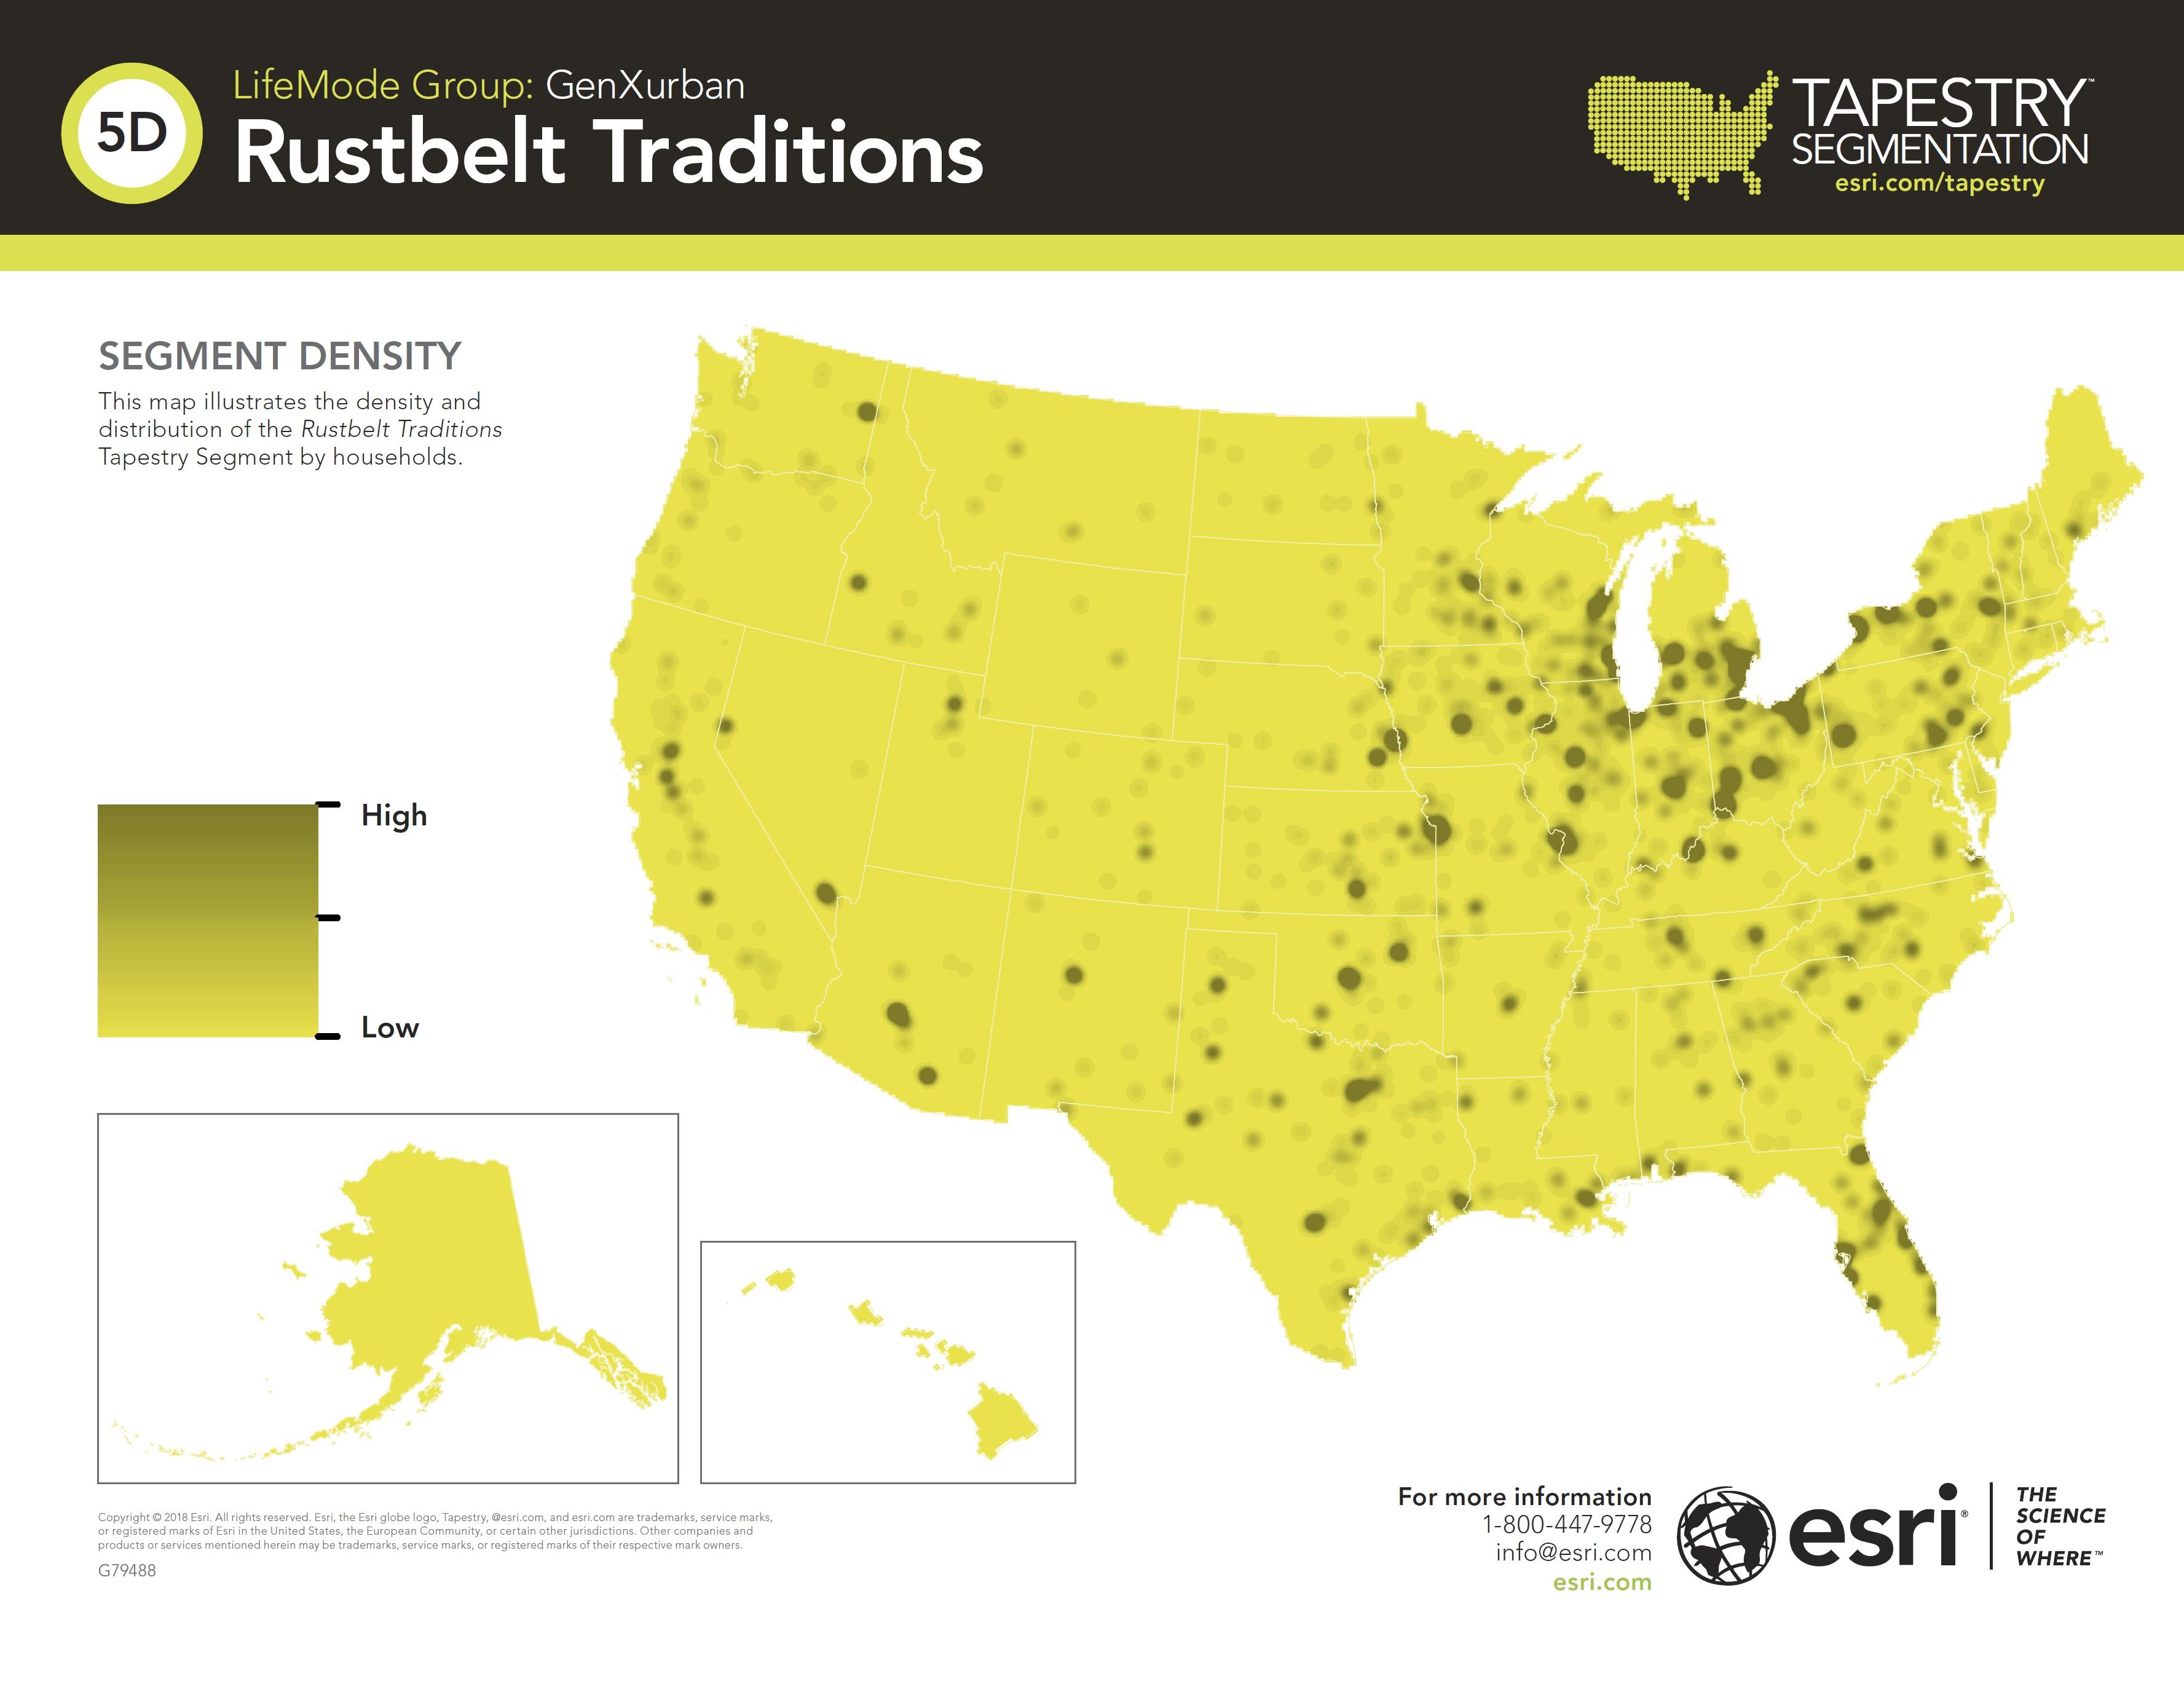
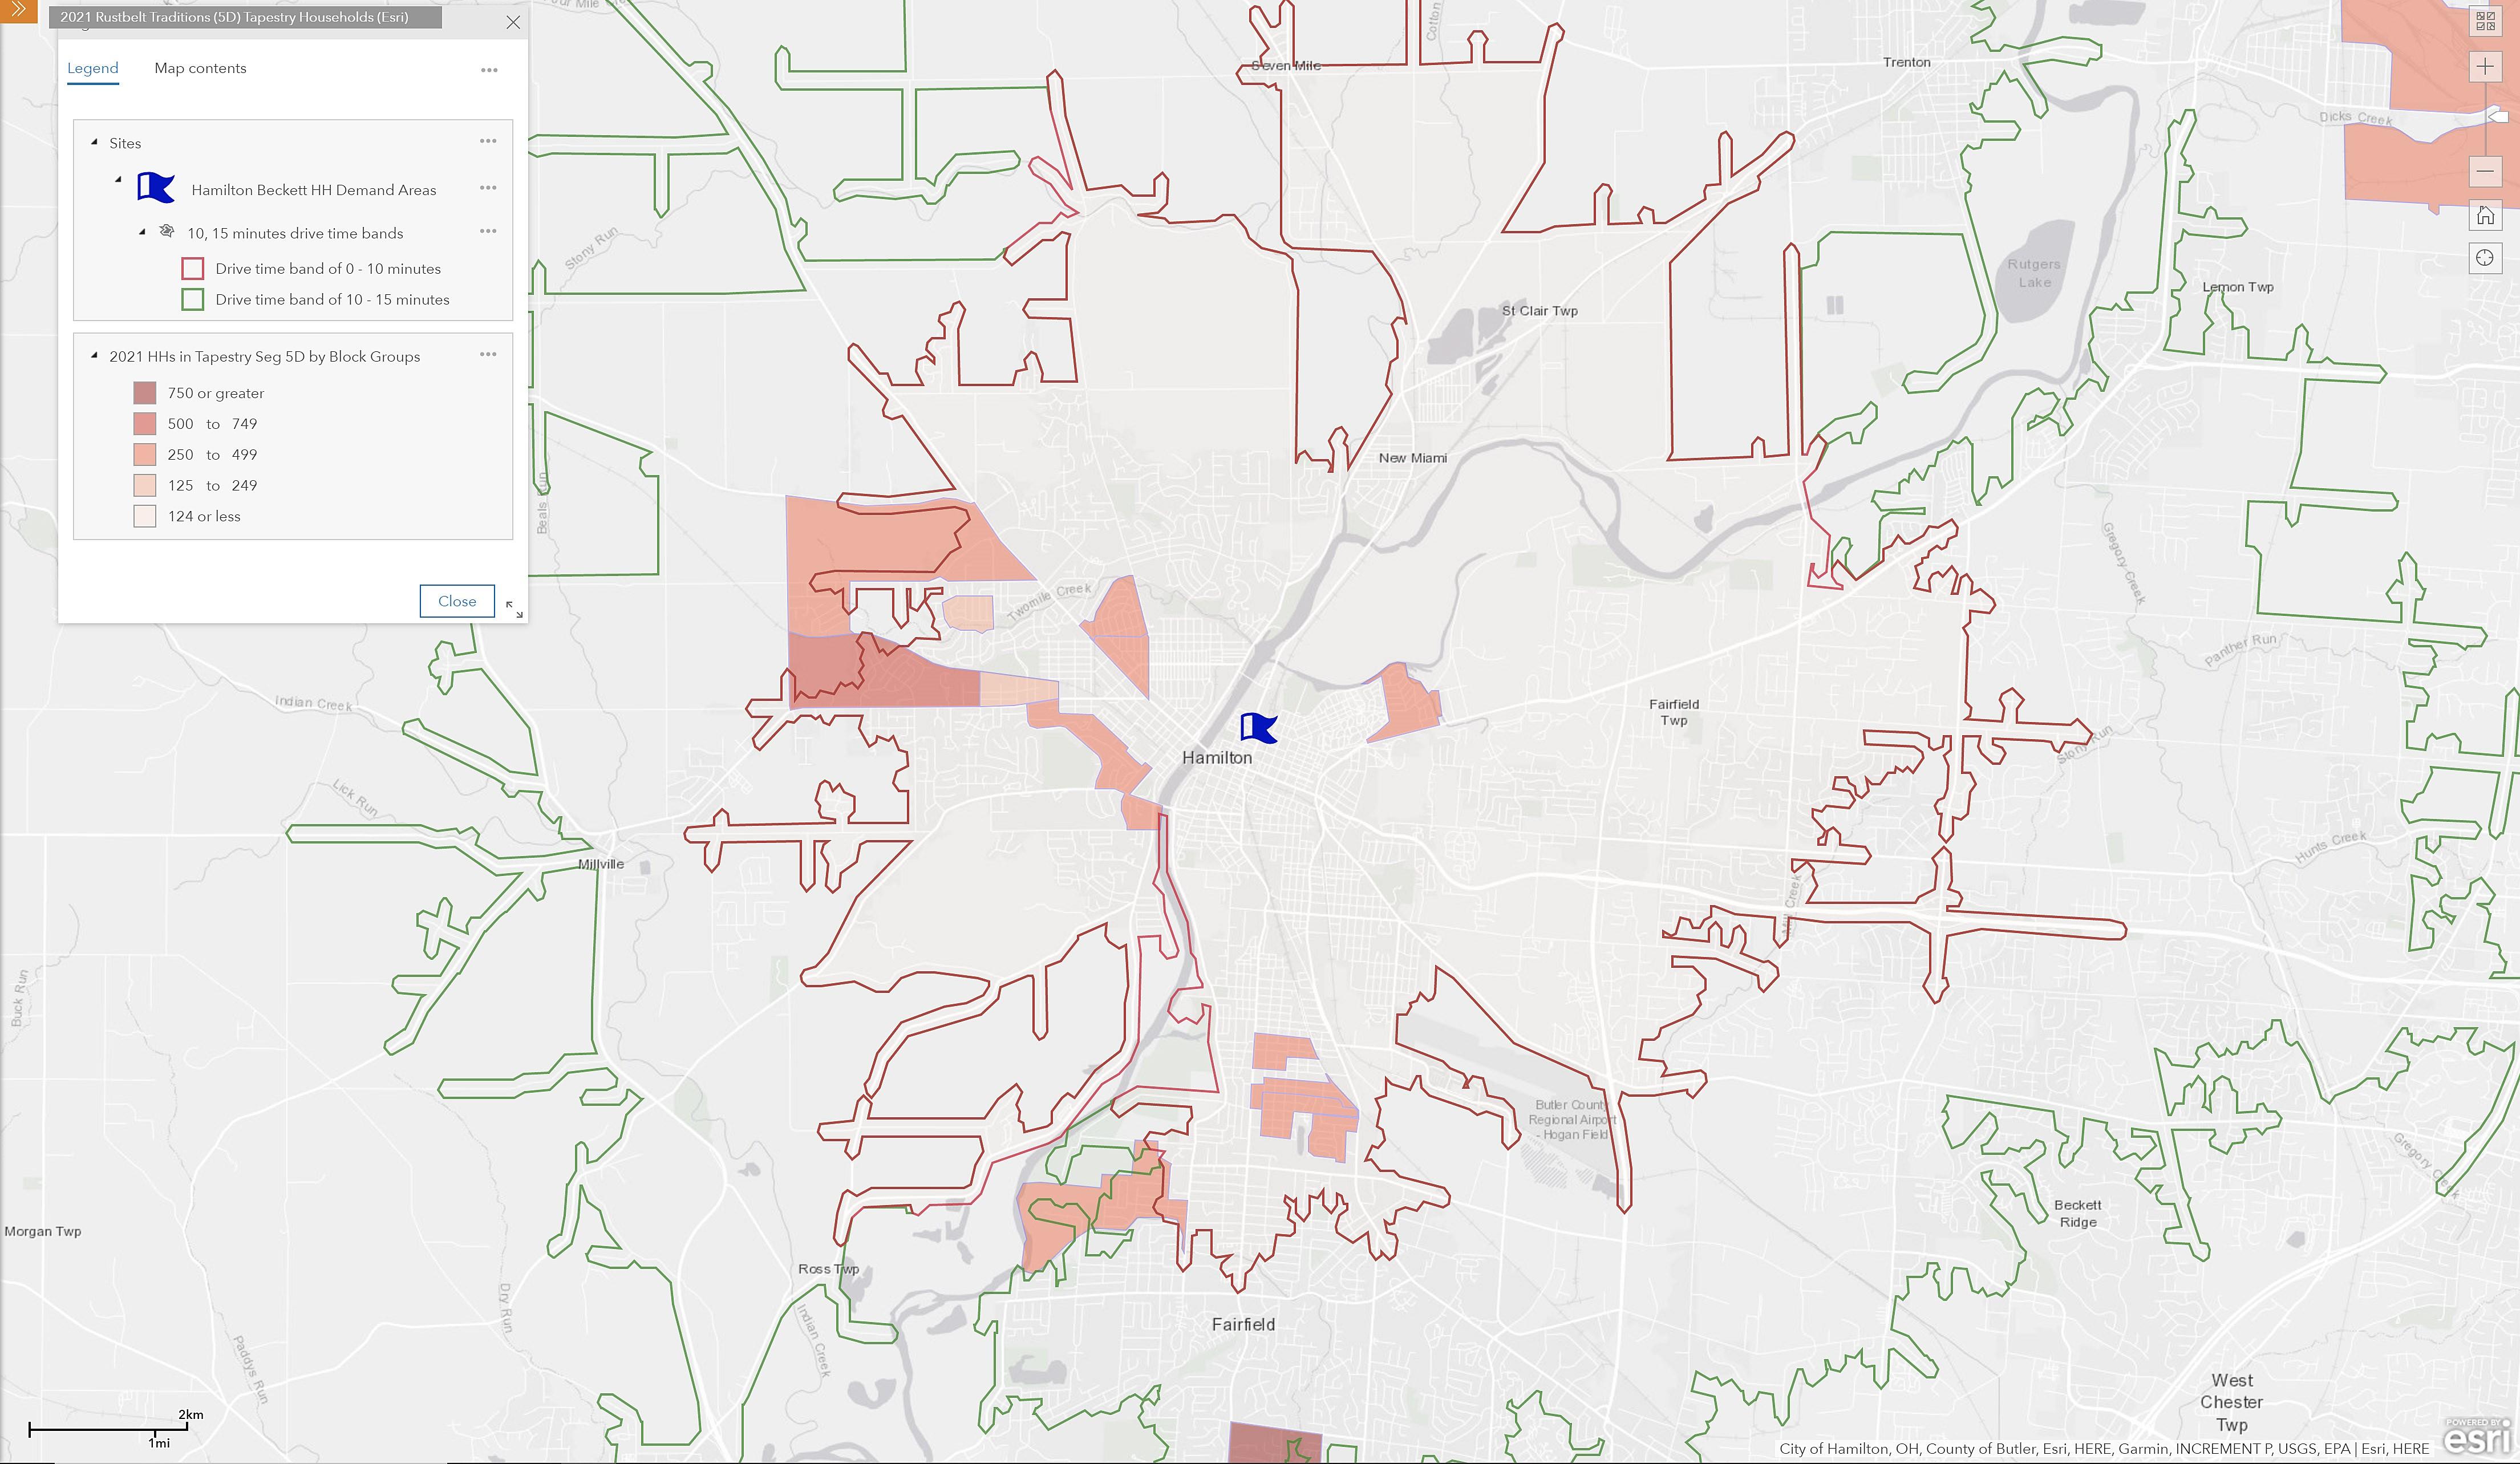
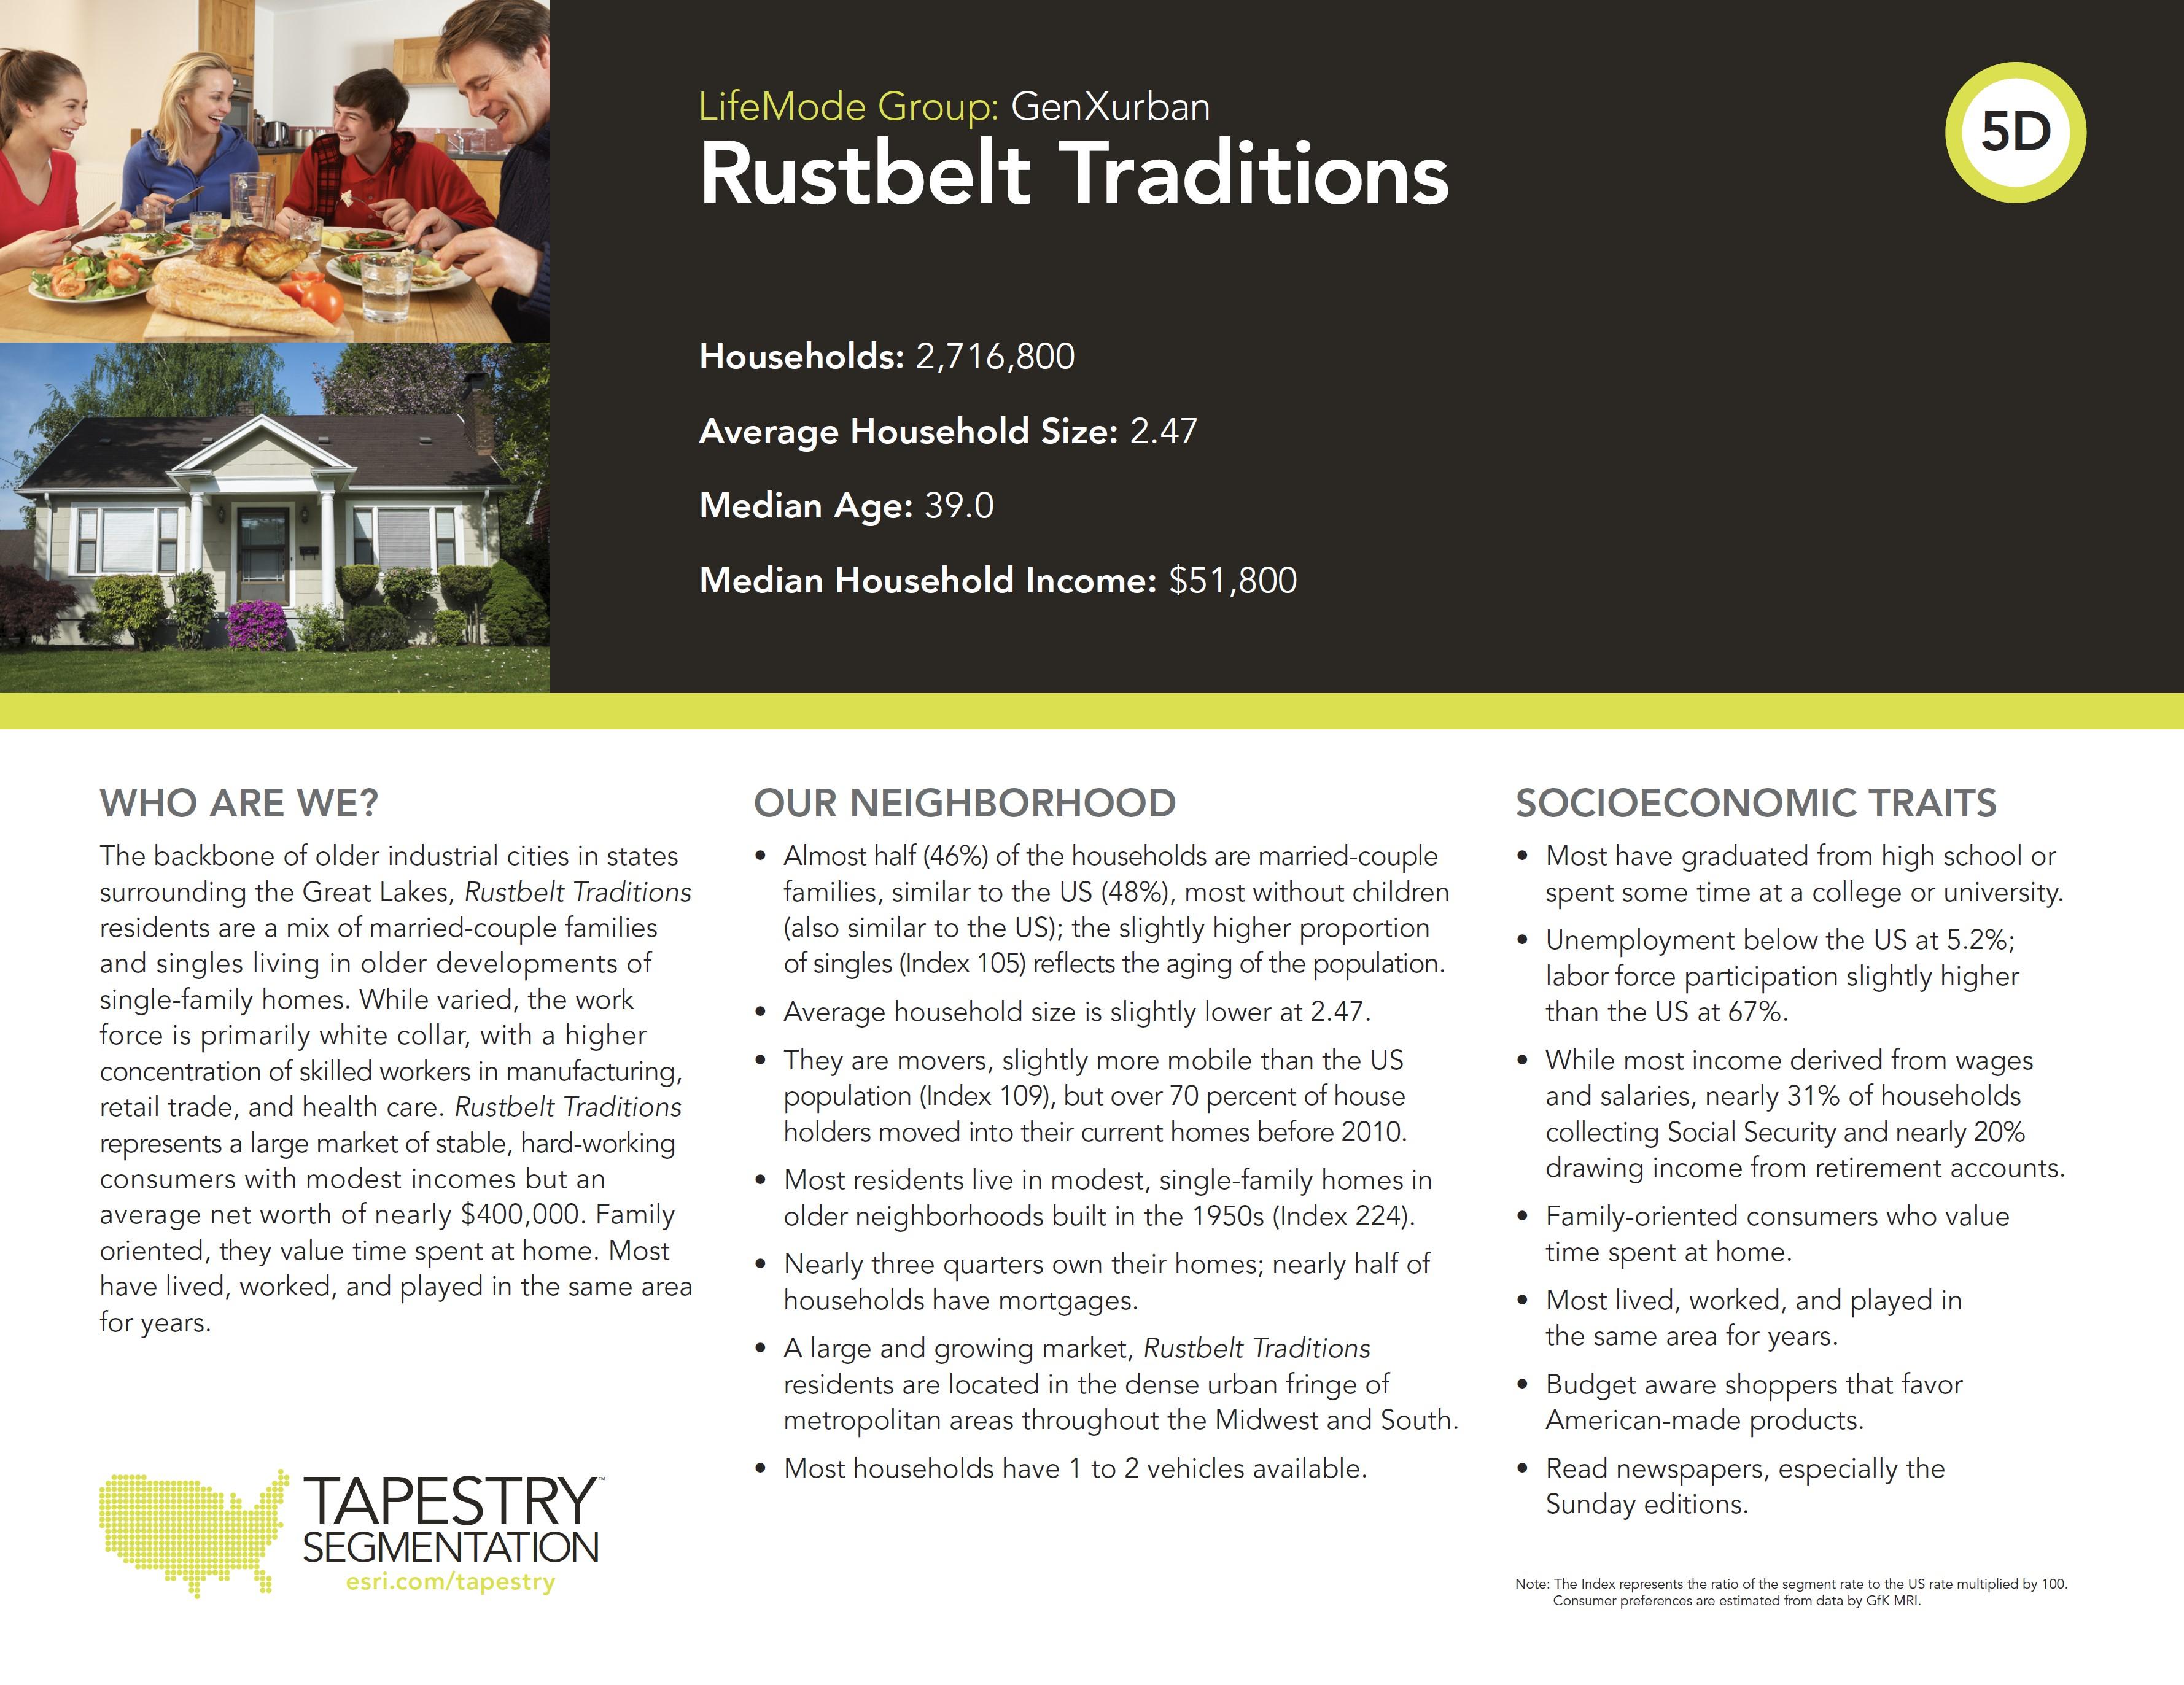
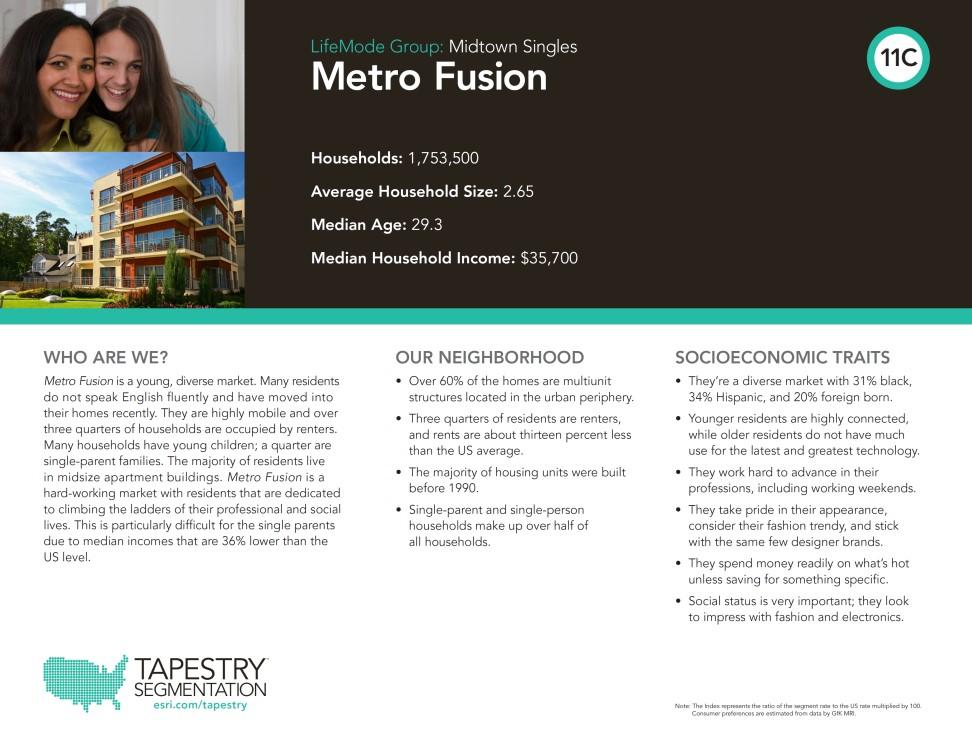
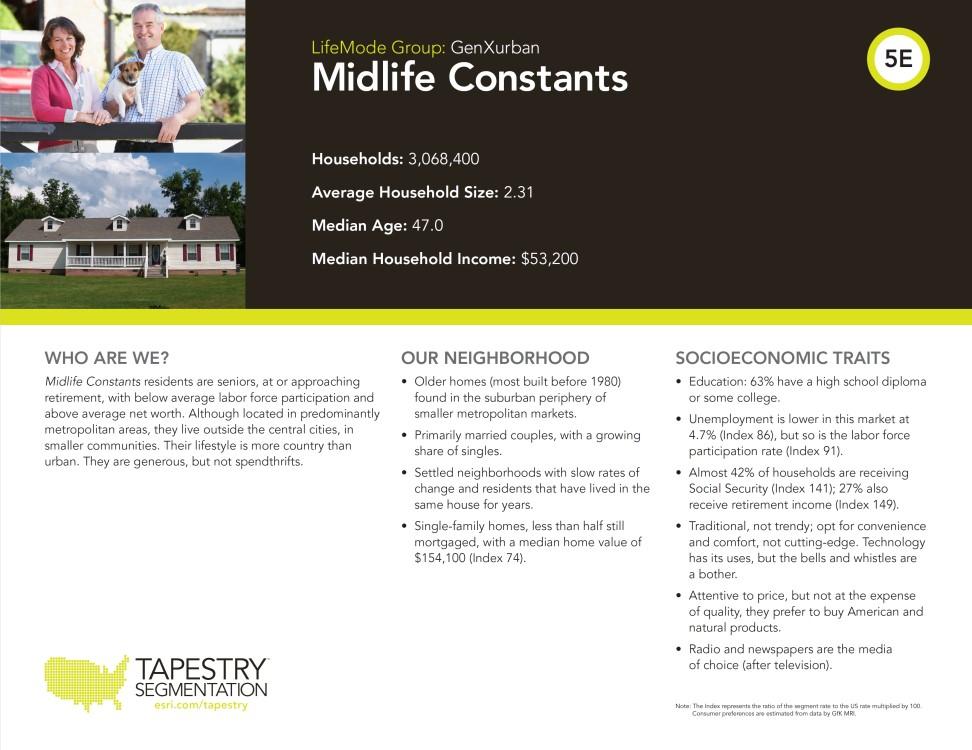
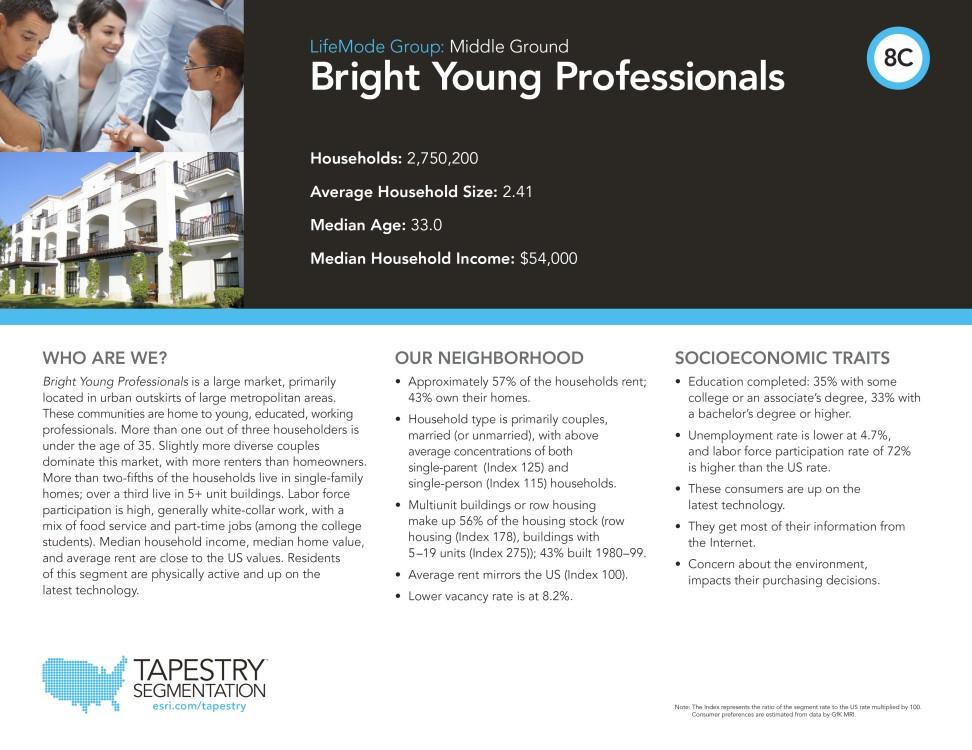
–TAPESTRYMARKETSEGMENTS ComfyEmpty Parks & Rustbelt Midlife Green Saltof Heartland BrightYoung Front Old & Young& Metro Setto Traditional SmallTown 15 alldatafor 2021 Nesters Rec Traditions Constants Acres the Earth Communities Professionals Porches Newcomers Restless Fusion Impress Living Simplicity LifeModeGroup GenXUrban GenXUrban GenXUrban GenXUrban CozyCountryLvg CozyCountryLvg CozyCountryLvg MiddleGround MiddleGround MiddleGround MidtownSingles MidtownSingles MidtownSingles Hometown Hometown TapestrySegmentCode 5A 5C 5D 5E 6A 6B 6F 8C 8E 8F 11B 11C 11D 12B 12C MedianHHIncome 82,300 69,300 57,400 59,100 86,100 64,600 49,800 61,000 51,400 51,200 49,500 41,700 39,400 44,500 36,600 2017MedianHHIncome 75,000 60,000 51,800 53,200 76,800 56,300 42,400 54,000 43,700 44,900 40,500 35,700 32,800 39,300 31,500 4-Yearnationaltrend 9.7% 15.5% 10.8% 11.1% 12.1% 14.7% 17.5% 13.0% 17.6% 14.0% 22.2% 16.8% 20.1% 13.2% 16.2% MedianAgeHeadHholder 49 42 40 48 45 45 43 34 36 40 30 30 35 36 41 11yrAnnualizedGrowth 0.4% 0.3% 0.2% 0.3% 0.9% 0.3% 0.0% 1.1% 0.5% 0.5% 1.2% 0.8% 0.5% 0.1% 0.1% General AttachedShare 12% 32% 20% 24% 13% 16% 23% 60% 52% 57% 89% 76% 68% 24% 39% General Rental Share 12% 28% 27% 25% 13% 16% 29% 54% 50% 52% 85% 73% 70% 39% 47% COREHOUSEHOLDERS10min 1,012 61 3,823 3,479 694 724 792 - 375 603 - 1,418 850 4,876 768 19,475 CoreRenterEligible 122 17 1,025 873 87 113 226 - 188 312 - 1,037 595 1,887 364 1 SCIDrillDownFactor 5.0% 6.0% 7.0% 5.0% 5.0% 5.0% 7.0% 10.0% 8.0% 9.0% 11.0% 10.0% 10.0% 7.0% 7.0% CoreRenterPool 129 18 1,096 917 92 119 242 - 203 340 - 1,140 655 2,019 390 7,359 2 MedianHHIncomeadj 2% -4% 4% 3% -7% 13% 19% -2% -15% 8% -8% 20% -41% 19% 16% 3 TargetIncomeQualified 89% 81% 76% 77% 88% 85% 76% 77% 60% 73% 62% 68% 19% 71% 58% 4 AnnualCoreRenterGrowth 0.4% 0.3% 0.2% 0.3% 0.9% 0.3% 0.0% 1.1% 0.5% 0.5% 1.2% 0.8% 0.5% 0.1% 0.1% 68% Core TargetRenters 116 15 841 712 82 101 184 - 124 250 - 781 125 1,434 227 4,992 13,382 37% 13 11 2 4 14 10 12 5 9 7 6 3 15 1 8 NETOUTERHOUSEHOLDERS15min 2,492 1,932 1,172 422 1,993 2,226 216 1,978 565 - 878 6 - 1,042 - 14,922 TotalOuterHouseholders 3,504 1,993 4,995 3,901 2,687 2,950 1,008 1,978 940 603 878 1,424 850 5,918 768 34,397 4 7 2 3 6 5 10 8 11 15 12 9 13 1 14 OuterRenterEligible 302 541 314 106 251 347 62 1,062 284 - 745 4 - 403 - 4,420 OuterRenterPool 317 573 336 111 264 365 66 1,168 306 - 826 5 - 431 - 4,769 NetOuterQualifiedRenters 285 469 258 86 235 310 50 912 186 - 524 3 - 307 - 3,626 DrawntoCoreMarket 30% 40% 50% 30% 35% 35% 35% 65% 50% 50% 65% 65% 65% 40% 30% 37% NetOuterTargetRenters 85 187 129 26 82 108 18 593 93 - 341 2 - 123 - 1,788 7,884 22.7% 1 PerSocialCompactDrillDownSurveys 21,266 31.9% 2 Localincomeadjustmentfromnationalmedian 3 Sharewithhouseholdincomesover $37,500 thresholdrentsof $1,000 TopFourSegments 4,048 60% 4 Overdevelopmenttimelineof(yrs) 1.5 baserentfactor 32% TOTALQUALIFIEDRENTALHOUSEHOLDS 6,780
TAPESTRYMARKETSEGMENTS ComfyEmpty Parks & Rustbelt Midlife Green Saltof Heartland BrightYoung Front Old & Young& Metro Setto Traditional SmallTown 15 alldatafor 2021 Nesters Rec Traditions Constants Acres the Earth Communities Professionals Porches Newcomers Restless Fusion Impress Living Simplicity LifeModeGroup GenXUrban GenXUrban GenXUrban GenXUrban CozyCountryLvg CozyCountryLvg CozyCountryLvg MiddleGround MiddleGround MiddleGround MidtownSingles MidtownSingles MidtownSingles Hometown Hometown TapestrySegmentCode 5A 5C 5D 5E 6A 6B 6F 8C 8E 8F 11B 11C 11D 12B 12C MedianHHIncome 82,300 69,300 57,400 59,100 86,100 64,600 49,800 61,000 51,400 51,200 49,500 41,700 39,400 44,500 36,600 2017MedianHHIncome 75,000 60,000 51,800 53,200 76,800 56,300 42,400 54,000 43,700 44,900 40,500 35,700 32,800 39,300 31,500 4-Yearnationaltrend 9.7% 15.5% 10.8% 11.1% 12.1% 14.7% 17.5% 13.0% 17.6% 14.0% 22.2% 16.8% 20.1% 13.2% 16.2% MedianAgeHeadHholder 49 42 40 48 45 45 43 34 36 40 30 30 35 36 41 11yrAnnualizedGrowth 0.4% 0.3% 0.2% 0.3% 0.9% 0.3% 0.0% 1.1% 0.5% 0.5% 1.2% 0.8% 0.5% 0.1% 0.1% General AttachedShare 12% 32% 20% 24% 13% 16% 23% 60% 52% 57% 89% 76% 68% 24% 39% General Rental Share 12% 28% 27% 25% 13% 16% 29% 54% 50% 52% 85% 73% 70% 39% 47% COREHOUSEHOLDERS10min 1,012 61 3,823 3,479 694 724 792 - 375 603 - 1,418 850 4,876 768 19,475 CoreRenterEligible 122 17 1,025 873 87 113 226 - 188 312 - 1,037 595 1,887 364 1 SCIDrillDownFactor 5.0% 6.0% 7.0% 5.0% 5.0% 5.0% 7.0% 10.0% 8.0% 9.0% 11.0% 10.0% 10.0% 7.0% 7.0% CoreRenterPool 129 18 1,096 917 92 119 242 - 203 340 - 1,140 655 2,019 390 7,359 2 MedianHHIncomeadj 2% -4% 4% 3% -7% 13% 19% -2% -15% 8% -8% 20% -41% 19% 16% 3 TargetIncomeQualified 70% 57% 50% 51% 68% 63% 49% 50% 32% 46% 34% 40% 0% 43% 29% 4 AnnualCoreRenterGrowth 0.4% 0.3% 0.2% 0.3% 0.9% 0.3% 0.0% 1.1% 0.5% 0.5% 1.2% 0.8% 0.5% 0.1% 0.1% 41% Core TargetRenters 91 10 546 468 63 74 119 - 65 157 - 460 - 879 114 3,047 13,382 23% 7 10 2 3 12 9 11 5 14 8 6 4 15 1 13 NETOUTERHOUSEHOLDERS15min 2,492 1,932 1,172 422 1,993 2,226 216 1,978 565 - 878 6 - 1,042 - 14,922 TotalOuterHouseholders 3,504 1,993 4,995 3,901 2,687 2,950 1,008 1,978 940 603 878 1,424 850 5,918 768 34,397 4 7 2 3 6 5 10 8 11 15 12 9 13 1 14 OuterRenterEligible 302 541 314 106 251 347 62 1,062 284 - 745 4 - 403 - 4,420 OuterRenterPool 317 573 336 111 264 365 66 1,168 306 - 826 5 - 431 - 4,769 NetOuterQualifiedRenters 224 330 167 57 182 229 32 594 98 - 285 2 - 188 - 2,388 DrawntoCoreMarket 30% 40% 50% 30% 35% 35% 35% 65% 50% 50% 65% 65% 65% 40% 30% 24% NetOuterTargetRenters 67 132 84 17 64 80 11 386 49 - 185 1 - 75 - 1,152 7,884 14.6% 1 PerSocialCompactDrillDownSurveys 21,266 19.7% 2 Localincomeadjustmentfromnationalmedian 3 Sharewithhouseholdincomesover $60,000 thresholdrentsof $1,500 TopFourSegments 2,530 60% 4 Overdevelopmenttimelineof(yrs) 1.5 baserentfactor 30% TOTALQUALIFIEDRENTALHOUSEHOLDS 4,199

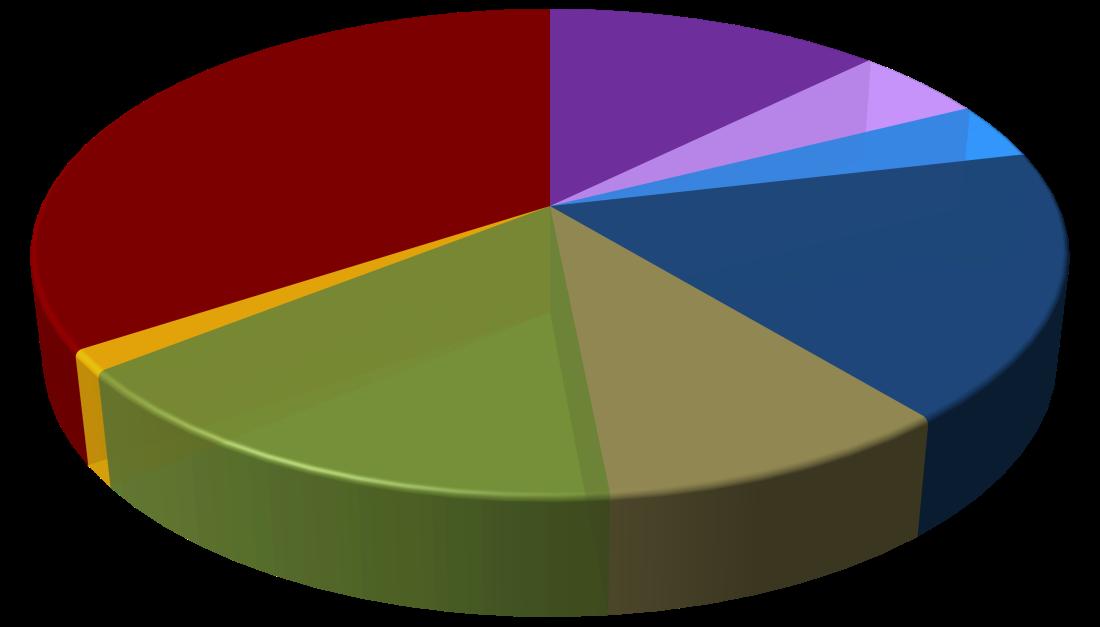
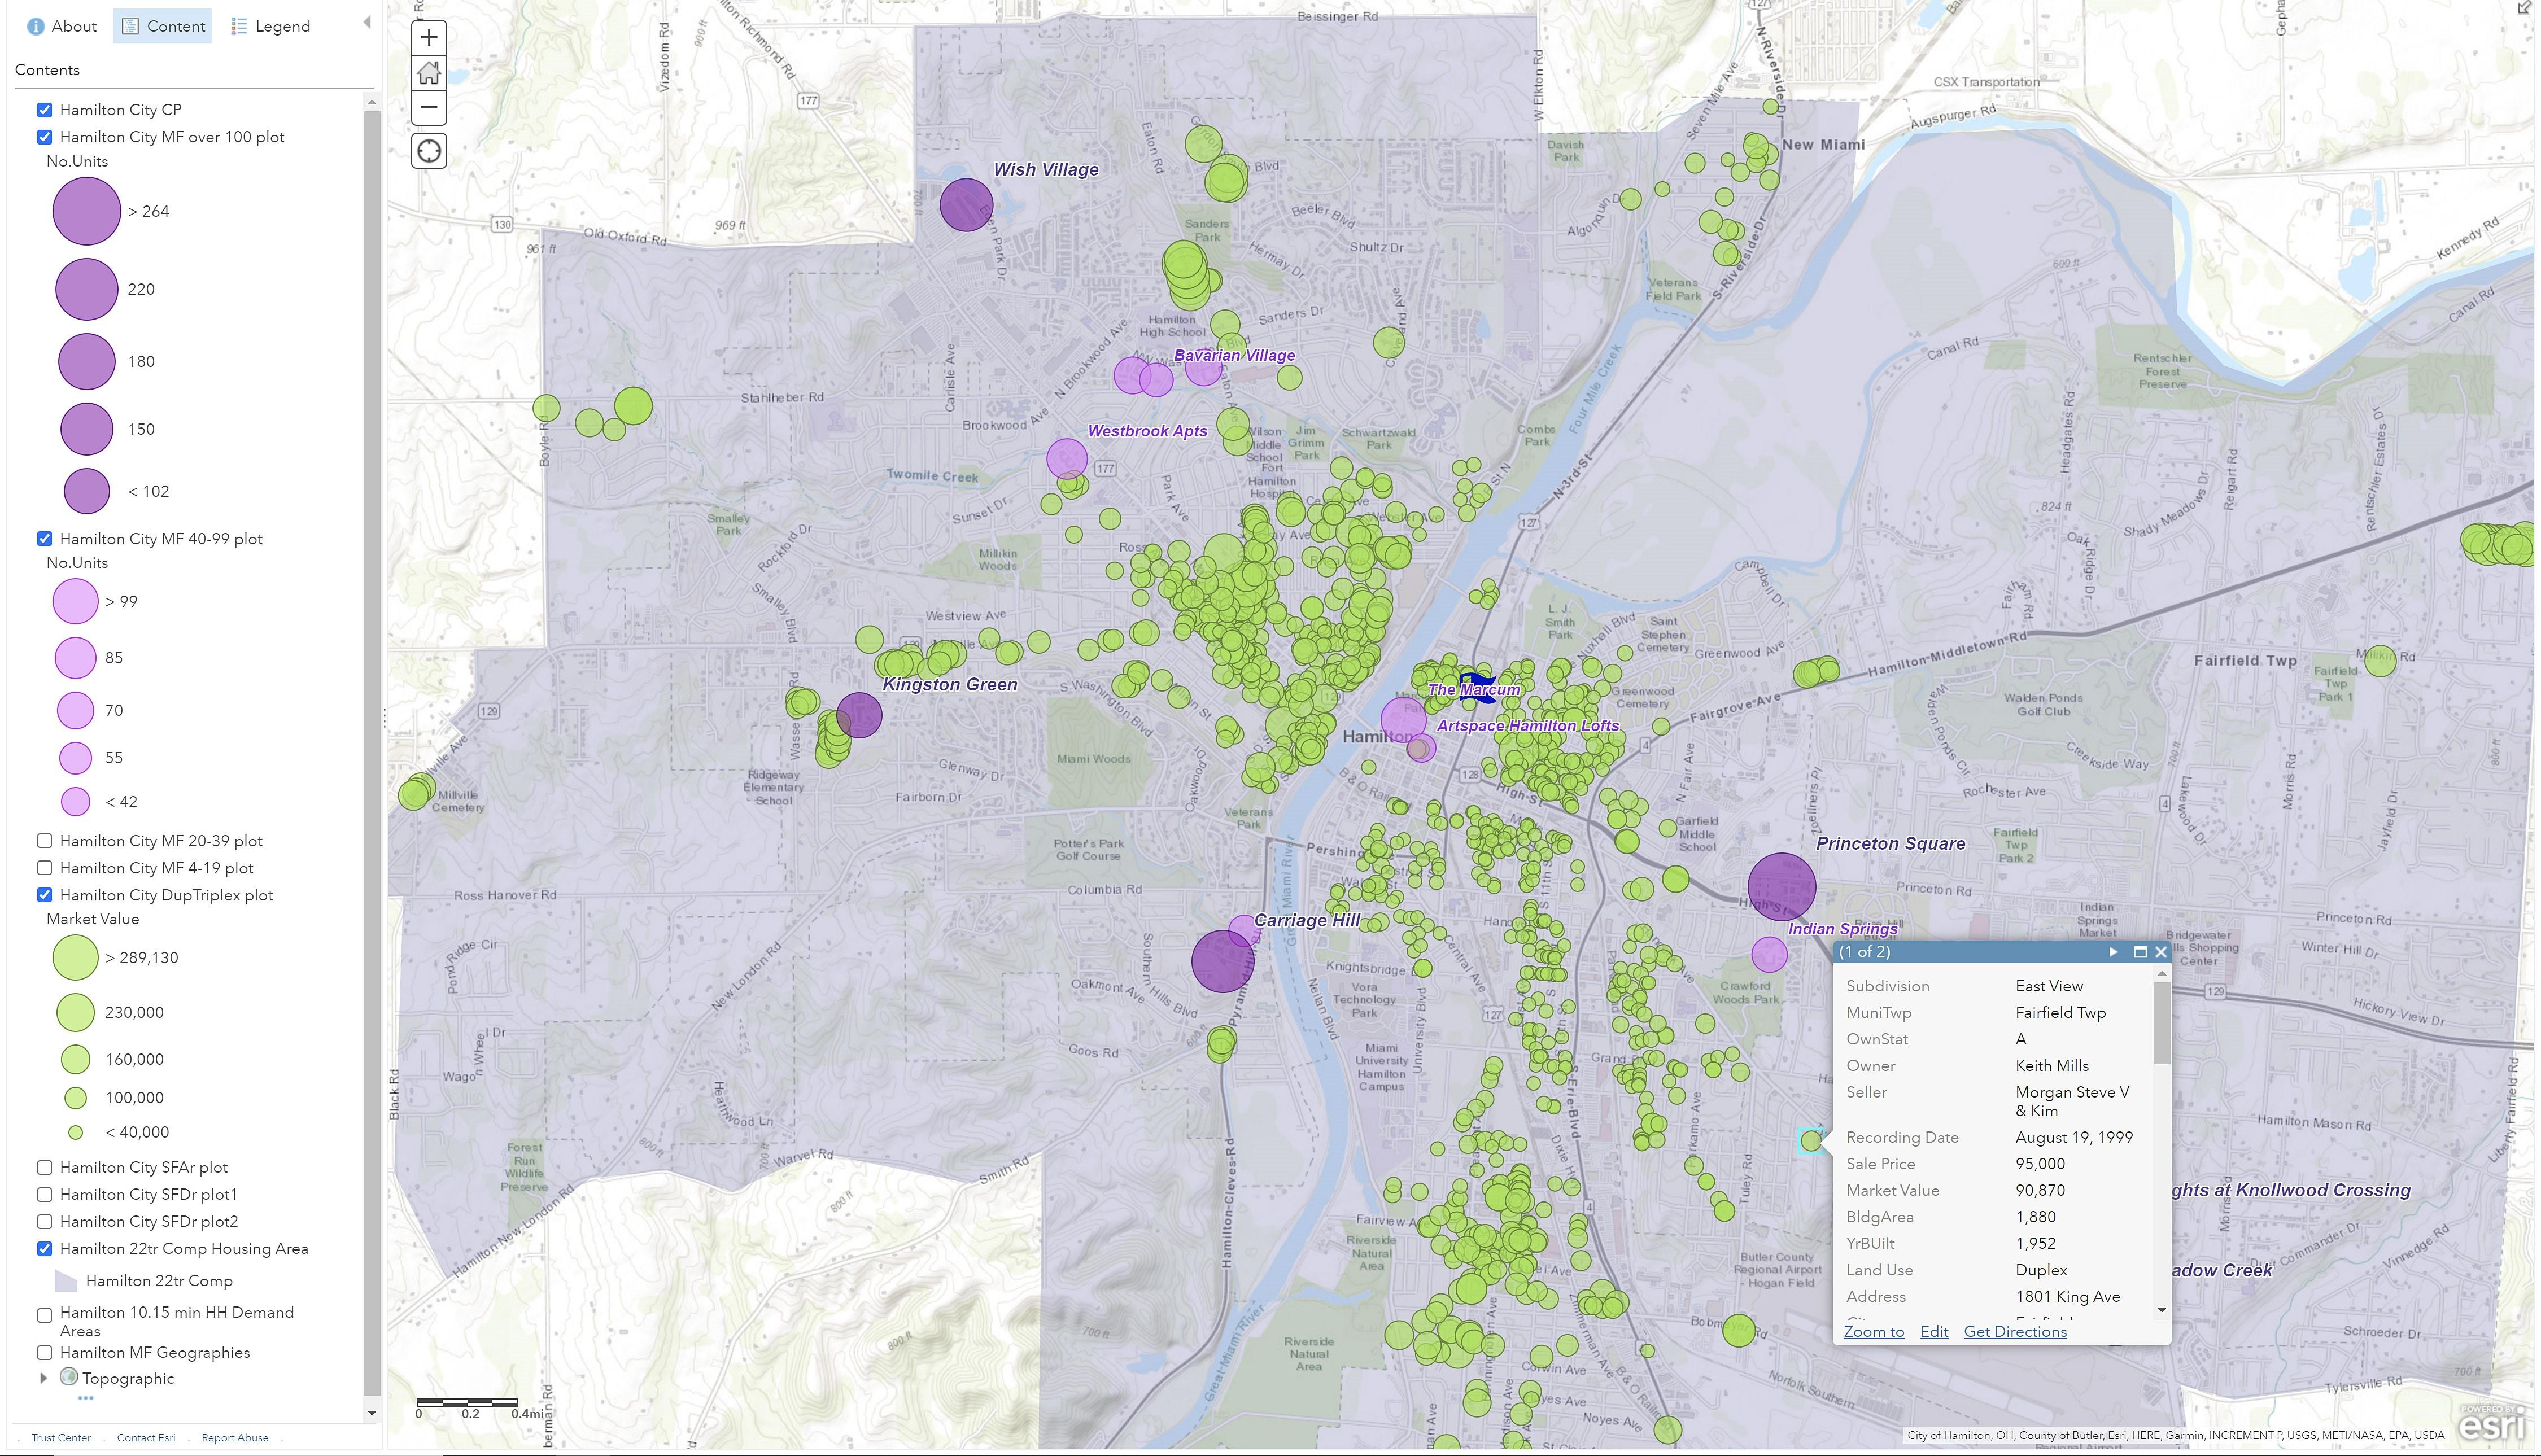
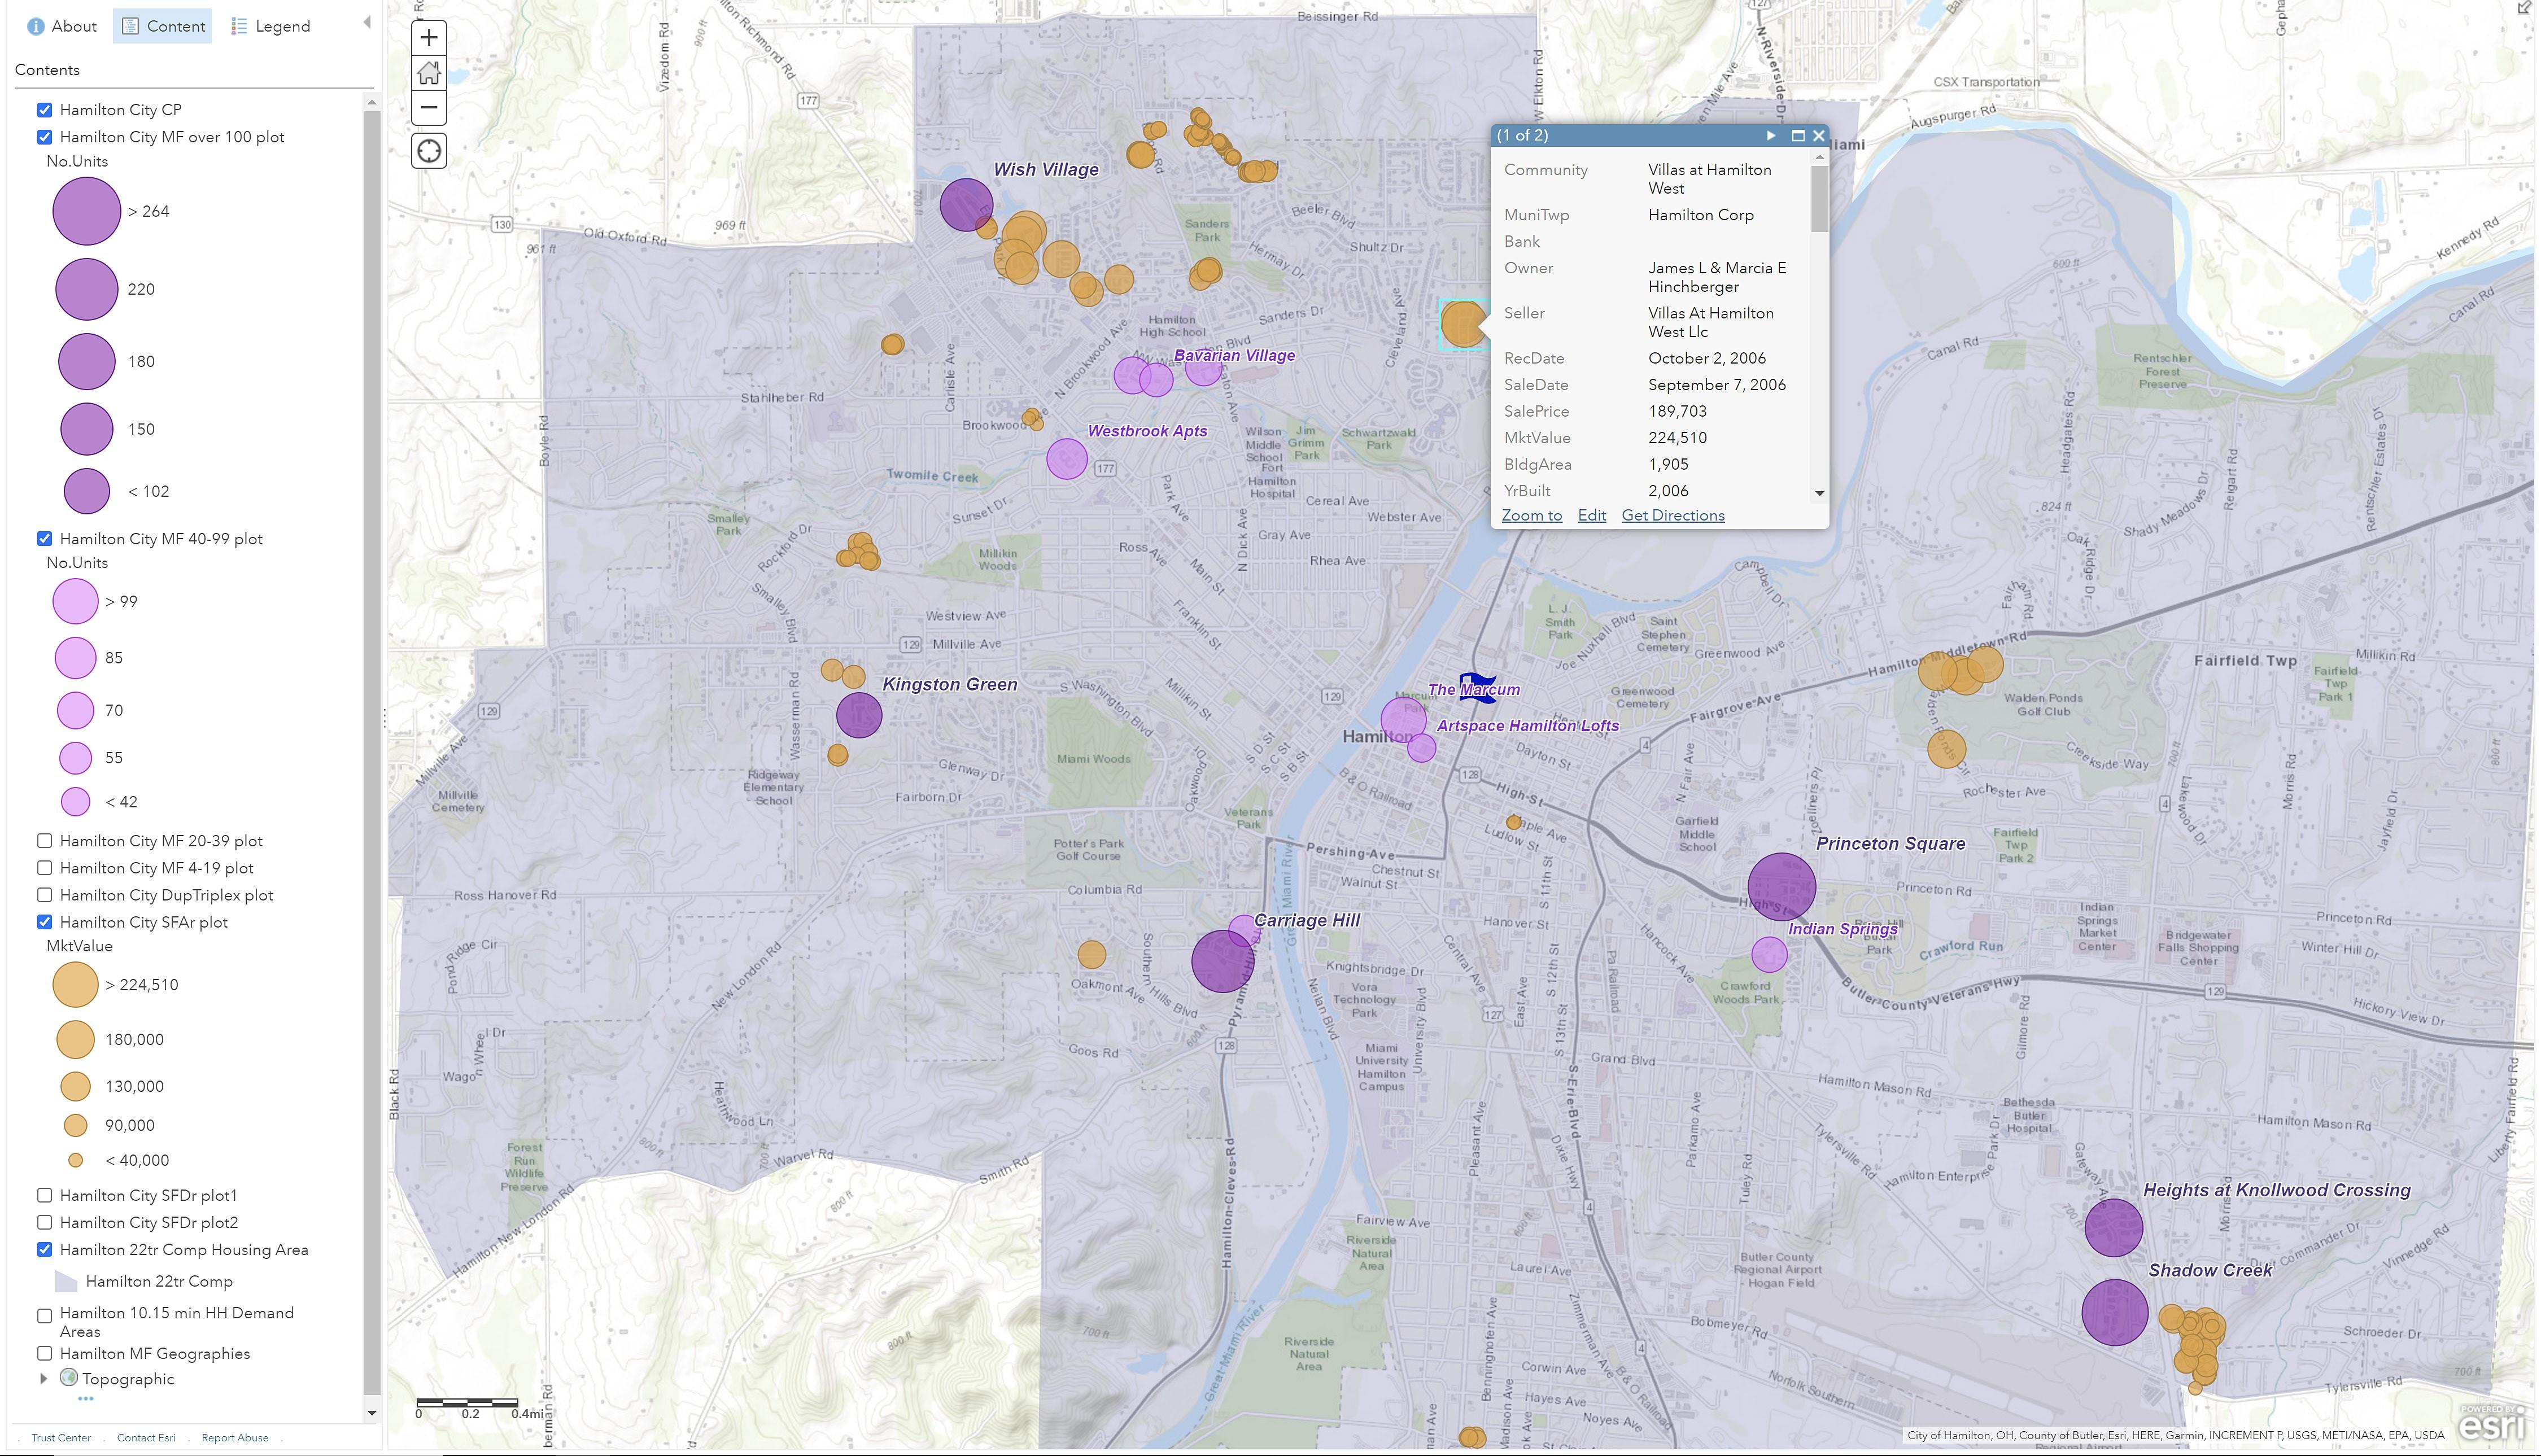
- -over150 dU 13% 40-149dU 5% 20-49dU 4% 4-19dU 18% Non-market 9% Duplex/Triplex 16% Condos 1% SF Detached 34%
HAMILTON ATTACHED RENTAL MARKET
Rents by Size for Scaled MF over 50 dU May 2022
-$0.50 $0.60 $0.70 $0.80 $0.90 $1.00 $1.10 $1.20 $1.30 $1.40 $1.50 $1.60 $1.70 $1.80 $1.90 $2.00 Monthly Base Rents per SF
Area in Square Feet
Living
HAMILTON ATTACHED RENTAL MARKET
Rents by Size for Scaled MF over 50 dU May 2022
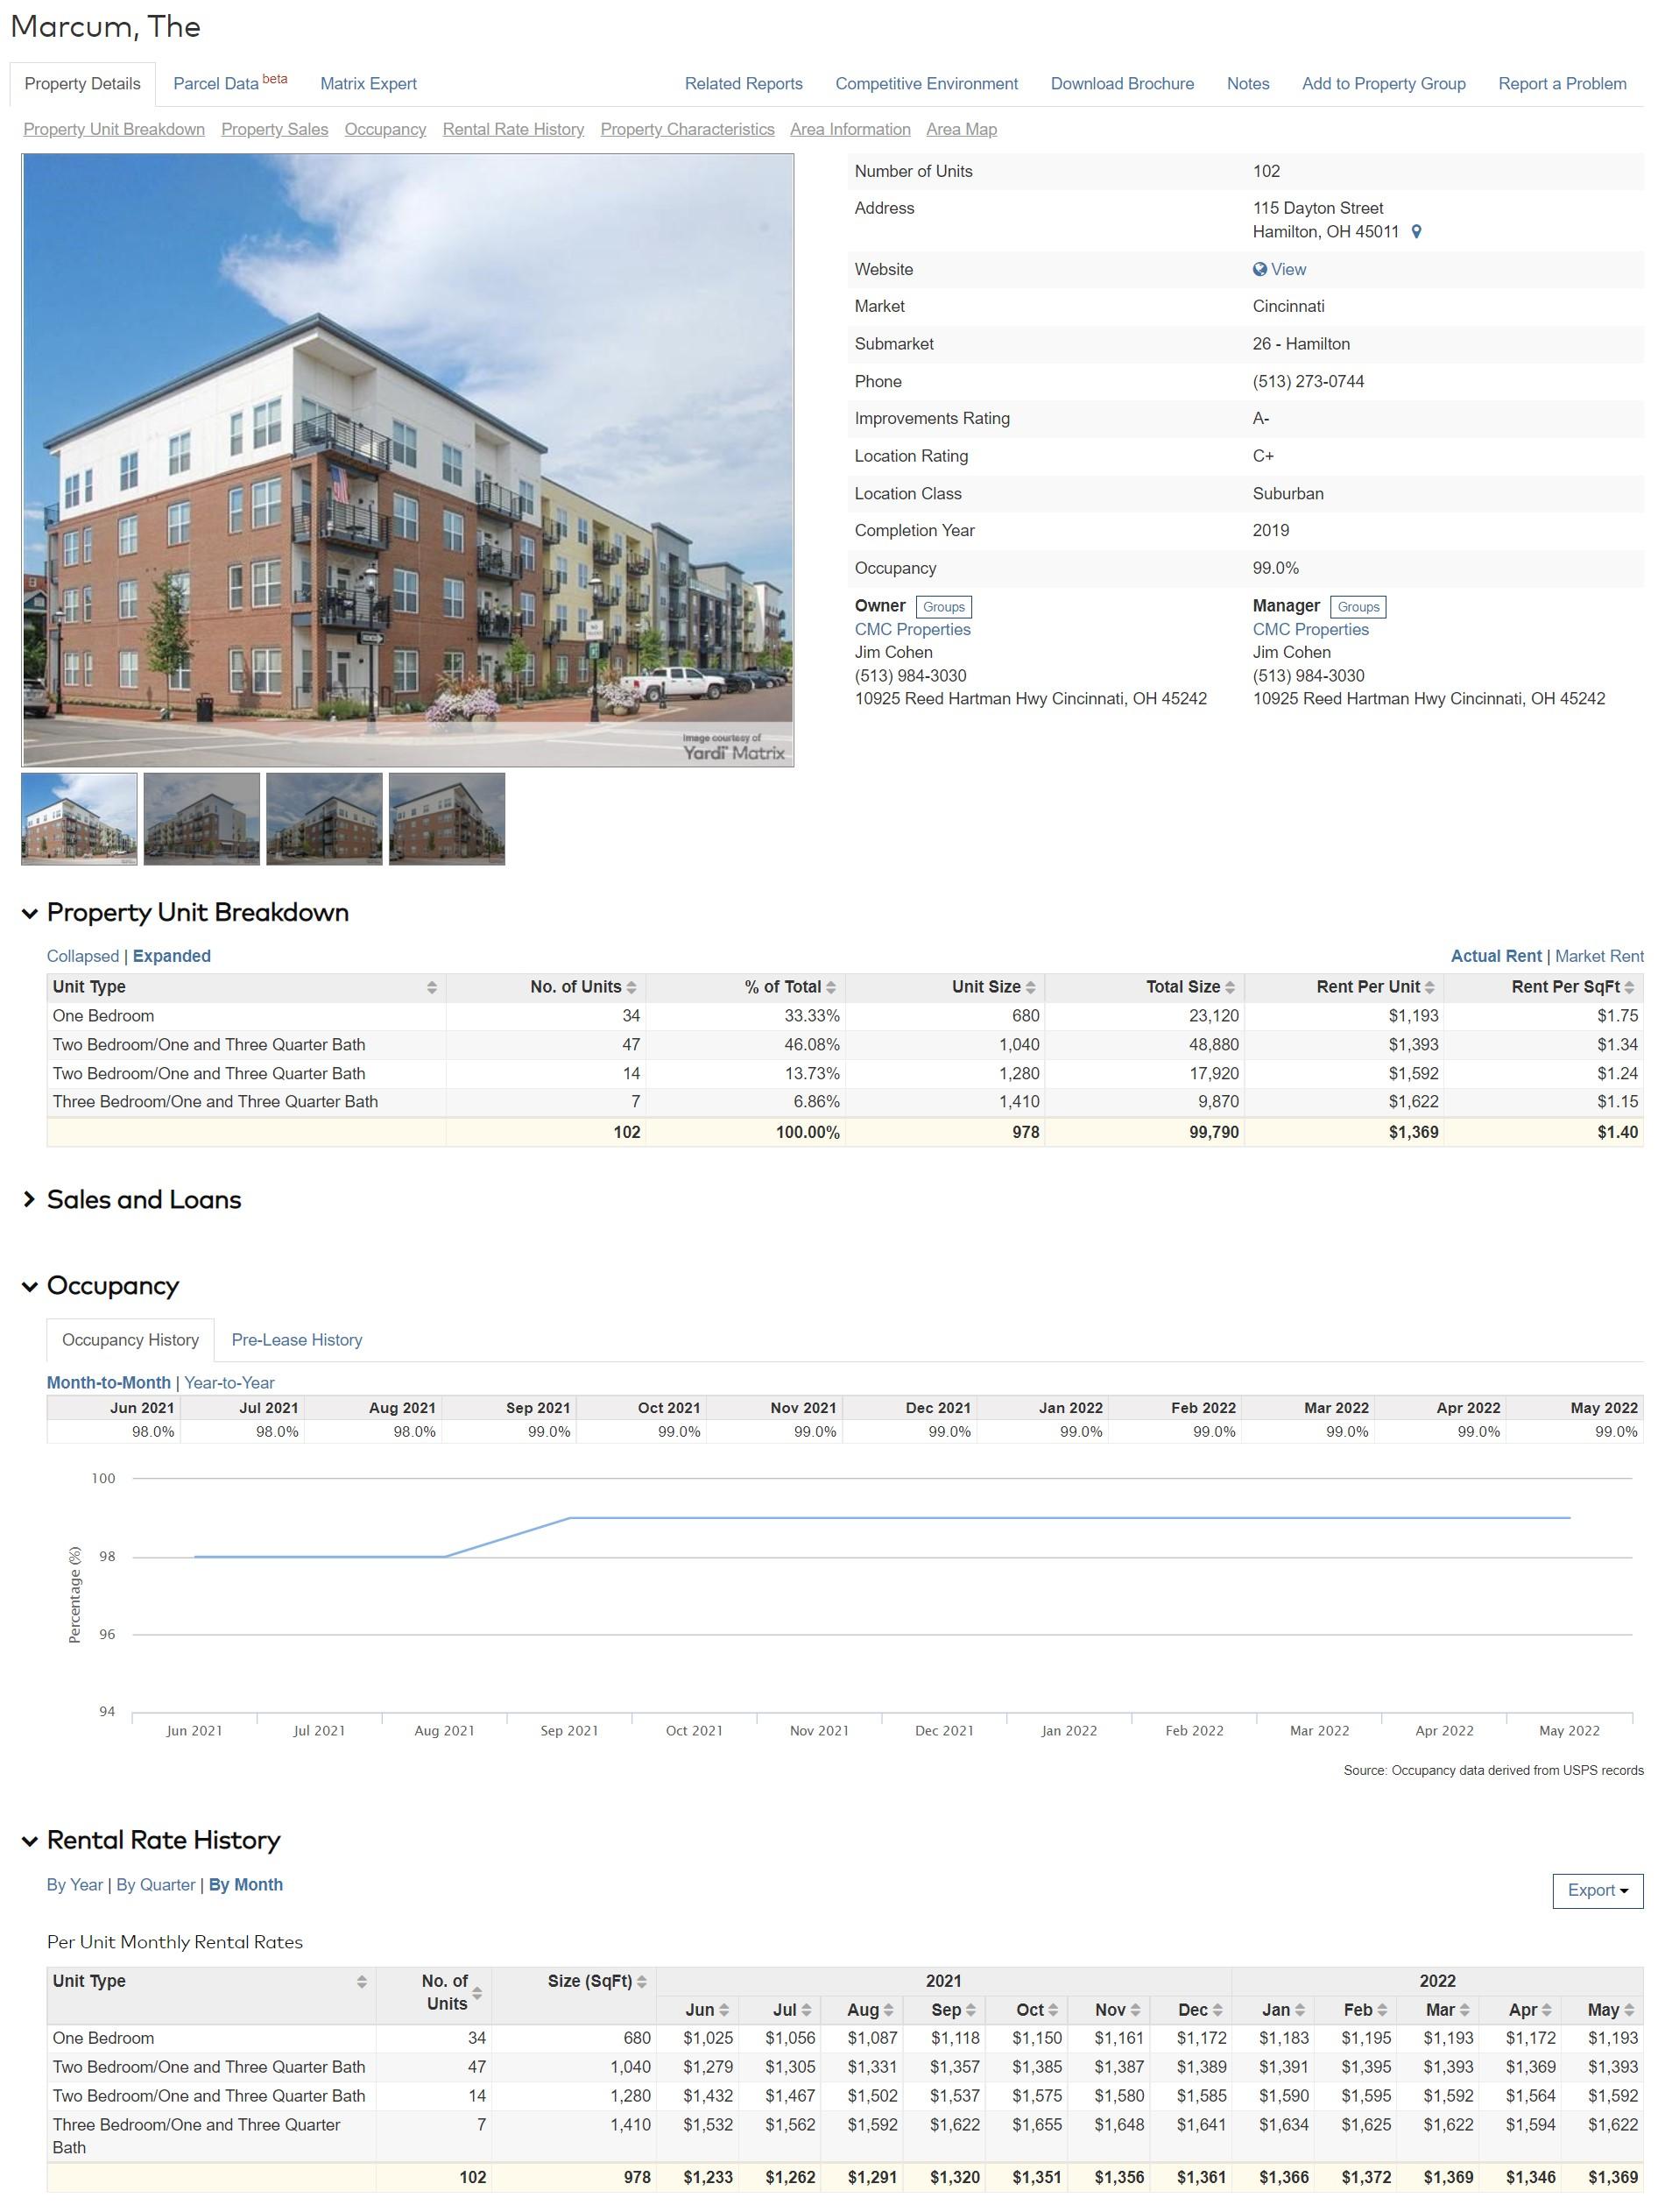
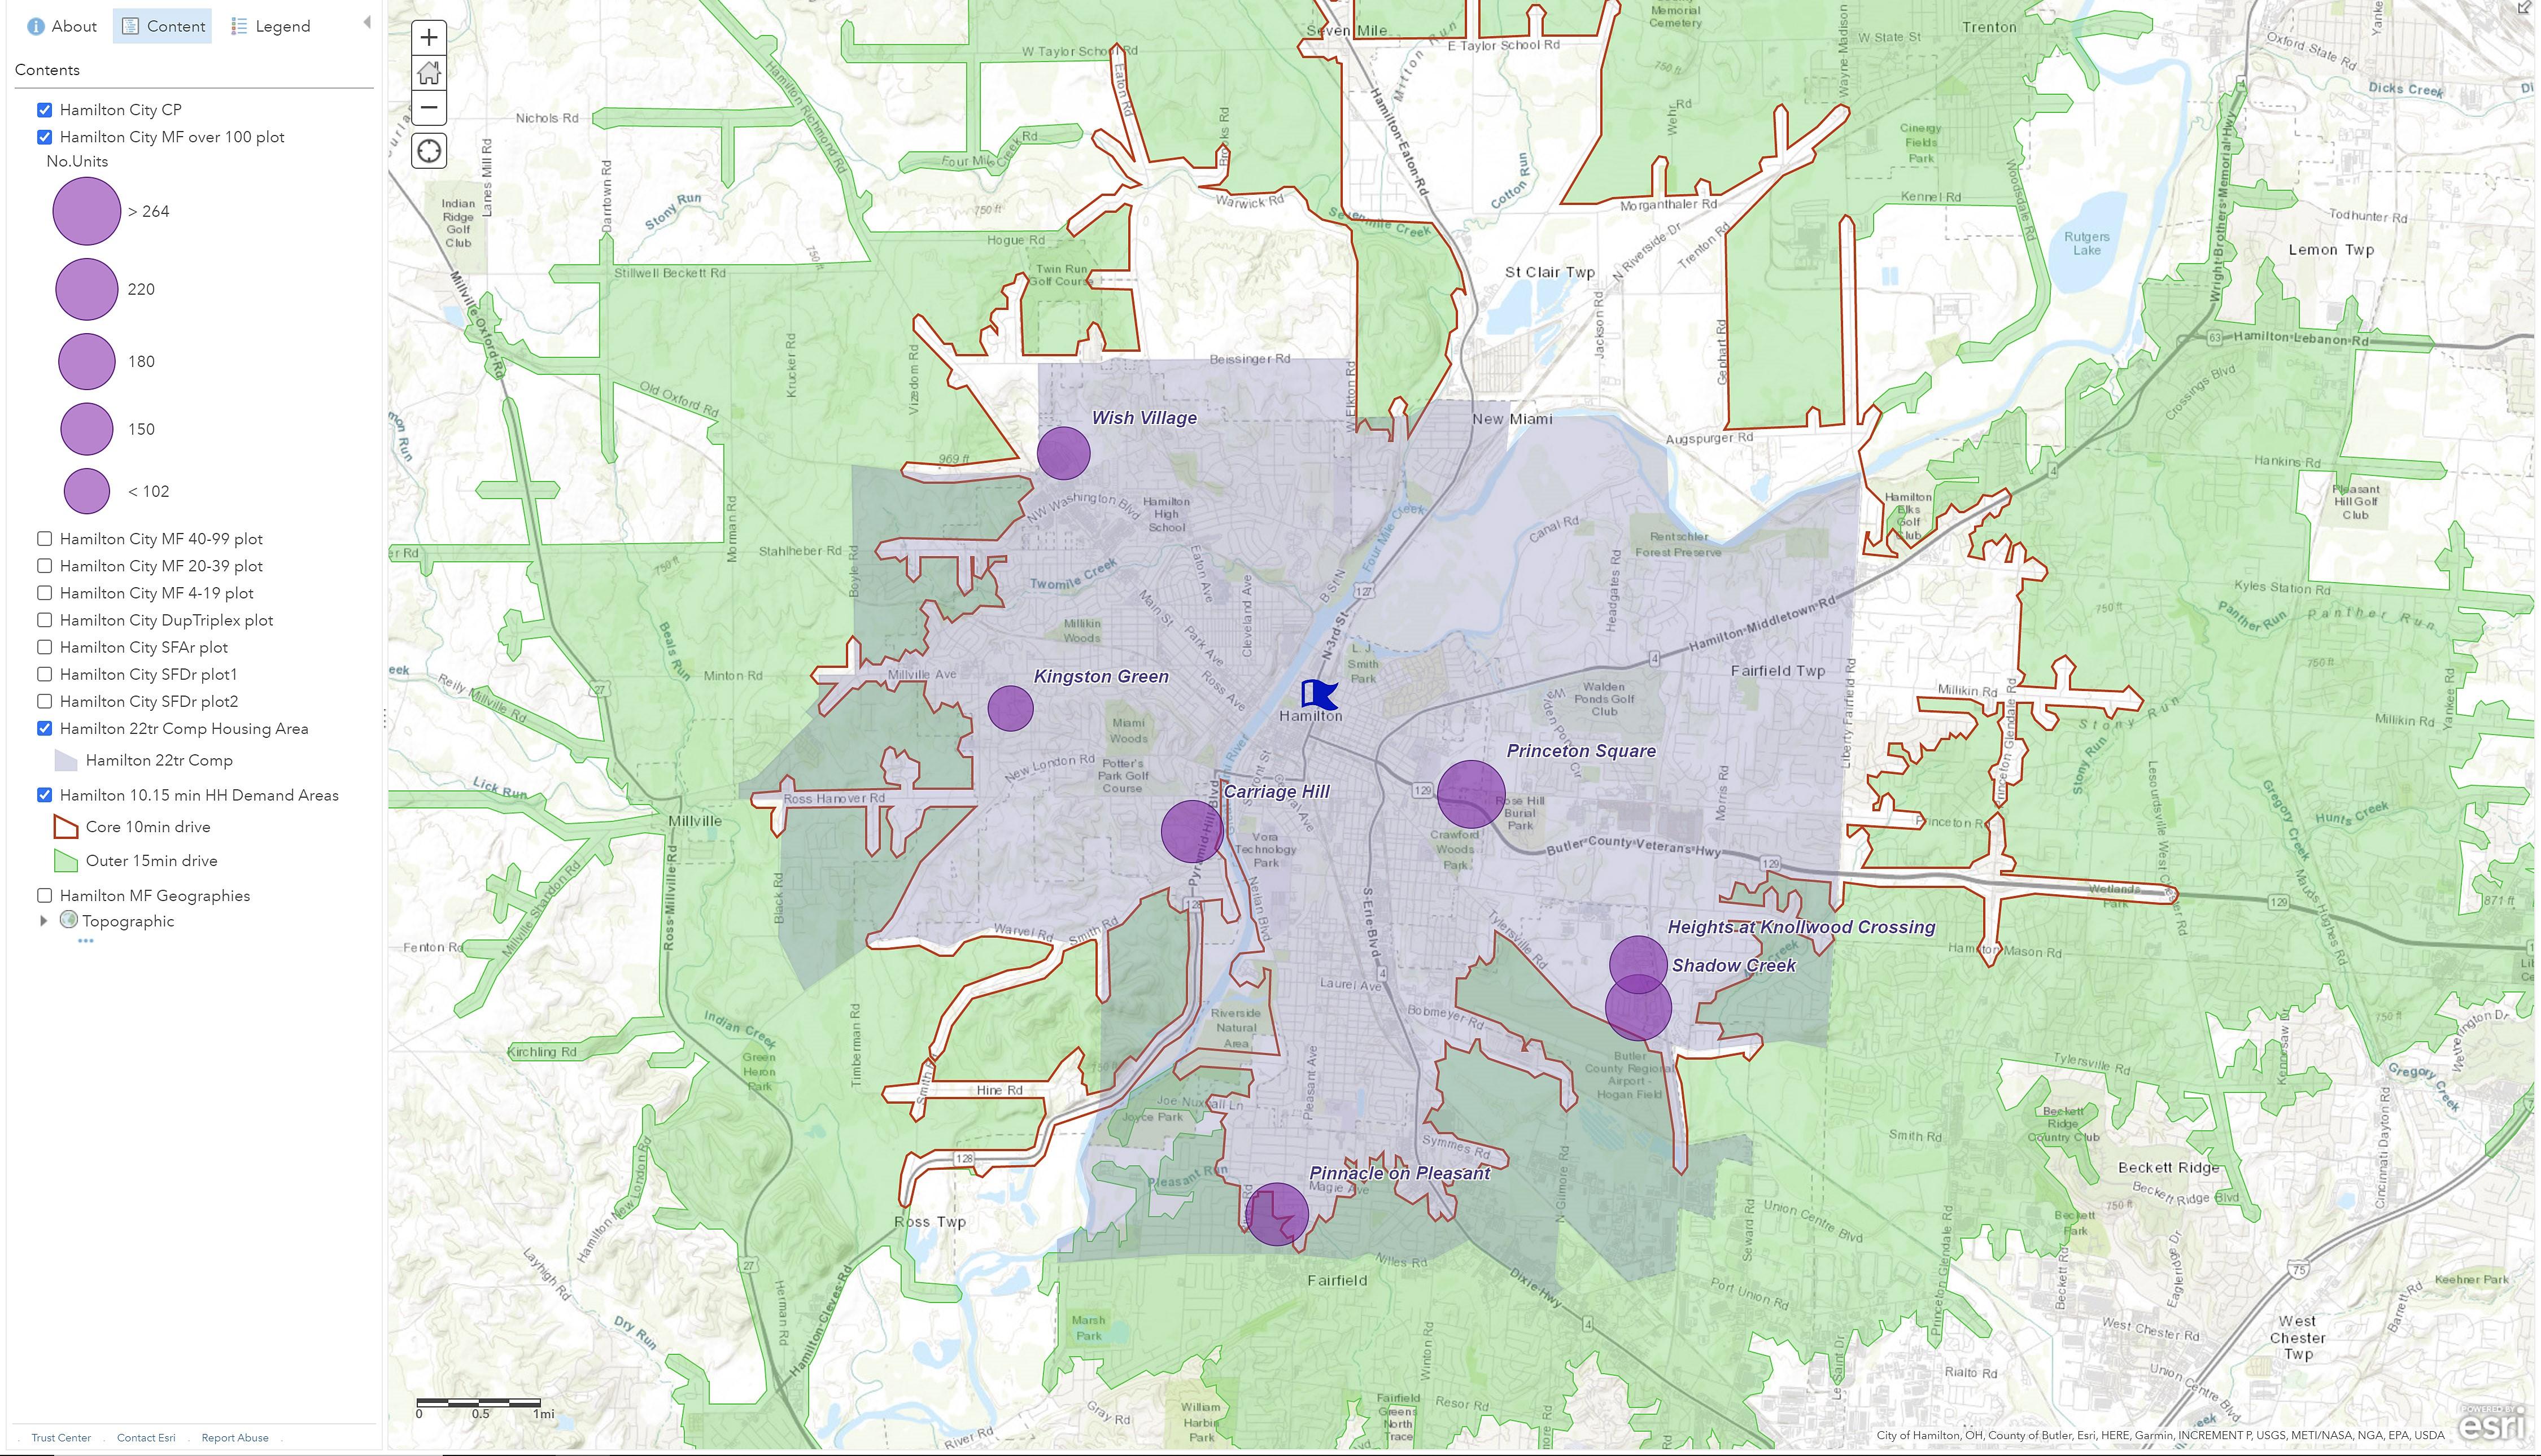
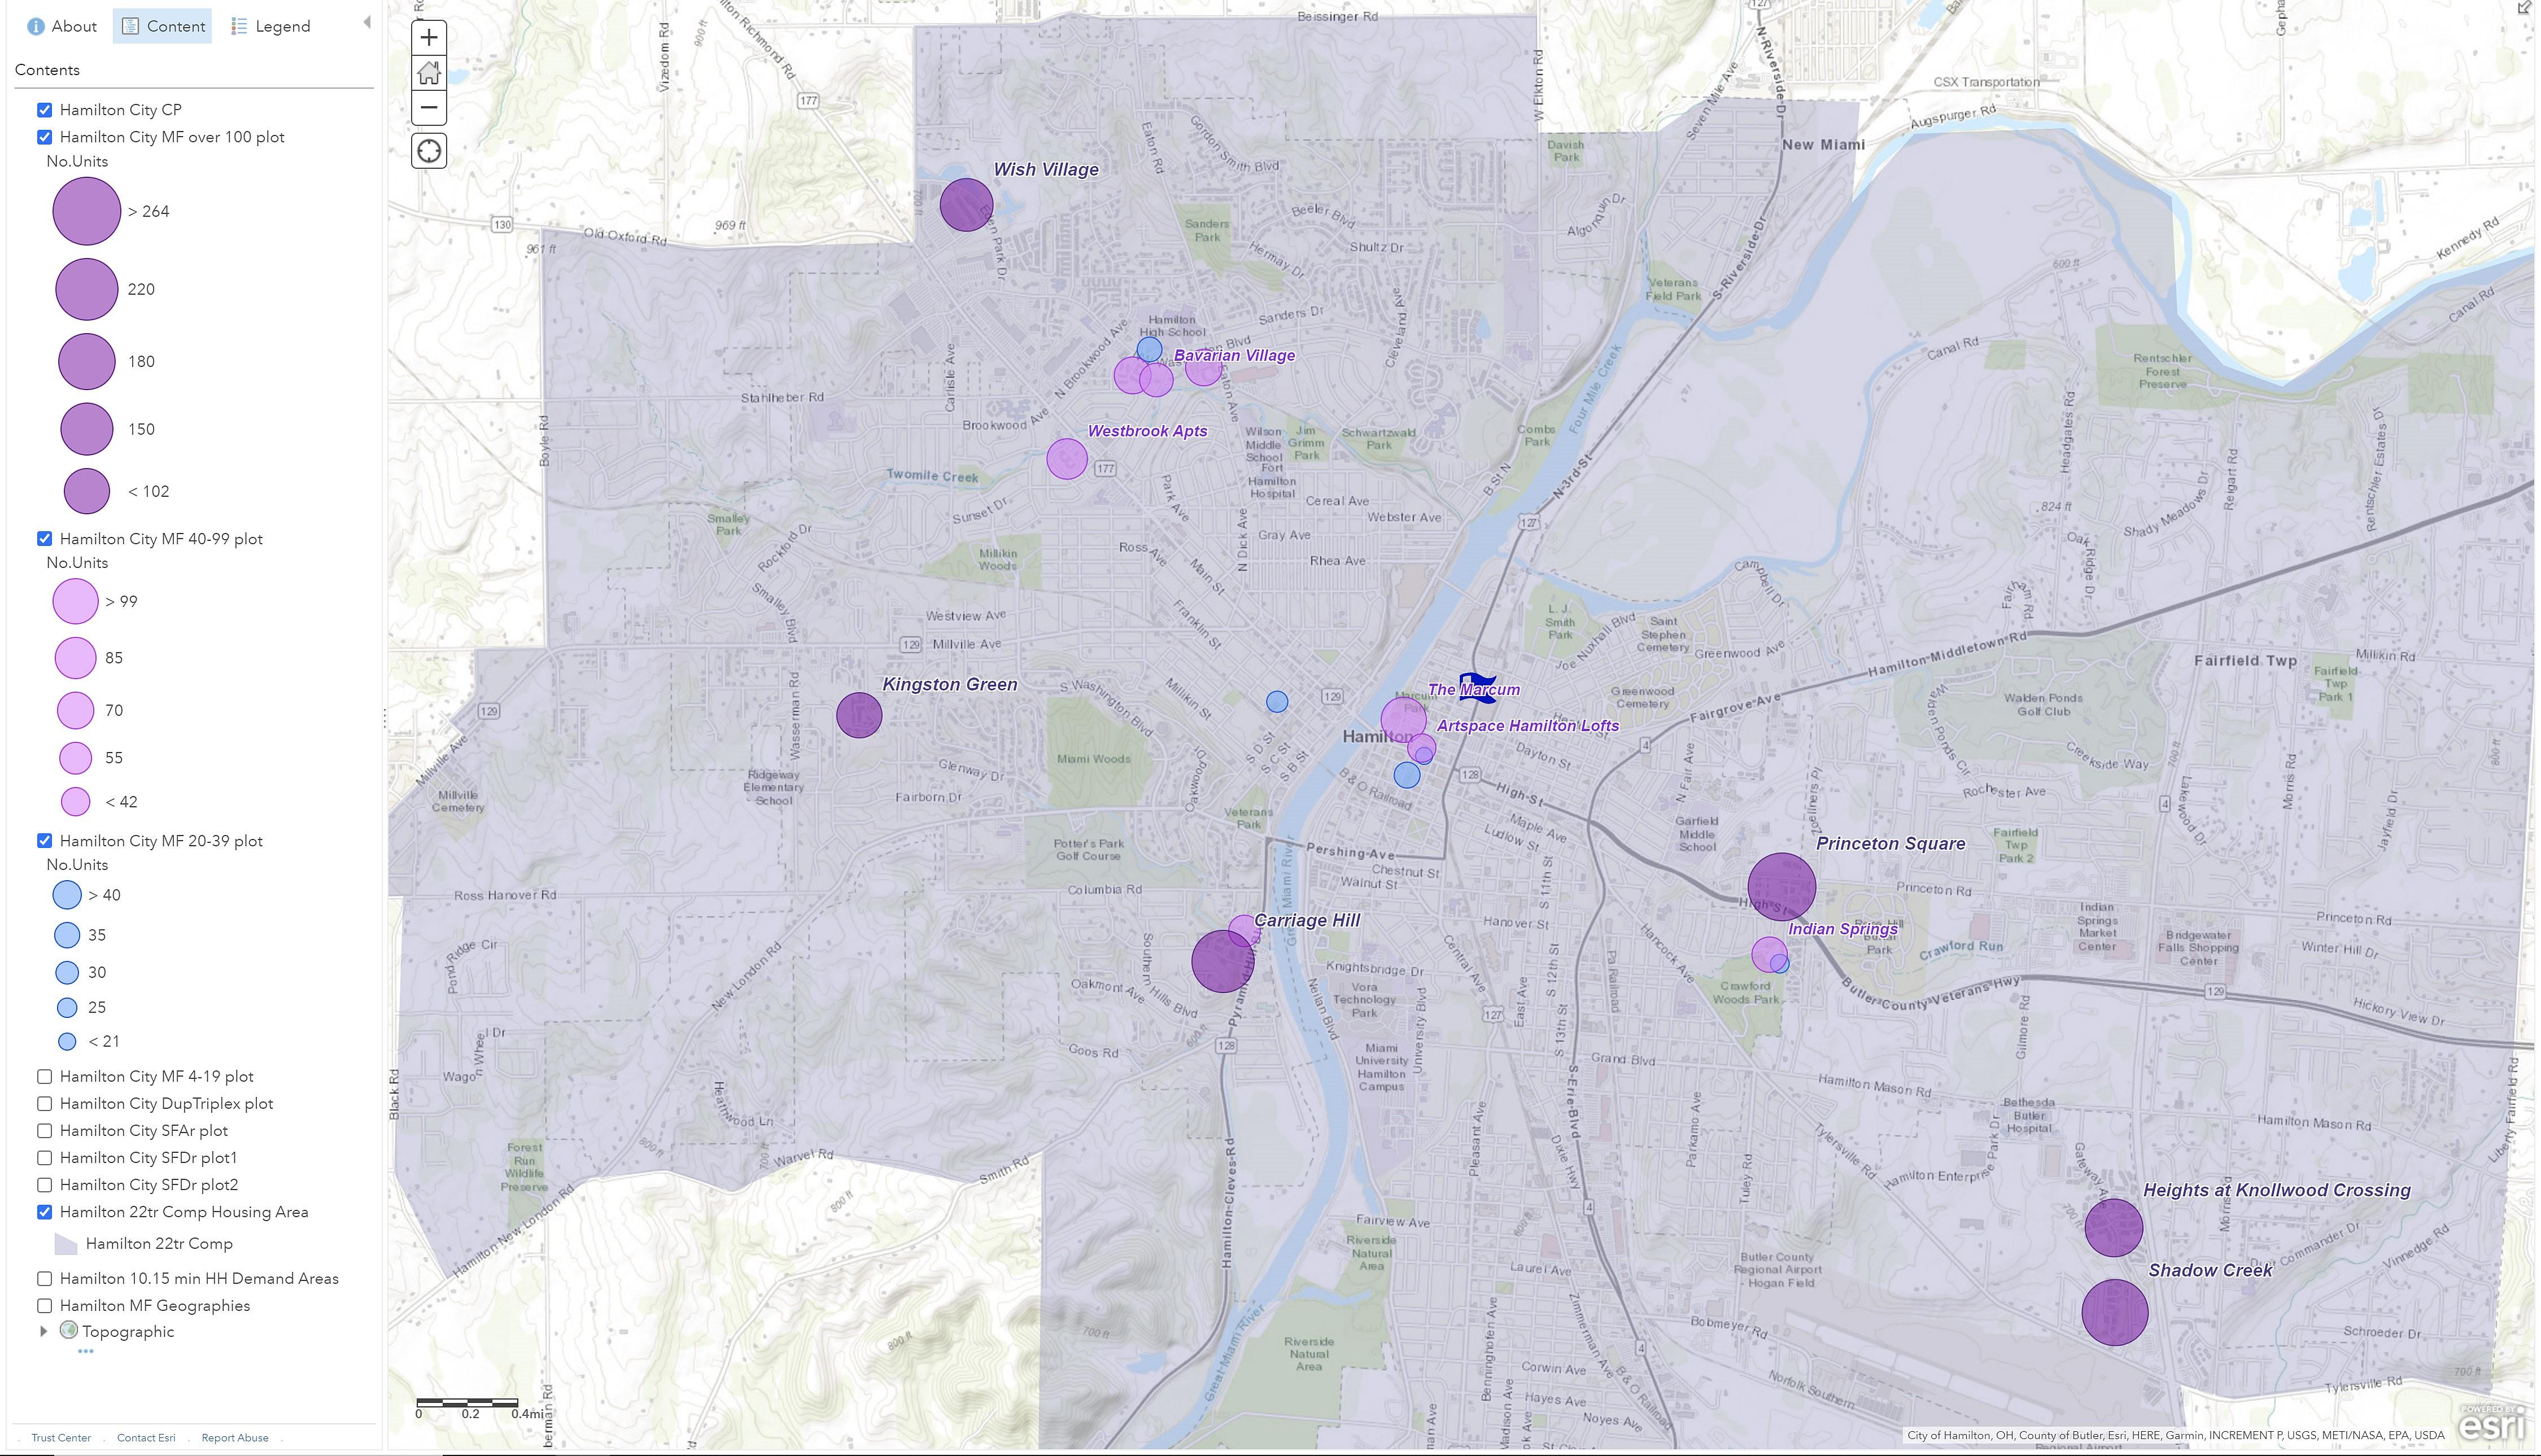
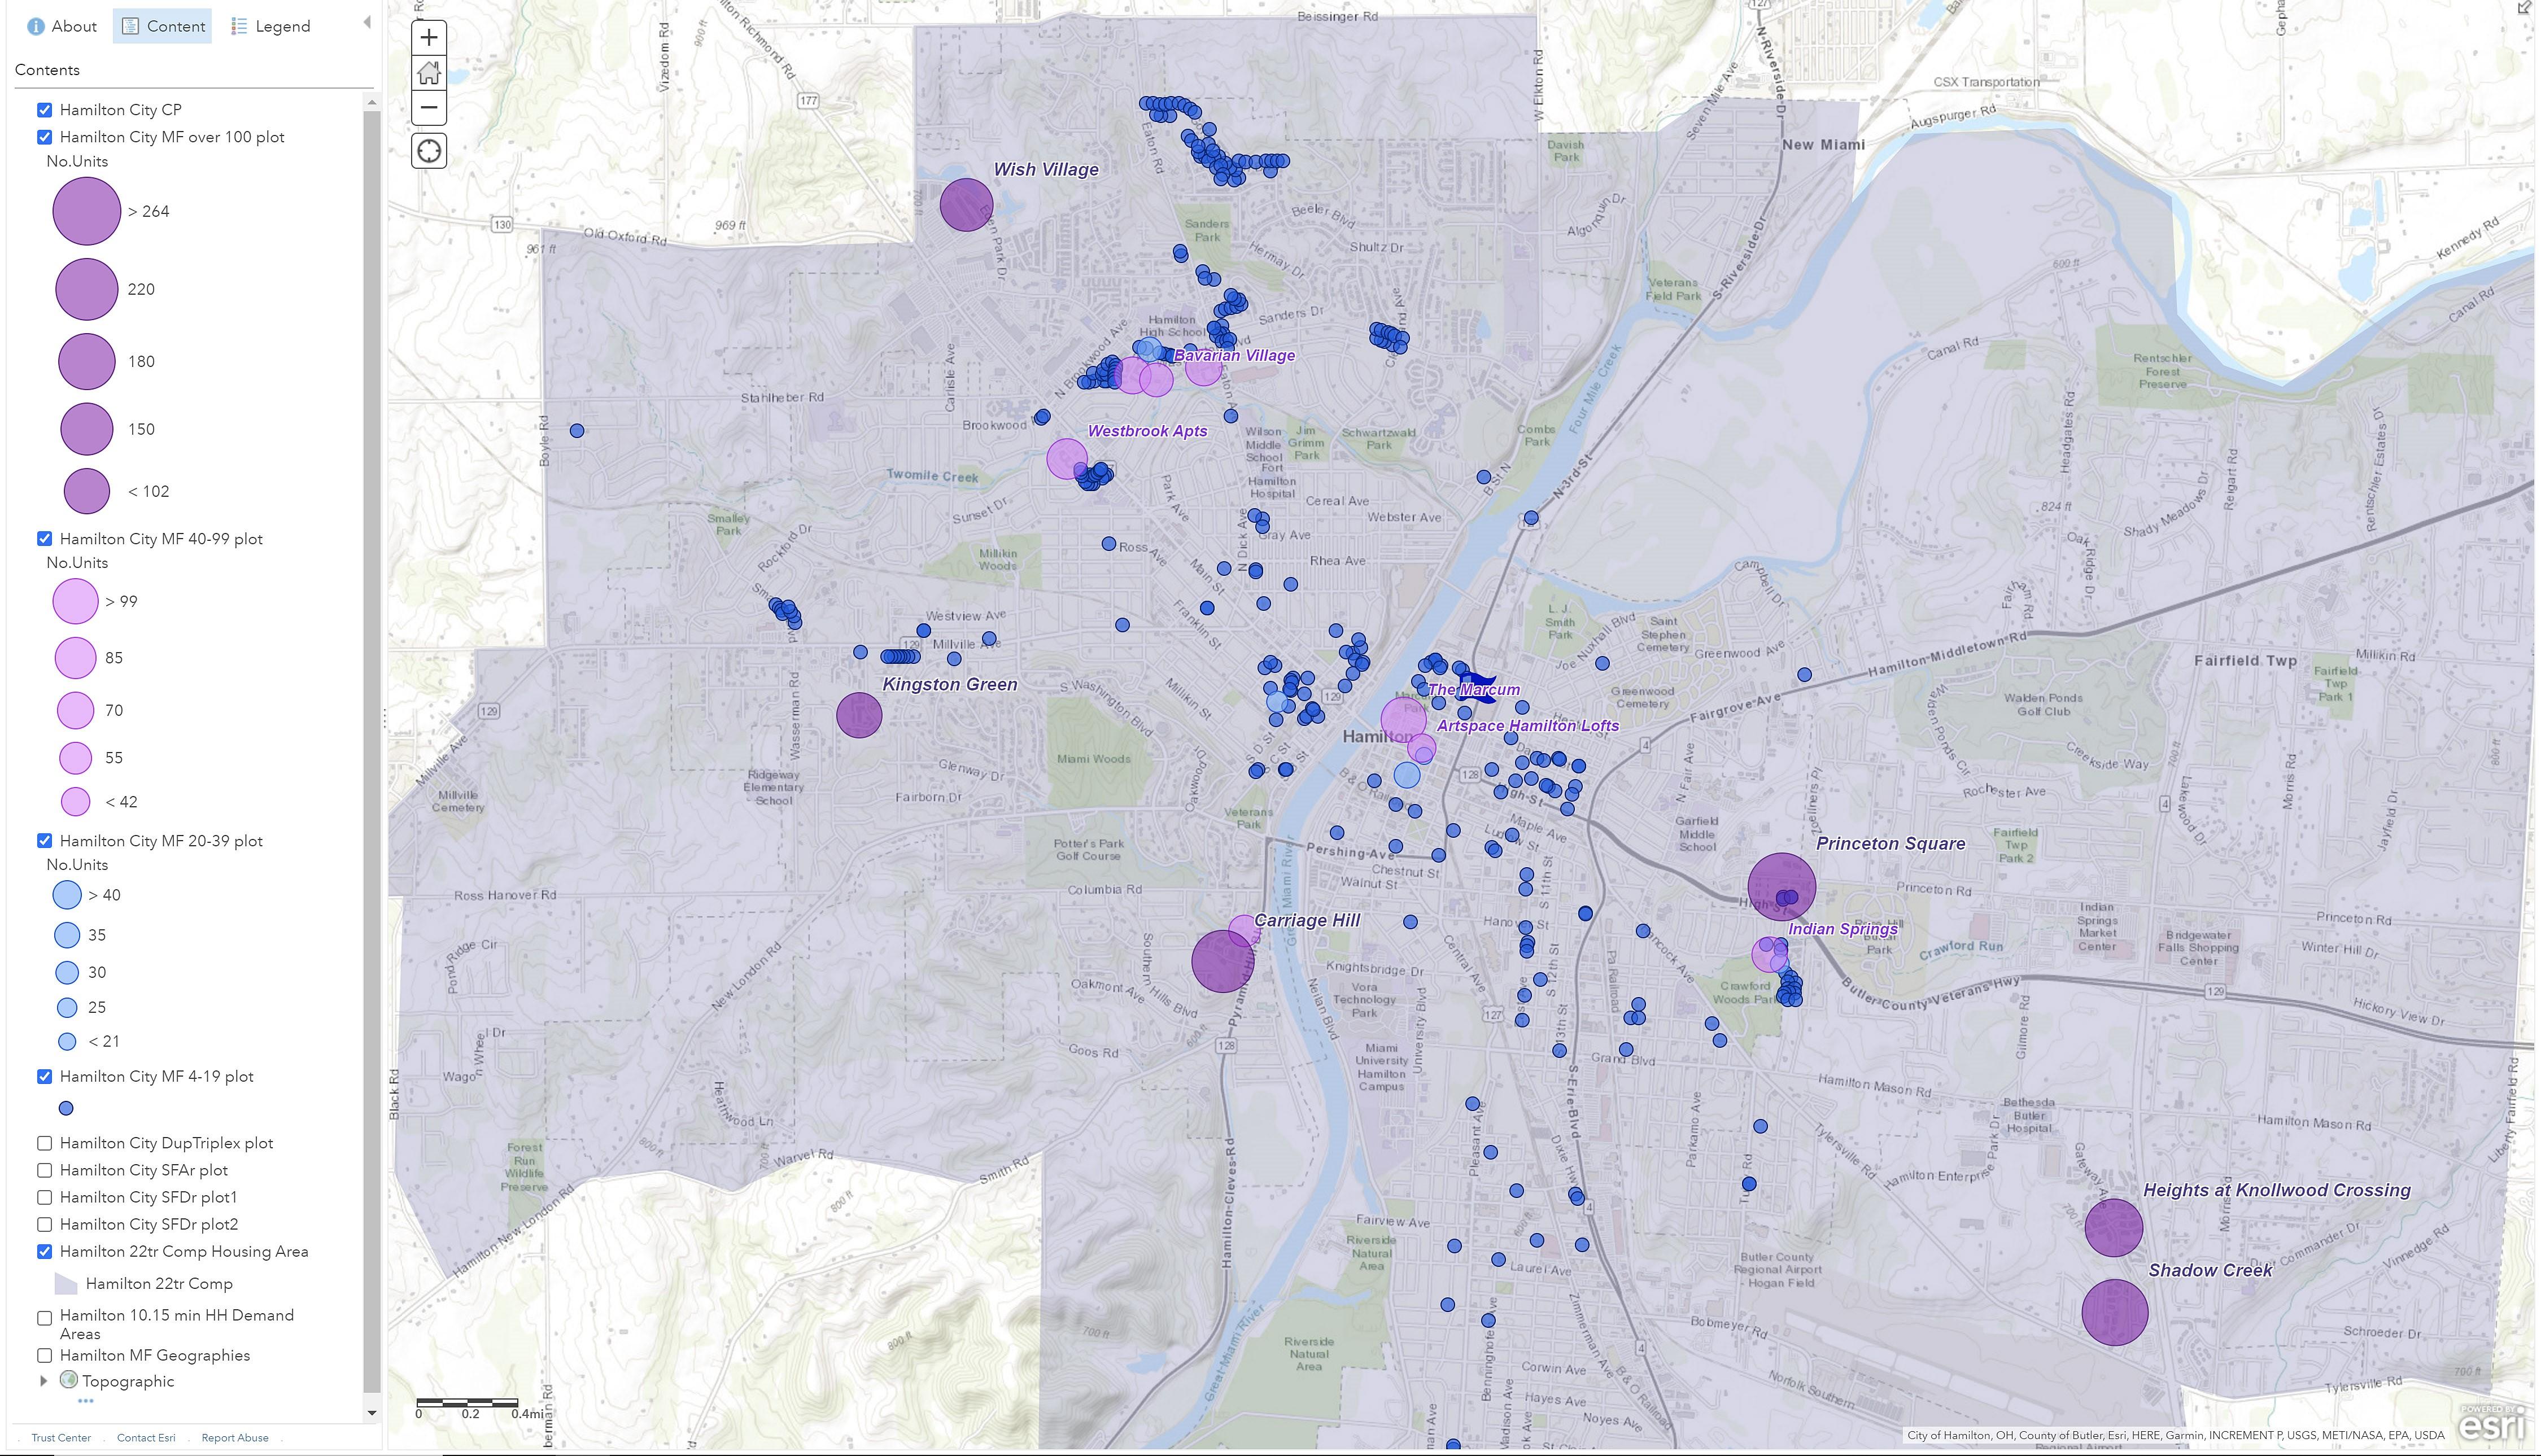
The Marcum (2019)
Shadow Creek (2005)
Princeton Square
Carriage Hill
Pinnacle on Pleasant
Symmes Apts
Wish Village (2003)
Heights Knollwood (2005)
Westbrook
Alexandria
Arbor Pointe
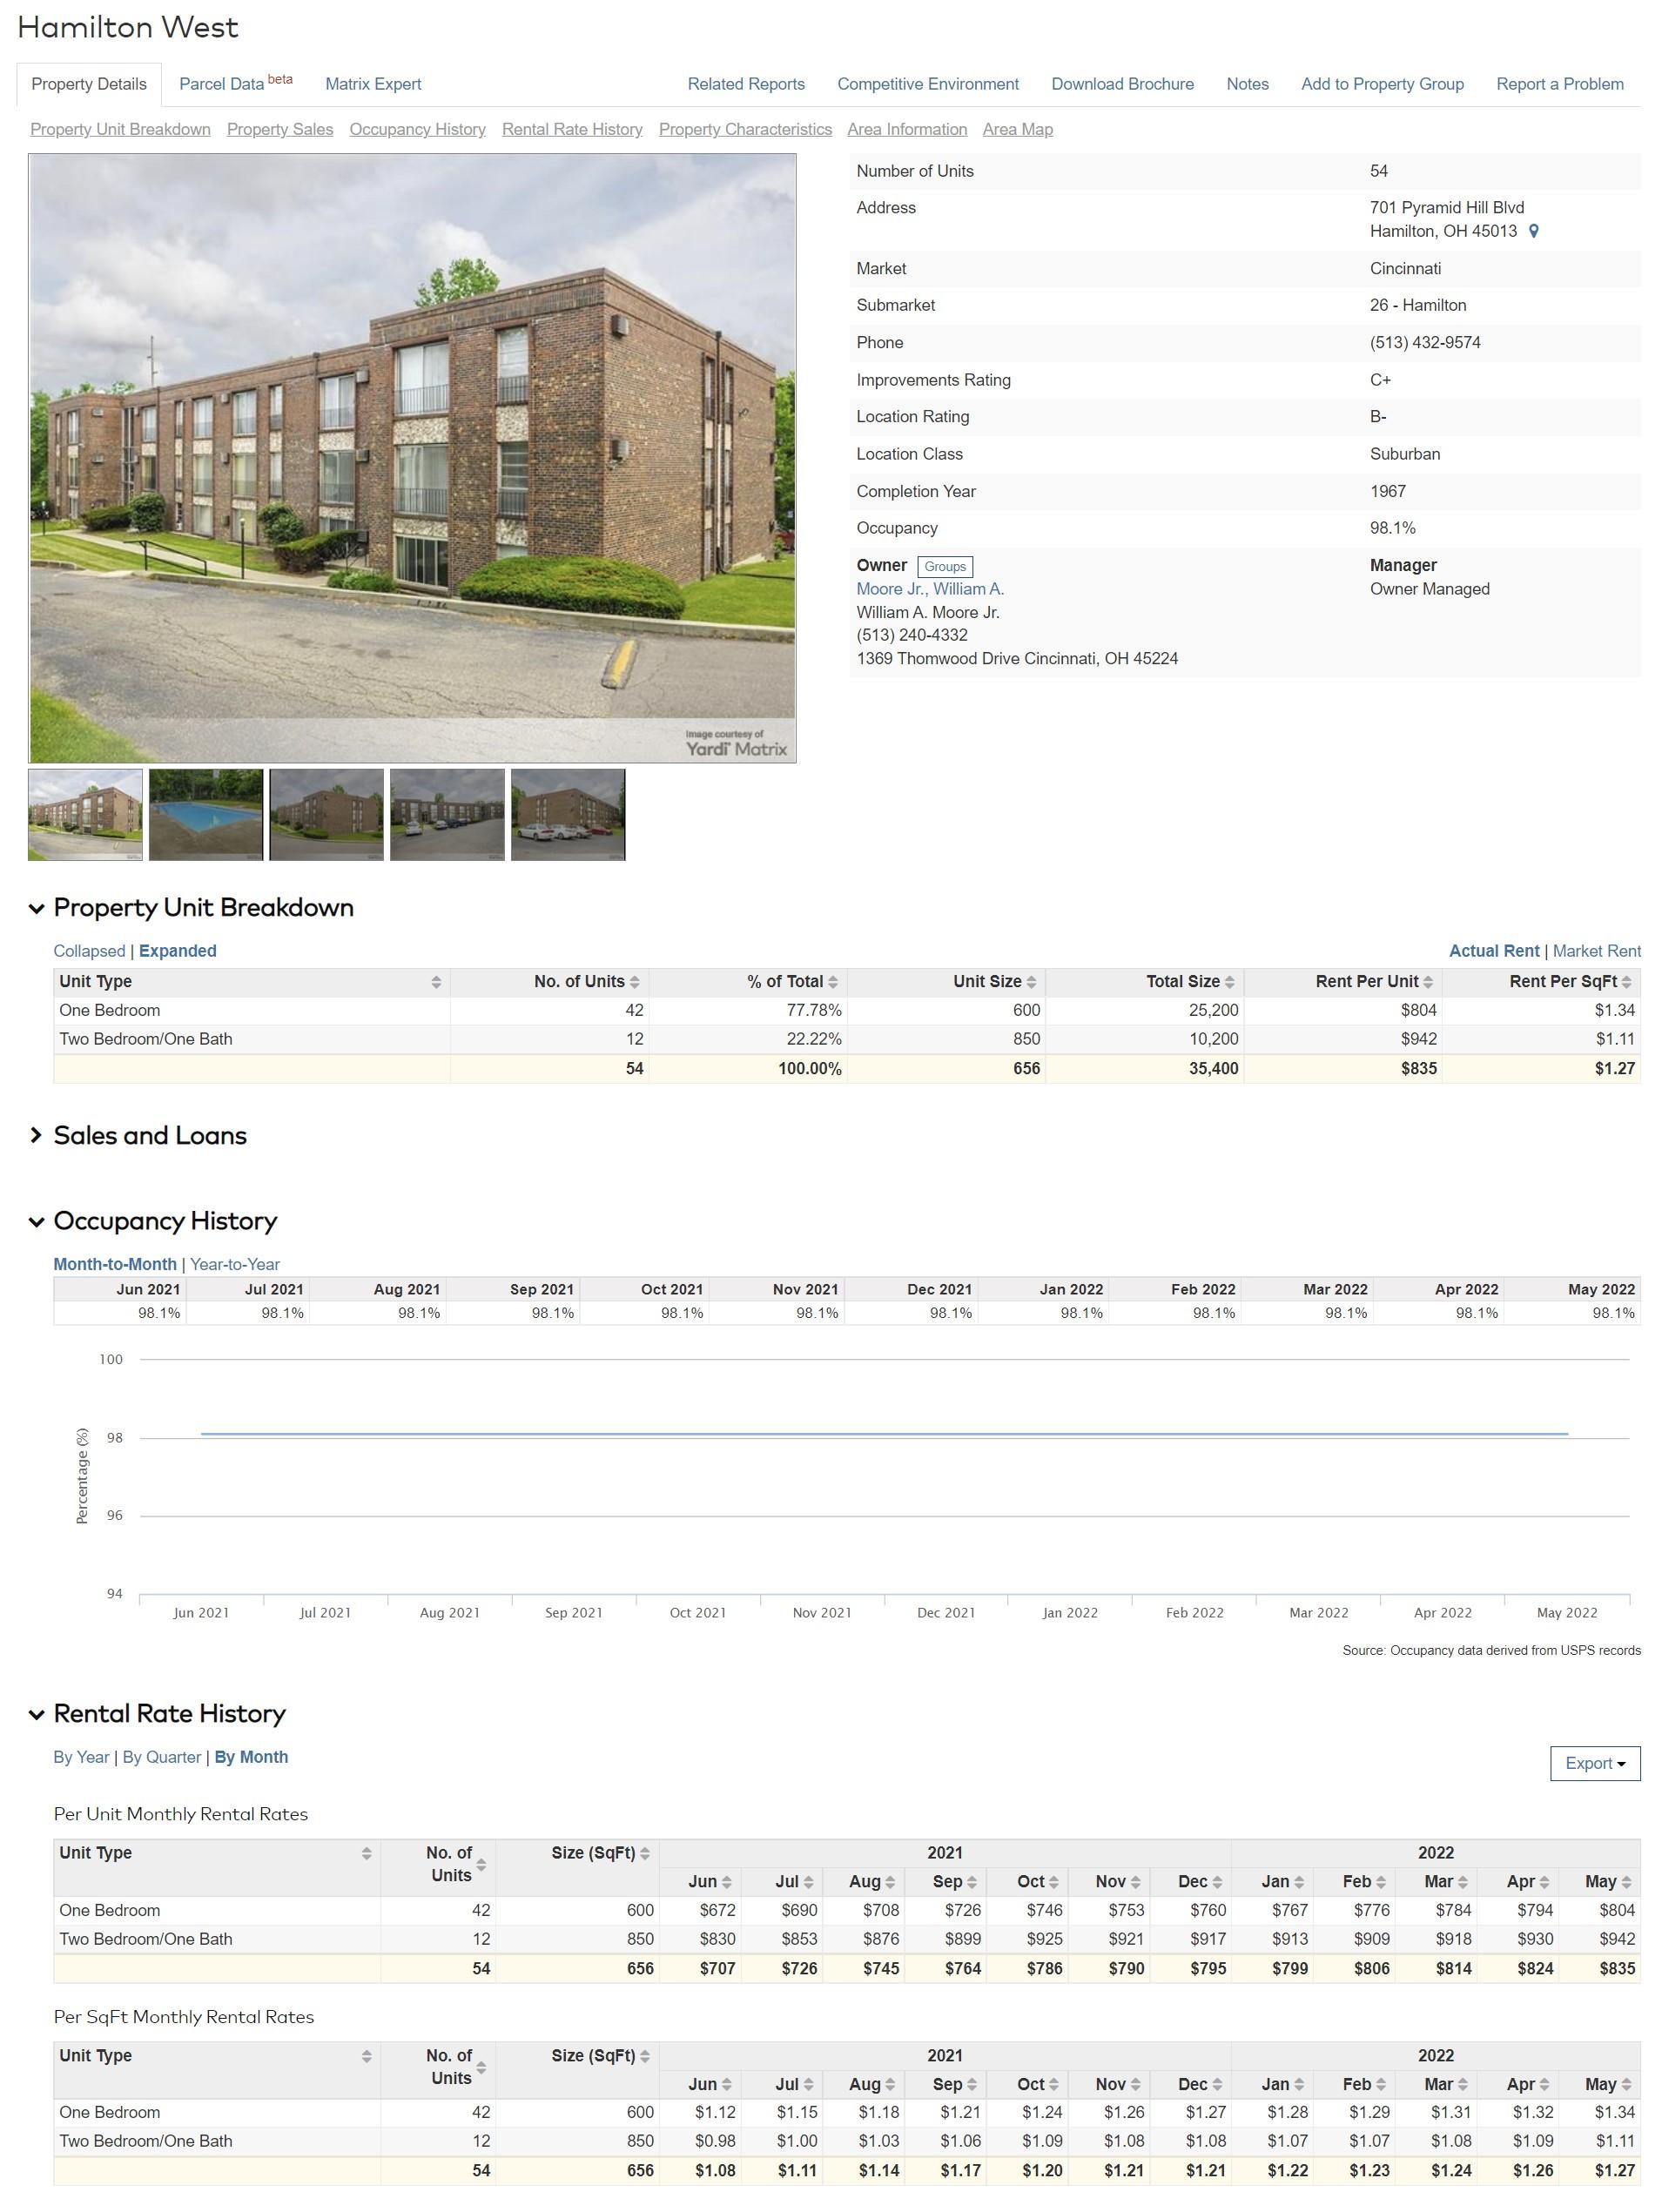
Hamilton West
Kingston Greene
Lighthouse
St. Clair
$0.50 $0.60 $0.70 $0.80 $0.90 $1.00 $1.10 $1.20 $1.30 $1.40 $1.50 $1.60 $1.70 $1.80 $1.90 $2.00 Monthly Base Rents per SF Living Area in Square Feet
HAMILTON ATTACHED RENTAL MARKET
Rents by Size for Scaled MF over 50 dU May 2022
The Marcum (2019)
Shadow Creek (2005)
Princeton Square
Carriage Hill
Pinnacle on Pleasant
Symmes Apts
Wish Village (2003)
Heights Knollwood (2005)
Westbrook
Alexandria
Arbor Pointe
Hamilton West
Kingston Greene
Lighthouse
St. Clair
Rents $750 mo.
Threshold $1,000
Rents $1,250 mo.
Rents $1,500 mo.
$0.50 $0.60 $0.70 $0.80 $0.90 $1.00 $1.10 $1.20 $1.30 $1.40 $1.50 $1.60 $1.70 $1.80 $1.90 $2.00 Monthly Base Rents per SF
Living Area in Square Feet
--
-
-

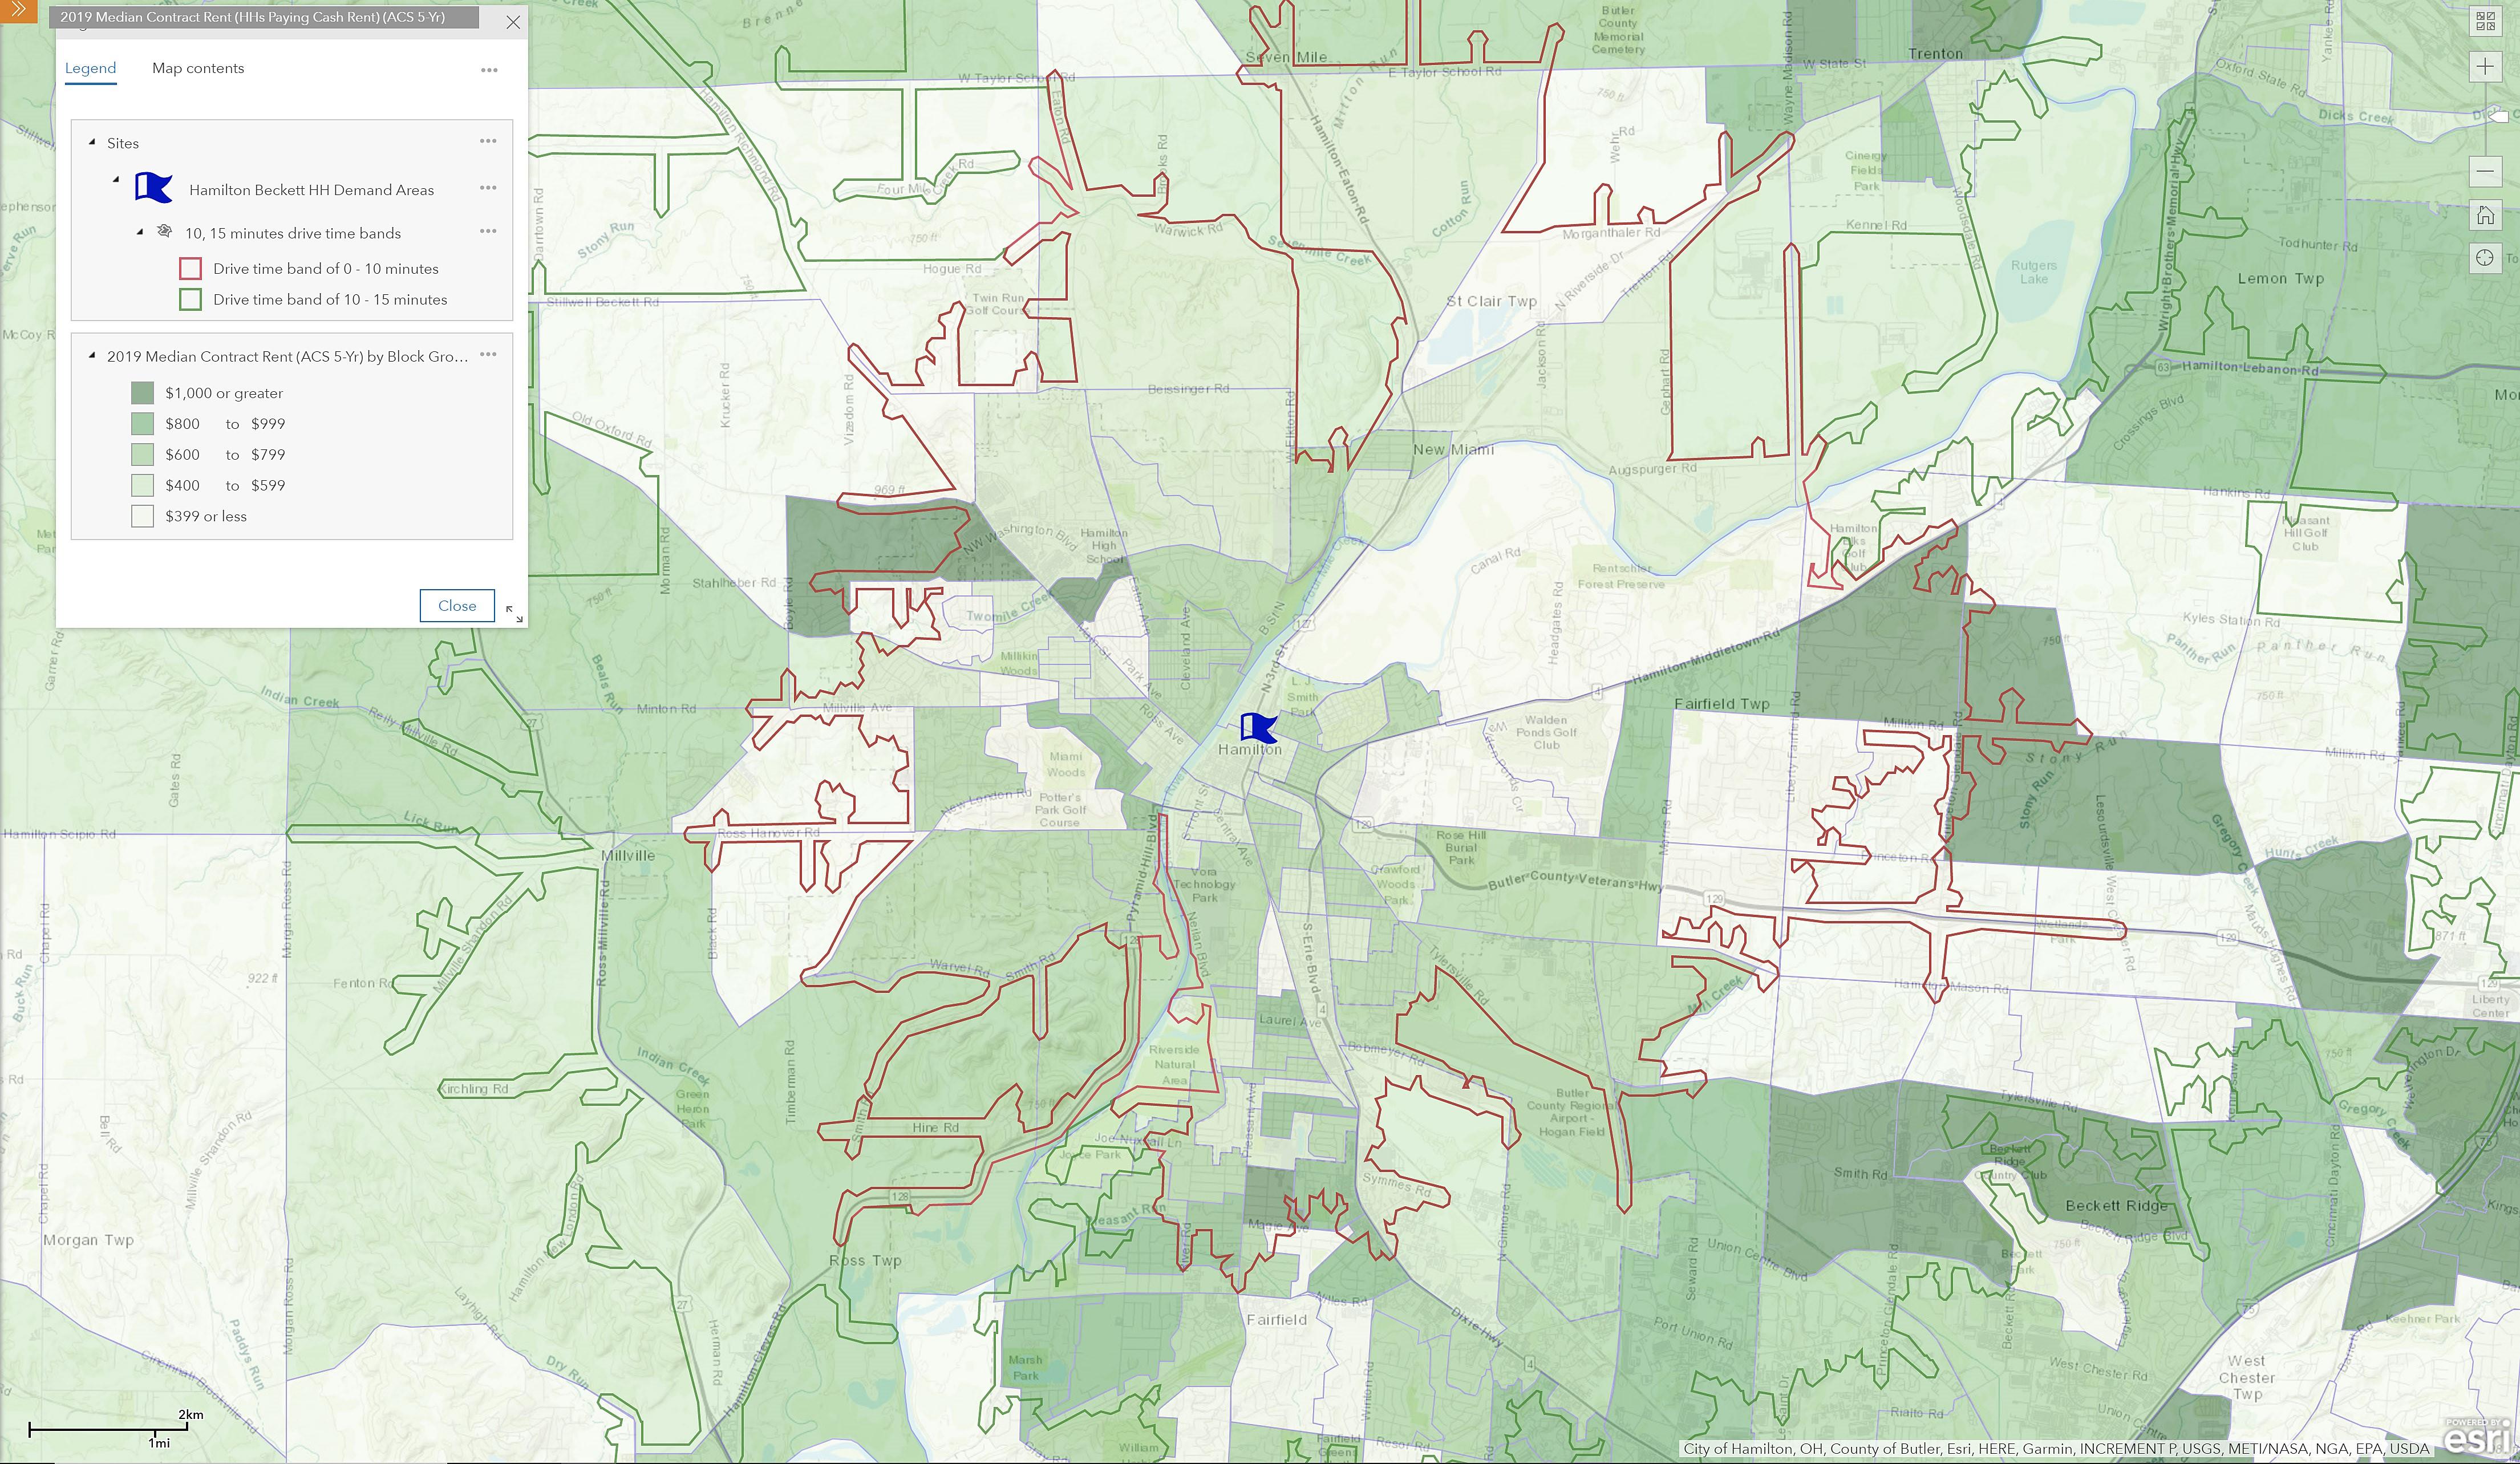
2021 Housing Profile

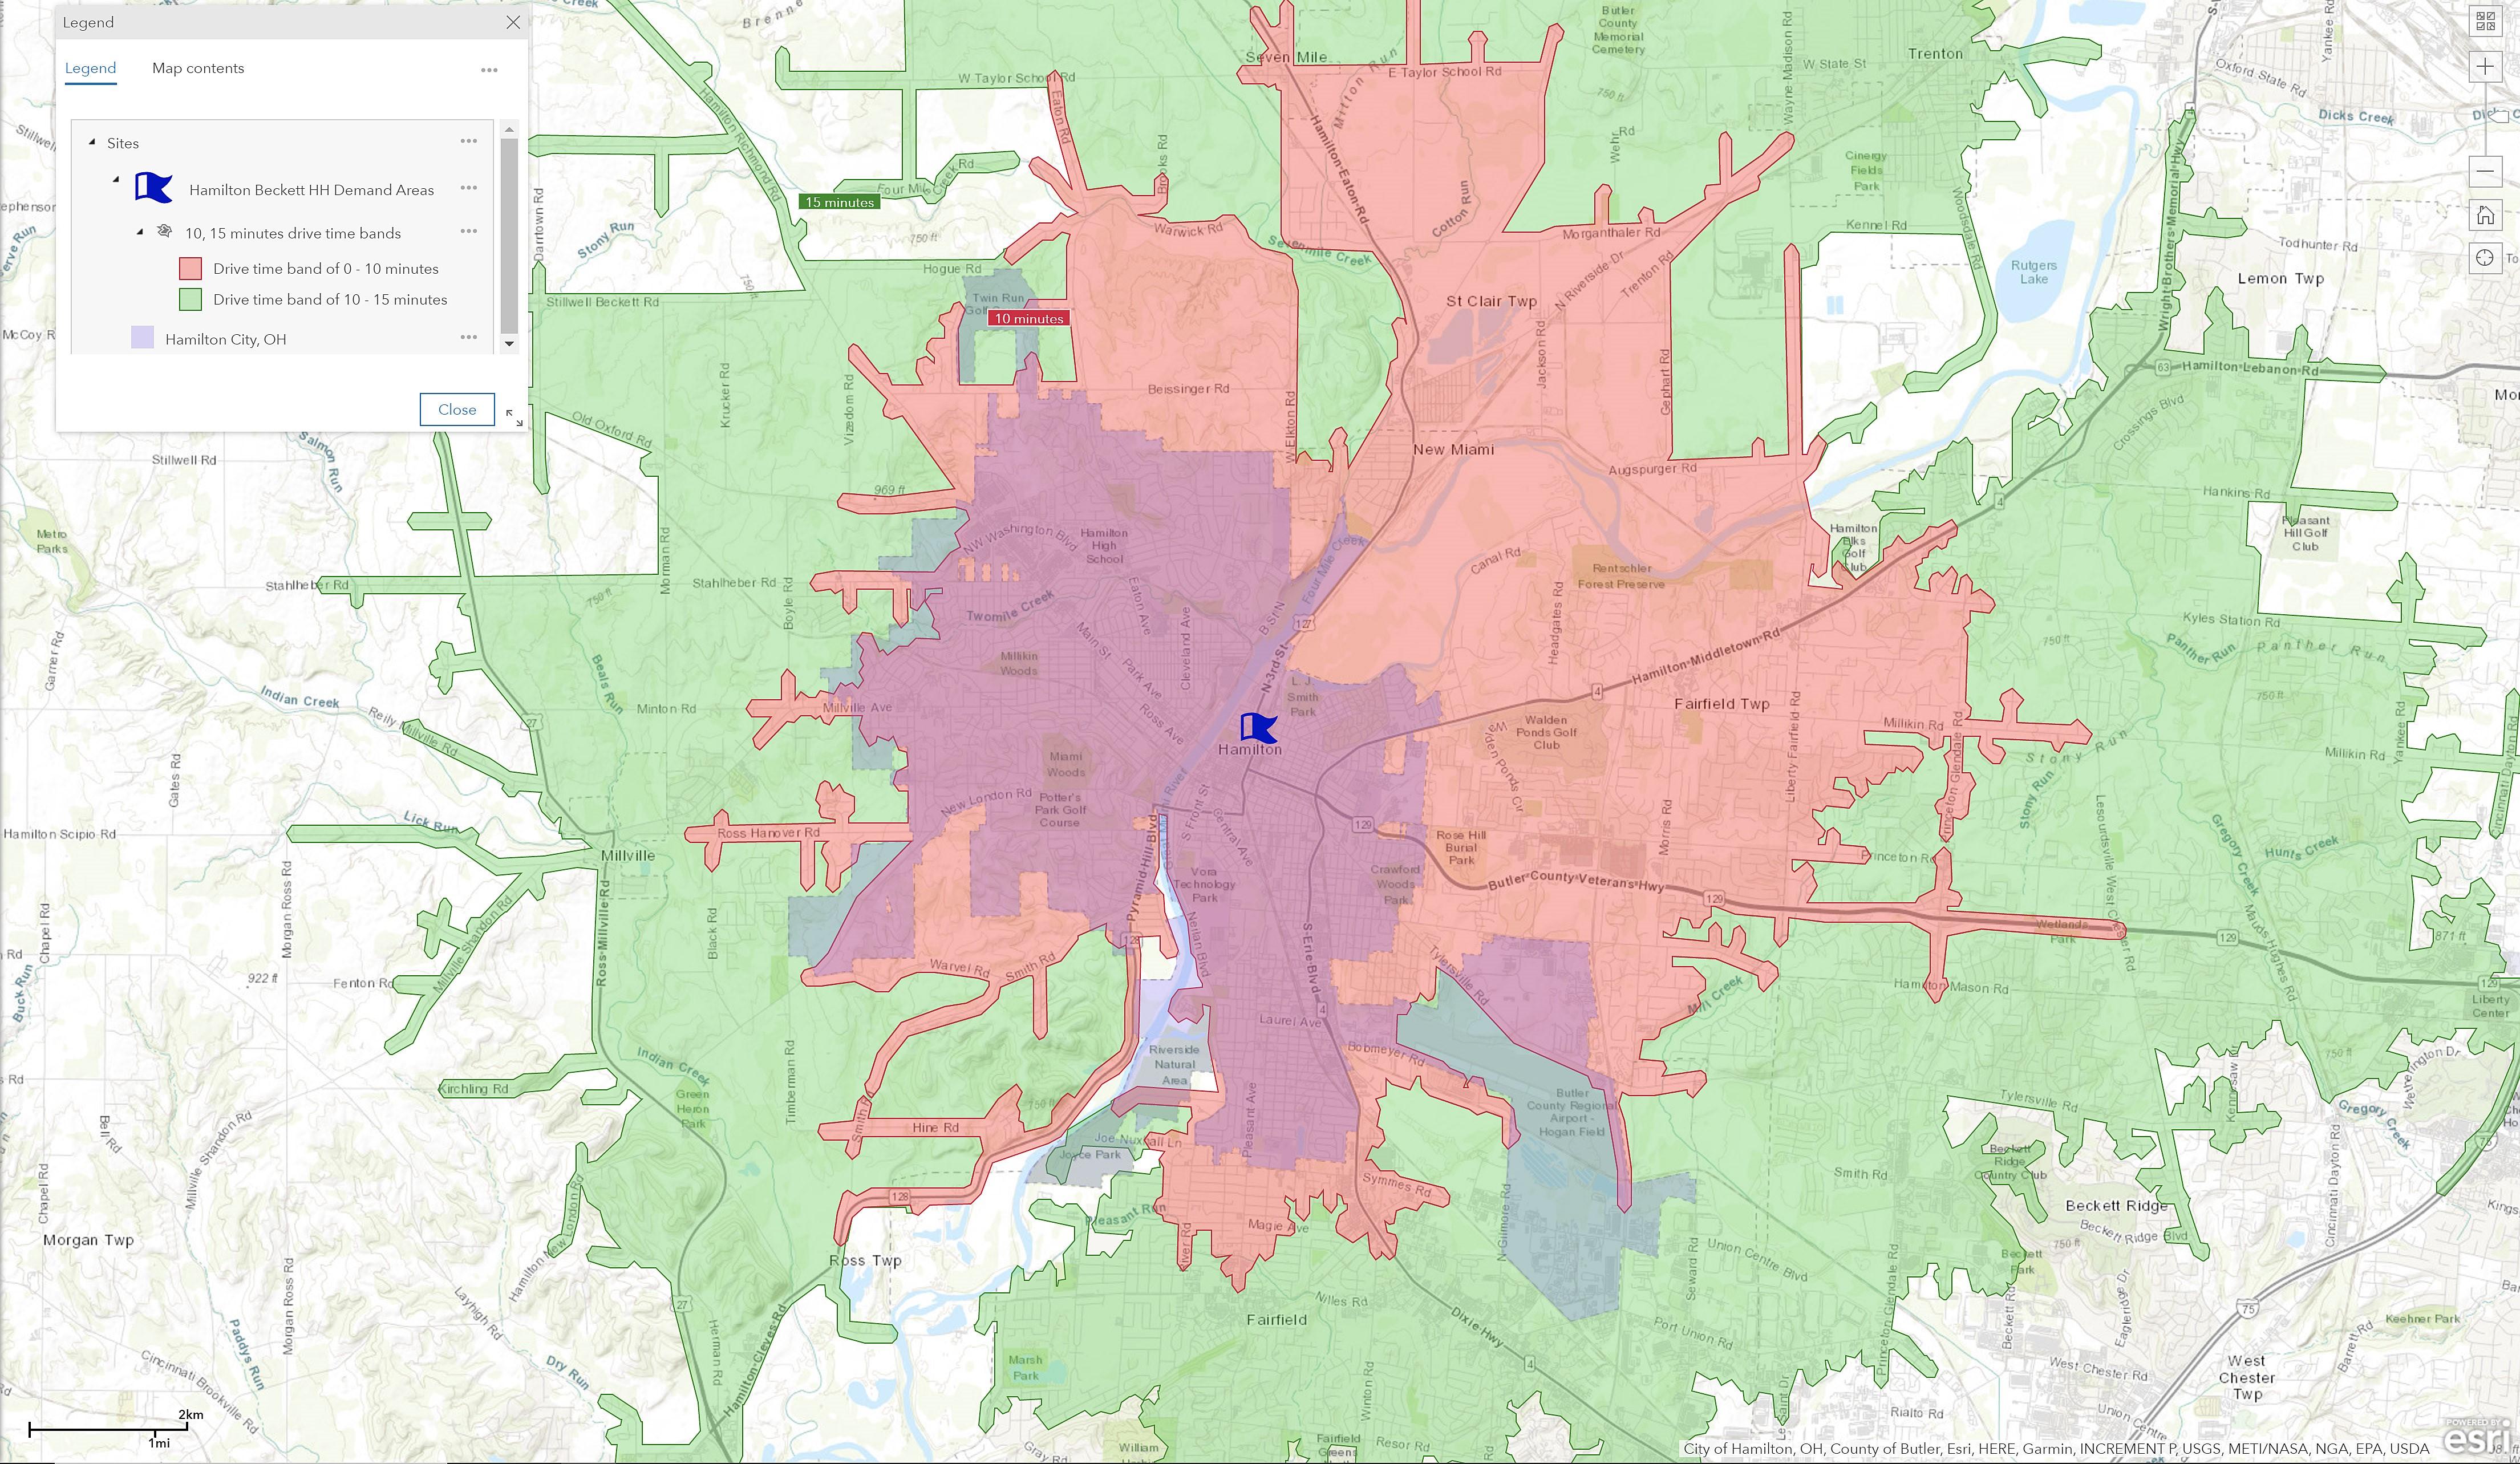
Percent 100.0% 90.0% 58.8% 31.2% 10.0% 286 48.4% 7+ Person 591 6-Person 968 381 39.4% 31.9% 5-Person 2,387 887 37.2% 1,999 32.4% 4-Person 4,972 1,584 3-Person 6,161 2-Person 11,709 3,116 26.6% 34.9% 1-Person 9,544 4,413 46.2% Number % of Occupied Total 36,332 12,666 Occupied Units Renter Occupied Units Census 2010 Occupied Housing Units by Size and Tenure 303 27.9% 85+ 1,086 75-84 2,974 587 19.7% 26.6% 65-74 3,852 850 22.1% 2,416 31.1% 55-64 6,538 1,742 45-54 7,780 35-44 6,527 2,459 37.7% 79.2% 25-34 5,915 2,995 50.6% 12,666 34.9% 15-24 1,660 1,314 Total 36,332 Renter Occupied Units Occupied Units Number % of Occupied 1,354 33.8% Other Vacant 2.1% For Migrant Workers 0 0.0% Seasonal/Recreational/Occasional Use 85 15.1% Sold - Not Occupied 123 3.1% For Sale Only 605 44.4% Rented- Not Occupied 60 1.5% For Rent 1,780 Total 4,007 100.0% Census 2010 Vacant Housing Units by Status Number Percent Census 2010 Occupied Housing Units by Age of Householder and Tenure 13,347 Vacant 4,010 9.9% 4,173 10.0% 4,273 Renter 12,666 31.4% 13,382 32.0% 38,495 Owner 23,666 58.7% 24,202 58.0% 25,148 Occupied 36,332 90.1% 37,584 90.0% Number Total Housing Units 40,342 100.0% 41,757 100.0% 42,768 Housing Units by Occupancy Status and Tenure Number Percent Number Percent Census 2010 2021 2026 2021-2026 Annual Rate 0.47% 2026 Total Population 101,181 2021-2026 Annual Rate 1.64% 2021 Median Household Income $56,342 2021 Total Population 98,854 2026 Median Household Income $61,103 Population Households 2010 Total Population 95,369 Hamilton Beckett HH Demand Areas Market Foresight, Inc. 339 Village St, Hamilton, Ohio, 45011 Latitude: 39.40355 Drive Time Band: 0 - 10 minute radius Longitude: -84.55679
2021 Housing Profile

Percent 100.0% 95.1% 74.3% 20.8% 4.9% 107 24.3% 7+ Person 440 6-Person 974 196 20.1% 15.8% 5-Person 2,760 485 17.6% 1,271 20.8% 4-Person 5,898 931 3-Person 6,108 2-Person 10,381 1,797 17.3% 21.5% 1-Person 5,681 2,141 37.7% Number % of Occupied Total 32,242 6,928 Occupied Units Renter Occupied Units Census 2010 Occupied Housing Units by Size and Tenure 152 29.2% 85+ 521 75-84 1,765 265 15.0% 12.2% 65-74 3,014 297 9.9% 1,282 16.3% 55-64 5,899 721 45-54 7,869 35-44 7,265 1,644 22.6% 69.9% 25-34 5,042 1,961 38.9% 6,927 21.5% 15-24 865 605 Total 32,240 Renter Occupied Units Occupied Units Number % of Occupied 419 23.2% Other Vacant 6.3% For Migrant Workers 0 0.0% Seasonal/Recreational/Occasional Use 113 22.6% Sold - Not Occupied 78 4.3% For Sale Only 409 40.7% Rented- Not Occupied 53 2.9% For Rent 735 Total 1,807 100.0% Census 2010 Vacant Housing Units by Status Number Percent Census 2010 Occupied Housing Units by Age of Householder and Tenure 7,918 Vacant 1,869 5.5% 1,851 5.0% 1,877 Renter 6,927 20.3% 7,884 21.4% 36,280 Owner 25,313 74.2% 27,049 73.5% 28,362 Occupied 32,240 94.5% 34,933 95.0% Number Total Housing Units 34,109 100.0% 36,784 100.0% 38,157 Housing Units by Occupancy Status and Tenure Number Percent Number Percent Census 2010 2021 2026 2021-2026 Annual Rate 0.80% 2026 Total Population 104,610 2021-2026 Annual Rate 1.56% 2021 Median Household Income $87,604 2021 Total Population 100,529 2026 Median Household Income $94,655 Population Households 2010 Total Population 91,967 Hamilton Beckett HH Demand Areas Market Foresight, Inc. 339 Village St, Hamilton, Ohio, 45011 Latitude: 39.40355 Drive Time Band: 10 - 15 minute radius Longitude: -84.55679
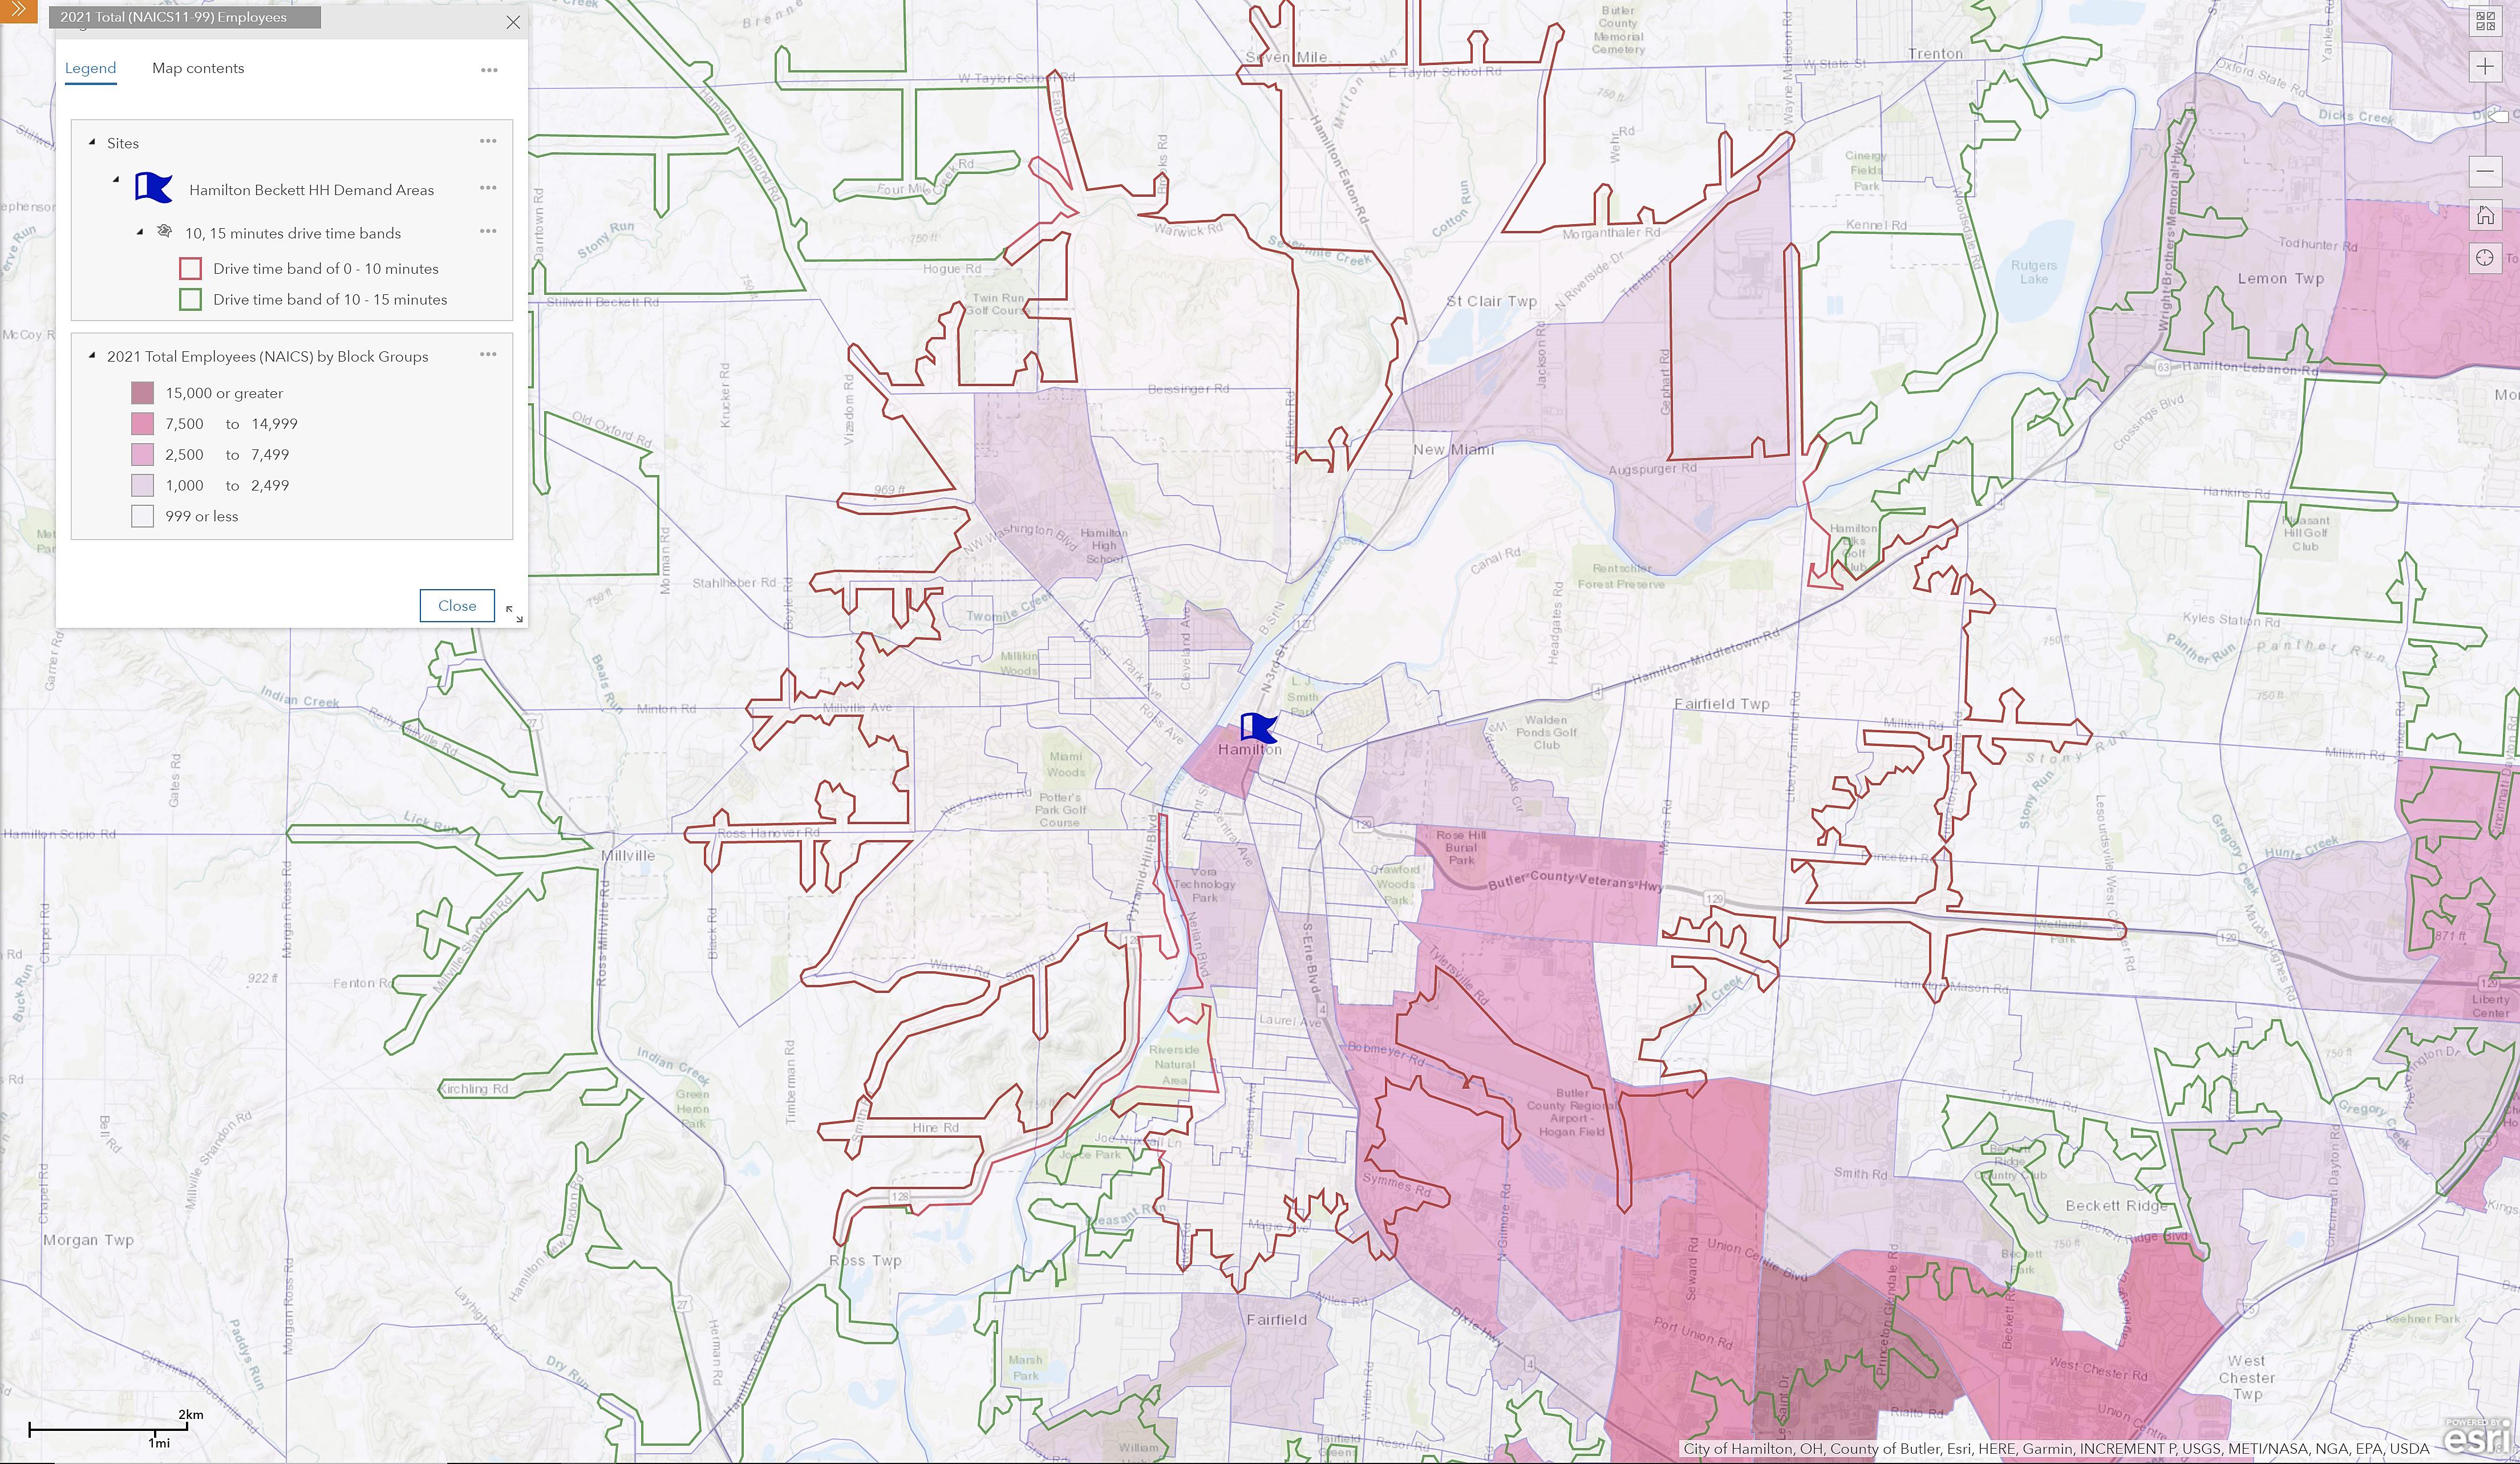
2021 Business Summary

38,956 100.0% Total 2,243 100.0% 31,143 10,457 26.8% 7,915 25.4% Total 198 0.5% 102 4.5% 170 0.5% 199 7.2% Unclassified Establishments 1,434 3.7% 139 6.2% 3,471 11.1% 54 1.9% 0.8% 82 3.0% 391 1.0% Public Administration 1,576 4.0% Automotive Repair & Maintenance 65 2.9% 247 378 16.9% 1,873 6.0% 348 12.5% 10.3% 196 7.1% 3,448 8.9% Other Services (except Public Administration) 257 0.7% Food Services & Drinking Places 169 7.5% 3,221 4 0.2% 32 0.1% 12 0.4% 10.4% 208 7.5% 3,705 9.5% Accommodation 503 1.3% Accommodation & Food Services 173 7.7% 3,253 39 1.7% 511 1.6% 54 1.9% 17.0% 242 8.7% 4,417 11.3% Arts, Entertainment & Recreation 3,610 9.3% Health Care & Social Assistance 194 8.6% 5,295 70 3.1% 3,803 12.2% 88 3.2% 0.8% 104 3.8% 957 2.5% Educational Services 46 0.1% Administrative & Support & Waste Management & Remediation Services 60 2.7% 236 2 0.1% 5 0.0% 5 0.2% 1.2% 27 1.0% 151 0.4% Management of Companies & Enterprises 3,009 7.7% Legal Services 48 2.1% 360 162 7.2% 1,003 3.2% 218 7.9% 1.5% 116 4.2% 761 2.0% Professional, Scientific & Tech Services 1,257 3.2% Real Estate, Rental & Leasing 89 4.0% 453 31 1.4% 158 0.5% 55 2.0% 0.5% 38 1.4% 165 0.4% Insurance Carriers & Related Activities; Funds, Trusts & Other Financial Vehicles 380 1.0% Securities, Commodity Contracts & Other Financial Investments & Other Related Activities 20 0.9% 169 56 2.5% 498 1.6% 52 1.9% 2.6% 145 5.2% 1,802 4.6% Central Bank/Credit Intermediation & Related Activities 422 1.1% Finance & Insurance 107 4.8% 825 36 1.6% 334 1.1% 43 1.6% 3.6% 76 2.7% 1,218 3.1% Information 138 0.4% Transportation & Warehousing 43 1.9% 1,119 33 1.5% 5 0.0% 29 1.0% 0.7% 50 1.8% 289 0.7% Nonstore Retailers 465 1.2% Miscellaneous Store Retailers 37 1.6% 225 29 1.3% 1,107 3.6% 19 0.7% 0.7% 21 0.8% 154 0.4% General Merchandise Stores 515 1.3% Sport Goods, Hobby, Book, & Music Stores 22 1.0% 222 21 0.9% 159 0.5% 52 1.9% 0.2% 9 0.3% 48 0.1% Clothing & Clothing Accessories Stores 1,507 3.9% Gasoline Stations 15 0.7% 57 33 1.5% 534 1.7% 39 1.4% 3.6% 47 1.7% 1,000 2.6% Health & Personal Care Stores 752 1.9% Food & Beverage Stores 50 2.2% 1,118 21 0.9% 680 2.2% 32 1.2% 0.4% 18 0.6% 113 0.3% Bldg Material & Garden Equipment & Supplies Dealers 229 0.6% Electronics & Appliance Stores 7 0.3% 128 17 0.8% 111 0.4% 16 0.6% 2.0% 76 2.7% 1,517 3.9% Furniture & Home Furnishings Stores 6,727 17.3% Motor Vehicle & Parts Dealers 62 2.8% 622 346 15.4% 4,968 16.0% 407 14.7% 2.4% 104 3.8% 1,651 4.2% Retail Trade 4,934 12.7% Wholesale Trade 60 2.7% 752 67 3.0% 1,920 6.2% 132 4.8% 3.0% 219 7.9% 1,919 4.9% Manufacturing 29 0.1% Construction 166 7.4% 920 3 0.1% 208 0.7% 3 0.1% 0.0% 2 0.1% 12 0.0% Utilities 25 0.1% Mining 0 0.0% 0 8 0.4% 25 0.1% 7 0.3% Percent Number Percent Number Percent Agriculture, Forestry, Fishing & Hunting Employees by NAICS Codes Number Percent Number Businesses Employees Businesses 100.0% 2,773 100.0% 100,529 Employee/Residential Population Ratio (per 100 Residents) 32 39 Total Residential Population: 98,854 2,773 Total Employees: 31,143 38,956 Total Businesses: 2,243 Data for all businesses in area 0 - 10 minute 10 - 15 minute Hamilton Beckett HH Demand Areas Market Foresight, Inc. 339 Village St, Hamilton, Ohio, 45011 Latitude: 39.40355 Drive Time Bands: 0-10, 10-15 minute radii Longitude: -84.55679
- -
-
-

--