Amit Kumar, a rising researcher in neurochemistry, and Associate Professor Jess Nithianantharajah, Head of Florey Department of Neuroscience and Mental Health, University of Melbourne, had the opportunity to meet during the 2024 ISN-JNC Flagship School in Naxos, Greece, where the focus on the Neurochemistry of Mental Illness set the stage for their in-depth discussion on schizophrenia and ground-breaking research.
Amit: With the recent FDA approval of Cobenfy*, do you see this as a groundbreaking step in antipsychotic treatment after 70 years? How far have we come in developing more effective therapies for schizophrenia?
Jess: What an incredible watershed moment – 70 years since we’ve seen a new mechanism of action drug developed for schizophrenia. This is truly something to celebrate — it highlights the hard work of discovery science, and the impact research can have in creating new treatments. It’s been a long journey, but this breakthrough shows that progress is possible.
Current medications for schizophrenia directly target dopamine receptors to alleviate the positive symptoms. While these work for many, they don’t work for all, and there’s still a need to improve these treatments, especially given the large side effect profiles that impact compliance. Reducing the burden of side effects remains essential for new treatments. Cobenfy* hits an entirely different neurochemical system in the brain, confirming that new medications that target different pathways and systems in the brain can positively alleviate symptoms in schizophrenia, with potentially less side-effects.
We’re at a great point in understanding the complexity and heterogeneity of schizophrenia recognizing that not everyone responds to the same treatment because the underlying neurobiological basis is different between people. This knowledge pushes us to develop treatments that more directly address specific symptoms. Additionally, huge advancements in drug discovery mean the design of new medicines is far more sophisticated.
There have been major learnings on how to target molecules to only bind to certain parts of receptors, thus being able to finely dial-up or dial-down function or primarily hit the brain over the rest of the body. These refined approaches can significantly reduce off-target effects, so treatments have fewer systemic side effects that lead to metabolic issues like weight gain, diabetes, cardiovascular disease or sleep problems, which still challenge individuals with schizophrenia.
We’ve come a long way, but we have much further to go. A key takeaway, especially from this Flagship School, is the importance of collaboration across disciplines. We’ve heard from clinicians about their perspectives and needs from the patient side, and from fundamental neuroscientists who’ve shared the biological insights they’re uncovering about mental illhealth. Maintaining this communication between fields and fueling multidisciplinary approaches is crucial for progress and advancing the translational impact of research.
Amit: What role do you see AI playing in the diagnosis and treatment of schizophrenia? How might it help address some of the current challenges?
Jess: One of the exciting aspects of big data science is the capacity to integrate different pieces of the puzzle. Ultimately, achieving predictive therapeutic diagnosis won’t come from any single factor alone. Advanced AI offers hope here, as it can combine information from multiple levels for an individual to better inform which treatments someone might respond best to. We’re not there yet, but we’re getting closer and closer to a more effective approach. This is where I believe AI can make a big difference.
Amit: AI is a game-changer because it can analyze thousands of brain scans and imaging data in just seconds — something that would take an individual month to complete.
Jess: And it’s multimodal, right? As we gather more comprehensive data sets at multiple levels genetics, blood markers, neuroimaging, symptom profiling — for individuals, AI can integrate whatever information is available into a more holistic model to support that predictive therapeutic diagnosis. As more data is obtained, we can feed it back into these models to update the predictions. AI shouldn’t be seen as a threat to replace consultation by healthcare professionals, but as a tool to help healthcare professionals refine their decision-making on diagnosis and optimal treatment selection for each person.
Amit: What are your thoughts on the societal stigma surrounding schizophrenia, and how do you think we can work toward greater understanding and acceptance?
Jess: I think this is such an important point about schizophrenia. Unlike other mental health conditions — like anxiety or depression, which society broadly accepts — schizophrenia is still very misunderstood. Even the term ‘schizophrenia’ began with the idea of a ‘split brain’ or ‘split personality,’ which has contributed to misunderstandings over the years. Schizophrenia is a complex, chronic condition, and the lack of understanding around it means that stigma is still a major issue.
While awareness campaigns have helped shift perceptions over the years, and progress has been made, really tackling this stigma and promoting acceptance relies on more biological understandings – knowledge is the key.
The better we understand schizophrenia and provide a clearer picture of its neurobiological basis, the more we can demystify and break down the black box of what it means to have this condition. The more we share about its cases and underlying biology including the fact that these processes are different for everyone — the more society can view it like any other health condition and embrace greater acceptance.
An ultimate goal for mental health conditions like schizophrenia is to have them viewed and accepted in the same way as physical health conditions.
Amit: What are the challenges in developing touchscreen tasks to model or assess symptoms like visual hallucinations in psychosis research?
Jess: All the touchscreen tests I presented today at the Flagship School Session use visual stimuli to assess cognitive processes, and our work with these visual tests has primarily focused on cognitive symptoms. But you rightly highlight the challenge of measuring something like visual hallucinations in a rodent touchscreen-based task—it’s difficult. There’s a famous quote: ‘All models are wrong, but some are useful,’ which applies here. Understanding the limitations of our tools is essential. While visual tests can be adapted to explore perception and processing, modeling hallucinations in rodents is particularly challenging. For instance, increasing dopamine with psychostimulants can cause psychomotor agitation and hyperactivity in animals, which we use as a proxy for psychosis-like behavior. While this doesn’t replicate psychosis as experienced by individuals, it involves the same neurochemical changes. This test remains a valuable model to explore psychosis and has predictive validity, providing a way to assess novel antipsychotic treatments.
*Cobenfy is a newly approved antipsychotic medication that targets a novel neurochemical pathway in the brain.
For the full interview, click here
FROM NAIVETY TO NOVELTY: MY ISN-CAEN 1A RESEARCH VISIT EXPERIENCE
A few years ago, I obtained my PhD in Physiology from Ahmadu Bello University, Zaria, Nigeria. My research was focused on elucidating the mechanistic involvement of natural products and neurochemicals in protection against epileptogenesis and epileptic seizure. However, due to limited equipment and expertise in molecular / electrophysiological techniques, I sought opportunities to broaden my skillsets and enhance my research capabilities. While attending a conference of the Neuroscience Society of Nigeria, I got to know about the International Society for Neurochemistry (ISN) and the various opportunities that its membership provides.
Therefore, membership, ISN-ESN travel successful. meeting lot research. I met Duarte Neuroscience and Cell Biology, University of Coimbra, Portugal, and interacted with him about research at his lab. I was excited to know that his main research focus is on Neuronal Signaling and with an investigator in his lab working on the Molecular mechanisms of Epileptogenesis. Since one of the objectives of the ISN Committee for Aid and Education in Neurochemistry (CAEN) is the opportunity to stimulate neurochemistry
Image 1: While conducting an experiment at the lab
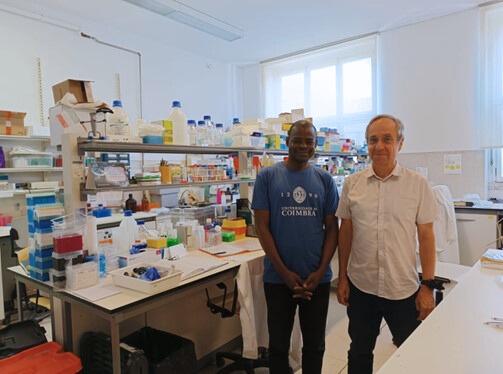
Image 2: With Prof Carlos B Duarte at the lab
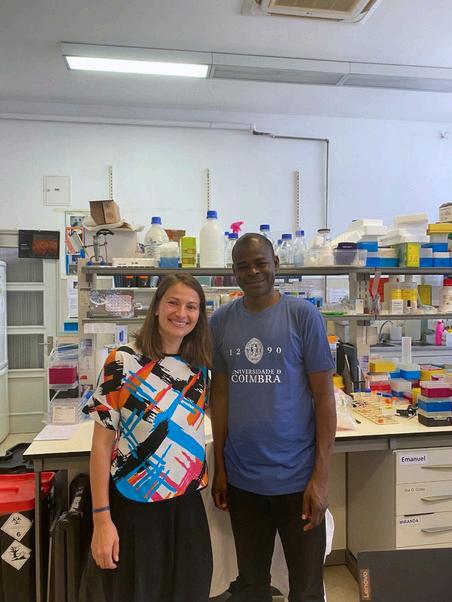
Image 3: With Dr. Miranda Mele
research in areas of economic deprivation and developing countries by providing funds for traveling to another laboratory to develop new technical or conceptual expertise, I took advantage of this opportunity and applied. Luckily the application was successful and after all the necessary preparation, I travelled to Portugal for a twomonth lab stay at the Centre for Neuroscience and Cell Biology to work on the project titled “The BDNF-TrkB Signaling in Pilocarpine Model of Temporal Lobe Epilepsy” at Professor Carlos B. Duarte’s lab under the supervision of Dr. Miranda Mele.
The two-month stay at the lab was quite a momentous one. The fatherly guidance and friendly demeanor of Prof Carlos coupled with the passionate concern, care, and support from Dr. Miranda made the training at the lab easy and worthwhile.
There, I learned techniques such as subcellular brain fractionation (preparation of synaptoneurosomes), quantitative immunocytochemistry and analysis of the alterations in the surface expression of receptors in hippocampal synaptoneurosomes, western blot analysis of protein phosphorylation, fluorescence and confocal microscopy, exposure to cell culture and electrophysiology techniques. These are skills I am working toward implementing in my current and future research work. I also participated in the weekly lab meeting and gained a lot through the presentation of lab members. While there, I participated in the Neuroscience retreat of the Centre for Neuroscience and Cell Biology (CNC)/Centre for Innovative Biomedicine and Biotechnology (CIBB) and gained a lot through the scientific presentations and forum discussions.
Finally, my profound appreciation to ISN and the ISN Committee for Aid and Education in Neurochemistry for the offer and opportunity to develop my research capabilities. Also, thanks to Prof. Carlos B. Duarte and Dr. Miranda Mele for accepting me and guiding me through the research process. I encourage PhD students and postdocs to register for ISN membership and take advantage of the various support systems of ISN for career development in neurochemistry.
Written by Philemon Paul Mshelia Department of Human Physiology, Abubakar Tafawa Balewa University, Bauchi, Nigeria
I also visited the Science Communication office at the Centre and had a robust conversation with them and was carried through the art and practices of good science communication as well as various sites I could visit to get invaluable information for effective science communication. The Lab visit has allowed me to interact with various researchers and research groups at the Centre, thereby creating a network for future research.
Aside from the lab and research activities, I participated in and enjoyed some social events organized by the lab and the Centre such as hiking, picnics, and lunch outings. This provided me with the opportunity for social interaction with others. I also participated in and enjoyed some cultural festivals at the university and the town of Coimbra such as Queima das Fitas.
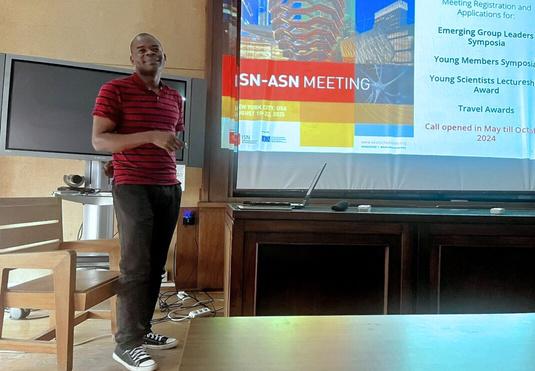
Image 4: Presentation about ISN at a lab meeting
ALTMETRIC SCORE
WHAT SORT OF ATTENTION ARE YOU GETTING?
Way back in the day, the reputation and impact of scientists were estimated by their peers, based on reading their articles, noting acknowledgments and accolades, and relying on other somewhat intangible measures. The advent of searchable citation databases quickly spawned metrics like journal impact factors, citation counts, fieldweighted citation indexes, and the now ubiquitous H-index.
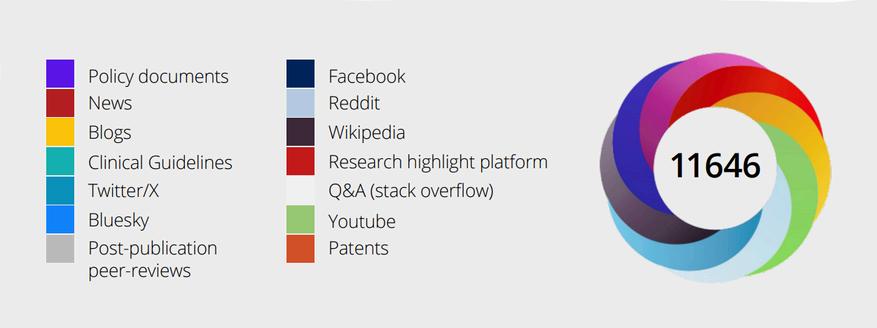
With the rise of social media and the growing need for scientists to “score” the impact of their research, it was inevitable that a way to quantify this impact would be realized Thus, the Altmetric Attention Score was born. Today, most researchers are familiar with the colorful Altmetric “donut,” where the colors represent different kinds of attention an article has received, and the number at the center is the total score. But what contributes to this score? And how does Altmetric calculate it? Is a sudden fall in the score something to worry about, or is it simply due to people rage-deleting their Twitter accounts?
Posts on social media platforms like X (formerly Twitter) and Bluesky are brief, have a low barrier to entry, and can be numerous Anyone can post, including bots Because of this, Altmetric scores these interactions relatively low, capping at 200 reposts These contributions add a light blue color to the Altmetric donut. Blogs, on the other hand, are typically longer and require more effort to create, even though anyone can write one They score 5 points and appear as light orange on the donut
News stories from established outlets such as The New York Times, The Guardian, or The Telegraph hold more weight because they aren’t self-generated These score 8 points and are represented by dark red on the donut. Surprisingly, some of the most important attention sources come from low-scoring categories like policy documents and guidelines, which score 3 points per source Wikipedia entries are similarly modest, while patents score based on the jurisdictions that cite the work Other colors and scores are assigned for mentions on platforms like Facebook, Dimensions, Mendeley, Reddit, and YouTube
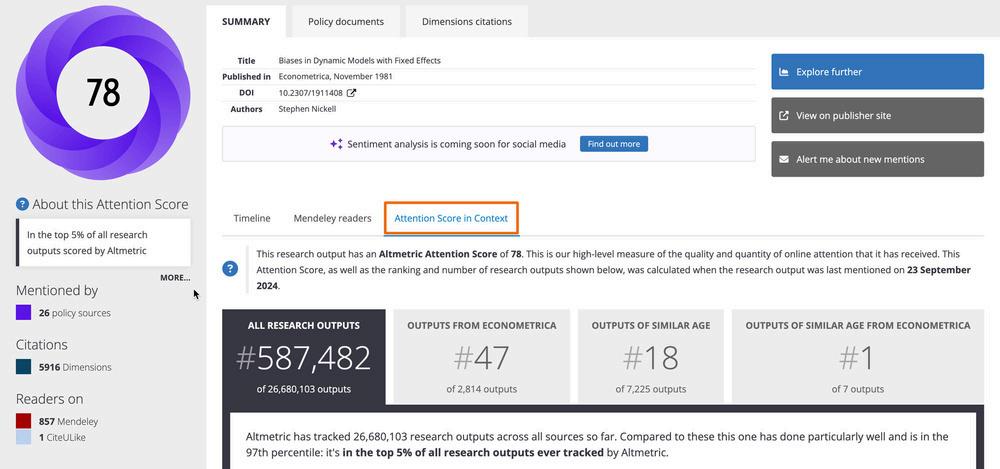
But, like most metrics, the score itself is fairly meaningless without proper co Altmetric recently posted about a paper with a score of 78. How do we interpr On its own, it’s impossible to tell However, digging deeper reveals that significant impact on policy, being cited in 171 documents from 29 different paints a clear picture of uptake and reuse
The score of 78 becomes even more insightful when compared Is this unusually high or low attention for the journal? For the time period? Or a combination of both? Comparative metrics show that this "low" score was actually the highest for a publication in that journal at the time it was released.
Now consider another example shared by Altmetric: a paper with a score of 4691 That number sounds impressive, but does it represent a good Altmetric Attention Score? It even appears in policy documents, which might suggest excellence
However, this paper is the famous MMR vaccine “study”, which was eventually retracted. While it received significant attention, the context of the discussion matters. High scores don’t always mean positive impact, just as low scores don’t necessarily imply failure. Are those "high" academic citations reflective of good news? Likely not.
The Altmetric Attention Score is primarily a measure of virality and the type of attention an article receives. It does not directly explain or measure the impact of your research Instead, it provides a framework to place items for review and analysis. Numbers alone don’t tell the whole story
You are not your Altmetric Attention Score Research offices shouldn’t aim to simply “increase” the score because that’s not its purpose Instead, it serves as a starting point for context and deeper analysis
Looking to the future, Altmetric has announced that beginning in 2025, they will start processing sentiment for posts on X and BlueSky This means analyzing whether mentions are positive or negative. As always, the advice is to interpret the numbers with a healthy dose of context
F R O M T H E A R C H I V E S
TThe ISN Archive acts as a repository of the corporate, scientific and social memory of ISN and serves as source of searchable information which is pertinent to ISN’s activities The ISN Archive stores important information that may be required by later generations of ISN officials and ISN members to understand how ISN has progressed and developed over the decades, why given decisions were made by ISN and which consequences followed after those decisions
The history of the ISN Archive started in 1986 when ISN Historian Henry McIlwain was appointed as first ISN Archivist He started the task to establish an archive for ISN with great enthusiasm and commitment. The collection of documents was easy for him, at least for recent years, but quite difficult for the early years of our society which had been founded almost 20 years earlier in 1967 Henry McIlwain published in the ISN Newsletters several appeals to find missing documents from the early years of ISN. Many committed ISN members looked through their shelves and cabinets, found missing documents and provided missing documents, minutes and conference books which are stored now in the ISN Archive.
The initial collection of documents was stored in 50 grey boxes of archive quality lined cardboard (Figure 1) The boxes contained minutes of meetings, contracts, membership directories, newsletters, meeting programs, photographs, correspondence, and many other types of documents
All Historians continued the collection of important ISN documents for the ISN Archives and used the original grey boxes for storage
By taking over the job as ISN Historian in 2021, I automatically became the ISN Archivist. To get some first impressions on how to handle an archive, I tried to inform myself, bought a book on archiving and started reading Then I contacted the archivists of my University who were so kind to give me a crash course in archiving with heaps of good tips and advice what could be done (and what should not be done) For example, I learned that special acid free print paper and carton storage boxes made of such materials should be used for longtime storage of paper documents I also was told that for long-time storage plastic covers, plastic envelopes as well as metal clips should not be present in, around or in contact with stored paper documents in archive boxes
Figure 1: The original grey boxes
TTo get started with my work on the archive, I first tried to get an overview on the content of the old grey archive boxes These boxes had all types of old and inconsistent labels on them (Figure 1) Unfortunately, I could not find an inventory that would provide helpful information on which box contains which types of documents Therefore, I started to (re)organize the archive, developed a new structure with a suitable substructure (Figure 2) and implemented this new structure by storing the paper documents of the old archive in 40 new and bigger (but still grey) archive boxes (Figure 3). During the transfer of the documents from the old to the new boxes, I removed hundreds of transparent plastic envelopes (this helped to regain heaps of space in the archive boxes), metal paper clamps and tacker clips The new archive boxes contain now the paper documents as shown in the new inventory, are properly labeled for their content and are stored in the Archive cabinets
In addition to the 40 grey boxes, the physical ISN archive contains all printed issues of the Journal of Neurochemistry which requires more than half of the available physical storage capacity The total storage space currently needed for the physical ISN Archive is around 2 5 m , distributed over 3 large cabinets As space is a severe problem for every physical archive, the suggestion to digitalize the archive was frequently brought up during the last decade
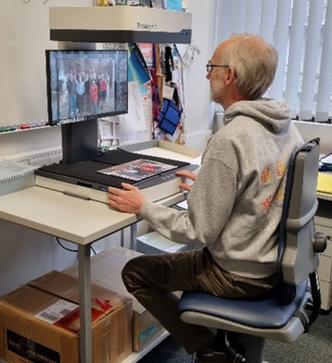
With the new structure of the physical archive, we had a good base to get started with the digitalization of important ISN documents to create a digital ISN Archive. ISN kindly provided a highquality laser scanner (Figure 4) that we used to digitalize important paper documents (such as minutes of ISN Council and general business meetings, contracts, program books of ISN meetings, photographs, etc.…). The digital ISN Archive contains currently already more than 1500 electronic files of important documents In addition, more than 1600 digital photographs are stored showing ISN Officials, ISN Councils and ISN members, but also giving impressions on various ISN meetings and ISN events The 3100 files of the digital archive cover only around 12 GB on a small 1 TB hard disk. Thus, we have heaps of digital space to collect more documents for the digital ISN Archive
A large number of new ISN documents will have to be continuously stored every year in the ISN Archive. As the majority of these documents is anyway distributed and available in electronic form, the digital ISN Archive is likely to expand strongly in the coming years The physical ISN Archive will only be updated by the most important new documents For this the electronic files will be printed on acidfree paper and these paper documents will be stored in the grey boxes of the physical archive Among those are the minutes of Council meeting, important contracts signed by ISN and the program books of our biennial meetings
Figure 2: Archive structure
Figure 3: The new grey boxes
Figure 4: Me and the
CCompared to storage of electronic files, the long-term storage in paper form appears to be a rather safe way to maintain such documents (as long as fire or water can be avoided in the archive) This is clearly demonstrated by the good quality of most of the paper documents in the physical archive dating back to the early years of ISN in the 60th and 70th of the last century Storing electronic files has the advantage of requiring little physical space However, continuous updating of file formats and storage devices will be required to keep the electronic files accessible throughout the coming decades via up-to-date computers and suitable programs.
During my work on the content of the physical archive, I realized that quite some documents from the last two decades were missing To find such documents for the archive, I contacted many previous Officers and ISN Council members and received positive responses from many as well as a substantial part of the missing documents However, the hunt for missing documents continues (and will most likely never end).
2004 ISN Advanced School in Avignon - Program and Abstract Book, photographs
2004 ISN Special Neurochemistry Conference in Avignon - Program and Abstract Book, photographs
2006 ISN Special Neurochemistry Conference in Antigua – Program Book, photographs
2014 ISN Special Neurochemistry Conference in Tokyo - Program and Abstract Book, photographs
Printouts (or electronic files) of the material distributed as ISN Newsletters in the years 2006 to 2008 In these years the newsletters were only distributed to the members via the web, not anymore in printed form These newsletters cannot be retrieved and are currently not accessible anymore
Photographs of the past ISN Presidents wearing their Dinosaur T-Shirt
Photographs (printed or digital) of previous ISN Councils, from ISN Biennial Meetings or ISN Advanced Schools from before 2010
Figure 5: Missing documents
Documents and photographs that I am currently hunting for are listed in Figure 5 If you should have some of these documents or may know somebody who could still have them, please be so kind to help me to get the missing documents for the ISN Archives Your help in this matter will be very much appreciated
Please consider that the memory of ISN Officers, Council members and ISN administration on ISN related issues and developments can only last for some years Therefore, it is essential to store important key documents in the ISN Archive This will enable future generations to retrieve information on the development, the organization and the structure of our society as well as on the people who have been involved and in charge. In addition, the content of the ISN Archive will help to keep the memory alive on the high scientific quality of our meetings and schools and on the fantastic atmosphere of our ISN events
Readabout...
...the idea of the “expert’s dilemma” or how achieving interdisciplinary creativity can result in loss of credibility amongst your peers as a focused expert.
2000+ science and medical art visuals. This collection of free, highquality vectors, icons and brushes has been created by professional illustrators.
https://bioart.niaid.nih.gov
renaissance expert nomad
interdisciplinarity
BOWERBIRD ISN
Curator of the interesting, useful and occasionally quirky.
...the power of two, and principals learned from a scientific partnership of 16 years and operation of a joint laboratory
https://jci.me/145966/pdf
Flagship School The 5th ISN-JNC
Poster Winner Questionnaire -
01
COMMUNICATION
How do you decide what information to include on your poster and what to leave out?
I try to prioritize the research question, briefly show how we addressed it, and explain key findings and their relevance to the topic. It's really difficult because, as a scientist, you are usually attached to your data and try to include everything. However, it's really important to leave out details about methods and ancillary data to maintain clarity and focus.
How do you make sure the most important points of your research stand out on your poster?
Dividing the poster into clear sections usually helps both the presenter and the reader to position themselves. I usually allocate two-thirds of the poster to the rationale, main findings, and conclusions, and I use bold headings for each results subsection. If the results are published, I typically include a QR code with a direct link to the online version of the paper.
T I M I N G S 02
What is the best way to effectively communicate your research when you only have limited time to present?
The best approach for me is to prepare an elevator pitch of about 5–10 minutes that tells a story. Then, of course, I focus on making key points, such as the main hypothesis and main findings, stand out. Using an informative and engaging title, arranging results in 'fast blocks of information,' and supporting them with appealing visuals usually helps (people are often bored by excessive text). Highlighting the conclusion and significance of the findings with colorful diagrams or schemes also helps people retain the overall message.
ENGAGEMENT 03
How do you adapt your approach when presenting your poster to different audiences? For instance, how does your presentation style differ when engaging with participants at the Flagship School compared to experienced researchers?
Engaging and adapting to different audiences can be tricky, especially if it’s your first time presenting a poster. Try to gauge the audience beforehand by asking if they work in the field or not. My tip is to simplify concepts and use relatable analogies for non-experts while focusing on detailed data and technical nuances for experienced researchers. I aim to keep it engaging for both audiences by tailoring my language and leaving room for discussion during the presentation, so everyone can participate.
How would you (quickly) describe your research to those who are unfamiliar with neurochemistry?
Keeping it as simple as possible and, again, using analogies for complex concepts is key. There is a danger of oversimplification, but I usually focus on discussing the main findings without going into too many specifics. Non-experts often only remember the main message, so it’s important to ensure that it is clear and impactful. For example: 'I study how chemical imbalances in the brain contribute to mental illnesses, like depression, aiming to understand their causes and identify better treatments.'
What approaches do you use to make your research relatable and engaging?
Being passionate about your research and using real-world examples to explain complex processes (for instance, how chronic stress may impact a specific process in the brain) can make your presentation more relatable. Emphasizing the impact of the findings through varied voice intonation also helps to capture attention. One technique that often works is inviting questions from the audience to create an interactive experience.
What design or text choices do you think are the most important for grabbing someone’s attention in busy poster sessions?
I usually use a clean, organized layout with bold headings, subheadings, contrasting colors, and minimal text. High-quality visuals are essential for immediately capturing attention.
Are there any specific methods you used during the Flagship School that made your poster interesting?
Not particularly. I just tried to keep it simple and relaxed, knowing I was addressing people from different backgrounds and working on diverse research topics.
ADVICE 04
What is the one thing that people need to remember when presenting a scientific poster?
I think a key takeaway would be to engage the audience both visually and verbally while presenting a clear, compelling story that highlights the significance of your research.
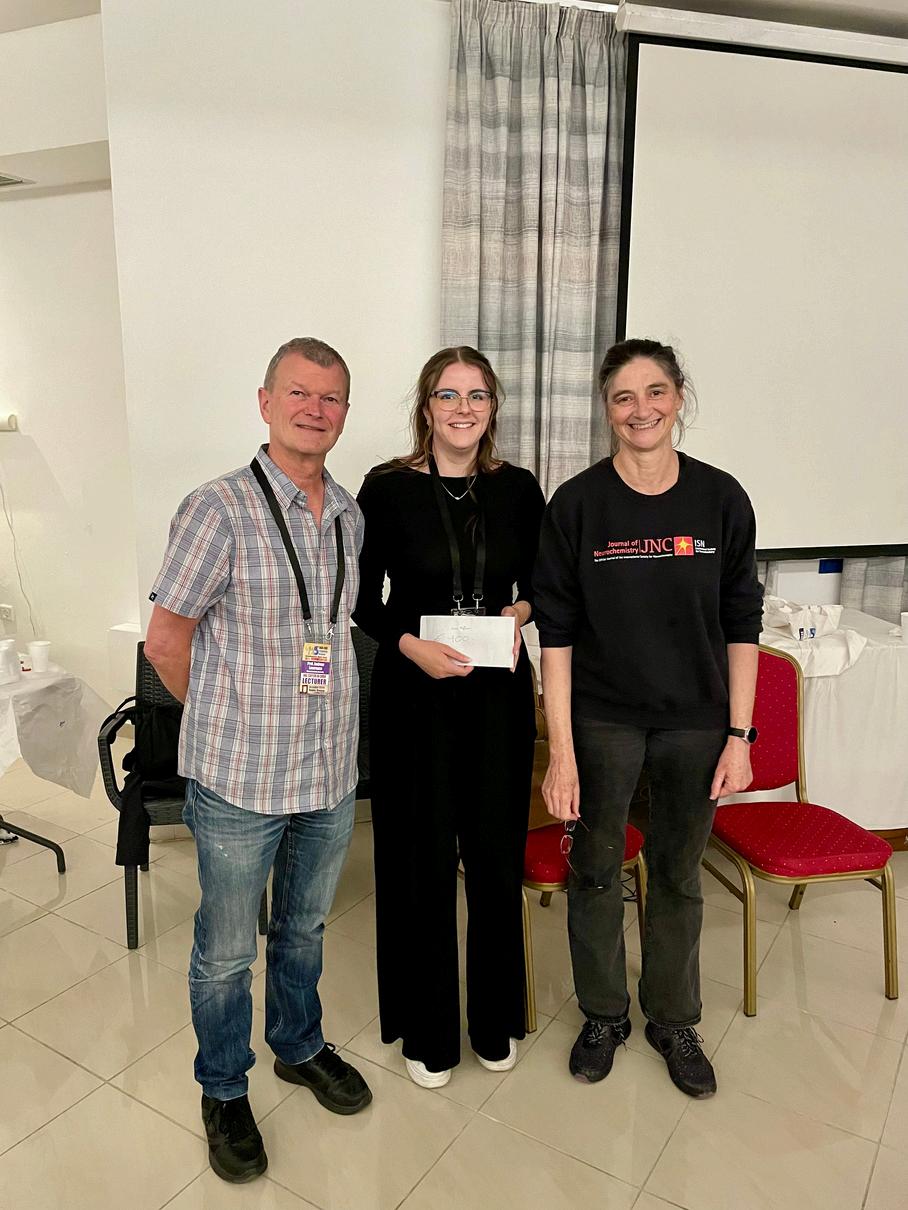
Image 1: Rui next to his winning poster
Image 2: Rui with the ISN President and the JNC EiC
Flagship School The 5th ISN-JNC
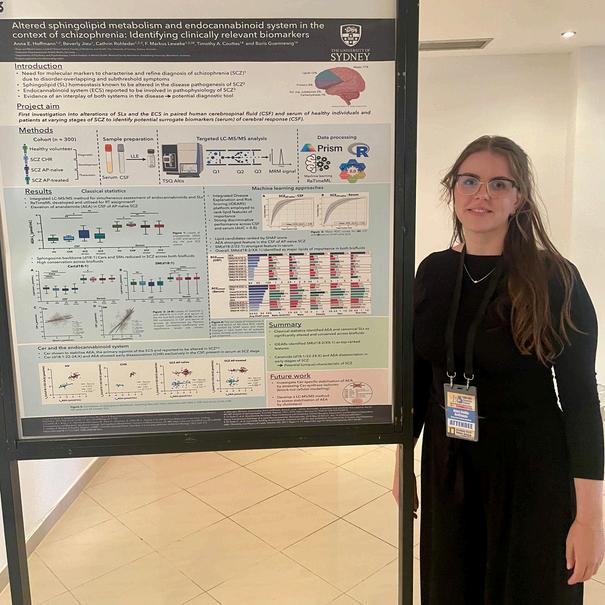
Poster Winner Questionnaire - Anna Hoffmann
01
COMMUNICATION
How do you decide what information to include on your poster and what to leave out? I usually start by creating a general outline with slightly more data and information in each section than I plan to include. From there, I focus on condensing the content, leaving out unnecessary details that are non-essential for understanding or that might be repetitive.
How do you make sure the most important points of your research stand out on your poster? I ensure the most important points of my research stand out by using high-quality, comprehensive, and easily understandable figures that convey the main findings with minimal reading required. Additionally, I highlight key findings using standalone text, larger font sizes, italics, bold formatting, or arrows to draw attention.
T I M I N G S 02
What is the best way to effectively communicate your research when you only have limited time to present?
Having a thorough understanding of your research is important, but it’s also crucial to remember that the audience may not be familiar with your specific project. Instead of trying to include as much information as possible, which can result in speaking too fast or losing the audience’s attention, I focus on presenting the main findings highlighted on the poster. I also mention that additional details or questions can be addressed during the poster viewing.
03
ENGAGEMENT
How do you adapt your approach when presenting your poster to different audiences? For instance, how does your presentation style differ when engaging with participants at the Flagship School compared to experienced researchers? The overall quality of the presentation remains consistent, but I adapt my language and approach based on the audience. For example, when presenting to fellow PhD students or peers, I might incorporate references to shared experiences or previous knowledge from our time together, such as activities or discussions during the Flagship School.
How would you (quickly) describe your research to those who are unfamiliar with neurochemistry?
My project focuses on identifying clinically relevant lipid markers to improve schizophrenia diagnostics and monitor disease progression. To achieve this, I use mass spectrometry, neuroimaging, and advanced machine learning to analyze matched cerebrospinal fluid and serum samples from diverse cohorts of study participants and healthy volunteers.
What approaches do you use to make your research relatable and engaging?
I use visually striking, modern figures that catch the eye and maintain interest, as they are crucial for engagement. I also make a conscious effort to keep the bigger picture in mind, relating each major finding back to the overall project objective to avoid getting lost in the details.
What design or text choices do you think are the most important for grabbing someone’s attention in busy poster sessions?
I prioritize a coherent color pattern that draws attention to the poster without being too overpowering or using excessively bright colors. Design details, such as confident font choices and appropriate font sizes for paragraphs and titles, are also important. Additionally, I ensure there is enough space for well-designed figures, as these are often noticed first. A poster that is too textheavy can be overwhelming and may cause the audience to lose interest.
Are there any specific methods you used during the Flagship School that made your poster interesting?
I used figures created with BioRender.com, dedicating significant time to ensure they stood out as the main visual feature of the poster. Additionally, I selected a well-structured layout that divided the different sections—introduction, methods, results, and summary—into visually distinct areas, separated by colored boxes and clear headlines.
04
ADVICE
What is the one thing that people need to remember when presenting a scientific poster?
Remember that no one knows your project as well as you do! Make sure to avoid jumping straight into details and instead explain the people unfamiliar with your method, audience’s attention.
LinkedIn:
Image 1:Anna next to her winning poster
Image 2: Anna with the ISN President and the JNC EiC
THE CONFUSION AND DELUSION OF P-VALUES
Simon Gandevia FAA FAHMS FRACP DSc MD PhD is one of the founding Senior Scientists of Neuroscience Research Australia. In addition to his current research, which focuses primarily on the relationship between the human brain and movement, he has an active interest in scientific integrity and research quality.
Geoff Cumming FAPS BSc (Hons) DipEd DPhil is a leading researcher of statistical cognition, statistics education, and promotion of Open Science. His latest textbook, with Robert Calin-Jageman, is Introduction to The New Statistics: Estimation, Open Science, and Beyond, 2nd Ed. (Routledge 2024).
Much of biology and medicine has been ruled for decades by the outcomes of inferential statistics. This ongoing legacy derives from a clash of proposals (by Ronald Fisher) and counter-proposals (by Jerzy Neyman and Egon Pearson) about 100 years ago. When the dust settled from the acrimonious debate, we were left with what has become known as null-hypothesis significance testing (NHST), and estimation based on confidence intervals (CIs). NHST based on p-values has come to dominate, perhaps because declaring a result “significant, p<0.05”, seems to provide certainty. By contrast, CIs are often embarrassingly long, even if they accurately picture the extent of uncertainty. The illusion of p-value certainty seems to beat the practical utility of having a CI provide the best estimate of an effect, and of that estimate’s precision.
For many decades NHST has attracted stringent criticism—statistical, philosophical and pragmatic. We outline a few of the problems with NHST.
1. The p-value provides a probability of getting our observed result (or a more extreme one) from the data assuming the null is true (i.e. there is no true effect). This is hardly what we want! When there is no effect, it is not special to know that the data are rare. We want to know what our data can tell us in answer to our research question.
2. P-values are not reliable, in fact highly unreliable. A replication of an experiment can give a much smaller or a much larger p-value, simply because of the sampling variability of what you would see on repetition of the study. The p-value jumps around. For simulations, search YouTube for ‘dance of the p values’ or go to esci.thenewstatistics.com and select ‘dances’ . [4]
3. Of course, the 95% CI for the difference between the control and experimental groups also bounces around with replication, but the CI length indicates the amount of bouncing—a short CI, much less bouncing than for a long CI . By contrast, the p-value bounces wildly in virtually every situation— perhaps it’s akin to spinning a roulette wheel , or search YouTube for ‘significance roulette’. [4] [3]
4. A 95% CI provides the best information about an effect size, but caution is needed: a 95% CI is often, but erroneously, thought to cover the result of a replication 95% of the time. The correct position is that on average 83% of the means from a replication would fall within the original 95% confidence interval This is because there is sampling uncertainty in both the original CI and in the replication mean. [5]
5. A further way to appreciate p unreliability is to consider the prediction interval for the p-value given by a replication experiment. If an initial study obtains p=0.05, the 80% prediction interval for replication p ranges from 0.0002 to 0.65 . A staggeringly wide range! And there is still a 10% chance that p<0.0002, and a 10% chance that p>0.65. This interval is still vast when the initial p-value is low, say 0.001. Beware of p-values and be aware of their deficiencies. [3]
6. A further approach is to consider the relation between the p-value you first observe and the probability of obtaining a ‘significant’ p-value, say p<0.05, on replication. This relation is plotted in the Figure. The shape of the curve is largely independent of the statistic used . It is intuitively rational that the chance of obtaining a significant replication diminishes as the initial p-value increases, as the figure illustrates. However, even with initial p=0.001, there is still about a 1/6 risk of replication not obtaining significance, and initial p=0.20 comes with about a 1/3 risk of replication achieving significance. We suspect few researchers appreciate that finding p=0.05 comes with only a coin toss chance that a replication will be significant: hardly cause for celebration of a real discovery with initial p-value of 0.05! (It is reassuring that these properties of the p-value with replication have been found through different statistical approaches ).
[2] [6]
Figure legend:
The continuous line in the Figure shows the probability (see left axis for values) that a replication study will obtain p<0.05 for a given pvalue in the initial study, with extrapolation dotted. For example, if an initial experiment obtains p=0.05, there is only a 50% chance that an attempted exact replication will obtain a p<0.05. Even if the initial p=0.01, the chance is only 66% that an attempted replication will obtain p<0.05 (i.e. a one-third chance to obtain p>0.05). Grey bars represent the intervals that include the p-value given by a replication with an 80% chance (see right y-axis for values). The shaded area allows this prediction interval to be read off for initial p-values up to 0.1. Data are derived from the formula in Cumming (2008). For example, if an initial experiment generates p=0.05, the 80% prediction interval for replication experiments will range from p=0.0002 to 0.65 in idealized studies without imperfections. Realistically, this large range may even be an underestimate (Modified from Gandevia et al., 2021).
7. Another proposal is a more stringent criterion, say 0.005 instead of 0.05 After all, the value is arbitrary, ranging from 0.05 in much of medicine and clinical science* to much lower values for some genetic decisions (5x10 ) and discoveries in particle physics (~3x10 ). However, a lower criterion simply trades fewer false positives (or Type 1 errors) for possibly many more misses of true effects. The relative cost-benefit of the two types of errors should be a matter for informed judgment in context and not dependent just on convention within a discipline. [1] -8 -7
8. If using a p-value criterion, it is essential to state that criterion before conducting the experiment to prevent self-serving, confirmation and hindsight biases plus the propensity to talk up or “spin” results with a p-value that exceeds the criterion. We have not seen researchers spin a trend of insignificance for a result with a p-value just below the threshold! Regrettably, researchers often fail to observe the threshold which the journal publishing the work recommends (or even claims to mandate). Judging by what they write in the statistics paragraph in their publication, they also often ditch the threshold they had set for themselves before their study. (What else might they have ditched? In the gamut of dodgy research practices, this might be removal of different conditions, elimination of outliers, deletion of individual time points…).
9. Bayesian analysis offers two main alternatives to p-values. Bayesian hypothesis testing uses the Bayes factor as the basis for a decision between null and alternative hypotheses, but in practice relies on an arbitrary criterion. Much more informative is Bayesian estimation based on credible intervals—an attractive strategy advocated for example by Kruschke and Liddell[7]
In summary, we should be concerned about the deficiencies of the method (NHST) that dominates the bulk of published research. Those using this intrinsically noisy measure (p-value) which has limited predictive power run the risk of being deluded by their p-values. We suggest three strategies for avoiding delusion:
1. Don’t trust any p-value. It could easily have been very different and, on replication, is highly likely to be very different.
2. CIs give more and better information about the effect being investigated.
3. Seek replication, the heart of the scientific method and the key to confident conclusions.
Acknowledgements
Simon Gandevia’s work is supported by the National Health and Medical Research Council.
References
Benjamin DJ, Berger JO, Johannesson M, Nosek BA, Wagenmakers EJ, Berk R, Bollen KA, Brembs B, et al. (2018), Redefine statistical significance. Nat Hum Behav 2:6-10.
Boos DD, Stefanski LA (2011), P-value precision and reproducibility. Am Stat 65:213-221.
Cumming G (2008), Replication and p Intervals: p values predict the future only vaguely, but confidence intervals do much better. Perspect Psychol Sci 3:286-300.
Cumming G, Calin-Jageman R (2024) Introduction to the New Statistics: Estimation, Open Science, and Beyond. Routledge: Taylor and Francis.
Cumming G, Maillardet R (2006), Confidence intervals and replication: where will the next mean fall? Psychol Methods 11:217-227.
Gandevia S, Cumming G, Amrhein V, Butler A (2021), Replication: Do not trust your p-value, be it small or large. J Physiol 599:2989-2990.
Kruschke JK, Liddell TM (2018), The Bayesian new statistics: hypothesis testing, estimation, meta-analysis, and power analysis from a Bayesian perspective. Psychon Bull Rev 25:178-206. 1 2 3. 4 5 6. 7.
Written by Simon Gandevia and Geoff Cumming Neuroscience Research Australia and University of New South Wales, Sydney, Australia School of Psychology and Public Health, La Trobe University, Melbourne, Victoria, Australia Email for correspondence: s gandevia@neura edu au
* How did Ronald Fisher first propose the special value of 0.05? He wrote "The value for which P = 0.05, or 1 in 20, is 1.96 or nearly 2; it is convenient to take this point as a limit in judging whether a deviation is to be considered significant or not." Fisher, R (1925). Statistical Methods for Research Workers. Edinburgh: Oliver and Boyd. p. 46. So while Fisher recognized the utility of 0.05 and its value as a possible indicator of evidence against the null hypothesis, he later wrote “A phenomenon is experimentally demonstrable when we know how to conduct an experiment which will rarely fail to give us a statistically significant result (Fisher, R (1966). The design of experiments (8th ed.). Edinburgh, Oliver & Boyd. p. 14) – that is, the result, should be replicable. However, Cumming (2008) has pointed out only a study with an extraordinarily tiny p-value (p<<0.001) would “rarely fail” to give a significant result on replication. Perhaps Fisher was not aware how tiny this p-value needs to be!
There was a good balance between the scientific sessions/tutorials and free time/social activities.
The poster sessions were exceptionally well-organized and provided ample time for meaningful discussions.
I FELT THAT THERE WAS HELP AND SUPPORT IF I NEEDED IT.
As a basic scientist, one of my favorite parts of the school was having the clinicians speak in each session. it was insightful.
the level of the speakers was amazing and it was a true privilege being able to attend this event.
an enriching experience.
The networking opportunities were excellent.
th
the 5 flagship school attendees said:
ONE
THE MARKETING TEAM WAS EXCEPTIONALLY IMPRESSIVE.
the social gatherings added a vibrant energy to the event.
OF THE BEST SCIENTIFIC EVENTS I HAVE ATTENDED TO IN MY WHOLE SCIENTIFIC
CAREER.
the experience made me want to stay engaged with ISN.
Communication was excellent— clear and prompt responses ensured we were well-prepared for the School
science travel collaboration support innovation fun