The ecommerce marketing quarterly.


The ecommerce marketing quarterly.
After a turbulent period for online retail, we are seeing signs of growth. With inflation down and interest rates likely to follow, brands should be preparing for the recovery. Take a deep dive into the trends and opportunities for ecommerce brands in the April edition of the Readout.

Will Ashton CEO, Nest Commerce
We are now more than two years on since the beginning of the slowdown that hit global markets and spurred a dramatic change in many retailers' marketing strategies.
There are signs of us returning to growth. Consumer confidence is improving in the UK, and inflation is slowing down in most western markets. Despite this, advertiser confidence seems more varied.
Interest rates should go down on both sides of the pond in H2, just in time for elections in the UK and US. Advertising costs in the US are likely to increase dramatically during the election campaign, so if scaling the American market is part your strategy for this year, you should be making good headway already.
Many brands initially reacted to the slowdown by cutting brand investment. These brands will be paying dearly for this mistake now.
Advertising costs remain low on Meta and TikTok. This, combined with improving economic conditions, highlights the importance of investing in brand building now while there is a CPM discount.
Additionally, we are half-way to peak, where we expect a bigger increase in CPM than the last few years: this is your best time to invest.
Market feedback suggests Meta is struggling, but this is not reflected in the data of this report. Our thesis is that we are in fact seeing a divergence between brands with the right and wrong approaches to paid social, with performance-heavy brands suffering unsustainable acquisition costs.
There are significant opportunities out there already for more progressive retailers, who take a community-first, full-funnel approach.
Considering implementing full-funnel but not sure of how to approach it? We are hosting a webinar on 18th April, where we will share our strategy for implementing FFP.
2023 was a year of declining CPMs, and they remain low in Q1 2024. But will this trend of affordable Meta performance continue?
If the economy improves, CPM is only likely to increase again, much like it did following the pandemic when CPM increased by 30% YoY in 2021, and a further 32% YoY in 2022. The US election is also likely to inflate CPM. Looking back to the last election, US CPM increased dramatically by 38% QoQ in Q4 2020.
The risk of higher CPM around the corner underscores why retailers should leverage the current Meta discount to build their brands.
Conversion rates on Meta are up yet again, with a 33% boost YoY in Q1 2024. Meanwhile, average ROAS is up by 10% YoY.
Interestingly, we are hearing lots of noise in the market that Meta has been challenging this quarter, with advertisers seeing lower ROAS in the UK and US.
The expansion of FFP strategies across our portfolio, with a big increase in spend towards upper-funnel objectives, is likely driving our divergence from the wider market, as ad performance improves despite a challenging environment.
Reels ad spend is up 217% YoY as it becomes a mainstream channel, with 55% lower CPM than other Meta placements.
However, Reels operates very differently to other formats.
While CTR is 77% lower than other placements, CVR is on par or up to 87% higher when deployed correctly. This makes sense. Your audience aren’t clicking because they’re watching and consuming your content, considering your brand, learning about your brand, and then converting later.
+217% spend YoY for Reels

We don’t typically suggest splitting placements on Meta. However, according to the aggregated data from Nest tests, using targeted Reels delivers 186% higher CVR and 44% lower CPA versus Reels via allocation.
If you don’t isolate Reels, the algorithm will give budget to high-click placements. A separate Reels strategy is needed to prioritise this content, and having the right creative is key.
You can find out more in our on demand webinar: Reels unlocked.
CPM for broad audiences have increased 22% higher YoY, while interest and lookalike has decreased by 23% and 38% respectively, as advertisers increasingly adopt broad targeting through solutions like ASC.
Interestingly, broad audiences also have far higher CTR than other placements, with Meta’s algorithm matching users to the most relevant ads, such as catalog. However, advertisers should be careful given ASC often allocates a percentage of spend towards existing customers, skewing performance metrics and reducing incrementality.
A false profit? ASC is winning at the (very) BOF
The role and scope of ASC needs to be tested via multi-cell to understand incrementality versus standard prospecting.
ASC works best at driving volume, delivering quicker sales than other approaches at the very bottom of the funnel, and maximising opportunities within existing demand.
Still, it remains powerful when used alongside BAU.
According to the results of aggregated Nest tests, leveraging ASC alongside BAU led to a 53% uplift in purchases.
Investment in awareness and traffic activity has increased YoY by 356% and 30% respectively, as brands shift budgets towards driving long-term growth and incrementality.
Our suggestion for advertisers first leveraging brand is to start with 5-10% of total budget, and aim to hit more than 50% of your target audience twice a week. Your approach to upper-funnel should be broad but defined, based on your ideal customer profile. These objectives combined were 9% of our client's Meta spend in Q1.
While Meta performance on aggregate is higher YoY, the trend differs based on whether brands leverage upper-funnel or not.
Brands running awareness or traffic campaigns alongside performance campaigns saw a 31% YoY ROAS boost in Q1 2024, compared to a 32% YoY ROAS decline for brands which only leveraged performance.
The verdict is clear: full-funnel performance is a strategic necessity for winning on Meta in 2024.
While media buyers in the UK have enjoyed the combination of improved performance on Meta and lower CPMs due to reduced competition, the buoyant American market is driving up advertiser aggression.
That is to say, despite the overall economic picture in the UK being more challenging, the advertising conditions are favourable.
Advertising in the US is about to get more expensive, with the election around the corner, and both candidates likely to deploy sophisticated advertising campaigns. In the previous Biden/ Trump election, CPMs climbed in September, well before peak, and stayed high. Indeed, in Q4 2020, CPM were up 38% QoQ.
If cracking the American market is on your roadmap for this year, then you should be investing in brand building right now. If your campaigns aren't delivering in the UK, the US market may not be yours for the taking.
You should be investing in brand building right now ready for Q4 as you may get inefficient spend in the months building up to peak – US CPMs may well spike in H2 and not go back down.
UGC creative is up by 155% QoQ on Meta across our portfolio of clients.
With Meta shifting impressions to Reels, leveraging UGC is more important than ever. After all, Gen Z audiences respond well to nativelooking ads and community building UGC, and Meta is expected to grow share of impressions even more for its TikTok competitor.
UGC ads also perform well at the bottom-of-the-funnel, and the conversion rate is 36% higher for UGC ads vs the Meta average.
Running ads without an effective feedback loop is like flying blind. Your creative team will have no idea what is going on. Without getting feedback on what has or hasn’t worked from the performance team, creative teams will miss out on potential learnings of opportunities for effective experimentation.
There is no excuse for this considering the amount of data and insight that is available. However, there is also the risk of trying to learn too much, which may lead to a lack of focus on the hypotheses that will ultimately advanced your department's goals.
So, what does an effective feedback loop actually look like?
Regardless of how the business is structured, both your performance and creative teams need to be highly aligned on the key objectives of what your campaigns are trying to achieve.
Both teams should have visibility on the performance outcomes being delivered by their ads, which aspects of the creative are driving this, and how that is changing over time. These vital insights can be used to inform the way that future creatives are developed, laying the foundations for iterative improvement.

George Wiscombe, Creative Director, Nest Commerce
TikTok performed well in Q1, with a 37% higher CVR QoQ. It performs well for premium audiences as well as younger demographics, and is a particularly powerful platform for discovery.
Despite the power of Meta’s algorithm, TikTok compares well to Reels. Indeed, TikTok CVR was 41% higher than Reels in Q1 2024.
While there are some concerns of a ban in the US, our view is that the chance of a complete ban is low. These concerns themselves are a competitive advantage: if your competitors are investing elsewhere out of fear, it will only make the platform more cost-effective.
Pinterest is delivering well with our clients, with a dramatically higher CVR YoY. Meanwhile, CPA is down by 60% YoY.
Pinterest is an effective channel for the consideration and conversion stages of the funnel. Audiences come to the channel when they are considering purchasing a product, and leveraging keyword and interest targeting is important.
The platform can also be leveraged at the top of the funnel, with brand bursts ahead of new collection launches.
The days of the Meta having a monopoly on paid social activity are dwindling.
Increasingly, audiences are splitting their time and attention between multiple channels. A strong Q1 for TikTok and Pinterest is a good signal of this.
While each channel has its own barriers to entry, these are lower than they used to be, as platforms aim to simplify media buying and automate many processes.
One of the biggest challenges with channel diversification is the creative requirements. Each channel needs to be approached differently. That said, insights from Meta, where creative testing is possible, can feed into your creative strategy for other channels.
Having the right measurement solution in place before expanding is also crucial as without it you risk underestimating the impact of your investment. Fospha shows in its State of Ecommerce Q1 2024 report that GA only tracks 4.5% of incremental revenue from TikTok, while many platforms own attribution also miss many conversions.

Google’s Performance Max is driving better results compared against most metrics, with an 80% YoY increase in conversion rate and 20% increase in click-through rates.
ROAS increased as expected around peak, but has remained high since Q4 2024. Indeed, ROAS for PMax campaigns was almost double YoY in Q1. Brands should provide it with quality inputs for creative, audience, budget, structure and feed.
Our suggestion: use PMax as part of a wider channel mix, alongside YouTube ads for upper-funnel.
We’re at a fascinating point in the evolution of digital marketing, as the established duopoly of Meta and Google are becoming more similar to each other.
Historically, Google’s Search and Shopping products have been heavily focused on enabling advertisers to efficiently capture demand. However, Google is starting to take more cues from social platforms.
By bringing these lower-funnel formats together with video and image placements designed to drive awareness and consideration, Google have mimicked the full-funnel solutions in PMax which have been so important for competitors like Meta.
Furthermore, the implementation of Google’s Demand Gen product is a direct response to explosive growth in short-form video ads exemplified by TikTok and Meta’s Reels format.
Insights and data from social campaigns can prove a powerful starting point for advertisers looking to make the most of both PMax and Demand Gen.
As Google continues to evolve, having the right cross-channel strategy for paid search and paid social, underpinned by the right creative foundations, is going to become all the more important.

KEY TRENDS: GOOGLE
For our clients that implemented a full-funnel ads strategy across both Google and Meta, we saw a dramatic improvement in their Google efficiency.
With a greater proportion of their ad spend now targeting new and incremental audiences across both platforms, Google CPA was down by 38% YoY, while ROAS was up by 29% YoY.
There is the added bonus that creative alignment meant that Meta ad testing is able to inform the approach for Google creative.

Brands have been driving growth from brand marketing since before the internet. However, the advent of performance marketing allowed for highly targeted marketing campaigns, initially at a lower cost than traditional channels.
With more data at their fingertips than ever before, marketers became obsessed with counting things online. Why invest in long-term channels when you can grow your brand without them?
Since iOS 14, this is less possible. Meanwhile, performance channels are more expensive, less effective and much harder to measure, reducing the effectiveness of overt DR strategies.
Additionally, Gen Z consumers buy differently to previous generations: community is more important than ever, and this generation expects a more native form of advertising.
All of this together means that traditional performance marketing has a problem.
Recognising this, Nest went looking for answers. Through extensive experimentation, we've found the answer to optimal scale in this new internet paradigm.
While our full-funnel performance approach incorporates upper-funnel campaigns, it is still aimed at driving performance. In fact, our view is that even traditional brand channels like TV and OOH were driving performance to begin with.
What needs to change is the lens through which performance is viewed.
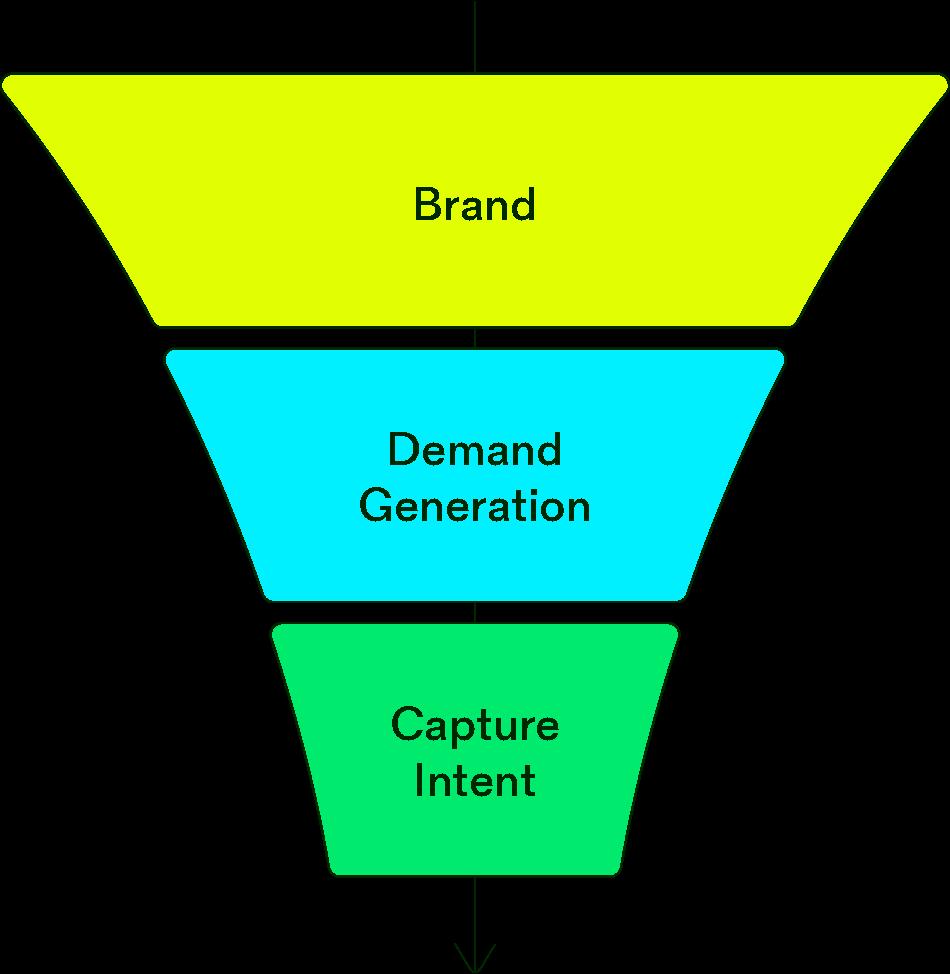
After countless tests, we have proven that you can drive greater efficiency and scale from online media spend by investing in brand alongside performance marketing. Your options for brand investment are vast and include everything from out-ofhome and TV to bricks and mortar and experiential marketing.
However, our strategy focuses around online brand awareness activity that can be brought across performance channels like Meta, TikTok and YouTube.
These channels are typically your cheapest option for brand, and increase the efficiency and scalability of digital performance campaigns, meaning your key revenue drivers work again.
The core benefits are:
Greater efficiency in performance campaigns (short)
Investing a percentage of your budget in brand awareness objectives on channels like Meta decreases CPA and improves ROAS, as it drives incremental reach (aka reaches new people at a low cost) whilst leveraging lower CPMs.
Brand building (medium/long)
In addition to improving your performance metrics, this investment improves brand recall and drives longer term growth.
Lack of incremental reach through direct response
Reach through conversions objectives is saturated and you’re reaching the sace people every month.
Sustained above target performance
Capitalise on profitability through reinvestment in increased brand awareness.
Increase penetration in foreign markets
You can stretch budget further through awareness activity to hit a higher percentage of the overall demographic in new markets (such as the US).
Low share of voice versus competitors
Become more top of mind in and increase ad real estate in your category versus similar brands.
Headroom to scale direct response
Budget may be better focused on testing within conversion objectives.
Periods of higher seasonal demand
Avoid launching brand awareness where budget should be focused towards driving revenue.
Creative is not fit-for-purpose
Your creative needs to be heavily branded and geared towards improving awareness.
Budget/performance limitations
Awareness activity requires sufficient budget to drive the desired impact.
Here are a few methods measure your launch of brand activity:
• A/B Test: provides less robust read on how brand impacts platform performance, as it doesn’t prove incrementality or brand lift. Measures correlation but not causation.
• BLS/Multi Cell CLS: get tangible results into uplift in awareness/ conversions. This is the most accurate measurement tool as it’s experiment driven. However, it is also requires minimum levels to sustain the test.
• Measurement tools: e.g. Fospha or Measured.com.
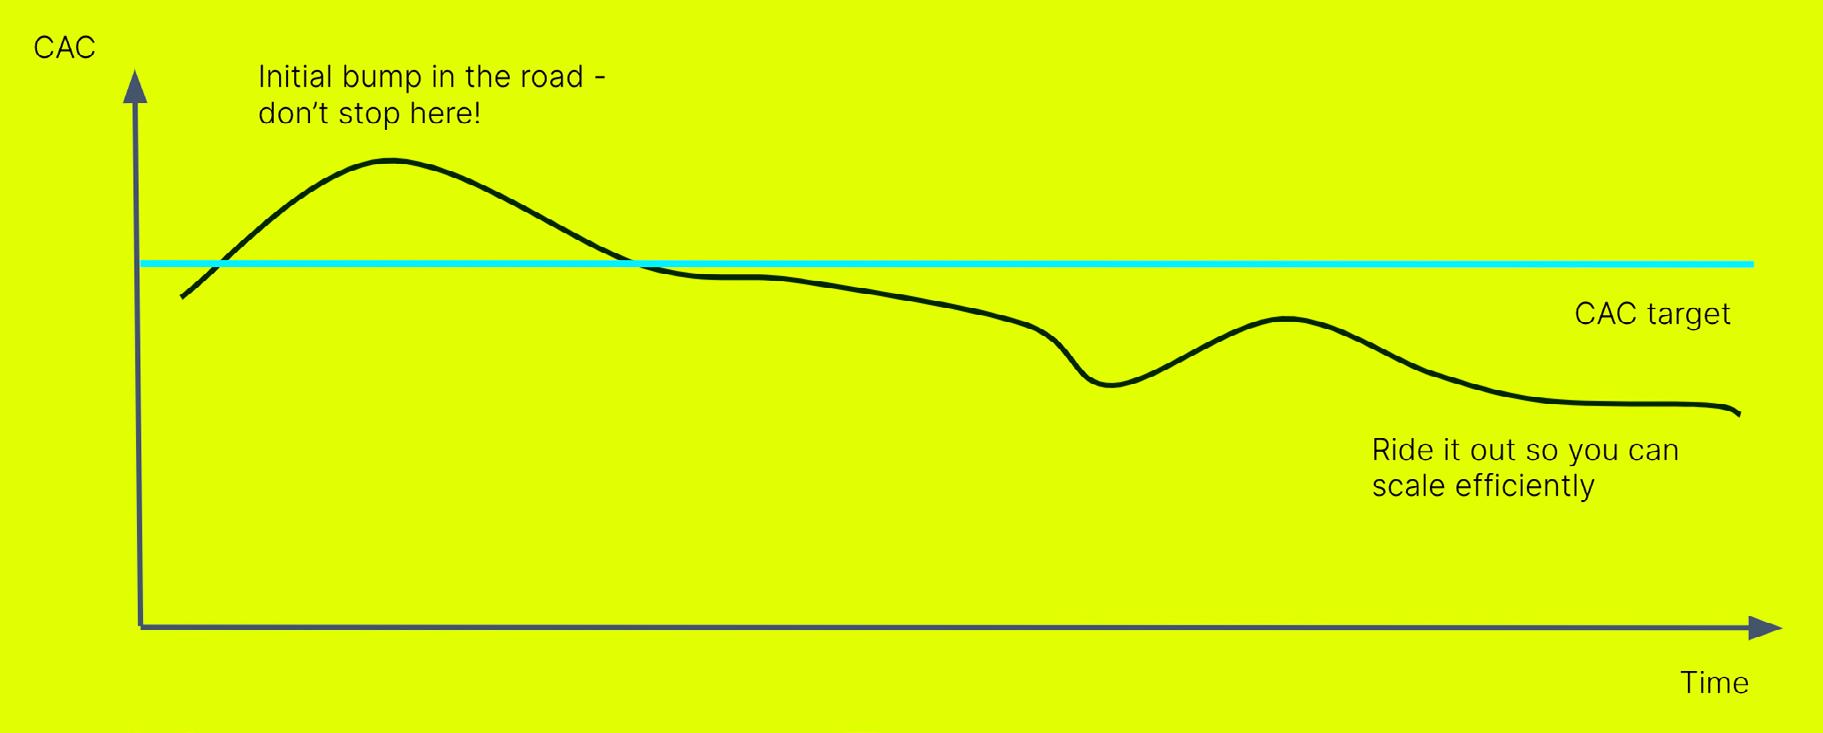
As you test FFP, it’s important to bear in mind that the impact of TOF in DR metrics isn’t instant. The good news is that, with the right setup in place, you can see the benefits in a few months.
So, it’s important that when you first launch, you don’t worry about initial performance dips and pull back. This is completely natural and expected, followed by gradual performance improvements that will allow you to hit your targets and scale long-term.
You can see this the BFCM 2023 results of brands that leveraged brand versus those that didn’t . The former saw a 35% ROAS uplift October and November versus 2% for the latter.
There may be an initial increase in CAC – don’t worry, once you ride it out, there will be a route for effective long-term growth.
Most business investment is under tighter scrutiny in 2024, and every penny of media spend needs to be accountable. This is putting some retailers off brand activity. But what does a successful campaign look like?
Conversion lift tests will tell you the difference between running ads and not running ads, proving that your ad spend matters.
We’ve aggregated the results of several brand lift tests for our FFP strategy, and here are the results.
According to these tests, running brand activity alongside performance led to a 104% ROAS increase.
One test showed a 47% increase in incremental reach for running brand activity alongside performance, as well as a 62% increase in sales and 64% increase in conversions.
Another test saw a 55% decrease in CPMs across the entire account following brand activity, and led to a 2x increase in overall users within the period of the test, meaning the retailer could retarget greater volumes.
How do you know if now is the time for brand?
CAC rising? Brand search dropping? A lack of investment in brand is likely the culprit.
Since iOS 14, investment in bottom-of-the-funnel alone isn't enough to drive growth. Brand campaigns allow you to hit more of your target audience via low CPMs, to build awareness and create new demand.
If your conversions objectives are saturated and ad frequency is too high, now is the time to find incremental audiences.
Click here to register for the webinar
For exclusive insights and full-funnel performance strategies:
18th April, 3PM GMT Recorded live from the Nest office
Full-funnel performance is what unlocks real, incremental growth for ecommerce brands.
Meanwhile, if you are able to drive sales, but your competitors are outcompeting you for share of voice – a lack of full-funnel approach is, again, the likely culprit.
Post-iOS 14, depending on bottom-of-funnel tactics for scaling no longer suffices. The lens needs to be wider.
In addition to reducing CAC in the short-term, investment in brand is important for your growth and sustained revenue.
Creating new demand is critical. The brands that recognise that this necessitates a shift in strategy will be the ones to cut through the noise and yield significant payoffs in the long run.
Join us for a Nest webinar on getting to full-funnel performance. Our ecommerce experts Luke Jonas, Rodrigo Aspillaga and Arnaud B. Betourne will share:
• Nest’s cutting-edge strategy for implementing full-funnel, including recommended account structure, rollout plan and the different methods available.
So, should online brands shift performance budgets to TV? That would be an expensive leap: TV requires a significant commitment to testing, and you need to invest a significant amount in ad production up front.
• The winning formula for a full-funnel creative strategy that is optimised at every touchpoint, and how to measure success at each stage.
Digital platforms like Meta, TikTok and YouTube are natural fits for digital brands, especially those starting off with upper-funnel.
• Insights into what the results can look like when you deploy a full-funnel strategy, leveraging data from across our portfolio of brands.
After CPM came crashing down in 2023, it has remained low in Q1 2024, with a 6% YoY decrease. Whether CPM remains low or starts to climb will likely depend on the wider performance of the economy.
There has been a moderate QoQ increase in CTR, while it remains 25% lower YoY. This is likely reflective of an increase in investment towards placements and objectives with lower engagement, like Reels and brand campaigns
Conversions have declined 25% QoQ, following the expected height of peak. Interestingly, CVR is 33% higher YoY, with the bulk of the increase coming from the UK and US markets.
CTR
Engagement has improved 27% YoY on Google, with Performance Max driving the increase in click-through rates. The biggest boost is in the UK market, which is enjoying a 50% YoY increase in CTR.
Similar to Meta, conversions are down QoQ since peak, while they have improved by 18% YoY. In particular, PMax is converting increasingly well, which is counterbalancing for a modest decrease in CVR from Search.
Traffic costs have reduced 24% QoQ following peak. Meanwhile, they have increased 12% YoY, reflecting an increase in the competition of Google’s auction. The UK bucks this trend, and is very good value.
The Nest Index is our online advertising index that draws on aggregated data from our portfolio of ecommerce clients. It’s used by our teams daily to benchmark your brand’s performance and uncover what’s working, what’s not, what you should do differently and where you need to be bolder.
40+ 70% 2b ecommerce brands prospecting campaigns impressions