
Ecommerce strategy and insights report. Navigating Meta and beyond. October 2023

Peak is make or break for many brands. The stakes are high this year, as rising inflation means retailers need to perform well to remain profitable. After months of testing, Q4 is here. Take a deep dive into the trends and opportunities for ecommerce brands in the October edition of the Readout.
Will Ashton CEO, Nest Commerce
Last year, many retailers and D2Cs scaled back ad spend as their budgets were slashed, only to pile back into the auction in Q4.
This year is more positive. There is a clearer rulebook of what works, and what doesn’t, and brands that have adapted should be well prepared for peak.
Retailers face mixed signals. Although the pace of inflation is starting to ease, profitability remains challenging, with higher operating costs becoming entrenched.
Contrary to last year’s ‘double recession’ for advertisers – where the economic downturn coincided with declining performance following Apple’s ATT update – ad performance has now decoupled from
the wider economy. Online advertising is delivering growth again, and is the route out for retailers struggling to make a profit.
Meta continues to deliver significantly improved results. The combination of sharply reduced advertising costs on the platform and improvements made by Meta to targeting and performance is driving significantly improved results on ad investment.
There remain drawbacks to Meta’s ASC solution. Measured recently reported that incremental ROAS was 65% lower for ASC versus Meta’s platform-reported ROAS. There is also a strategic risk in ceding too much power to Meta’s algorithm, and trusting that it will deliver results.
A reduction in data and fewer customers in market have forced marketers to become more sophisticated in their strategies. This has led to an embrace of upper-funnel objectives to drive performance.
We will set out how advertisers can take control in an evolving landscape in our 2024 planning section later in the report.
Brands that have the right Q4 strategy will be entering 2024 with far more headroom.
CPM continues its dramatic decline – and is now 37% lower YoY.
Key to this is Meta’s revamped advertising tech and algorithm, as well as an increased adoption of Broad audiences, relaxing demand and driving down CPM.
Although there has been a 10% decrease in click-through rates, the combination of lower CPM and a 22% increase in conversion rates is driving a 43% YoY cut in CPA. Brands should be exploiting this discount in customer acquisition costs.
-37% lower CPM YoY in Q3
AOV rose by 16% YoY in Q3, with purchases holding steady despite a challenging economic landscape.
In an environment where customers are significantly cheaper to acquire, and on average buy more, platform-reported ROAS in Q3 has more than doubled YoY.
While AOV will dip in November when brands discount, the overall year-on-year trend is promising, and is evidence that an feared race-to-the-bottom in prices has not materialised.
+16% higher average order value YoY in Q3
Reels has become even more cost-effective, and CPM is now 63% lower YoY. Meta continues to increase the impressions available for the format, while it remains undervalued by many advertisers. Meanwhile, ad spend on Reels has increased for the fifth consecutive quarter – and is up 27% QoQ and 124% YoY.
Getting Reels right is important as audiences spend more time watching short-form video and performance improves for the format.
Despite lower engagement for Reels, conversion rates are 39% higher for Reels ads when compared to Feed ads.
Meanwhile, average ROAS for the format has improved, and is up 126% from when strategies shifted to short-form video in Q4 2022. This is largely due to the sharp discount in CPM.
The full impact of Reels is difficult to measure using in-platform measurement and short-term metrics. We believe the format is likely driving far higher incremental sales.
+39% higher conversion rate for Reels ads vs Feed ads
Broad remains most efficient audience type, mostly due to higher click-through rates.
CTR for Broad audiences is 139% higher than Lookalike and 216% higher than Interest respectively. This is likely due to the larger audience resulting in higher engagement.
After a drop in investment, LAL audiences have bounced back with a 214% jump in spend YoY. Despite this, Broad still takes up the lion’s share of budgets.
+18% increase in spend for Lookalike audiences QoQ
Although Meta CPMs are falling across the board, the rate of decline differs notably by audience type.
Broad has seen the lowest YoY decline at 20%, compared to 37% for LAL and 62% for Interest respectively. This is potentially due to ASC shifting budgets towards Broad, making it the most expensive audience type.
Interest-based targeting has the lowest CPM, and is 43% lower than Lookalike and 47% lower than Broad.
-62% lower CPM for Interest audiences YoY
Investment in awareness ads is up 859% YoY as strategies shift to upper-funnel activities.
These campaigns can be leveraged alongside performance campaigns to feed retargeting and reduce CPA. However, they have merit in their own right, improving salience and brand resonance, which can be measured through brand lift tests.
In contrast, investment in standalone catalog activity has declined since the introduction of ASC, and spend is down 50% YoY.
+859% increase in spend for awareness ads
Awareness CPM is down 62% YoY and 35% QoQ, and remains far lower than other objectives. We suggest turning these ads on in the run up to BFCM when CPM is lower to generate demand.
Catalog activity remains the most efficient strategy in terms of in-platform ROAS, due to significantly higher engagement.
Despite a shift in tactics away from catalog activity, brands should leverage dynamic ads for broad audiences and dynamic product ads to maximise conversions when peak gets competitive.
+63% higher CTR YoY for catalog ads

Platform reporting doesn’t give the full picture of an ads impact. This has always been the case, but since Apple’s ATT update, the chasm between platform reporting and reality is wider than ever.
According to the results from tests Nest completed using measurement provider Fospha, TikTok ads delivered 18% higher ROAS than Meta ads that ran during the same time window.
This is largely attributable to higher CVR, proving that TikTok is a useful platform for driving both conversions and awareness.
+18% higher ROAS for TikTok ads vs Meta ads
Spend on PMax is up 240% YoY as strategies shift on Google. Brands should leverage the objective, and provide it with quality inputs (creative, audience, budget, structure and feed) – and then use tactical nuance to align it with other campaigns. This strategy minimises wasted spend on ineffective placements.
Insights and data from Meta campaigns are a powerful starting point for new demand generation campaigns, while leveraging Meta for creative testing will improve the results of your PMax campaigns.

YouTube is the best way to reach new audiences through Google. According to eMarketer, 45% of YouTube viewership happens on TV screens. However, instead of recutting TV ads, any creative you deploy here should be YouTube-first.
Many advertisers are underestimating YouTube Shorts. Google announced in February that Shorts generated 50 billion daily views, compared to 140 billion daily views on Reels.
Additionally, Google’s new Demand Gen campaign uses Shorts as one of its placements, which is good evidence that the platform plans to focus more on short-form video in the future.
Creative best practices on Shorts are similar to TikTok and Reels. This creates a lower barrier to entry for brands already delivering strong results from short-form video on these platforms.
For most of the past decade, online advertisers, often emerging and innovative start-ups, have found a home in platforms like Facebook and Google. These platforms provided them with the ability to seize a competitive edge from larger brands as they offered better performance and cheaper media costs than traditional media.
This reality has flipped in recent years. The initial period following Apple’s ATT update was very challenging for ecommerce marketers. In particular, 2022 was brutal. Tactics that used to work, no longer delivered results.
This year has been better. Whilst the wider economic landscape is challenging, the past year has seen a decoupling of ad marketers from business markets.
A combination of tech advancement and lower cost of media means 2023 was a far better year for advertisers than 2022. We expect this to accelerate as the economy improves.
Many ecommerce marketers are still focused on the perceived issue of ‘rising media costs’, and are stuck in panic mode.
This is because these brands haven’t adapted to the new reality of online marketing. This is leading to them being priced out of platforms like Meta and Google, with weak strategy slowly eroding their competitiveness.
There is a huge dichotomy in the market. Many business leaders think that marketing has become less effective. In reality, the problem is that their marketing team are following an outdated playbook.
In other words, these marketers are in stasis, and are reporting to the board that the economy is killing their marketing. This is no longer true.
Marketing is, in fact, how most brands can compete their way out of the difficult business environment.
New technology also offers a way to compete in the current landscape. The opportunity in AI is twofold. Platforms are diving headfirst into leveraging AI to improve targeting, and solutions like Meta’s ASC and DABA offer new ways for brands to reach their audience, with some downsides.
Meanwhile, AI offers brands the power to future-proof their business by developing bespoke tools to solve problems at scale. Instead of taking work processes that exist manually and automating them, retailers approach to AI should be focused on the wider problems that they face as a business.
In our 2024 planning section, we will share our three key recommendations on which evolving marketing strategies brands should adapt as we enter the new year.
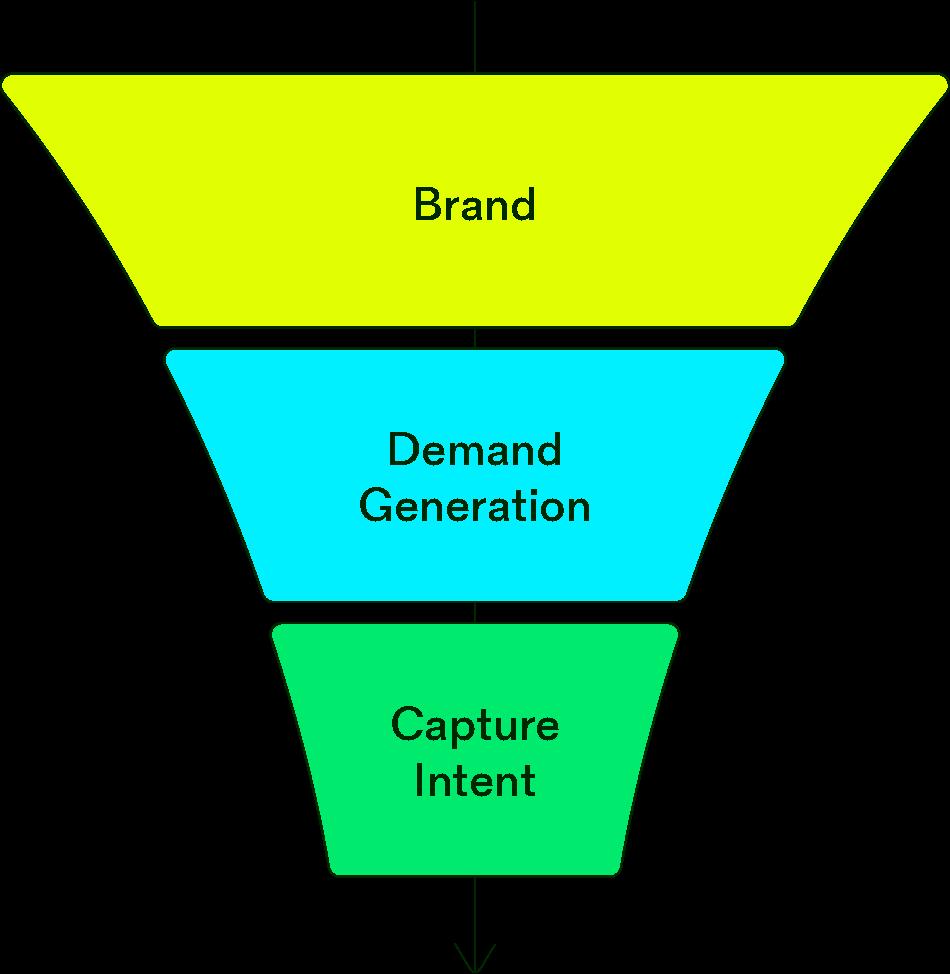
The most sophisticated marketing happens when you are fullfunnel online, with coordinated Meta and Google campaigns, alongside offline.
This strategy is harder to measure than traditional performance marketing but is proven to deliver higher scale and reduce CAC. According to Nest data, investment in just 10% of traffic activity drives 28% lower incremental CPA and 19% higher incremental ROAS, paying for the investment within weeks.
However, investment in upper-funnel activities delivers even greater results over the middle-term and long-term, improving salience and brand resonance. Customers may not always be ready to buy, but they're always ready to listen.
The world’s biggest advertisers know this. Yet, full-funnel performance works for advertisers at any stage of their growth.
Your brand doesn’t need to be spending £100k+ to leverage upper-funnel. Start-up D2Cs need to improve brand recall just as much as big retailers, especially with fewer customers in market.
Full-funnel is not just a differentiator, it is vital for your future growth

In a nascent market, great tactics can lead to initial wins. Focusing on conversion-led, bottom-of-funnel creative may drive an immediate ROI – but it’s not producing long-term value for your brand.
In a maturing market, strategy becomes the value driver.
Paid social creative needs to become sophisticated. Moving upstream, becoming joined up with the broader organisation’s goals (both commercial and brand), and embedded as a critical performance component, is key to this.
This shared vision should be the north star for your creative teams, resulting in a nuanced approach to creative.
Additionally, your creative strategy must be deeply relevant to the audience, sensitive to platform considerations, and have performance at its heart.
Drawing on aggregated data from our creative strategy clients, after just 3 months of implementing our methodology, average ROAS was 39% higher and CPA was 31% lower.
Feed-based prospecting, which powers DABA and ASC, is a powerful solution to some of the challenges with Meta’s platform – but it has drawbacks. For one, its algorithm is built to support 13M+ advertisers. It has to be blunt.
Leaning into Meta’s algorithm will drive sales. The problem is, the algorithm decides which sales. In particular, it likes to do two things: push products that are already selling well, and sell your cheapest products to increase conversions.
This improves performance metrics but is not necessarily the best return on investment. There are strategic challenges, also. What if you want to push a new product or grow basket sizes?
Instead of ceding power to platforms, and trusting that they will deliver results for you, there are measures brands can take to ensure the algorithm isn’t in control of what you are selling.
Progressive advertisers must adapt to algorithmic advertising and adopt new solutions that provide greater influence over brand and merchandising. It’s time for brands to reclaim their strategic advantage.

CPM
Average CPM has declined for the third consecutive quarter – and it is dramatically lower YoY in all markets. Advertisers are benefiting from reduced competition on Meta and increased inventory due to Reels.
CTR Engagement is down by 10% YoY and QoQ, as brands shift to video. However, a bigger decline in CPM than CTR means CPC is 31% cheaper YoY, proving video ads are still able to drive efficient traffic.
CVR
CVR is on the rise, up 22% YoY and 21% QoQ. Impressively, CVR last quarter 17% was higher than in Q4 of last year. We expect there will be a huge multiplier on ROAS this peak for brands with the right strategy.
The Nest Index is our online advertising index that draws on aggregated data from our portfolio of ecommerce clients. It’s used by our teams daily to benchmark your brand’s performance and uncover what’s working, what’s not, what you should do differently, and where you need to be bolder.
40+ 70% 1.5b ecommerce brands prospecting campaigns impressions
Our clients
Nest delivers performance, brand and creative campaigns for our portfolio of ecommerce clients across all major demand generation and demand capture channels. Most of our clients run campaigns in several markets.