1 minute read
SOCCSKSARGEN Regional Development Framework 21


4. Low competitiveness ranking of our LGUs;
5. Inadequate hospital bed;
Advertisement
6. Low health manpower to population ratio;
7. Decline in performance of transportation sector, particularly, road transport, airport, and seaportdueto decline in passengers brought by pandemic.
8. Delay in completion and start of several roads and bridge projects due to strict imposition of travel restrictions, stringent implementation and observance of safety guidelines and health protocols in the construction site, and adoption/implementation of the economy or cost-saving measures such as realignment of budget for the CoVID-19 pandemic;
9. High teenage pregnancy, infant and child mortality, and fecal coliform levels in our water bodies;and
10. Continued threat of CoVID-19 to the health and safety of the people.
Moving Forward
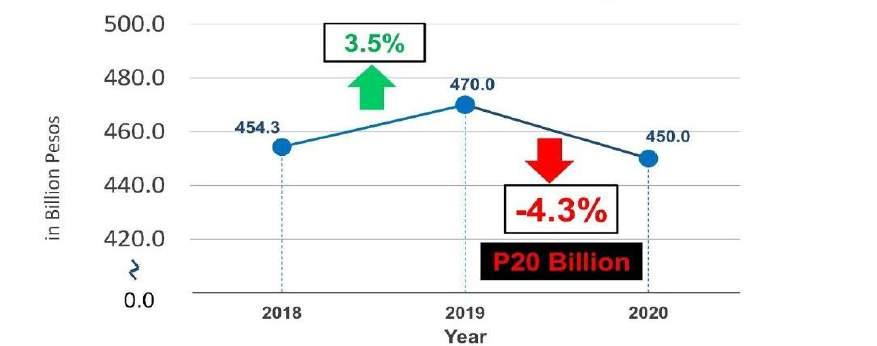
The region’s economic performance was greatly affected by the COVID-19 pandemic. The 13.2 to 13.7 variance in the GRDP’s growth rate against its targets can be accounted by the poor performance of the industry and services sectors as quarantine protocols implemented in the first and second quartersof 2020 resulted in difficulty in transporting goods and temporary closure of some establishments. The agriculture sector, however, remained resilient in 2020 with a 1.5 percent growth which means that the government's efforts in ensuring the availability and sustainability of food in the region were realized.
Given the low variance between the accomplishment and the target, the region is in a better position to economically perform better and bounceback from the adverse effect of the pandemic by 2022. Furthermore, our inflation rate is 3.1 percent, which is lower than the 5 percent target in the RDP. Given the foregoing analysis, the region should double its efforts to allow SOCCSKSARGEN’s economic performance to return to prepandemic levels. On the other hand, interventions to improve socio-economic performance are geared towards reducing poverty incidence by the end of the current plan in CY 2022.
Table A.1: Assessment and Variance on the Macro-Economic Indicators, CY 2020 Indicators End of Plan Target (2022) CY 2020 Accomp. Variance
Low High
Low High
Gross Regional Domestic Product 8.9 9.4 -4.3 13.2 13.7
AHFF 4.5 5.0 1.5 3.0 3.5