Annual Report

2020
20222020
2022
-
-
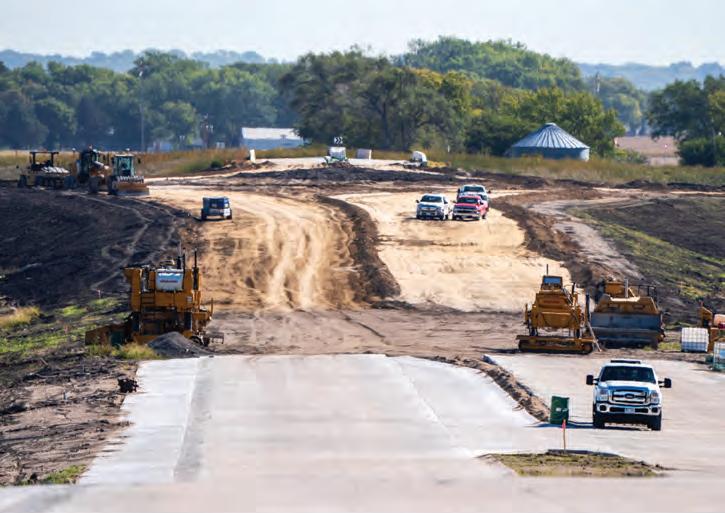
Lincoln South Beltway
FROM THE DIRECTOR
Due to the unique constraints of the worldwide COVID-19 pandemic, this issue of the Annual Report spans the years of 2020, 2021, and 2022. The performance measures shared in this issue provide a powerful snapshot of the work completed in regard to each of the Nebraska Department of Transportation’s eight strategic goals. It also conveys a sense of the high degree of excellence NDOT maintained throughout and beyond the shutdowns, mandates, and other ramifications of the pandemic.

NDOT teammates remain committed to delivering safe, high-quality transportation services. None of the work accomplished over the last three years would have been possible without them. NDOT believes investing in our teammates makes the organization more successful as a whole. We continue our efforts to build and develop our future workforce, and 2022 saw the biggest increase in tuition reimbursement in three years.
Over the last three years, NDOT implemented many changes to improve safety and reliability. New technologies such as bridge anti-icing systems and the implementation of a median cable guardrail are creating a positive impact and the state is seeing a consistent decline in serious injury crashes. The Nebraska Strategic Highway Safety Plan was updated in 2022; every aspect is anchored in Nebraska’s goal of moving toward zero deaths. All 2022 deadlines for new load ratings on bridges were met well ahead of schedule and all goals for the same year regarding the smoothness and quality of pavement were met. Despite the challenges of inflation costs, material supply shortages, and increases in regulatory requirements, NDOT implemented many changes to improve our level of service and project reliability from 2020 through 2022.
The landscape of the transportation industry is rapidly changing and expanding. The passage of the Infrastructure Investment and Jobs Act in 2021 resulted in unprecedented funding opportunities and thus, new challenges. NDOT will continue working to find innovative ways to utilize these funds efficiently and effectively in our project delivery. As we look for ways to enhance the connectivity of people and communities, we look to technologies like broadband and the impacts it will have on our industry. NDOT is focused on finding new, powerful ways to meet our goals of improving relationships with stakeholders and maximizing the value of transportation investments. This will ensure NDOT’s continued legacy of reliable service and responsible stewardship.
Vicki Kramer
SAFETY Improve Safety on Nebraska’s Transportation System
“Toward Zero Deaths” are three key words in the Nebraska Department of Transportation’s (NDOT’s) overall safety goal to reduce deaths and injuries on Nebraska roadways. Topping the list of performance measures, safety is integrated into every aspect of roadway construction and maintenance, as well as non‑infrastructure projects. NDOT continues to focus on identifying and prioritizing projects to address safety concerns such as roadway departures, intersection safety, occupant restraint, and distracted driving crashes. New technologies are being implemented like bridge anti icing systems, improved winter operations, and the “beveled edge” to aid in vehicle re‑entry onto the highway after a roadway departure. NDOT is also implementing effective countermeasures, like centerline and edge line rumble strips, and warning signs for statewide projects.
Fatalities on Nebraska Roadways
Description: Measurement of fatalities on Nebraska roadways: interstates, state highways, and local roads and streets.
Purpose: To heighten the awareness of safety and driving responsibility on Nebraska roadways. A consistent decline in fatalities reflects improved safety management practices, greater public awareness of safe driving practices, and will reduce statewide societal costs.

Goal: To reduce fatalities, their number, and the rate to a ratio of 0.9 fatalities per 100 million vehicle miles traveled by 2026.
Outcome: Nebraska’s rate of fatalities per hundred million miles traveled in 2021 was 1.03. There were 254 fatalities in 2022, an increase of 33 compared to 2021.
SAFETY | 1
Nebraska Year Fatalities 2013 211 2014 225 2015 246 2016 218 2017 228 2018 230 2019 248 2020 233 2021 221 2022 254 Nebraska Fatalities and National Data (Ratio Per 100 Million Vehicle Miles Traveled) 0.50% 0.75% 1.00% 1.25% 1.50% Nat'l. Nebr. 2021 2020 2019 2018 2017 2016 2015 2014 2013 2012 2011 Nebraska Fatalities 1.15 1.05 1.14 1.1 1.11 National Fatalities 1.19 1.17 1.11.1 1.15 1.08 1.09 .95 1.08 1.22 1.1 1.13 1.17 1.34 1.2 1.03 Goal: .90% in 2026
TIM Exercise at Lincoln South Beltway
Serious Injury Crashes on Nebraska Roadways
Description: Measurement of serious injury crashes on Nebraska roadways; interstates, state highways, and local roads and streets.
Purpose: To heighten the awareness of safety and driving responsibility on Nebraska roadways. Improved safety management practices and greater public awareness of safe driving practices contributed to a consistent decline in serious injury crashes. Continuation of these practices will reduce statewide societal costs.
Goal: To reduce serious injury crashes in Nebraska to a ratio of 5.0 per 100 million vehicle miles traveled by 2026.
Outcome: Nebraska’s serious injury crash rate in 2019 and 2020 was 5.43.
Median Cable Barrier
Increased traffic volumes across the I-80 corridor led to an early deployment installation of a median cable barrier to improve safety. The first interstate median cable barrier in Nebraska is being installed in the median of Interstate 80 from the Utica interchange to the Pleasant Dale interchange and will run in the center of the median.
The median cable barrier consists of steel cables mounted on posts. It is designed to prevent vehicles from crossing the median into opposing lanes, in turn, reducing fatalities and severe injuries from cross-median crashes. The median cable barrier is common on interstates, freeways and highways across the country. States that have implemented median cable barriers have seen reductions in crossmedian fatality crashes.

Nebraska's wide medians support more flexibility than systems with narrower medians. The benefits of installing the barrier in the center of the median include:
Reduced chance of the guardrail being struck by minor incidents
Less risk of the vehicle being redirected back into the travel lane when vehicles strike the guardrail
More cost effective to implement
Reduced maintenance costs
Serious Injury Crashes on Nebraska Roadways (Ratio Per 100 Million Vehicle Miles Traveled) 1,000 1,250 1,500 1,750 2,000 2020 2019 2018 2017 2016 2015 2014 2013 2012 2011 0.0 2.5 5.0 7.5 10.0 1,315 1,447 6.35 7.57 Serious Injury Crashes Serious Injury Crash Rate 1,249 6.17 5.84 5.37 5.43 5.43 7.06 6.42 6.59 1,228 1,128 1,154 1,052 1,357 1,241 1,293 Goal: 5.0 Annual Vehicle Miles Traveled Year (AVMT) 2012 19,224,041,000 2013 19,323,263,000 2014 19,612,000,000 2015 20,230,000,000 2016 20,709,000,000 2017 21,011,000,000 2018 20,995,826,000 2019 21,261,959,000 2020 19,379,946,000 2021 21,533,243,000
Image courtesy of Valtir
2 | SAFETY
Motor Vehicle Crashes on Nebraska Roadways
Description: Measurement of motor vehicle crashes on Nebraska roadways, interstates, state highways, and local roads and streets.
Purpose: To heighten the awareness of safety and driving responsibility on Nebraska roadways. A consistent decline in crashes reflects improved safety management practices, greater public awareness of safe driving practices, and will reduce statewide societal costs.
Goal: To reduce motor vehicle crashes in Nebraska to a ratio of 1.5 per million vehicle miles traveled by 2026.
Outcome: Nebraska’s crash rate has been below the national rate since 2004. Beginning in 2013, the number of crashes has increased steadily, but the ratio of crashes to one million vehicle miles traveled remained under 1.75. Both national and Nebraska crash rates dropped significantly in 2020 due to temporary changes in travel patterns.
Improving Safety on Nebraska Roads
The Nebraska Strategic Highway Safety Plan (SHSP) is a guidance document for improving safety on Nebraska roads. The Nebraska SHSP is updated every five years in coordination with our safety partners at other agencies, such as Nebraska State Patrol, Nebraska DMV, Nebraska DHHS, Nebraska Highway Safety Office, Nebraska Local Technical Assistance Program, Federal Highway Administration, National Highway Traffic Safety Administration, Federal Motor Carrier Safety Administration, Nebraska Association of County Officials, and Nebraska League of Municipalities. The SHSP includes goals, statistics, and strategies focused on specific roadway safety Critical Emphasis Areas (CEAs).
During the SHSP update in 2022, NDOT conducted a survey of safety stakeholders statewide to obtain their input regarding the effectiveness of current strategies intended to address these emphasis areas. Recently, bicyclist and pedestrian fatalities and serious injuries are increasing nationally. Though Nebraska has not experienced this same trend, the Interagency Safety Committee proactively
Toward Zero Deaths
identified the need to directly support improving safety for bicyclists and pedestrians. The Nebraska SHSP update added a new Critical Emphasis Area for crashes involving non-motorists. The seven Critical Emphasis Areas in the updated SHSP are:
Increasing Seat Belt Usage
Reducing Roadway/Lane Departure Crashes
Reducing Impaired Driving Crashes
Reducing Intersection Crashes
Reducing Young Driver Crashes
Reducing Older Driver Crashes
Reducing Non-Motorist Crashes
In recent years, NDOT improved safety by implementing more roadway features. As referenced on the previous page, median cable barriers and adding more roundabouts and RCUTS to roadways decrease potential collision points for drivers are a few highlighted features. Additionally, NDOT continues to deploy a social media strategy to increase education about safe driving habits and tips for drivers to use to improve their daily driving habits.
SAFETY | 3
Nebraska Crashes and National Data (Ratio Per Million Vehicle Miles Traveled) 1.0% 1.5% 2.0% 2.5% Nat'l. Nebraska 2020 2019 2018 2017 2016 2015 2014 2013 2012 2011 2.03 1.81 1.69 1.69 Nebraska Crashes National Crashes 2 1.68 2.01 1.72 1.73 1.51 1.81 1.89 1.9 1.58 1.65 1.62 1.67 2.15 2.08 2.07 Nebraska Year Crashes 2011 32,302 2012 30,443 2013 31,377 2014 32,318 2015 33,988 2016 34,890 2017 34,999 2018 36,117 2019 36,706 2020 29,418
FISCAL RESPONSIBILITY
Use Financial Resources Wisely and Make Financial Decisions in an Open and Transparent Way
Fiscal Responsibility is defined as (1) living within our means; (2) using financial resources wisely, and (3) making financial decisions in an open and transparent way. The goal is to optimize the use of available funds to build and maintain the state’s transportation system. These measures have been established to reflect the progress toward meeting this goal.
Overhead as a Percentage of Annual Expenditures
Description: Measurement of NDOT’s costs for construction, maintenance, and overhead.
Purpose: To maximize funding for transportation purposes by minimizing overhead costs.
Goal: To have overhead costs less than 10% of annual expenditures.
Outcome: NDOT maintained overhead at less than 10% of annual expenditures over the ten‑year period. The overhead for 2022 was 5%.
4 | FISCAL RESPONSIBILITY Construction 587 77% 565 75% 584 73% 682 75% 633 76% 641 76% 595 73% 778 79% 754 77% 799 80% Maintenance 134 18% 149 20% 169 21% 178 20% 151 18% 156 19% 174 21% 160 16% 166 17% 152 15% Subtotal $720 95% $714 94% $753 94% $860 95% $784 95% $797 94% $769 94% $938 95% $920 95% $951 95% Overhead 41 5% 43 6% 47 6% 49 5% 45 5% 47 6% 51 6% 53 5% 54 6% 53 5% Total Costs $762 $757 $800 $909 $829 $844 $820 $991 $974 $1,004 $0 $100 $200 $300 $400 $500 $600 $700 $800 $900 Overhead Maintenance Construction FY-2022 FY-2021 FY-2020 FY-2019 FY-2018 FY-2017 FY-2016 FY-2015 FY-2014 FY-2013 Transportation and Administrative Expenditures (Dollar amounts represented in millions) 45 151 633 565 43 149 584 178 682 47 169 49 51 174 595 641 47 156 41 134 587 754 53 160 778 53 152 799 54 166 Overhead Maintenance Construction
Accuracy of Project Estimates Contained in the 1-Year Program
Description: Measure the difference between projected construction project estimates and actual awarded contract amounts.
Purpose: Accurately projecting annual construction expenses helps NDOT forecast when future construction projects can be built. NDOT values the important role that reliable project estimating plays in supporting local communities by keeping the highway system in a state of good repair.
Goal: To be within 5% of the total estimated cost of the published program as reported in the 1-Year Program.
Outcome: The goal was last met in 2019.
Accuracy of Project Estimates Contained in the One Year Program
NDOT revises the estimated cost to prepare and construct a transportation project at various points during its development. In general, the development time of a project from inception to letting is three to five years, with more complex projects taking a decade or more. Each year, NDOT publishes the list of projects anticipated to be contracted for letting within the next fiscal year based on projected revenues and total project costs.
One of the performance measures that NDOT tracks is the comparison of the project estimate used to establish the One-Year Program against the total project costs after the project is contracted. The goal is to be within 5% of the amount published in the One-Year Program. Referencing the table above, in fiscal year 2022 there were 103 projects estimated for
a total of $549,643,000 compared to the total project cost of $642,764,000 after those projects were contracted, a difference of $93,121,000 or 16.9% above the One-Year Program estimate. In 2020, the difference was 13% and in 2021, the difference was 5.6%.
Prior to 2019, NDOT was consistently within the target range. The increase in the last three periods is a testament to the significant increases in construction prices experienced in lettings. In state fiscal year 2021, NDOT experienced a 14.8% increase and in state fiscal year 2022, it experienced a 20.4% increase in construction prices. Factors that directly impacted the increased construction costs were supply chain issues and material shortages combined with higher inflation and gas prices than previous years.
FISCAL RESPONSIBILITY | 5 Actual and Estimated 1-Year Program Project Cost Projects 1-Year Fiscal Over/Under Fiscal in 1-Year Program Year-End Total Program Over/ Year Program Estimate Project Cost Estimate Under 2010 160 $387,770,000 $389,302,000 $1,532,000 0% 2011 144 $407,556,000 $400,925,000 ($6,631,000) -2% 2012 142 $333,466,000 $342,528,000 $9,062,000 3% 2013 135 $380,732,000 $376,220,000 ($4,512,000) -1% 2014 152 $466,460,000 $446,529,000 ($19,931,000) -4% 2015 153 $447,786,000 $501,012,000 $53,226,000 12% 2016 110 $453,412,000 $467,351,000 $13,939,000 3% 2017 95 $506,168,000 $498,937,000 ($7,231,000) -1% 2018 100 $483,240,000 $482,144,000 ($1,096,000) -.2% 2019 110 $512,666,000 $519,813,000 $7,147,000 1% 2020* 93 $793,503,000 $896,697,000 $103,194,000 13% 2021 90 $702,656,000 $741,966,000 $39,310,000 5.6% 2022 103 $549,643,000 $642,764,000 $93,121,000 16.9%
*FY 2020 construction program list was adjusted throughout the year to accommodate expenses for the repairs after the Historic 2019 Floods. The Program Delivery data does not include contracted flood repair projects or expenses.
Construction Competitiveness
Description: Measurement of the number of projects let in a calendar year and the average number of bids that NDOT receives on those projects.
Purpose: Measure the number of projects let to construction in a calendar year and measure the average competition among the industry players for that calendar year’s projects.
Goal: Maintain a minimum average of three bidders over a calendar year.
Outcome: The minimum average of three bidders over a calendar year was last met in 2018.
of Projects Let Per Year and Average
The significant cost and contractor effort expended in response to the 2019 Governor-declared flood disasters resulted in a lower number of programmed contracts awarded in 2019, as well as a lower number of available bidders for those contracts. In addition to the 100 projects let to bid, there were 49 force account agreements for flood repair that were executed by the Districts and Central Complex staff.
Construction Competitiveness
NDOT tracks the number of bidders on projects due to the known linkage between the number of bids received and the competitiveness of the bids. The goal for number of bids received per project was set at 3.5 bidders because the study showed that receiving an average of at least 3.5 bids per project provided optimal competitiveness. NDOT worked with the construction industry to identify processes that hinder competition and determine how it could positively influence letting practices to encourage additional bidders. Despite implementing multiple changes, NDOT continues to see a drop in the number of bidders per project. NDOT evaluates the bidding information in various ways. One factor in the analysis is the character of work that NDOT lets has changed over the years. This resulted in the size of the calendar year totals for lettings increasing from an average of $425 million from 2016 to 2018 to an average of $677 million from 2019 to 2022.
In addition, the average size of a project jumped from $2.7 million in 2016 through 2018 to $6.1 million in 2019 through 2022. The major change occurred between 2019 and 2020, when the size of the annual program rose from $436 million to $733 million. These changes occurred without a corresponding and equal increase in the industry’s capabilities to build the additional work.
Since most of the adjacent states are experiencing the same increase in work, NDOT does not expect more contractors will be crossing the border to help build the additional work being let by NDOT. Specific aspects of the industry have begun to build capacity, however, this is not an overall adjustment. Consequently, it is unknown whether the industry will increase bidding activity. If the bidding activity does not increase, there is potential for overall higher prices and continued price inflation as noted in the article titled Accuracy of Project Estimates in the One-Year Program. NDOT continues to evaluate ways to increase bidding activity.
6 | FISCAL RESPONSIBILITY
2022 2021 2020 2019 2018 2017 2016 2015 2014 102 3 127 199
2.9 3.1 Bids Per Project Projects Let 152 3.8 251 156 3.5 155 3 127 94 2.7 2.8 2.6 2.7
Number
Number of Bids Per Project
ENVIRONMENTAL STEWARDSHIP
Integrate Environmental Considerations into Planning/Design, Construction, and Operational Activities of Nebraska’s Transportation System
Environmental Stewardship is the integration of environmental considerations into the planning, design, construction, and operational activities associated with the Nebraska transportation system. These environmental considerations include cultural, natural, and human elements.
NDOT is committed to its role as an environmental steward and to preserving and protecting the environmental features and resources of the state. This goal emphasizes that transportation decisions and investments must be balanced with environmental considerations. The performance measures linked to this strategic goal illustrate our promise to carry environmental commitments forward into construction, take swift corrective action to benefit the environment, when necessary, and to encourage an environmentally sustainable transportation system.
Environmental Commitments in Compliance
Description: A key component of NDOT’s environmental stewardship goal is to ensure that environmental commitments for construction projects, documented through the National Environmental Policy Act (NEPA) and permitting processes are being managed. This entails periodic site inspections to ensure that these commitments are being upheld during construction.
Purpose: To ensure NDOT is following through with promises made to the public and to environmental agencies, it tracks compliance with commitments and information necessary to deliver appropriate environmental training to staff and contractors.
Goal: 100% of the environmental commitments are in compliance.
Outcome: NDOT effectively met its compliance goal for the last three years.
The National Environmental Policy Act (NEPA) is a Federal procedural law that establishes the national framework for environmental planning and decisionmaking on projects that receive Federal funds or require Federal approvals. In September of 2018, NDOT assumed environmental authority and review responsibility required by NEPA for many federally funded transportation projects statewide. NDOT is currently in its fourth year of NEPA assignment and has approved over
700 projects using its authority under the initial and now, first renewed Memorandum of Understanding (MOU), with FHWA. The MOU also establishes procedures for FHWA to conduct formal monitoring of NDOT’s undertakings under the MOU. Since 2018, FHWA has conducted formal monitoring of NDOT twice, and a third event is anticipated in late 2023. NDOT has been found to be in compliance with the terms and provisions of the MOU in both events.
ENVIRONMENTAL STEWARDSHIP | 7
COMPLIANCE 2020 2021 2022 99.9% 99.8% 99.9%
Problem-Solving Swiftly
Description: This important component of NDOT’s environmental stewardship goal is to ensure that corrective actions related to environmental commitments for construction projects are resolved within a seven-day window. Speed of resolution is key to maintaining compliance.

Purpose: To ensure NDOT is performing timely corrective actions and tracking the compliance information necessary to deliver appropriate environmental training for staff and contractors.
Goal: 100% of corrective actions completed within seven days.
Outcome: In 2022, 90.5% of corrective actions were completed in seven days, down from 96.1% in 2021 and 94.2% in 2020.
Paving It Forward
Description: Measurement of material removed during highway construction or maintenance work that is recycled into new projects.
Purpose: To ensure NDOT is striving to maximize the use of removed or salvaged material. This minimizes the use of virgin materials and keeps reclaimed material out of landfills.
Goal: A minimum of 33% overall replacement content.
Outcome: NDOT continues to meet the recycling goal. Post-consumer recycle content for fiscal year 2021 was 35%.

Post-Consumer Recycle Content
Post-Consumer Recycle Content
8 | ENVIRONMENTAL STEWARDSHIP
0% 10% 20% 30% 40% 50% FY-21 FY-20 FY-19 FY-18 FY-17 FY-16 FY-15 FY-14 FY-13 Goal: 33% 39% 34% 36% 35% 36% 34% 35% 34% 34%
CORRECTIVE ACTIONS COMPLETED IN 30 DAYS 2020 2021 2022 99.6% 100% 99.9% CORRECTIVE ACTIONS COMPLETED IN 7 DAYS 2020 2021 2022 94.2% 96.1% 90.5%
Overall Replacement Content Raw Recycle Content Fiscal Materials Raw Materials Est. Value Year (tons) (tons) Recycled 2013 3,714,339 1,250,167 $53,215,809 2014 3,796,902 1,350,476 $59,292,024 2015 3,215,669 1,246,427 $45,750,906 2016 3,717,875 1,250,980 $47,568,953 2017 4,346,961 1,534,604 $60,233,179 2018 2,993,035 1,088,647 $49,670,595 2019 3,243,560 1,104,208 $61,257,110 2020 3,506,284 1,175,577 $61,617,867 2021 3,530,896 1,230,025 $77,148,114
Section 106 of the National Historic Preservation Act
NDOT has a long-standing, multi-agency partnership which guides its review and consideration of historic properties, including buildings, structures, sites, objects and districts, under Section 106 of the National Historic Preservation Act. NDOT, along with Federal Highway Administration (FHWA), the State Historic Preservation Office (SHPO), and the Advisory Council on Historic Preservation (ACHP), entered into a programmatic agreement (Section 106 PA) in 2015, to formally document its environmental review processes and decision-making ability. In practice, this allows NDOT environmental professionals to make certain effects determinations without having to pass it along to FHWA or SHPO resulting in decisions made on most of NDOT’s Categorical Exclusion program happening in-house. This agreement has provided significant time savings, and effective and efficient decision-making.

In June 2020, NDOT began efforts with the signatory parties to negotiate a renewal for the Section 106 PA. While periodic renewal efforts are part of the Section 106 PA, the Infrastructure and Investment and Jobs Act (IIJA) and other changes in the regulatory framework made updates to language of the agreement necessary. Due to NEPA assignment, the Section 106 PA was modified to significantly enhance its tribal coordination and engagement during the project development process. Previously, NDOT established relationships and coordinated
frequently with the four resident Indian Tribes in Nebraska (Winnebago Tribe of Nebraska, Omaha Tribe of Nebraska, Ponca Tribe of Nebraska, and Santee Sioux Nation) who primarily have interest in northern and eastern Nebraska, as well as nonresidential tribes such as the Pawnee Nation of Oklahoma, the Iowa Tribe of Kansas and Nebraska, and the Otoe-Missouria Tribe. Under the new Section 106 PA, NDOT will now regularly engage at least ten more non-resident Indian Tribes who have interests that stretch across the entire state of Nebraska.
With the execution of the new Section 106 PA, NDOT will begin implementation in 2023 by developing new relationships with more Indian Tribes and, through thoughtful design and consultation, will continue to work to avoid adversely affecting properties, such as archeological sites, that are eligible for or are listed in the National Register of Historic Places. Also, new processes and procedures will be developed as well as coordination tools to assist in the complex outreach and documentation that is critical to ensuring meaningful and successful engagement for NDOT’s transportation program and individual projects. This effort is expected to be carried out by the existing two NDOT cultural resource professionals in the Environmental Section, both of whom are uniquely qualified under the United States Secretary of Interior’s Professional Qualification Standards.
ENVIRONMENTAL STEWARDSHIP | 9
Historic Lincoln Highway
This section of historic Lincoln Highway is located in Douglas County, and in cooperation with FHWA and NDOT, Douglas County has recently completed construction of two new bridge structures which span the historic brick highway. The design of the bridge structures complement the historic highway and were designed so as to not adversely affect the historic property.
Photo courtesy of Historic Resources Group
PROJECT DELIVERY
Use Known State and Industry Best Practices, New Technologies and Creativity to Continually Improve and Deliver Well-Designed, High-Quality Projects, Products, and Services
The department’s goal is to continuously improve project delivery. Project delivery refers to the steps taken to progressively develop plans that define how each highway project will be built. Project delivery teams are responsible for developing these plans and must predict, minimize or prevent negative impacts to the environment, project costs, and construction schedules for stakeholders.
Project Reliability
Description: Measurement of NDOT’s reliability in delivering construction projects in the one-year construction program to letting on time.
Purpose: This measurement reflects how accurately NDOT predicted in advance, which letting each project would be advertised in during the upcoming year.
Goal: To deliver 85% of projects on time.
Outcome: This measurement began in 2017, when 52% of projects were on time. NDOT has implemented many changes to improve reliability meeting the goal each year from 2020 through 2022.
The department strives to:
n Continuously enhance our expertise in laws and regulations that affect highway projects
n Lead efforts to streamline complex processes
n Implement creative, efficient and flexible solutions to expedite project delivery and construction
Current project delivery trends are influenced by increases in regulatory requirements, regulatory agency staffing constraints, and high NDOT employee turnover rates which reduces employee experience levels. Construction inflation costs and material supply shortages have also begun to significantly
influence project reliability performance in Nebraska. Efforts to negotiate more modernized coordination with regulatory agencies, increase NDOT employee retention, and increase technical training and discussions to increase contract flexibility are beginning to show improvements.
10 | PROJECT DELIVERY
2022 2021 2020 2019 2018 2017 Goal: 85% Delivered On-time 78% 52% 79% Project Delivery Reliability 90% 96% 89%
Project reliability is influenced by many internal and external factors
1-Year Program Projects Delivered to Letting
Description: Measurement of the ability to let projects which are identified in NDOT’s one-year schedule of highway improvement projects (1-Year Program).
Purpose: This measurement monitors the delivery of projects to the public. NDOT’s performance reflects how well promises are kept to the public.
Goal: To deliver 100% of projects.
Outcome: 92% of projects identified in NDOT’s one-year schedule of highway improvement projects were delivered to letting in 2022, compared to 100% in 2021.
5-Year Program Projects Delivered to Letting
Description: Measurement for success in delivering projects displayed in the 5-Year Planning Program in 2017 and included a five-year projection for 2018-2022.
Purpose: This measurement monitors the delivery of projects to the public. In 2022, NDOT assessed how many projects in the 5-Year Planning Program in 2017 were actually let between 2015 and 2019.
Goal: To deliver 80% of projects in the 5-Year Program on time.
Outcome: 75% of projects identified in the five-year schedule of highway projects in 2017 were delivered to letting by 2022, compared to 62% in 2021.
1 Projects from the Nebraska Surface Transportation Program not included are those counted in the previous fiscal year, projects withdrawn, and projects built by entities other than the State of Nebraska.
PROJECT DELIVERY | 11
Fiscal 1-Year Projects Year Projects1 Delivered 2013 135 111 2014 152 139 2015 153 139 2016 110 96 2017 95 90 2018 100 98 2019 110 101 2020 93 92 2021 90 90 2022 103 93
Delivered in the 1-Year Program 2022 2021 2020 2019 2018 2017 2016 2015 2014 2013 87% 91% 100% Goal: 100% 95% 98% 92% 99% 92% 82% 91.5%
Percent of Projects
2022 2021 2020 2019 2018 2017 2016 2015 2014 2013 62% 85% 74% Percent of Projects Delivered in the 5-Year Program Goal: 80% 76% 74% 68% 56% 75% 74% 75% Program 5-Year Projects Period Projects Delivered 2009-2013 270 200 2010-2014 376 283 2011-2015 428 316 2012-2016 410 349 2013-2017 395 300 2014-2018 428 318 2015-2019 450 307 2016-2020 489 263 2017-2021 439 270 2018-2022 360 270
Construction Projects Completed Within the Adjusted Days Allowed
Description: Measurement of estimated time to complete a project.
Purpose: This is a measure of NDOT’s ability to accurately estimate the amount of time necessary to complete a construction project (contract time allowance).
Goal: 80% of calendar year projects completed within the current contract time allowance.
Outcome: Over the past three years NDOT met the goal in 2021.
Percent of Projects Completed Within the Adjusted Number of Days Allowed
Fremont Southeast Beltway Construction Nears Completion
As a major capital improvement project, the Fremont Southeast Beltway connects three major U.S. highways—US-30, US-275, and US-77. The Beltway was designed to enhance regional connectivity for the traveling public, including heavy truck traffic. With an average daily traffic of over 11,000 vehicles, the connectivity of the Beltway to major highway systems would facilitate truck traffic to Fremont, reduce the challenges of truck traffic within residential and downtown areas of Fremont, and support the expanding economic growth of the area.
The Fremont area experienced significant economic development since 2016 when the Build Nebraska Act (BNA) created the funding to prioritize the Beltway. Stakeholders and the public voiced the need to divert truck traffic outside of town to reduce travel time in the city. In 2018, the project was fasttracked and moved from a 2024 construction season to 2020 due to the growing need to improve mobility and support increased truck traffic
associated with economic growth of the region. The accelerated timeline would not have been possible without the partnerships and the combined $30M of financial support from the City of Fremont, Dodge County, and local businesses. The additional funding provided by the Fremont community will expand the local infrastructure system to support new and existing regional economic expansion.
12 | PROJECT DELIVERY
2022 2021 2020 2019 2018 77% 82% Goal: 80% 76% 80% 83%
Projects Year Completed 2018 118 2019 120 2020 145 2021 86 2022 88
Fremont Southeast Beltway
ASSET MANAGEMENT
Operate, Maintain, Upgrade, and Expand Physical Assets Effectively Throughout Their Life Cycle
Performance measures have been developed to monitor the condition of Nebraska roadways, bridges, and fleet. Various strategies are used to meet goals and objectives to preserve, rehabilitate, and replace major assets managed by NDOT.
Pavement Condition of Nebraska Highways
Description: Measurement of the pavement quality of the state highway surface.
Purpose: This is a measure of the pavement condition of the state’s 10,000 miles of highways. Pavement condition ratings are based upon annual automated and visual inspections and rated according to the Nebraska Serviceability Index (NSI). Highway pavement sections are rated on an NSI scale of 0-100 with any section rated 70 or above considered good. This information is used to help determine appropriate strategies for maintenance, rehabilitation, or reconstruction.
Goal: 80-85% of the highway system miles shall be rated at least good (NSI rating ≥ 70).
Outcome In 2022, 91% of the highway system was rated at least good, exceeding the goal.
Percent
Smoother Roads
Description: Measurement of the smoothness of the roads on the National Highway System (NHS). The NHS is a subset of the highway system and includes roads that are important to the nation’s economy, defense, and mobility. The National Highway System is comprised of 3,655 miles of state highways and local roads.
Purpose: One measure of the smoothness of roads is the International Roughness Index (IRI). This index measures pavement roughness in terms of the number of inches per mile. The lower the IRI number, the better the ride. A smoother roadway is safer and more satisfying to the users of our highway system.
Goal: 65% of all miles on the National Highway System shall be maintained at an acceptable ride quality of “good” (IRI ratings < 95 in/mi). National data was not available for 2021 or 2022.
Outcome: In 2022, 65% of Nebraska’s National Highway System miles had an IRI rating of “good,” meeting the goal.
Percent of “Smooth” Miles on the NHS (IRI < 95)
ASSET MANAGEMENT | 13
Total Highways Non-Interstate Interstate 2022 2021 2020 2019 2018 2017 2016 2015 2014 Total Highways Non-Interstate 90% 91% 76% 87% 91% 77% Goal: 80-85% 96% 95% 86% Interstate
of Miles at Least “Good” (NSI ≥ 70)
NE-NHS Nat'l-NHS Interstate 2022 2021 2020 2019 2018 2017 2016 2015 2014 Nebraska NHS National NHS Interstate 87% 65% 88% 62% 64% 65% 61% 89% Goal: 65% Nat'l NHS 63%
Fleet Condition Index
Description: Measurement of the current condition of NDOT’s fleet.
Purpose: This measure is used to determine appropriate strategies for proper maintenance, repair, and replacement of fleet equipment.
Goal: Achieve and maintain an overall fleet condition index of good.
Outcome: The overall Fleet Condition Index for 2022 was 4.7. The rating shows that NDOT’s fleet was rated in “Poor Condition.” Fleet data also showed that over 65% of the core fleet is at or beyond its expected life-cycle age and unplanned repair costs continue to rise. With the rising cost of equipment, NDOT will need to increase its equipment funding to improve the overall equipment Fleet Condition Index.
Use of a New High Performance Asphalt Mix
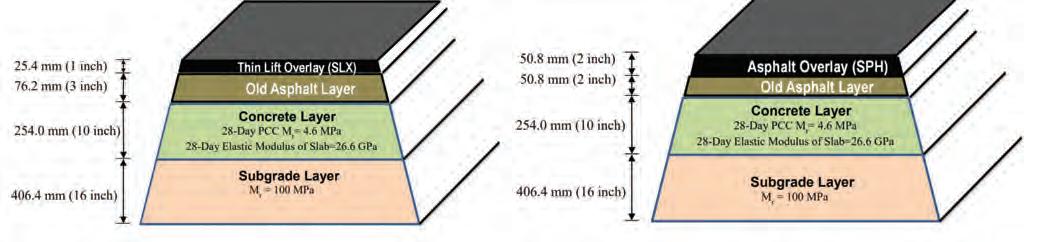
‘Type SLX’ on the Interstate and Expressway Systems
NDOT is using a new asphalt mix for interstate and expressway resurfacing projects instead of the typical Interstate Type SPH mix. The new asphalt mix is called Type SLX, which stands for ‘Surface Laminate X-treme thin’. It was originally used for very thin (one inch or less) pavement preservation overlays dating back to 2013. After exhibiting good initial performance data, additional testing and structural modeling was evaluated. In 2014, a pavement test section was constructed on I-80 Westbound near Kearney. The performance models had mixed predictions for longitudinal cracking, however, one of the tests called a Semi-CircularBend test, predicted that the Type SLX exhibited improved resistance to cracking. Shown below are two of the structural sections used in comparison.
The I-80 Kearney Westbound test section exhibited superior performance after five years of traffic. One area of performance that was exceptionally good, was the resistance to longitudinal cracking, most commonly observed at the centerline of driving lanes and along shoulder joints. Cracking here can lead to water infiltration and additional pavement distresses where patching and sealing is necessary to ‘refill’ and ‘level out’ the pavement where it ‘raveled’ or ‘lost’ material along the joint. This affects roadway performance, its smoothness, and leads to increased maintenance costs. Today, NDOT is specifying SLX in nearly all high-volume interstate and expressway corridors with improved performance.
14 | ASSET MANAGEMENT 2022 2021 2020 2019 2018 5.5 5.9 Overall Fleet Condition Index Poor Condition = 0.0 - 5.0 Fair Condition = 5.1 - 6.8 Good Condition = 6.9 & Above 5.2 6.0 4.7
NDOT’s fleet replacement value is $302M for strictly Core Equipment
Comparison of Type SLX and Type SPH Overlays
Nebraska Bridges in a State of Good Repair County Bridge Match Program
Description: Measurement of the progress toward keeping state-owned bridges in a condition of good repair.
Purpose: All bridges in Nebraska are safety inspected every two years and the condition information is stored in the Nebraska Bridge Inventory. This condition information is used by the Bridge Management Section to determine cost-effective strategies to keep the bridges in good repair. The necessary work may include preservation, repair, maintenance, re-decking, rehabilitation, or replacement.
Goal: To have 95% of Nebraska state-owned bridges in good or fair condition.*
Outcome: 97.1% of Nebraska’s state-owned bridges are in good or fair condition and 2.9% are in poor condition.*
Major Bridge Components - bridge deck, superstructure, substructure
Good - major bridge components are all in good condition or better
Poor - one or more major bridge components are in poor condition or worse
Fair - all other bridges
* Percent Good, Fair and Poor is calculated from bridge deck area.
The County Bridge Match Program (CBMP) was a component of the Transportation Innovation Act (TIA) adopted by the Nebraska Legislature in 2016. The purpose of the CBMP was to accelerate the repair and replacement of deficient bridges on county road systems. In accordance with the Act, NDOT convened a working group of leaders representing county officials, county highway superintendents, engineers, and surveyors who defined the program criteria and guidelines. The selection criteria was designed to prioritize proposals that demonstrated innovation, cost or time savings, sustainability or transferability of innovations, long-term maintenance savings, project significance, needs, and equity.
Based on these guidelines, NDOT issued annual requests for proposals over a seven-year period starting in October 2016 and ending in October of 2022. During the program just over 500 proposals were submitted with requests for funding from 70 counties. An estimated total of $29.3 million in awards were provided for 136 proposals to replace or repair more than 360 bridges in 64 counties.
Through IIJA’s Bridge Investment Program along with regular formula funds, NDOT programmed 15 bridges off the federal-aid system for a total of $57 million over the next 5 years. These projects are located in 11 counties, two villages and two cities. This level of investment will definitely have a positive impact on the overall rating of the local bridges.
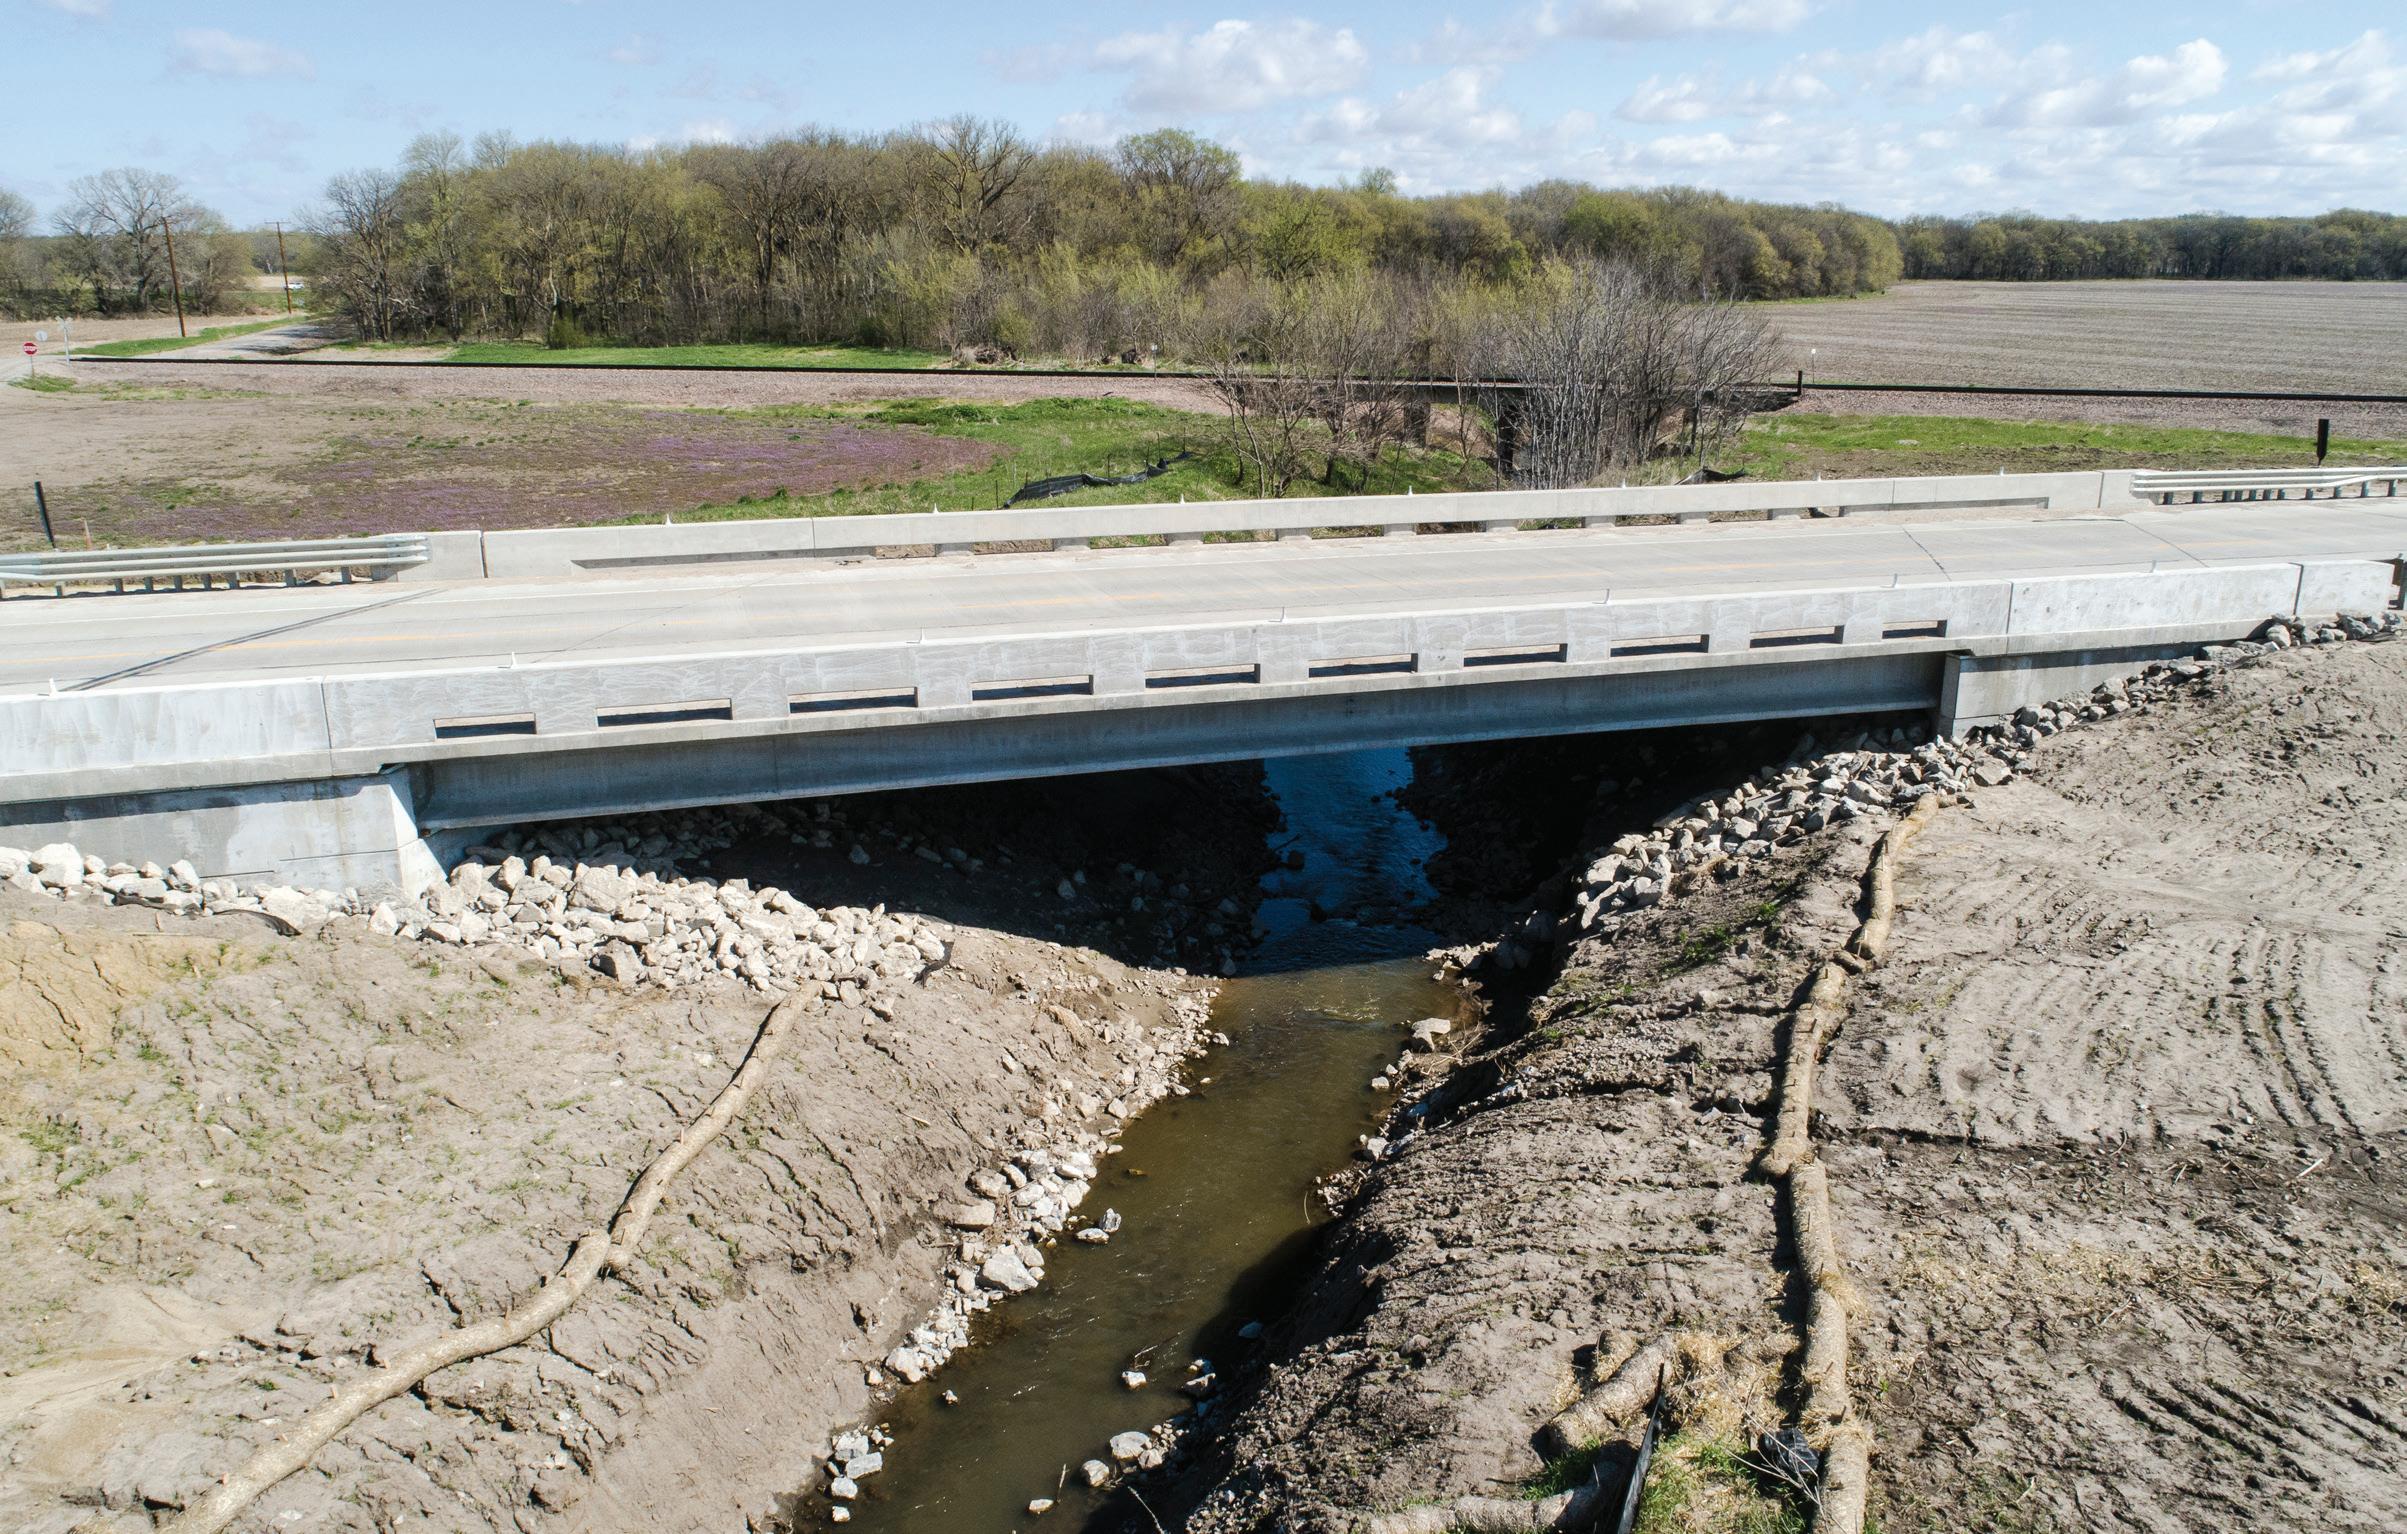
ASSET MANAGEMENT | 15 Bridge on Highway 41, west of Adams
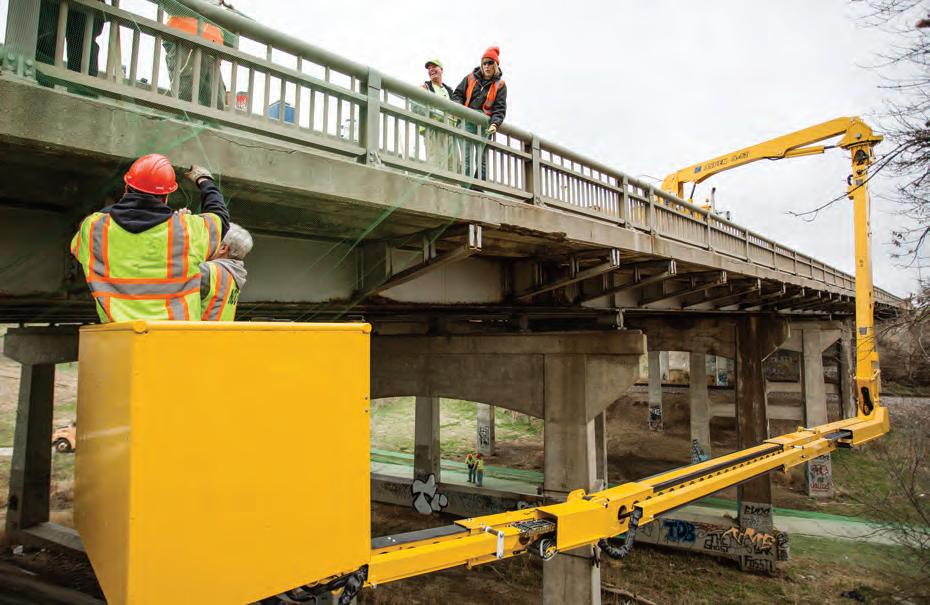
Load Rating of Bridges for Safety Assurance on State and Local Systems
All bridges on public roadways in Nebraska require a load rating analysis to determine and assure their capacity to carry vehicular traffic. Load rating is done using standardized methods and practices to consider the effects of combinations of loads bridges are likely to experience during their service life. Many combinations of loads for specific vehicle axle configurations are analyzed and evaluated for the geometric and material characteristics of each bridge to determine the load bearing capacity. If capacity is less than required, the bridge must be posted with weight restriction signs.
In November 2013, the Federal Highway Administration (FHWA) issued a memorandum that added additional vehicle types to the standard vehicle loads that were used in load rating analysis. It showed that some increasingly common vehicle types could produce loads in excess of the accepted standardized vehicle types previously used in the load rating analysis. This meant that NDOT, and all bridge owners needed to update load ratings for all bridges.
NDOT worked with the FHWA, and local bridge owners, to develop a schedule to provide updated load rating for bridges on the combined state and local systems. The memo divided bridges into two
groups based on how likely they were to have their load capacity effected by the new vehicle types. A deadline to complete new load ratings for the top priority group was set for December 31, 2017. In Nebraska, this meant that approximately 5,600 bridges had to be re-load rated in a short time. An additional 6,000 bridges needed to have new load ratings completed by the end of 2022. NDOT met with members of the Nebraska Association of County Officials and consulting engineers to consider options. It was determined that NDOT would complete the new load ratings with “in-house” resources except for some complex bridges, for which consultants would be hired.
To meet these deadlines, NDOT looked for innovative ways to reduce the workload. For example, nearly 850 bridges already had weight restrictions lower than the lowest new vehicle load and could be excluded. About 3,900 singlespan steel girder bridges had load ratings done by a conversion method developed by NDOT and approved by the FHWA. With the work of three full-time engineers and four part-time engineering students, all deadlines were met well ahead of schedule and at a considerable cost savings to the State of Nebraska.
16 | ASSET MANAGEMENT
84th Street in Omaha
MOBILITY
Improve Mobility on Nebraska’s Transportation System Through Increased Reliability, Capacity, and Efficiency
The purpose of the goal is to improve mobility on Nebraska’s transportation system through increased reliability, capacity, and efficiency. Goal objectives include reducing the duration of incident response and clearance times as well as improving the system’s operating efficiency. By responding to and clearing an incident on the roadway as quickly as possible, traffic returns to normal conditions, thereby improving the system mobility.
Percent of Reliable Person-Miles Traveled
Description: Measures primarily recurring congestion for the interstate system and the non-interstate National Highway System (NHS). Reports the percent of travel on roads where the worst day of the week’s travel time is less than 50% longer than an average day.
Purpose: To increase awareness of reliable travel and reduce disruption from traffic congestion. Reliable travel offers travelers assurance of reaching their destination within a reasonable time. Through traffic management and operations strategies, NDOT can successfully reduce long travel times.
Goal: A reliability percentage of 98.5% for interstates and 92% for non-interstate NHS highways.
Outcome: The reliability percentage goal for interstates and non-interstate NHS highways was met in 2020 and 2021.
Nebraska's Traffic Incident Management Program
Traffic incidents and related congestion in Nebraska can carry serious implications for responder and public safety, movement of people and goods, and the environment. The Nebraska TIM Program was established in 2020 and follows a mission to foster and strengthen relationships and unify safety culture. By working collectively, responders are able to respond quicker, clear the scene safely, and keep traffic moving whenever possible.
Nebraska TIM presented at the Nebraska County Attorneys Association conference in Kearney in May 2022. In Nebraska, county attorneys are often the county coroner and have a role to play in a fatal crash. As a result of the presentation, the association’s leadership is considering purchasing high-visibility vests for each county attorney to wear while responding to incidents.
Nebraska State Patrol partners recognize the importance of proper TIM training to prepare troopers for the challenges they will face on the job and have worked hard to make National TIM Training a part of the required curriculum for new recruits. As a result of this partnership with NDOT and NSP, NSP trained an additional 249 cadets/troopers in 2022.
The State Operations Center is a crucial communication conduit for incidents on roadways. With recent changes to the SOC, an updated contact poster with updated contact information was shared with 25 emergency communications centers across the I-80 corridor when the SOC made the switch to 24/6 staffing. This outreach improves communication between local and state by sharing the SOC’s role in incident management and evaluating the DOT notification process.
80% 85% 90% 95% 100% Non-Interstate Interstate 2022 2021 2020 2019 2018 2017 92% 92% 99% % of Person-Miles Traveled on Interstate or Non-Interstate NHS that are Reliable 100% 98% 99% 99% 91% 96% 96% Interstate Non-Interstate NHS Goal: 92% Goal: 98.5%
MOBILITY | 17
COMMUNICATION, COORDINATION, COLLABORATION, & COOPERATION (4Cs)
Collaborate with Stakeholders to Maximize the Value of Nebraska’s Transportation Investments
A goal of NDOT is building relationships across Nebraska, which will not only improve NDOT’s relationships with stakeholders but maximize the value of Nebraska’s transportation investments through transparency and collaboration. The NDOT Public Involvement (PI) team, housed within the Communications and Public Policy Division, is responsible for doing just that. Their role is to ensure stakeholders affected by NDOT projects are aware of what’s going on, provide an opportunity to learn more, and express their thoughts on a project in their community.
The PI team touches every NDOT project delivered across the state – a reach spanning every mile of road that NDOT has. Although there is a minimum amount of outreach that must be completed per Federal and State regulations, it’s not just a checkbox approach for NDOT’s PI team. The PI team wants to reach communities in ways that works for them. It’s nearly impossible to measure the effectiveness of their outreach; however, they developed a way to measure the awareness a community has of a project based on the Public Involvement tools used.
Over that last two years, the PI team set a goal to quantify as much data as they could about their activities and outcomes. The PI team created a dashboard that houses data collection for each project, throughout the life of the project. This dashboard will aid the team to better tailor its outreach methods across the state and support the decision-making process.
When it comes to data collection, the dashboard identifies relationships and patterns that exist in the data like identifying data gaps and developing future tools to better quantify the reach. In addition to those metrics, the dashboard will track website analytics, social media, and public involvement tools used to notify communities of projects going through delivery and preconstruction phases. The PI team also added a demographics and outreach survey to gauge how well their tools are working.
Through this process, the PI team can learn what project information the public is seeking, how they learned about the project, and meet the goal of building relationships.

18 | 4 Cs
WORKFORCE DEVELOPMENT
Support and Facilitate the Development of a Skilled Workforce that Enhances Workplace Productivity and Increases Opportunities for Employees to Learn New Skills

The current Strategic Training Plan focuses on three aspects of teammate development and training.
n Technical Training – enhances our teammates’ ability to hone their skills.
n Leadership Development – focuses on skills that strengthen our teammates abilities to create cohesive teams and create positive climates that retain our skilled workforce.
n Tuition Reimbursement & Certification/ License Reimbursement – affords our teammates the opportunity to pursue a technical, associate, or undergraduate degree to achieve their higher education goals as well as an opportunity to obtain a job specific license or certification to stay up to date in their specific career field or industry.
Technical Training Program
Awarded federal workforce development dollars allowed NDOT to provide a plethora of technical training to our workforce ensuring they are equipped with the latest technology, research, and materials to build and maintain an innovative transportation system. In FY 2021-2022, NDOT offered 51 categories of technical training to multiple teammates. In addition, learning and development funds through NDOT continue to support even more
technical training opportunities. NDOT also hired a Technical Training Coordinator whose primary focus is to ensure our workforce has the technical knowledge, skills, and tools it needs to continue to serve the State of Nebraska.
Leadership Development Program
The 2020-2021 Leadership Development Program had 154 teammates enrolled and conducted 100 leadership classes. In 2022, the training team performed a needs analysis of the Leadership Development Program and identified several areas to increase its ability to serve teammates with more focused and tailored training. NDOT is projecting to train 214 teammates in the first half of FY 2023-2024.
WORKFORCE DEVELOPMENT | 19 2023 2022 2021 108 Leadership Courses Offered 100 214 (Projected)
Tuition Reimbursement Program
The Tuition Reimbursement Program saw the biggest increase in tuition reimbursement in three years. NDOT anticipates tuition reimbursement to increase in popularity in the coming years as it promotes retention, reduces recruitment costs, signals that NDOT values teammates, and supports investing in teammates to make the overall team more successful.
Certification/License Reimbursement Program
The Certification/License Reimbursement Program encourages teammates to improve their industry knowledge through relevant certification, designation, license programs, and professional organizations membership. NDOT is committed to lifelong learning to ensure preparedness in meeting future challenges. Currently, FY 2023 totals almost matched FY 2022 totals, with four months left in this fiscal year.
Building Our Future Workfoce
The Talent Acquisition team’s targeted recruitment strategy focuses on building and developing NDOT’s future workforce by:
n Offering paid internships for engineering students across the state, summer internships in all eight districts, and year-round internships in various divisions. Paid internship opportunities are offered for students studying Diesel Technology, Land Surveying, GIS, Design and Drafting, Environmental Sciences, Accounting, Real Estate, and Information Technology. These internship opportunities allow students to be at the forefront of NDOT operations performing real-world tasks while obtaining hands-on experience under the direction of experienced
mentors. By increasing these opportunities, as well as creating targeted marketing strategies, NDOT saw a 12.5% increase in intern hires in 2021, and a 44% increase in intern hires in 2022.
n Increasing outreach efforts by connecting with universities, technical schools, high schools, and community organizations. By committing to building and creating outreach partnerships within our communities, NDOT saw a 286% increase in outreach efforts in 2021 and a 40% increase in outreach efforts in 2022. Additionally, NDOT hired an Outreach Coordinator whose focus is building our outreach program and creating more partnerships.
20 | WORKFORCE DEVELOPMENT
2022 2021 2020 $43,222 Tuition Amount Reimbursed $49,218 $56,389 FY-23 FY-22 FY-21 FY-20 $1,360 Licenses/Certifications Reimbursed $0 $26,054 $25,688
AERONAUTICS DIVISION
Nebraska’s airport system is a dynamic part of the state’s economy which enhances quality of life through infrastructure and services that meet the diverse and evolving needs of all Nebraskans.
Nebraska avaition counts making valuable contributions to the communities it serves, providing access to the state 24 hours a day, 7 days a week, 365 days a year.
https://dot.nebraska.gov/nebraska aviation counts/

The Divisions’ goals include:
n Developing aviation as an integral part of Nebraska’s transportation system
n Encouraging aviation-related economic development that links the state, country, and world as a significant mode of transportation
n Creating and implementing strategies to protect and improve the state’s aviation system
n Supporting the efficient modernization of Nebraska’s airport system, emphasizing operational safety and security
n Maintaining a system of navigational aids that supplement the Federal system
n Assisting eligible public-use airports to preserve and maintain paved airport surfaces through maintenance and rehabilitation
n Maintaining the state-owned aircraft
n Supporting aviation education
n Providing safe and efficient air transportation for all branches of state government
n Maintaining the three state-owned airfield in a safe and serviceable condition
Nebraska Airport Capital Improvement Plan
https://dot.nebraska.gov/media/13399/cip report 19.pdf
79 Public-use Airports

9 Airports with Commercial
803,591 Aircraft Operations at Public-use Airports
1,811 Based Aircraft at Public-use Airports
AERONAUTICS DIVISION | 21
For more on NDOT operations, projects and fiscal reports visit our Publications page https://dot.nebraska.gov/news-media/publications/