Social Studies and the Young Learner March/April 2025
The Healthy Integration of Social Studies: Addressing Multiple Content Areas with Fidelity
Guest Editor: Cathy A. R. Brant
March/April 2025
Volume 37, Number 4
p. 2
Guest Editor’s Notes
p. 3
Member Spotlight
pp. 4–9
Seeding Community: STEMSS Collaboration Around Indigenous History, Culture, and Sovereignty
Brianna Lafoon and Elizabeth A. Crotty
pp. 10–15
“Dust to Eat, Dust to Breathe, Dust to Drink”: Using Systems Thinking to Uncover the Causes of the Dust Bowl
Michelle Reidel, Ariel Cornett, Erin Piedmont, Kania Greer, Betsy Barrow, and Alex Reyes
pp. 16–18, 25
Social Studies + Mathematics: Using a Slow Reveal Graph to Explore Black Members of Congress in U.S. History
Abigail Stebbins and Amy Brass
Pullout, P1–P3
Slow Reveal Graphs
Abigail Stebbins and Amy Brass
pp. 19–25
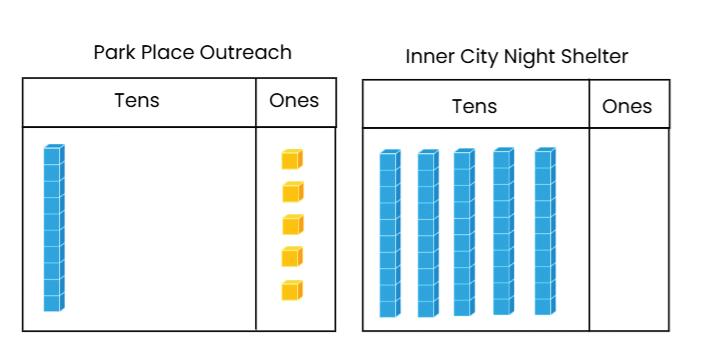
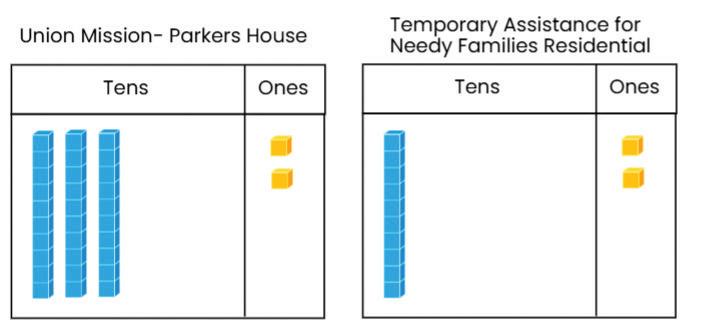
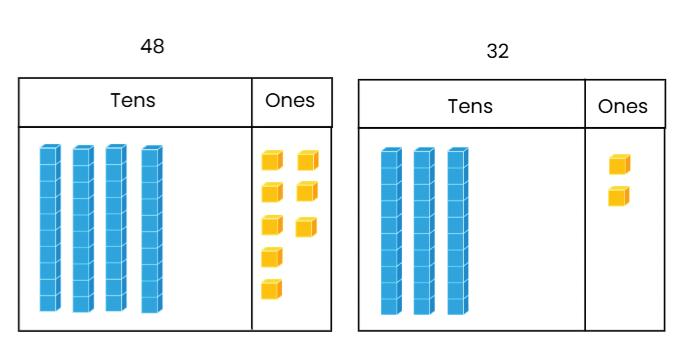
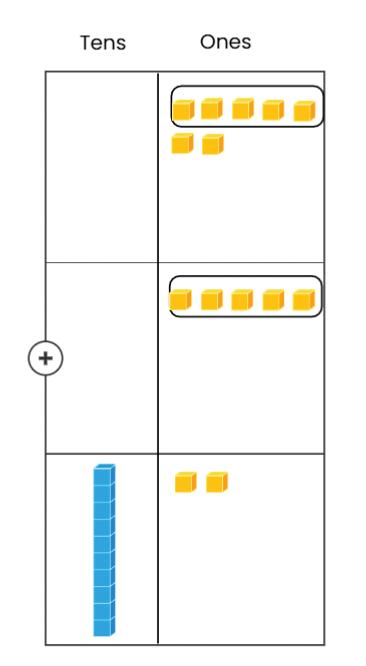
From Digits to Difference: Taking Civic Action to Support Shelters and Empower Students
Erin V. Piedmont and Alesia Mickle Moldavan
pp. 26–32
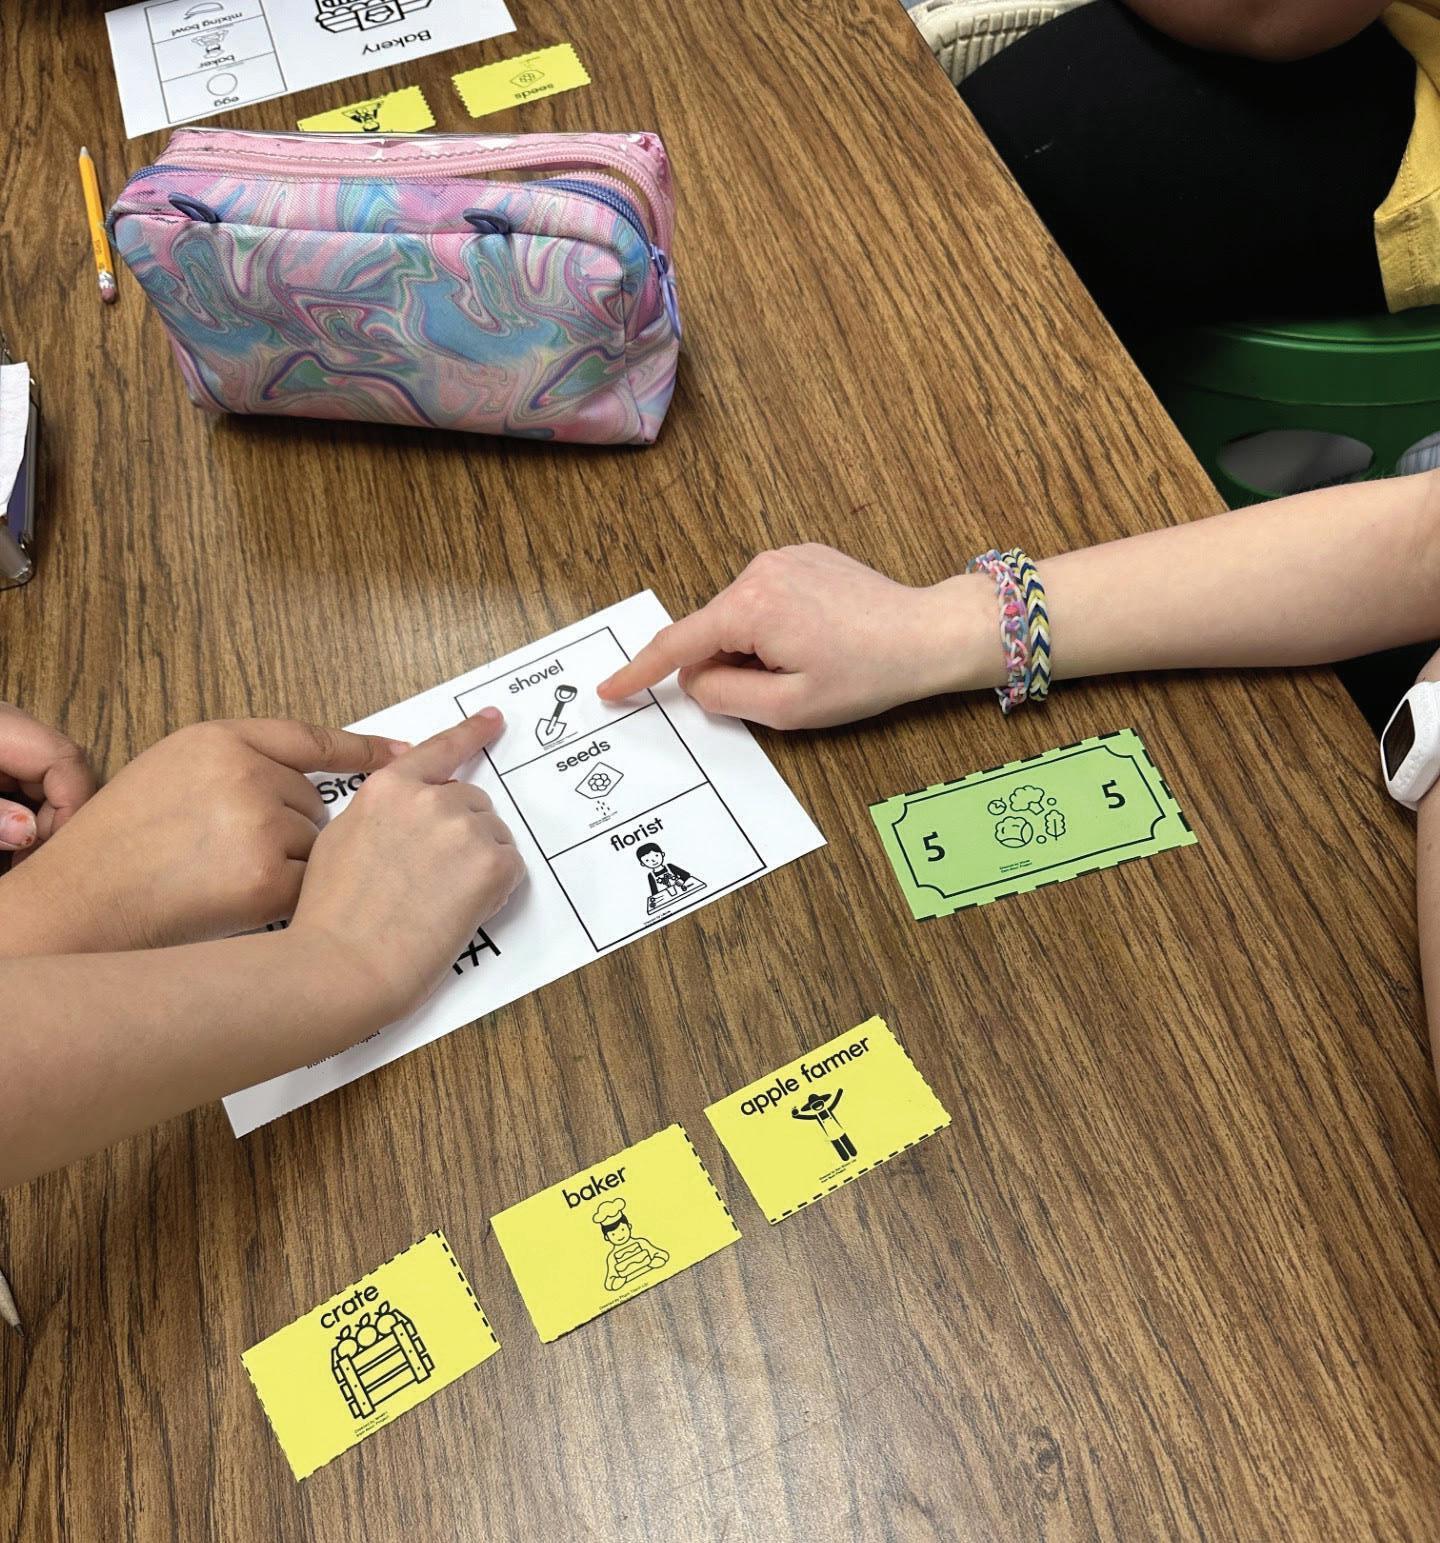
“Bluey-conomics”: It’s Not All About the Money
Alexa Quinn, Stephen Day, and Lauren Shifflett
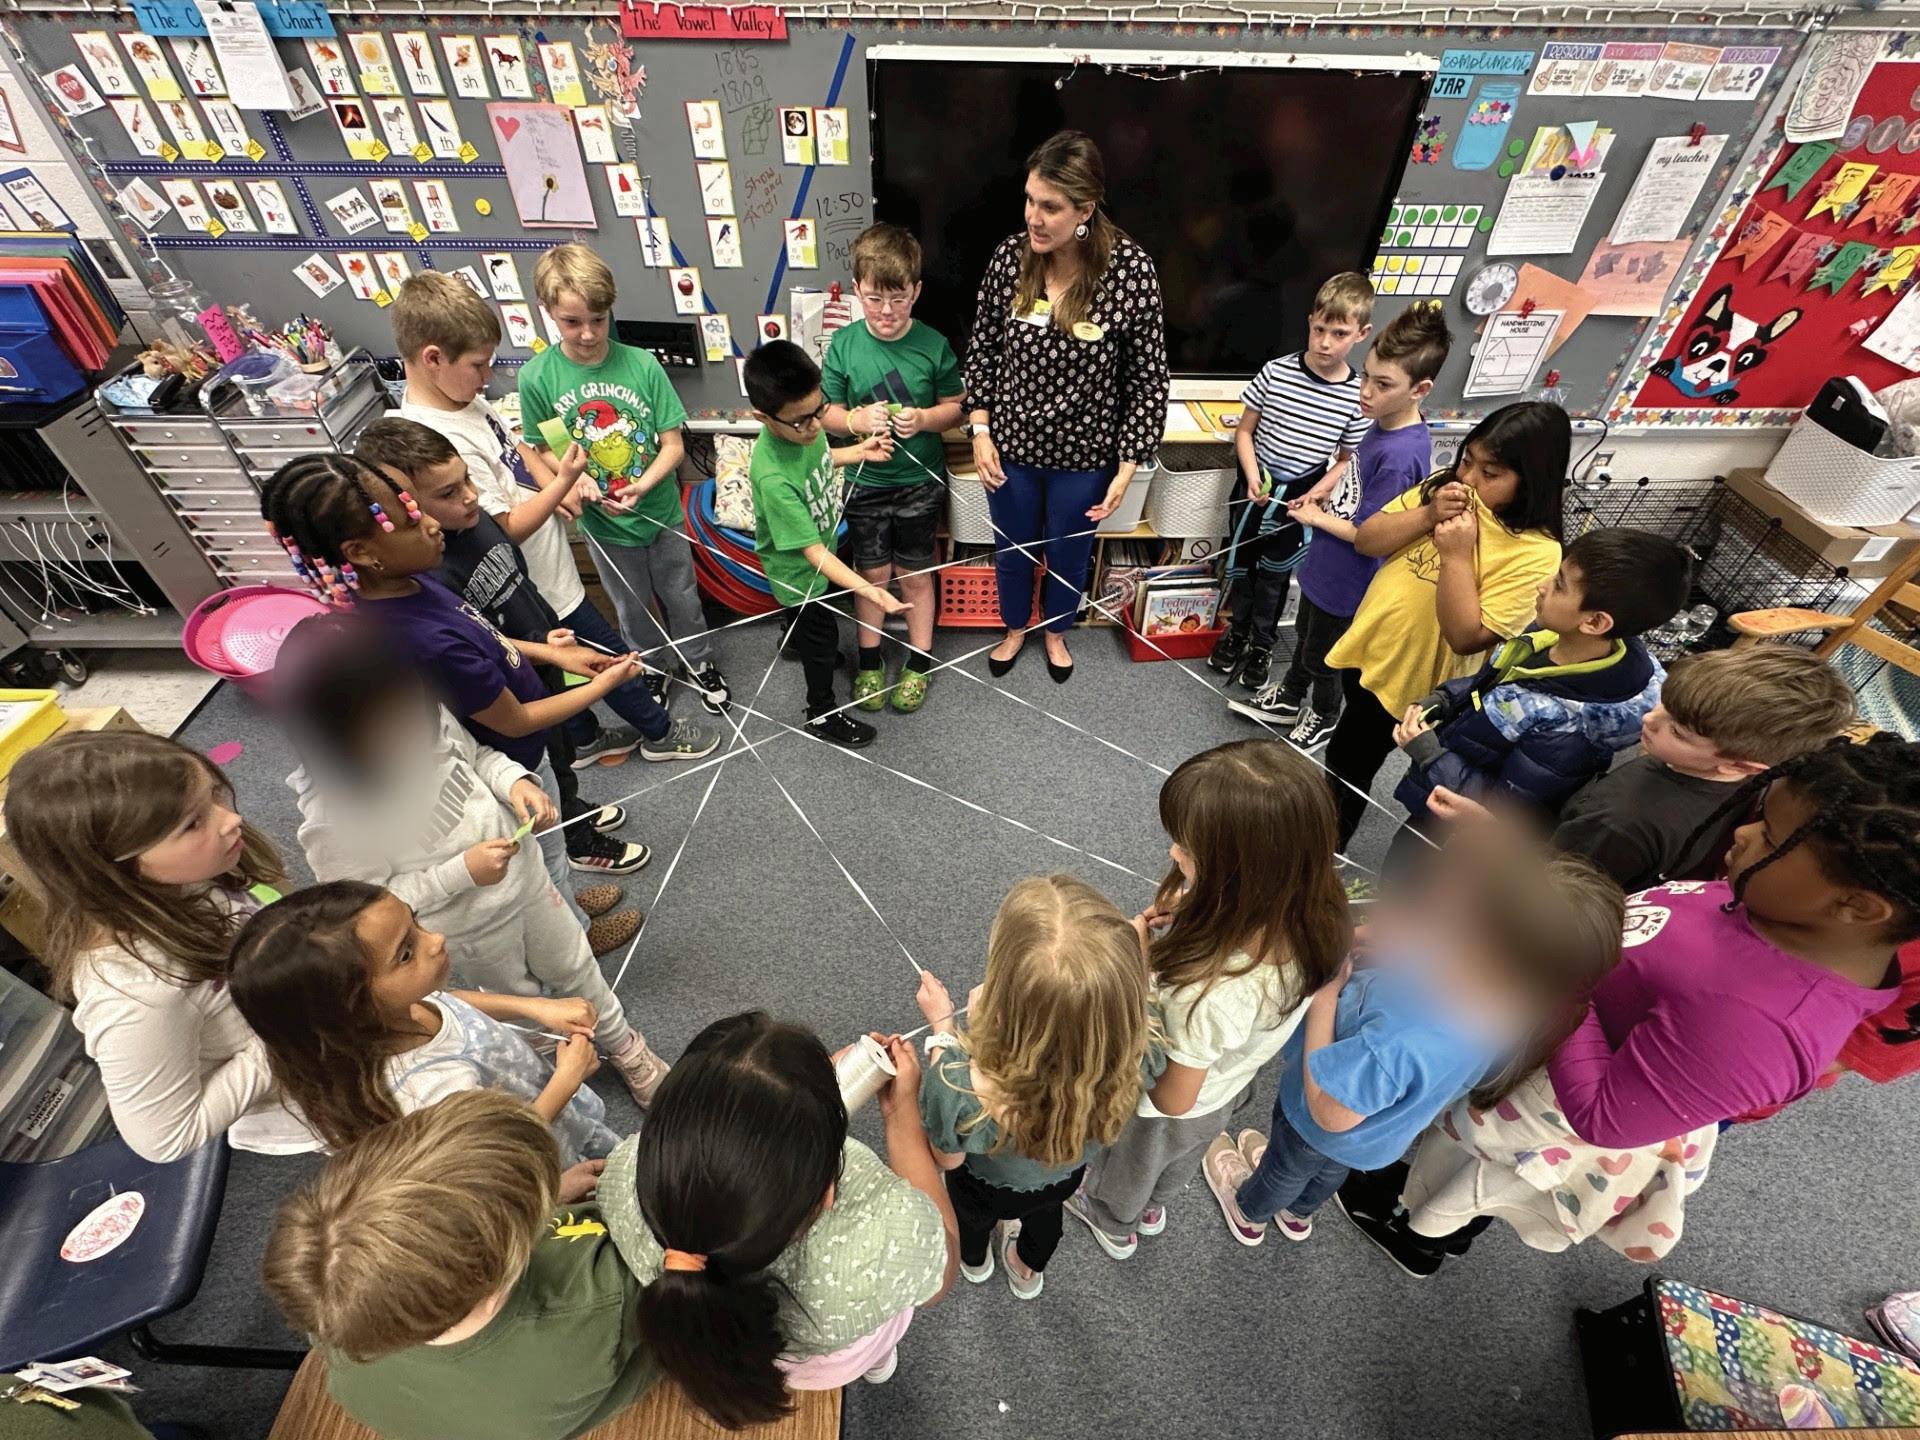
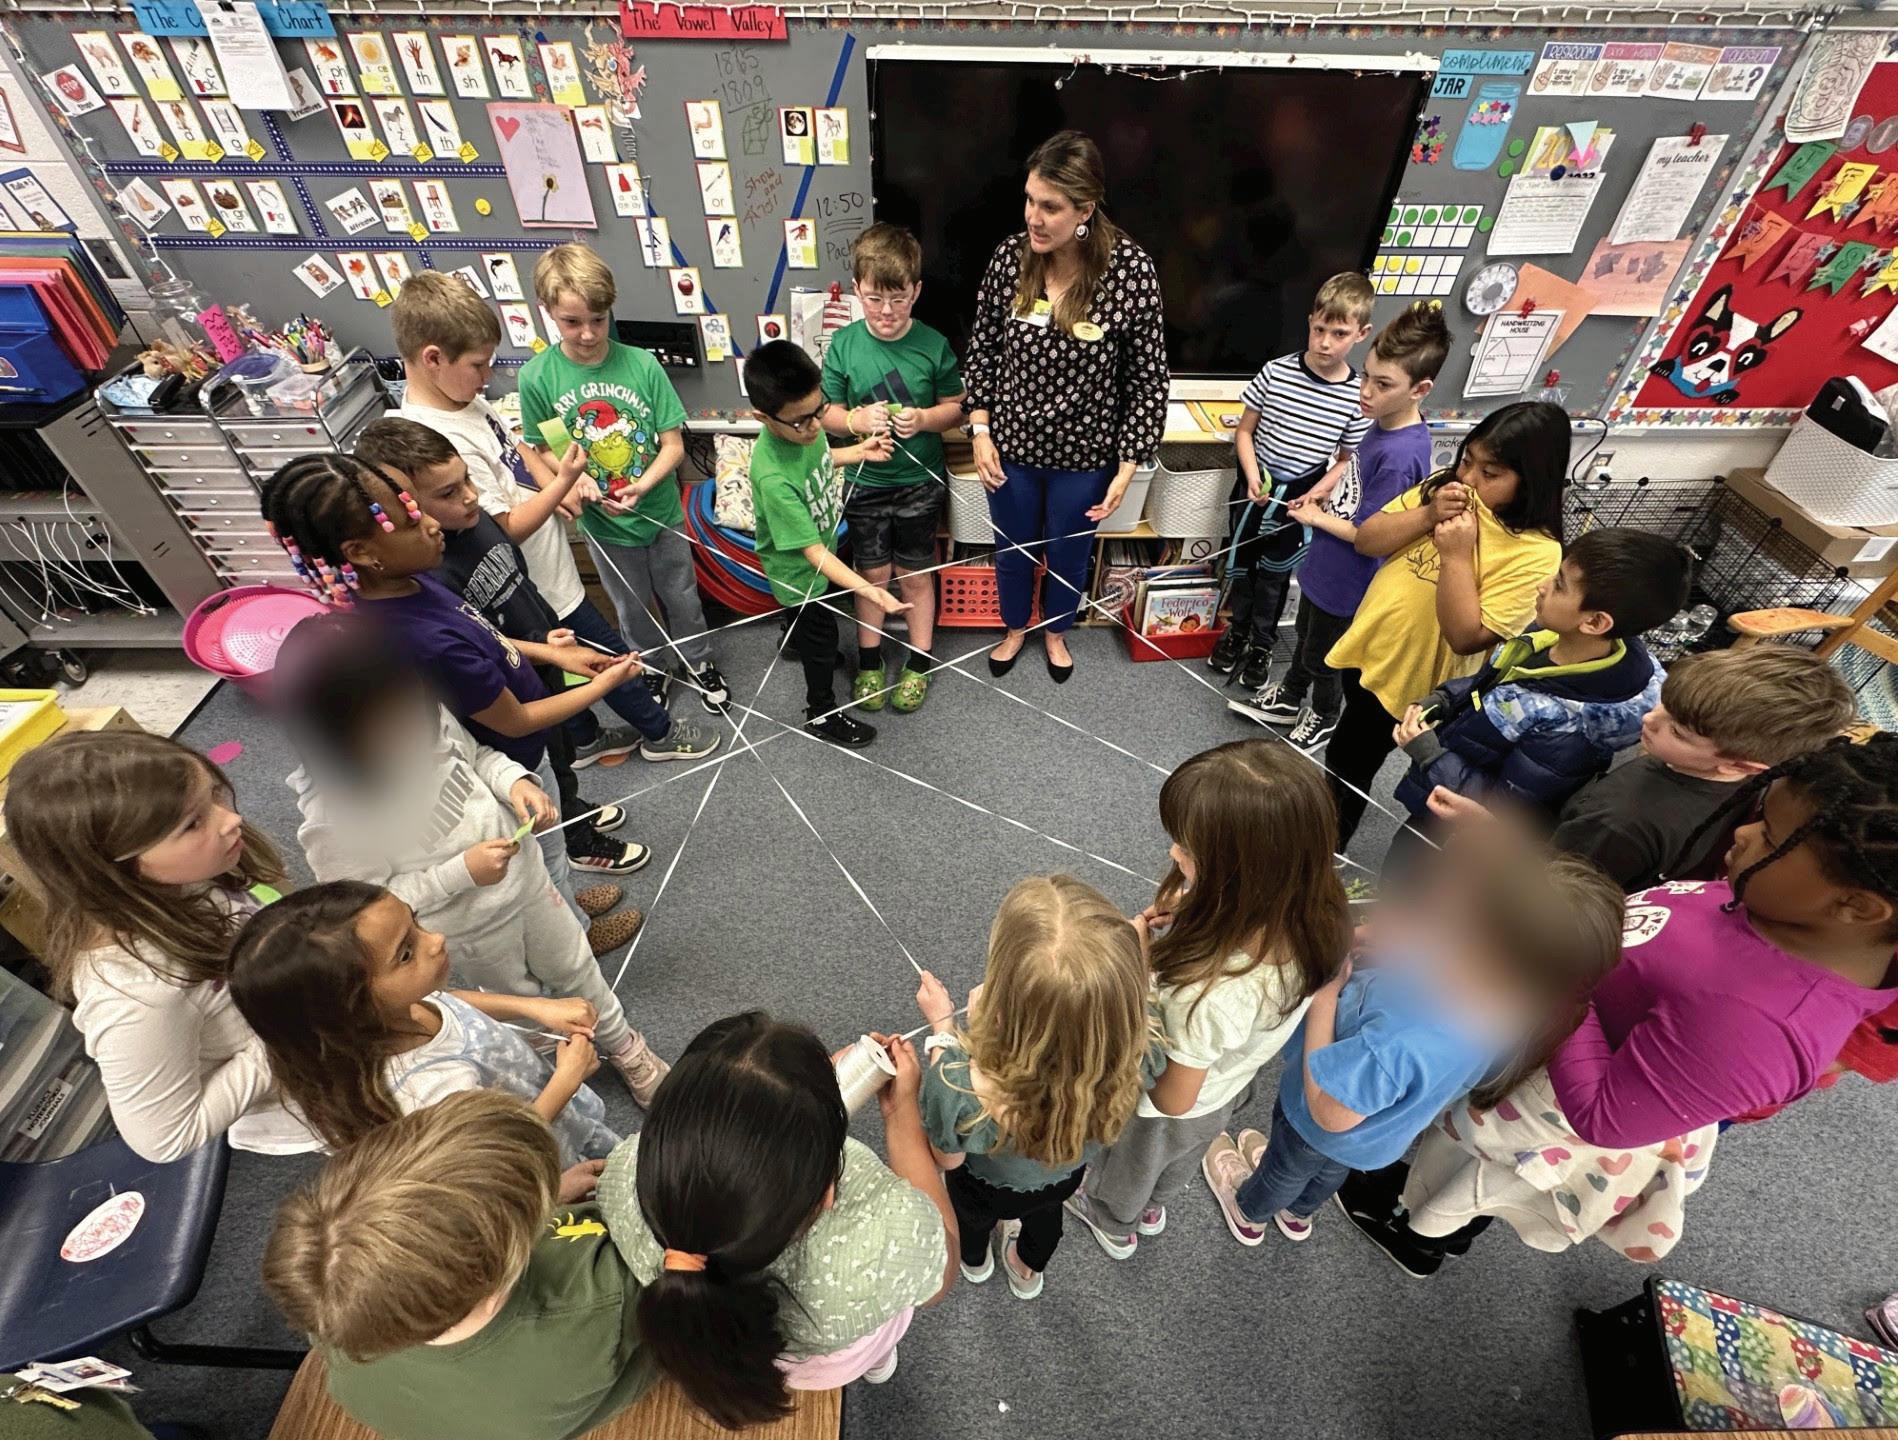
ON THE COVER: Students create a market web during a simulation activity. See “‘Blueyconomics’: It’s Not All About the Money” by Alexa Quinn, Stephen Day, and Lauren Shifflett in this issue (pp. 26–32).
NCSS OFFICERS
Jennifer Morgan (President)
West Salem Middle School, West Salem, WI
Tina Ellsworth (President-Elect)
Northwest Missouri State University, Maryville, MO
Joe Schmidt (Vice President)
Bill of Rights Institute, Augusta, ME
Wesley Hedgepeth (Past President)
Collegiate School, Richmond, VA
BOARD OF DIRECTORS
CherylAnne Amendola
Montclair Kimberley Academy, Montclair, NJ (2027)
Alex Cuenca
Indiana University, Bloomington, IN (2026)
Carly Donick
Cabrillo Middle School, Ventura, CA (2026)
Terrell Fleming
Prince Edward County Public Schools, Farmville, VA (2027)
Kimberly Huffman
Wayne County Schools, Smithville, OH (2027)
David Kendrick
Loganville High School, Loganville, GA (2025)
Stephen Masyada
Lou Frey Institute and the Florida Joint Center for Citizenship, Orlando, FL (2027)
Heather Nice
The Colonial Williamsburg Foundation, Williamsburg, VA (2026)
Stephanie Nichols
Narragansett Elementary School, Gorham, ME (2025)
Sharon Thorne-Green
Katy Independent School District, Katy, TX (2025)
Marc Turner
Spring Hill High School, Columbia, SC (2026)
Anne Walker
Edison High School, Alexandria, VA (2025)
EX-OFFICIO
Erik Olander
Ex-Officio | House of Delegates Steering Committee Chair (2024–2025)
Interim Executive Director
Anton Schulzki
Deputy Executive Director
Joy Lindsey
Department Directors
Timothy Daly Director of Operations
Ashanté Horton Director of Meetings and Exhibits
Nancy Driver Director of Publications
MEMBERSHIP in the National Council for the Social Studies (NCSS) is open to any person or institution interested in the social studies. All members receive the NCSS journal of their choice (Social Education or Social Studies and the Young Learner), as well as the e-newsletter, The Social Studies Professional (two issues per month), access to the online NCSS publication archives, the online Middle Level Learning supplement, and discounts on NCSS conference registration, books, and professional development programs. Members who choose Social Studies and the Young Learner as their journal also receive the September and May-June issues of Social Education Comprehensive members receive all books in the NCSS Bulletin series published during the membership year.
Regular membership rates for individuals are $90 per year. Rates for students and retired persons are $53 per year. For rates and benefits of institutional membership, and further information on all levels of membership, go to www.socialstudies.org/membership
Become an NCSS member!
Use your smartphone’s camera to scan this QR code or go to www. socialstudies.org/membership.
SUBSCRIPTIONS to Social Studies and the Young Learner are available to non-member institutions. A print-only subscription is $68 per year. Online subscriptions for Social Studies and the Young Learner are available through the IngentaConnect platform. Visit www.socialstudies.org/ publications/subscriptions and www.ingentaconnect.com/content/ncss. The online subscription is worldwide, IP supported, and SERU friendly for $171 per year. The online-plus-print subscription is $194 in the United States (add $11 for Canada and $45 international to cover mailings).
SINGLE COPIES of Social Studies and the Young Learner are $6.00 (member price), $7.95 (non-members) plus shipping and handling. Contact 1-800-683-0812. Single articles are available (pdf: $14.95 for non-members) at www.ingentaconnect.com/content.ncss. NCSS members can access articles through the online archives.
P.O. BOX: To become a member or subscribe (as
EDITORIAL STAFF
Editor, Scott M. Waring, University of Central Florida
Associate Editor, Laura Godfrey
Department Editors, Teaching Young Learners with the C3 Framework, Emma Thacker, Kathy Swan, John Lee, & S. G. Grant
Publications Director, Nancy Driver
Art Manager, Rich Palmer
EDITORIAL BOARD
Sohyun An – Kennesaw State University
Michelle Bauml – Texas Christian University
Kristy Brugar – University of Oklahoma
Lisa Brown Buchanan – Elon University
Tina Ellsworth – Northwestern Missouri State University
Eric Groce – Appalachian State University
Tina Heafner – University of North Carolina Charlotte
Lynda Herrera – George Mason University
Janie Hubbard – The University of Alabama
Dawnavyn James – University of Buffalo
Sarah Montgomery – Wartburg College
Scott Morrison – Elon University
Kim O’Neil – National Board for Professional Teaching Standards
Brianne Pitts – Western Michigan University
Tracy Rock – University of North Carolina Charlotte
Liz Saylor – University of Georgia
Corey Sell – Metropolitan State University of Denver
Jay Shuttleworth – City University of New York, Queens College
ONLINE: Visit SSYL at www.socialstudies.org/publica tions/ssyl and www.ingentaconnect.com/content/ncss
READERS: The editors welcome suggestions, letters to the editor, and manuscripts to our peerreviewed journal. Guidelines at www.socialstudies.org/ publications/ssyl; submit at www.editorialmanager.com/ ncssjournals; questions to ssyl@ncss.org; 301-850-2498. Contributors express their own views, reflecting divergent opinions.
DELIVERY AND CHANGE OF ADDRESS: View and update your record, www.socialstudies.org/membership; send new address to membership@ncss.org; or call 800-296-7840 ext. 111. Callers outside the U.S. and Canada use 301-588-1800 ext. 111.
PERMISSION to reproduce articles for academic use, contact Copyright Clearance Center, Academic Permissions Service, 222 Rosewood Dr., Danvers, MA 01923; 978-750-8400 (phone), 978-750-4470 (fax).
ADVERTISING: Maribell Abeja-DeVitto, Account Manager MAbejaDeVitto@smithbucklin.com; 312-673-5483 Visit www.socialstudies.org/advertising for rates and specifications.
INDEXED by Institute of Education Sciences, eric. ed.gov
POSTMASTER: Send address changes to Social Studies and the Young Learner NCSS, 8555 Sixteenth St., Suite 500 Silver Spring, MD 20910 USA
Social
ISSUE NOTES
A
Perfect
Mix: The Healthy Integration of Social Studies and STEM
Guest Editor’s Notes
Cathy A. R. Brant
Cathy A. R. Brant, Rowan University
As an attempt to combat the decline in social studies instruction,1 Hinde argues that it is critical for elementary educators to engage in the healthy integration of social studies and other content areas.2 For integration to be healthy, both content areas are taught simultaneously and with fidelity. The articles in this special issue provide examples of how the integration of social studies and STEM can be done—and done well.
In their article, “Seeding Community: STEMSS Collaboration Around Indigenous History, Culture, and Sovereignty,” Lafoon and Crotty highlight how they integrated their social studies and science methods classes to help students engage in a deeper study of their local Indigenous Nations: the Ojibwe and Dakota.
Reidel, Cornett, Piedmont, Greer, Barrow, and Reyes integrate science and social studies in their article, “‘Dust to Eat, Dust to Breathe, Dust to Drink’: Using Systems Thinking to Uncover the Causes of the Dust Bowl.” This article discusses using the IDM and systems thinking to integrate these topics and help students develop “big picture” thinking.
Stebbins and Brass, in “Social Studies + Mathematics: Using a Slow Reveal Graph to Explore Black Members of Congress in U.S. History,” demonstrate how teachers can integrate social studies and mathematics through the use of slow reveal graphs. This, like the name suggests, is a strategy in which the teachers slowly reveal parts of the graph to the students to aid in graph comprehension.
In “From Digits to Difference: Taking Civic Action to Support Shelters and Empower Students,” Piedmont and Moldavan address the topic of houselessness. Through this integration of social studies and mathematics, this article demonstrates how children can foster the civic competence necessary to address real-world challenges, like poverty and homelessness.
Finally, in “‘Bluey-conomics’: It’s Not All About the Money,” Quinn, Day, and Shifflett show the ways in which the popular children’s show Bluey highlights what they term “everyday moments” that can help young children learn about non-money economic concepts, such as decision-making, scarcity, and trade.
Notes
1. Gahan Bailey et al., “The Devaluation of Social Studies in the Elementary Grades,” Journal of Social Studies Research 30, no. 2 (2006): 18–29; Keith C. Barton and Linda S. Levstik, Teaching History for the Common Good (Routledge, 2004); Paul G. Fitchett et al., “Examining Elementary Social Studies Marginalization: A Multilevel Model,” Educational Policy 28, no. 1 (2014): 40–68; Tina L. Heafner, “Elementary ELA/Social Studies Integration: Challenges and Limitations,” The Social Studies 109, no. 1 (2018): 1–12; Neil O. Houser, “Social Studies on the ‘Backburner’: Views from the Field,” Theory & Research in Social Education 23 (1995): 147–168; James S. Leming et al., “The State of Social Studies: A National Random Survey of Elementary and Middle School Social Studies Teachers,” Social Education 70, no. 5 (2006): 322–327; Phillip J. VanFossen, “‘Reading and Math Take So Much of the Time...’: An Overview of Social Studies Instruction in Elementary Classrooms in Indiana,” Theory and Research in Social Education 33, no. 3 (2005): 376–403.
2. Elizabeth R. Hinde, “Fractured Social Studies or Integrated Thinkers: The End Results of Curriculum Integration,” Social Science Research and Practice 4, no. 3 (2009): 118–127.
Seunghoon Han is a Ph.D. Candidate in Curriculum and Instruction with a specialization in Social Studies Education at The Pennsylvania State University. Seunghoon spent six years as an elementary school teacher in Seoul, South Korea, and is currently in his third year as a teacher educator at Penn State. Including time as a pre-service teacher, Seunghoon has dedicated 15 years to the field of education.
Q. Why did you become a teacher [educator]?
A. Teaching never feels like work to me because I genuinely enjoy working with students and colleagues. Witnessing their growth and accomplishments has always been deeply fulfilling. As a teacher educator and researcher, I now find even greater joy in collaborating with fellow educators to create a brighter future through education.
Q. What teaching success or career achievement are you most proud of?
A. I am proud of the relationships I have built with my students at Penn State. Their dedication and passion continually inspire me to become a better educator. Additionally, I feel privileged to serve on the selection committee for the Notable Social Studies Trade Books for Young People. This work is especially meaningful to me because I believe that identifying highquality resources is essential for powerful and purposeful social studies teaching. Being part of NCSS’s collective effort
alongside committed colleagues has been an incredible honor.
Q. When and why did you join NCSS?
A. I began participating in NCSS in 2021. As someone who has admired NCSS’s contributions to social studies education since my undergraduate studies in Korea, joining this organization felt like a natural step to deepen my engagement with the field and connect with a community of passionate educators.
Q. How has being a part of a professional association enriched your career?
A. The relationships and meaningful interactions I have had within the NCSS community have enriched my career in countless ways. Through NCSS, I have found a supportive network of like-minded professionals, access to valuable resources, and opportunities for professional growth and collaboration that have profoundly shaped my journey as an educator and researcher.
Junior Rho Kappa
is the only national organization for middle or junior high school students that recognizes excellence in the field of Social Studies
Seeding Community: STEMSS Collaboration Around Indigenous History, Culture, and Sovereignty
Brianna Lafoon and Elizabeth C. Crotty
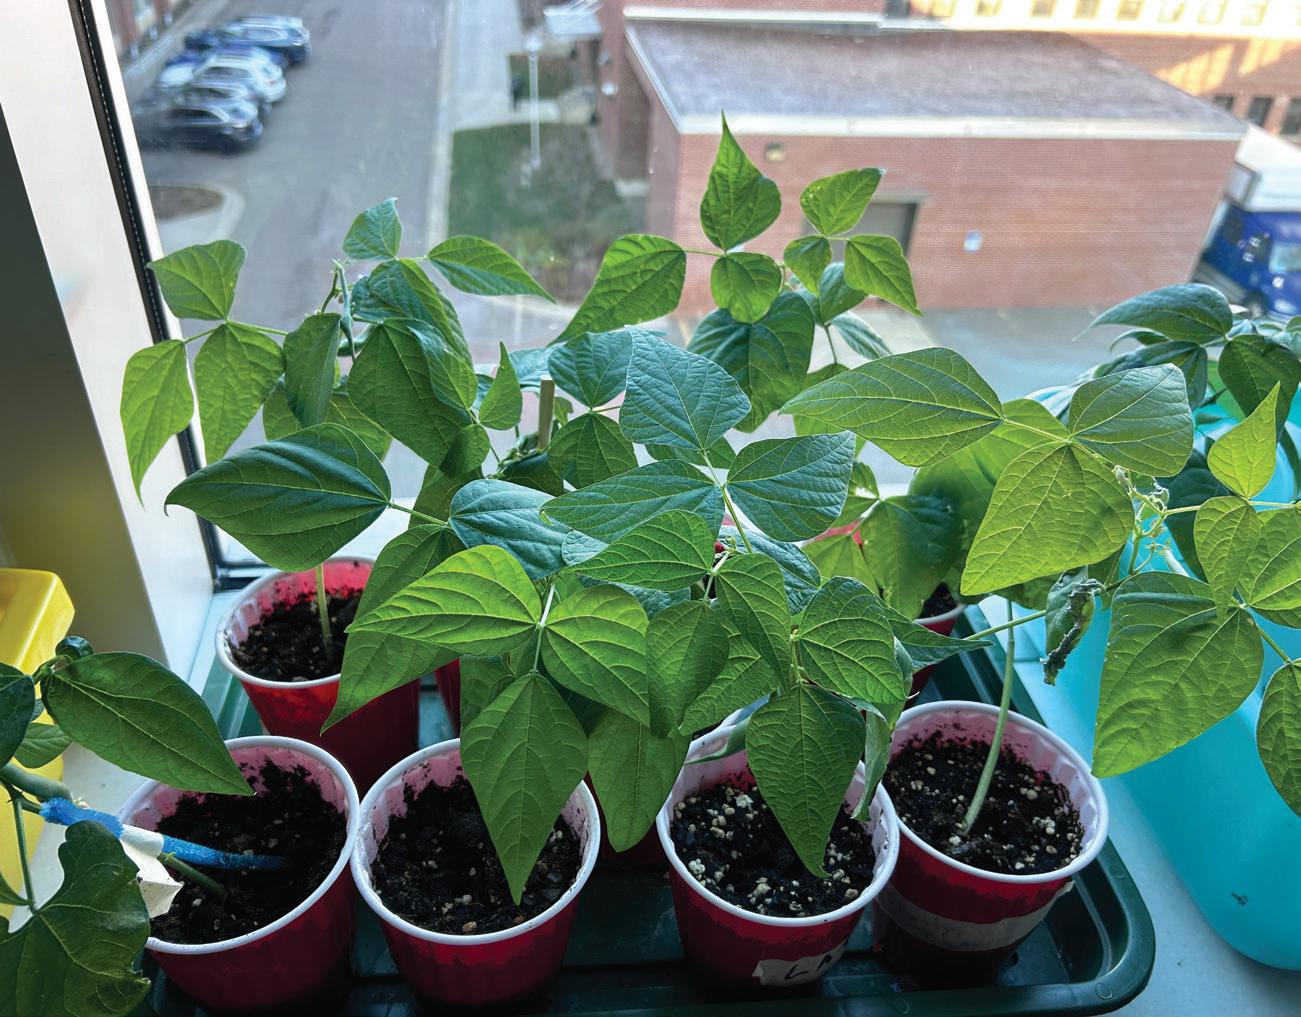
In May 2024, two dozen bean plants sat on a sunny windowsill in our elementary and middle school methods classroom at our university. The seeds were planted at the end of February and, after weeks of care, repotting, and monitoring, were at different stages of growth. Some seedlings had not survived or were slow growing, but most had become thriving bush bean plants with flower blossoms. Three of the plants were even growing long green bean pods, which served as a visual representation of the fruits of our work on an interdisciplinary project connecting science and social studies. This project centered Indigenous history, culture, and sovereignty while also teaching about scientific principles connected to plants, agriculture, and gardening—key ideas we hoped our preservice teachers (PSTs) would be able to use with the young learners in their future classrooms.
The Groundwork
At the start, many of the PSTs in our elementary social studies and science methods courses struggled to see the connections between social studies and science, technology, engineering, and mathematics (STEM). Even though for the first six weeks of the semester, we (the science and social studies methods class professors) focused on the integration of social studies with inquiry, reading, writing, art, movement, and social-emotional learning, PSTs approached the STEM and social studies (STEMSS) topic with a healthy dose of skepticism. As one student wrote in an online discussion post, “I have to admit when integrating social studies and science was first introduced, I was a little bit hesitant and overwhelmed as I didn’t immediately see a connection.”1 For us professors, however, the STEM and social studies possibilities were exciting. We had been talking about bringing our two subjects together in various ways for months, and a
number of factors converged for the spring semester to make a STEMSS collaboration a reality.
Scholars have documented the decreased instructional time on social studies and science in the elementary grades, in favor of adding more time for reading and mathematics, as they are more prioritized and frequently assessed subject areas.2 In our western Wisconsin context, we saw many examples of this in nearby school districts. One local district sets aside thirty-minute blocks of time in the afternoon to alternate between science and social studies lessons. While this science/social studies block can have the potential to limit these subjects, we saw this as a possible opportunity for the two disciplines to enrich each other and began to discuss how we could support our future teachers to bring an interdisciplinary mindset to their classrooms to capture this limited time allotted for both subjects.
The other precursor to this collaboration was grounded in a desire to center the history, current culture, and sovereignty of regional Indigenous Nations, such as the Ojibwe and Dakota. Wisconsin’s state statute known as Wisconsin Act 31 states that a person seeking a teaching license must receive “instruction in the history, culture and tribal sovereignty of the federally recognized American Indian tribes and bands located in this state.”3 Our department, which predominately teaches non-Indigenous, white students, many who come from rural family backgrounds, discussed ways to weave this into all content areas. At the same time, this pedagogical goal merged with our own conversations about gardening, seed saving, and ways we could connect our fields of social studies and science together. As two cisgender, white female faculty members, we wanted to build from the work of Indigenous scholars and communities while also doing the work needed to teach and honor the past, present, and future of the Ojibwe
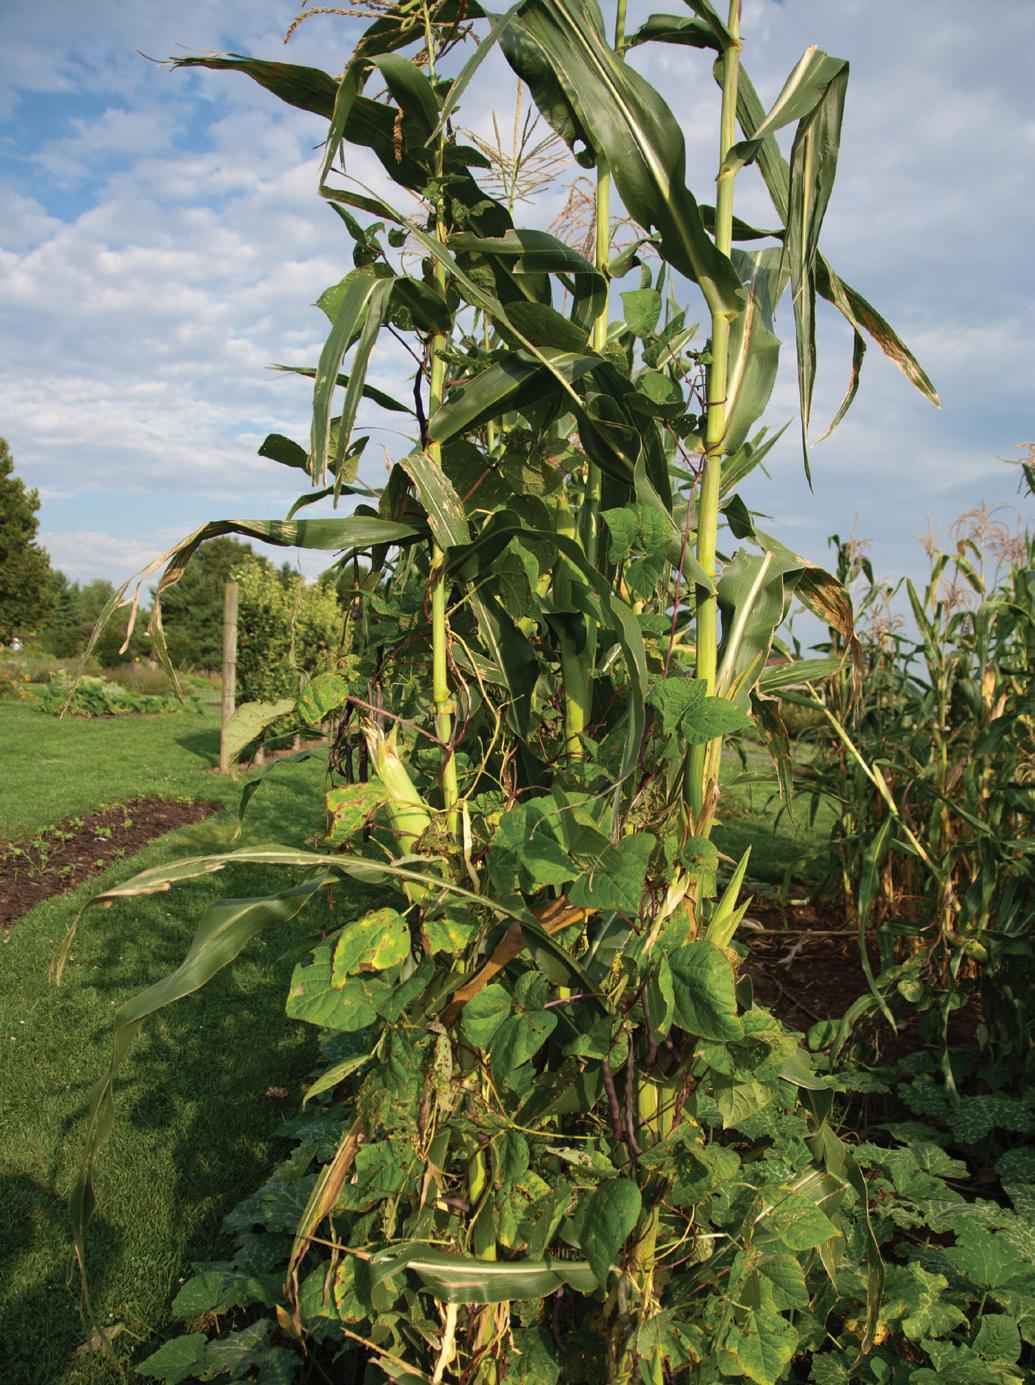
and Dakota Nations—whose sacred and ancestral lands our university now occupies—and respect the sovereignty of the twelve American Indian Nations in Wisconsin.4 Drawing on the work of science education scholars Megan Bang and Douglas Medin, our intention in this project is to commit to the work that honors the diverse ways that people from different cultures, experiences, epistemologies, and values come to know about and explain the natural world in pursuit of science.5 With some prior knowledge about the Three Sisters gardening method (planting beans, squash, and corn together; see Figure 1) and our own desires to learn more seed saving, we saw an entry point for a collaborative STEMSS activity around Indigenous agricultural practices and community.6
A few core ideas from The Turtle Island Social Studies Collective provided the foundation for our initial project. First, we centered key commitments in Indigenous studies such as
rematriating Indigenous homelands, respecting Indigenous sovereignty, restoring systems of Indigenous governance, recognizing and valuing Indigenous leadership, centering diverse Indigenous perspectives and knowledge systems, investing in Indigenous languages, and nourishing place-based, intergenerational forms of learning.7
We emphasized teaching practice that embraced “relationality and mutual obligation” and valued Indigenous knowledges “on their own terms.”8 Finally, we found inspiration in the calls from The Collective to defy “rigid disciplinary boundaries” and “engage in interdisciplinary approaches that may involve literature, land-based, environmental, or science education.”9 And though we felt hesitant still, we were encouraged by the nudge to “embrac[e] the complex messiness of learning alongside our students rather than waiting until we know enough” and embarked on a project that would require “willingness, commitment, reflection, relationships, humility, and accountability.”10
Growing Community: Broadening Perspectives on Political Science and Civics
The launch of the project started in the social studies methods course. The first part of the semester is broken down into the social studies disciplines of history, geography, political science, economics, and behavioral sciences. During the week focused on political science, PSTs examined the related Wisconsin Standards for Social Studies and evaluated the various levels of government and civics embedded in the grades K–9 standards. They observed that political science standards certainly include, but expand beyond, the three branches of government at the federal level, which is what most students associate with the discipline. In addition to the branches of government, elementary-aged students learn about broad ideas of civics related to home, school, community, state, nation, and the world. Importantly, students are also expected to learn about tribal communities, sovereignty, and government. For example, students in grades K–2 are expected to “compare basic political institutions (e.g., what a government is and how it differs at the city, state, tribal, country, and global level), and the roles they serve in their lives and in the lives of others (e.g., make laws, create order).”11 With this idea of a broader definition of civics in mind, the class explored and discussed regional Indigenous tribal examples of community and citizenship. Using a video from PBS Wisconsin’s The Ways series called “Clan Mother,” PSTs examined the ways intergenerational connections could help bring healing to a community and the important role of elders in many tribal communities.12 A video from the Indigenous Seed Keepers Network expanded the definition of relatives beyond people to include plants and animals.13 Using these videos as shared texts, PSTs reflected on and discussed what new ideas of community, civics, and political science these Indigenous examples could bring to teaching about social studies. One PST reflected the following:
One of the big takeaways for me would be generational connection … Learning more about these Indigenous communities has help me realized how essential the past and the future are as well. People
Figure 1. Example of Three Sisters Gardening method, planting beans, squash, and corn together
from the past are just as important and have shaped the community into what it is today. One of your roles in the present is to think about the future. Plan for it and go about your role in the community with the constant thought “How will this affect the future and is it beneficial for them?”14
In addition to these Indigenous stories and examples, we shared our own examples of how gardening connected us to our families, neighbors, and communities. We showed beans we had been given from neighbors and talked about our family histories of gardening and learning how to grow food. We also shared our current engagements with starting a garden and growing food and the connections that are created in the local community. These Indigenous connections to seeds, community, and agriculture and our personal stories helped PSTs think more broadly about the ideas of civics and political science.
Planting Seeds: The Nature of Science and Indigenous Ways of Knowing and Growing
During the science phase of this interdisciplinary project, students began with an activity called “Tricky Tracks” in which PSTs were asked to make either “observations” or “inferences” within a T-Chart (in their classroom Science Notebooks) based on images projected to the class of two different animal tracks that seem to be coming together.15 The activity surfaces how frequently participants tend to slip into making inferences (interpretation of what is seen) as opposed to making observations (statements made from the five senses). For example, instead of describing the images using more objectively descriptive language such as “the markings on the right side of the image have less space between markings,” the PSTs often use descriptions that tell a story more along the lines of “the tracks on the right must be from a smaller bird, as the footprints are closer together.” Highlighting this tendency of the observers, who are trying to be as objective as possible, to tell a story that makes sense of what they are seeing, provides a concrete example of how science is inherently biased, as it is a human-created endeavor. This activity framed a whole-group discussion around the “nature of science” as a subject area that is not free from bias. As scientists, we must continue to center our attention on surfacing our personal blind spots and seek new ways of seeing the story we are creating in our mind when we make seemingly “objective and scientific observations.”
In the next phase of the science lesson, we framed a conversation around interrogating what counts as “science.” A reading from the chapter “Asters and Goldenrods” in Braiding Sweetgrass: Indigenous Wisdom, Scientific Knowledge, and the Teachings of Plants by Robin Wall Kimmerer16 informed our discussion around ways of knowing and valuing different perspectives within the science community. During this
activity, PSTs reflected on the ways in which dominant society would classify the following topics in relation to the concept of “science:” Eastern medicine, Western medicine, astrology, tarot cards, NASA, Indigenous oral traditions, and science textbooks. Through this conversation, we surfaced how European ways of knowing are often centered within the context of science. We then discussed what the implications of this reality are on different communities to feel valued and participate in the process of making sense of the natural world, when science is so narrowly defined. One of our goals was to build off the work of Indigenous scholars to help PSTs not to see Western science in opposition to other ways of knowing but to bring opportunities for reflecting on and valuing the different epistemologies that exist for making sense of the observable world.17
In the final activity for the science portion of this interdisciplinary project, we planted a traditional Indigenous seed, Arikara beans, in CD cases. PSTs made observational drawings in the science notebooks depicting the development process from seed to seedling over the next several weeks and continued to reflect on these ideas about different ways of seeing and knowing in science.
The Harvest: Intertwining STEMSS
After these two key lessons, the remainder of the semester involved intertwining these two disciplines. PSTs routinely monitored, watered, and cared for their plants as they grew in the sunny windows of the classroom. Once the beans sprouted and began growing in the CD cases, PSTs sketched the progress and their observations of the plants in their science notebooks. Once the seedlings were big enough, we transplanted them into larger cups which allowed them to continue to grow. The seedlings became regular parts of our classroom community as we explored various science and social studies standards and practices through the semester.
In our teacher preparation program, PSTs have a fiveweek field placement during the semester. Prior to leaving for their placement, we asked PSTs to research the needs of their seedlings and plan for how they would be cared for while they were away from our classrooms. PSTs could choose to take home the seedlings to care for them, assign them to the teaching faculty to follow their care plans, or stop by the classroom on their own to water the plants. This reflection and plan for care helped bring together the elements of nature and community embedded in this project.
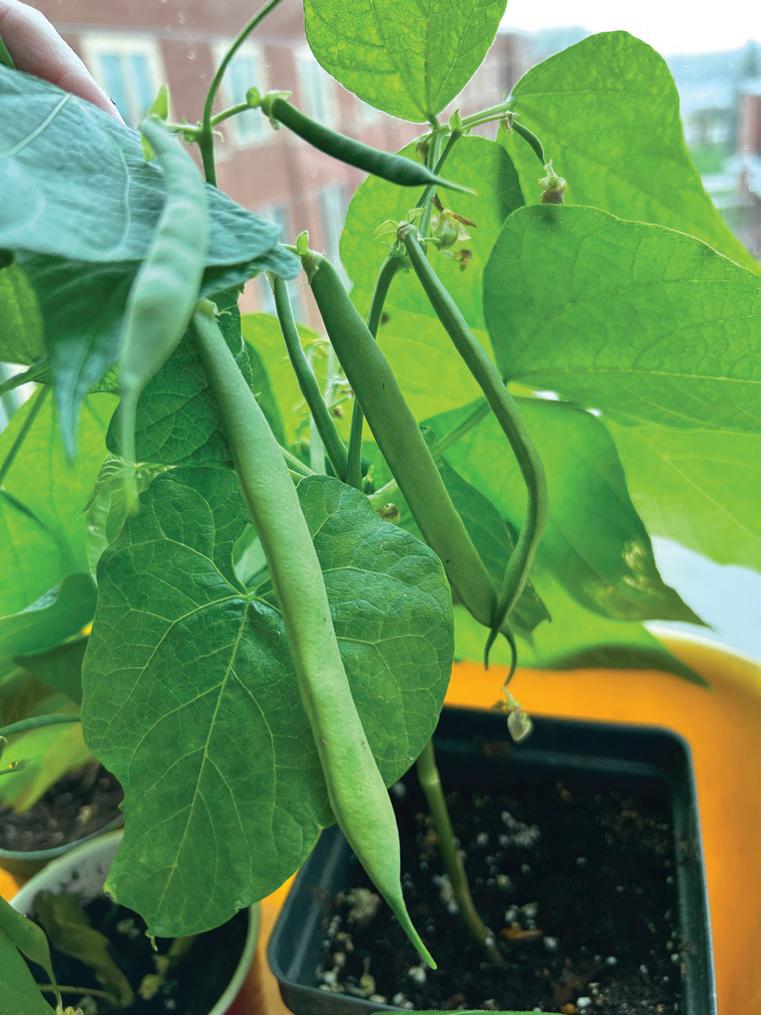
When they returned from their placements, students once again made observations about the status of their seedlings and the growth. At the end of the semester, PSTs researched the next steps for their seedlings, which after about six to eight weeks of growth were maturing bean plants with blossoms and fruit (see Figure 2 and Figure 3). During their research, PSTs learned about how to transplant seedlings to a garden, the type of soil, water, and sun requirements bean plants
needed to thrive, and the process of how to harden off the seedlings before taking indoor plants fully outside. They also once again considered the future of their seedlings connected to our classroom community. They could choose to take their plants home to care for them in their own spaces, share their plants with friends or family, or donate the bean bush to the gardens of faculty in our department. It was important for us to plan for how these plants would be cared for after the classroom project to honor the seeds themselves and the Indigenous Nations who have tended to this crop since time immemorial and specifically the Arikara Nation whose seeds we were growing during this project. This final reflection helped solidify how STEM and social studies could be intertwined in a similar project.
During the last week of the semester, PSTs contemplated the benefits of integrating STEM and social studies. One PST wrote, “It can teach teamwork, collaboration, and helps students understand how social studies can be identified in everyday life. In doing a project like this, it allows for more engaging and interactive material that still fulfills certain standards in a new, fun way.” Another commented, “Integrating science and social studies helps students to learn more about each subject than they would learning about plants and communities separately. Integration also helps students learn more about their own community, communities around the world, and make a real-world connection to community gardens and farm-to-table.”
PSTs also reflected on how they might use a project like this with their own future students. “I might use an activity like this with future students to help teach independent and
dependent variables by changing the types of soil, amounts of sunlight, and amounts of water to compare the bean plant growth at the end of the activity,” considered one future teacher. Another thought, “I might use this activity like this with my future students with learning about the plants around their community. If I were to be in a school where farming is important, we could discuss the community connections with the plants that are farmed. If I was in a city school we could discuss how growing different plants would help the city and why.”
Reseeding: Connected Activities and Next Steps
While we felt like this semester-long interdisciplinary project was successful with our PSTs, there were some changes we would make in revising this project for future cohorts. In reflecting on the “What counts as science?” discussion, there were times when the conversation maintained an undertone of dichotomy positioning each of the topic areas as legitimate science and non-legitimate science. While the purpose of this discussion was to surface that societal framing, in future lessons, we would want to do more to decenter this binary and provide space for imaging new constructs. A final practical change we could make to the science section of this project would be to use clear plastic cups instead of CD cases for growing the beans. While using CD cases allowed students to make clear observations, the seeds were less likely to mature in this environment. In the future, we will use clear plastic cups with seeds placed near the perimeter, as observations are still very easy to make using this method, and the plants
Figure 2. Beans on a maturing bean plant
Figure 3. Group of bean plants
are more likely to survive.
For the social studies portion of the project, we would like to spend more time having PSTs critically reflect on the traditional understandings of political science and civics. We could do this by focusing on their previous experience of learning about government and the typical ways that civics and political science have been taught in the past. We would create an activity that would allow students to use the Wisconsin standards and the examples from Indigenous communities to describe civics more broadly and create a working definition for how they will want to teach political science to their future students. In addition, we would like to build partnerships with local schools and Indigenous
communities that would provide PSTs a chance to see these community gardening and agricultural practices in action. Visiting nearby gardens and farms and talking to people who are living these values would provide examples for PSTs that they could bring to their young learners in their future classrooms.
Finally, we hope to work closely with our PSTs to generate more science and social studies interdisciplinary lessons and projects that can be implemented with their future elementary students. Our goal remains to help PSTs have broader perspectives of both subjects through the inclusion of Indigenous examples of community and relationships to the natural world. These new perspectives will help PSTs and
Proposed STEMSS Project Outline for K–6 Students
NCSS C3 Standards:
D2.Civ.2.3-5. Explain how a democracy relies on people’s responsible participation, and draw implications for how individuals should participate.
D2.Civ.6.3-5. Describe ways in which people benefit from and are challenged by working together, including through government, workplaces, voluntary organizations, and families.
D2.Geo.4.3-5. Explain how culture influences the way people modify and adapt to their environments.
Next Generation Science Standards (NGSS):
5-ESS3-1. Obtain and combine information about ways individual communities use science ideas to protect the Earth’s resources and environment.
ESS3.C. Human activities in agriculture, industry, and everyday life have had major effects on the land, vegetation, streams, ocean, air, and even outer space. But individuals and communities are doing things to help protect Earth’s resources and environments. 5-LS1-1. Support an argument that plants get the materials they need for growth chiefly from air and water.
Activity Ideas:
• Discuss with students the idea of community, who is part of a community, and how communities work together in various ways. Introduce the idea of communities including various generations and nonhuman members such as plants and animals.
• Introduce the idea of the Three Sisters Gardening method. Ask students to consider how the story and the relationships among the plants demonstrate ideas about community.
• The Tricky Tracks resource can be used as a whole group discussion in which students are directed to make observations first (what can be observed directly) and then eventually asking them to make inferences (interpreting what is seen) to describe a set of images. This activity highlights the observer’s tendency to interpret what they are observing as opposed to staying neutral in their observations. This frames a discussion around how the observer can shape what is “seen” in scientific analysis.
• Plant beans to learn about how plants grow and work together to grow and care for these plant members of our community. Spend time sketching, researching, and learning about the science aspects of seeds, seedlings, and plants. Make observational drawings of the plants as they develop in science notebooks to frame learning around what plants need to grow and thrive.
• Visit local community gardens and continue learning about Indigenous Nations who are growing food to learn about the ways they grow their plants and the connections to community and culture.
Resources:
“Clan Mother: Healing the Community | The Ways,” PBS LearningMedia, https://wisconsin.pbslearningmedia.org/resource/clan-mother/the-ways/ Ukwakhwa, “Three Sisters Gardening Planting Beans and Squash,” www.youtube.com/watch?v=rWzFXZK05ZM Rebecca Webster, “When Ancient Wisdom Beats Modern Industry – Rebecca Webster,” TED-Ed, www.youtube.com/watch?v=pFRXY8bV_ug Native American Food Sovereignty Alliance, “Indigenous Seed Keepers Network,” www.youtube.com/watch?v=IooHPLjXi2g Dorothy Warren, Tricky Tracks, https://edu.rsc.org/resources/tricky-tracks-observation-and-inference-in-science-11-14-years/4017168.article
their future students develop practices of relationality and interdependence with other people, the nonhuman world, and even between traditionally siloed disciplines such as social studies and science. Our hope in this work is that teachers broaden their often-narrow definitions of science and social studies to be more inclusive of different ways of knowing and to invite diverse perspectives and experiences into the conversation around learning. Overall, we hope to continue to improve and expand on this STEMSS project each semester as an example for teachers to harness the power of collaboration and interdisciplinary work and provide new perspectives about each discipline by centering Indigenous ways of knowing, history, culture, and sovereignty.
Notes
1. Online discussion post, February 28, 2024.
2. Gahan Bailey, Edward L. Shaw, Jr., and Donna Hollifield, “The Devaluation of Social Studies in the Elementary Grades,” Journal of Social Studies Research 30, no. 2 (2006): 18–29; Marilynne Boyle-Baise, Ming-Chu Hsu, Shaun Johnson, Stephanie Cayot Serriere, and Dorshell Stewart, “Putting Reading First: Teaching Social Studies in Elementary Classrooms,” Theory & Research in Social Education 36, no. 3 (2008): 233–255; Paul G. Fitchett, Tina L. Heafner, and Richard G. Lambert, “Examining Elementary Social Studies Marginalization: A Multilevel Model,” Educational Policy 28, no. 1 (2012): 40–68; Neil O. Houser, “Social Studies on the ‘Backburner:’ Views from the Field,” Theory & Research in Social Education 23 (1995): 147–168; Rolf K. Blank, “Science Instructional Time is Declining in Elementary Schools: What Are the Implications for Student Achievement and Closing the Gap?” Science Education 97, no. 6 (2013): 830–847; Sarah Schwartz, “Social Studies and Science Get Short Shrift in Elementary Schools. Why That Matters,” Education Week, February 27, 2024, www.edweek.org/teaching-learning/socialstudies-and-science-get-short-shrift-in-elementary-schools-why-that-matters/2024/02
3 American Indian Studies in Wisconsin, Wisconsin Act 31, §118.19(8), Wis Stats. Teacher Certificates and Licenses, https://dpi.wi.gov/amind/state-statues.
4. “Tribal Nations of Wisconsin,” Wisconsin Department of Public Instruction, https://dpi.wi.gov/amind/tribalnationswi
5. Megan Bang and Douglas Medin, “Cultural Processes in Science Education: Supporting the Navigation of Multiple Epistemologies,” Science Education 94, no. 6 (2010): 1009.
6. The Three Sisters Gardening Method has been used by numerous Indigenous groups since time immemorial. The resources and videos shared by nonprofit Ukwakhwa (Our Foods), started by Oneida Nation citizens, Steve and Becky Webster has been the basis for teaching preservice teachers about the Three Sisters Gardening Method. Ukwakhwa, www.ukwakhwa. org/
7. The Turtle Island Social Studies Collective, “Insurgence Must Be Red: Connecting Indigenous Studies and Social Studies Education for Anticolonial Praxis,” in Insurgent Social Studies: Scholar-Educators Disrupting Erasure and Marginality, eds. Natasha Hakimali Merchant, Sarah B. Shear, and Wayne Au (Myers Education Press, 2022), 9.
8. The Turtle Island Social Studies Collective, “Insurgence Must Be Red,” 21.
9. The Turtle Island Social Studies Collective, “Insurgence Must Be Red,” 22.
10. The Turtle Island Social Studies Collective, “Insurgence Must Be Red,” 23.
11. See SS. PS2.c.1 in Wisconsin Standards for Social Studies, Wisconsin Department of Public Instruction, 54, https://dpi.wi.gov/social-studies/standards.
12. “Clan Mother: Healing the Community | The Ways,” PBS Learning Media, https://wisconsin.pbslearningmedia.org/resource/clan-mother/the-ways/
13. Native American Food Sovereignty Alliance, “Indigenous Seed Keepers Network,” March 11, 2019, www.youtube.com/watch?v=IooHPLjXi2g
14. Online discussion posts, February, 26, 2024.
15. Dorothy Warren, “Tricky Tracks,” Royal Society of Chemistry, https://edu. rsc.org/resources/tricky-tracks-observation-and-inference-in-science-11-14years/4017168.article
16. Robin Wall Kimmerer, “Asters and Goldenrods,” in Braiding Sweetgrass: Indigenous Wisdom, Scientific Knowledge, and the Teachings of Plants (Milkweed Editions, 2015), 39–47.
17. Megan Bang and Douglas Medin, “Cultural Processes in Science Education: Supporting the Navigation of Multiple Epistemologies,” Science Education 94, no. 6 (2010): 1015.
Brianna Lafoon is an Assistant Professor of Social Studies methods at the University of Wisconsin-Eau Claire. She can be reached at lafoonbr@ uwec.edu
Elizabeth Crotty is an Assistant Professor of STEM Education at the University of Wisconsin-Eau Claire. She can be reached at crottyea@uwec.edu
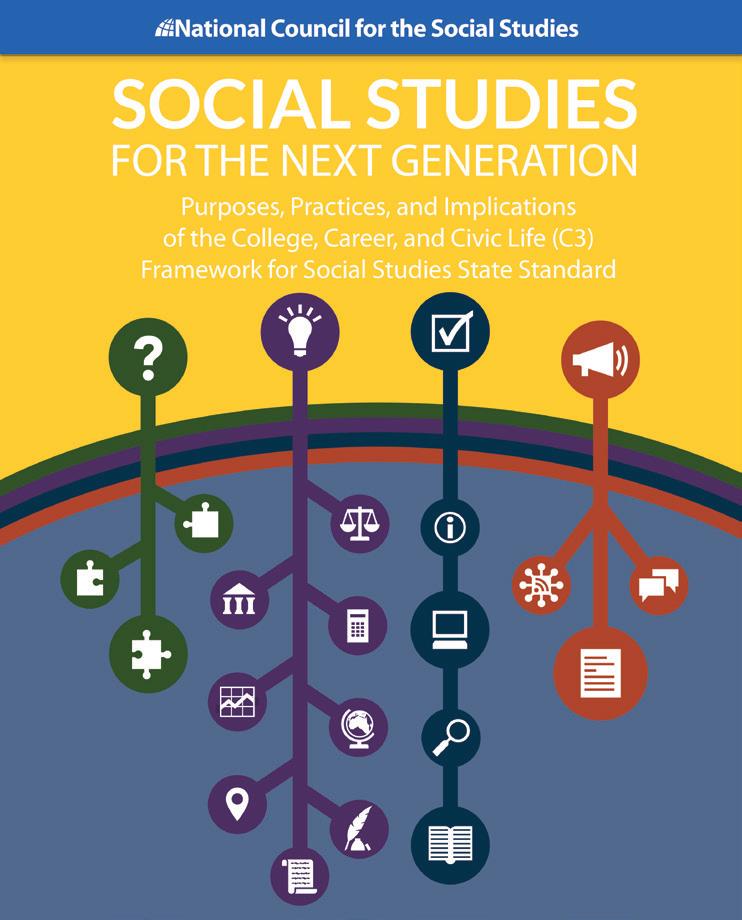
The twenty-seven published articles in this book, drawn primarily from the “Teaching the C3 Framework” columns in Social Education , demonstrate how the ideas of the C3 Framework have made their way into many facets of social studies: standards, curriculum, instruction, assessment, and teacher education. Looking back on a decade of inquiry, Kathy Swan, S. G. Grant, and John Lee invite you to join the celebration of the C3 Framework’s impact on social studies education and to continue blazing the inquiry trail and fueling the revolution.
https://members.socialstudies.org/store
“Dust to Eat, Dust to Breathe, Dust to Drink”: Using Systems Thinking to Uncover the Causes of the Dust Bowl
Michelle Reidel, Ariel Cornett, Erin Piedmont, Kania Greer, Betsy Barrow, and Alex Reyes
By some estimates, over 1.2 billion tons of soil was blown across the Great Plains during the height of the Dust Bowl. The so-called “black blizzards” these massive dust storms caused suffocated cattle, sickened children, and destroyed thousands of family farms. Formerly prosperous farmers, unsure why they had such bad luck, wondered if the drought was a direct punishment for their sins. The causes of the Dust Bowl, however, were much more complicated than the personal failings of hard-working farm families or the unpredictability of Mother Nature.
Messy, complex historical events like the Dust Bowl and contemporary challenges like climate change frequently occur at the intersection of natural and human-made systems. Socioscientific issues (SSIs) like the Dust Bowl require citizens to understand the interrelatedness of these systems to make informed choices that impact daily life and have long-term consequences. However, we frequently teach young people about the world through artificially separated subjects. This approach not only contributes to the continued marginalization of social studies and science at the elementary level, but it is also poor preparation for the complex social, economic, and environmental challenges we face. Developing the “big picture” or holistic thinking needed to understand historical events like the Dust Bowl and to address current challenges requires an interdisciplinary and problem-based approach to curriculum that can help students develop the critical thinking skills needed to tackle difficult issues.
In this article, we propose using systems thinking , a concept featured in the Next Generation Science Standards,1 to facilitate the integration of social studies and science and help students develop this “big picture” thinking. A problem-solving process that examines relationships and draws attention to different viewpoints, systems thinking provides students with “a holistic view of knowledge and learning.”2 By focusing on the “interrelated and interdependent networks”3 that comprise our world, systems thinking provides a powerful framework for the design and implementation of interdisciplinary curriculum. Using the Dust Bowl as an example, we illustrate how systems thinking can be coupled with the Inquiry Design Model4 to engage students in a critical examination of significant historical and contemporary issues.
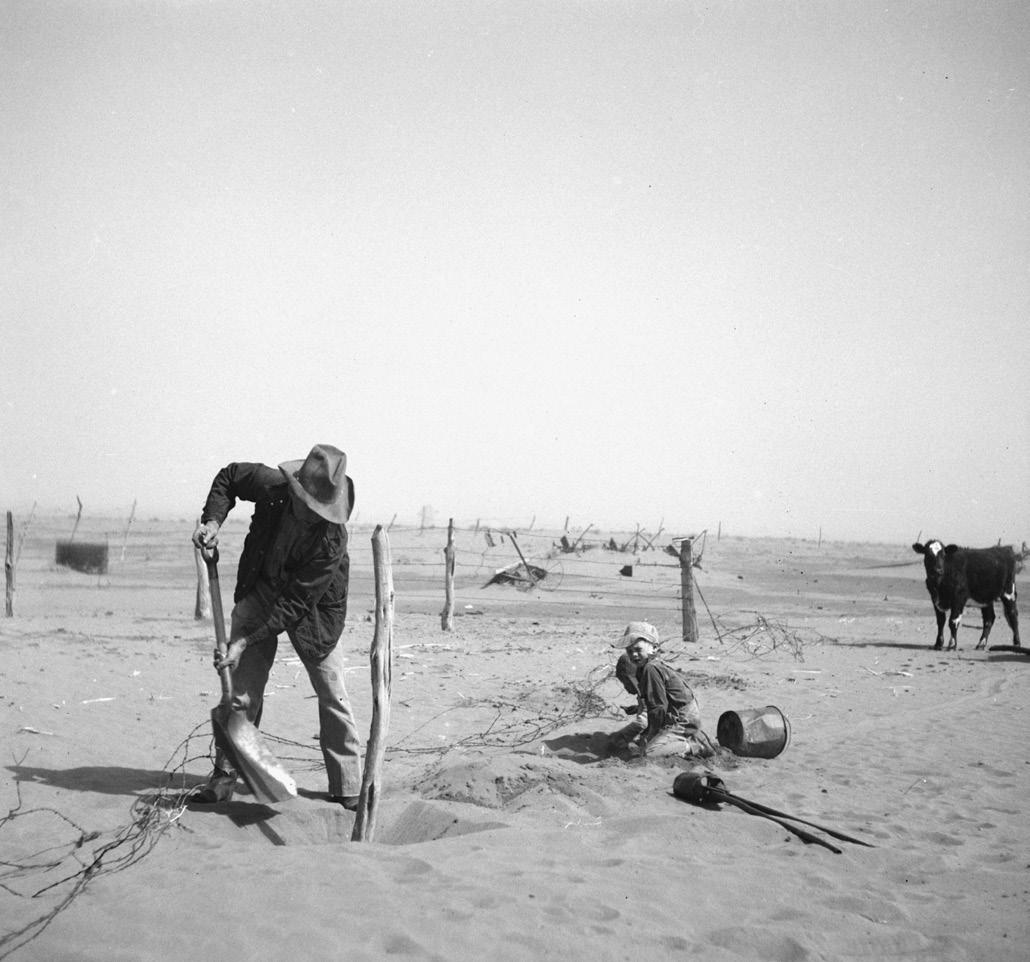
Figure 1. Historical image for Staging the Compelling Question from Dust Bowl Farmer Raising Fence to Keep it from Being Buried Under Drifting Sand, by Arthur Rothstein, April 1936, Library of Congress, www.loc.gov/ item/2017760334/
What Is Systems Thinking?
Systems are all around us. Oceans, classrooms, farms, and governments are all systems, each operating by its own rules and each part of a broader, interconnected whole. We live our lives enmeshed in a series of interconnected social, economic, and ecological systems; yet we are often unaware of how these systems work, how they intersect, and how we might act to change them.
Systems thinking is a “transdisciplinary view of life that centers on relationships, patterns, connectedness, and context.”5 Both a mindset and a set of tools, systems thinking heightens our awareness of the systems around us, enables us to see the interrelationships between these systems and use this knowledge to take action.6 System thinkers are “big picture thinkers” who seek to understand how natural and humanmade systems are interrelated as well as the short-term, longterm, and unintended consequences of their actions.7
Research demonstrates that students of all ages can be taught to engage in systems thinking when provided with explicit, scaffolded guidance.8 Using systems thinking tools like flowcharts and behavior over time graphs, elementary students investigated causes and solutions to a statewide drought and critically examined the relationship between historical and modern-day enslavement.9 This research suggests that sharing and using the tools of systems thinking— from simple concept maps to complex computer simulations— is an effective way to introduce students to the framework and help them begin to unpack the complicated relationships underlying complex historical and contemporary issues.10 We focus exclusively on one systems thinking tool—the Iceberg Model—to illustrate how systems thinking can be used to design interdisciplinary, inquiry-based learning opportunities and to engage students in examination of complex SSIs. By using systems thinking and, more specifically, the Iceberg Model, students will recognize that the Dust Bowl was not a series of isolated events but the product of an interconnected web of actions and reactions within and across human-made and natural systems.11
The Iceberg Model
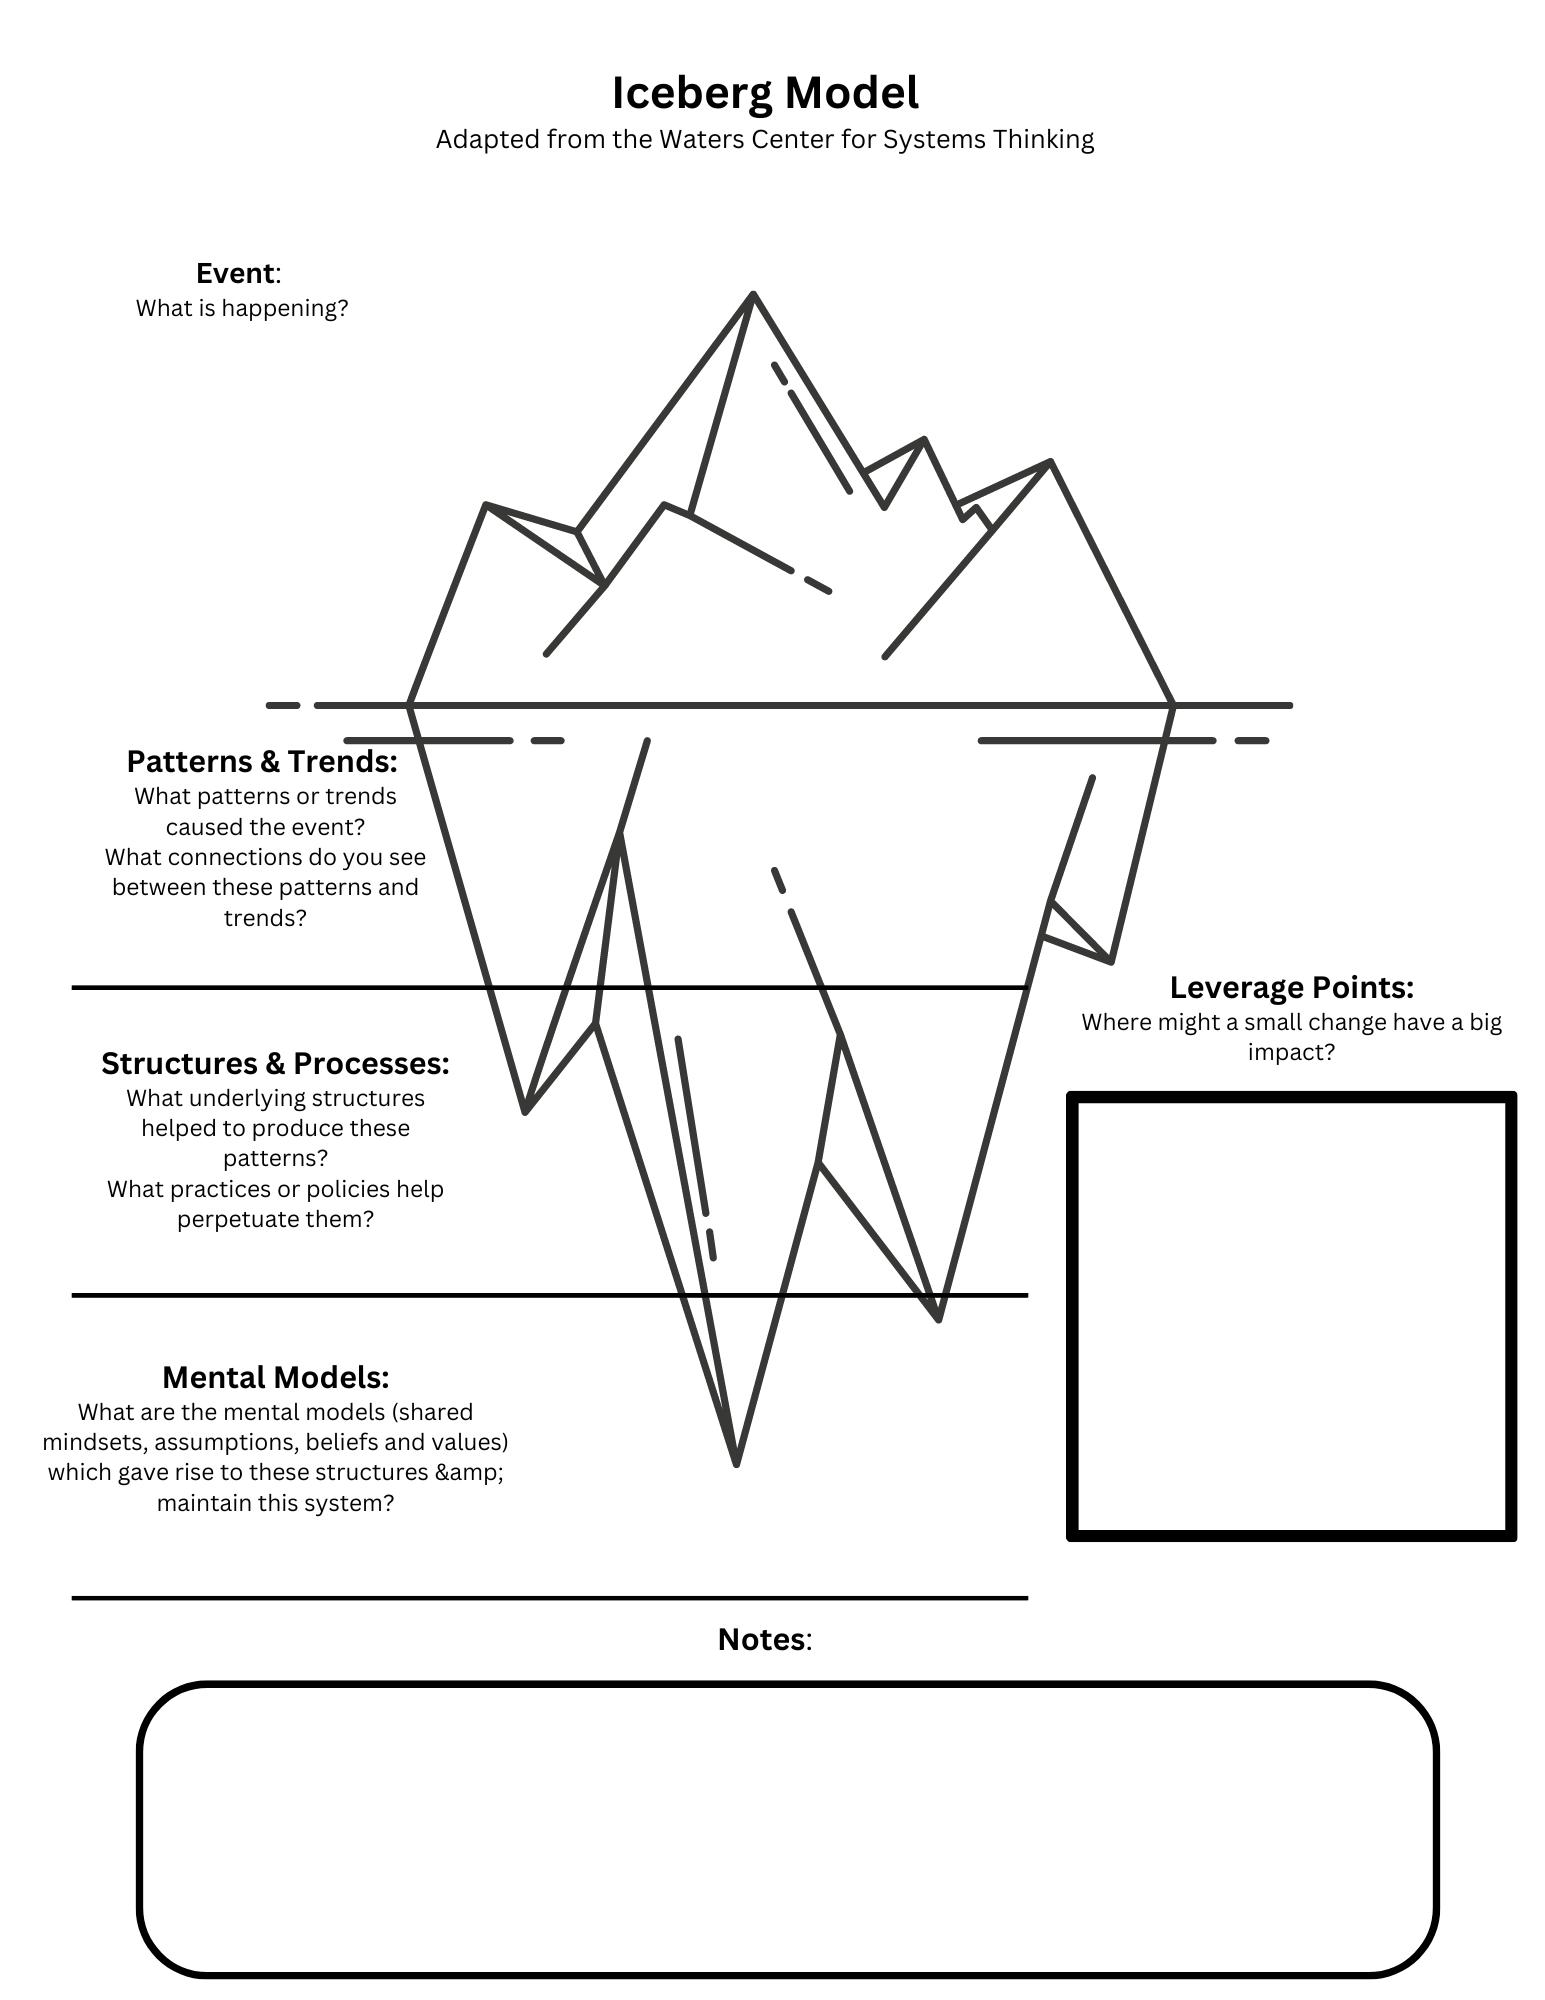
The Iceberg Model (see Figure 2) is a systems thinking tool that can help us better understand why things happen and how we might act to make change. Designed to uncover underlying causes and relationships, the Iceberg Model illustrates how what we see is only a small portion of what we need to know to make sense of the world around us. By moving from top to bottom through the four layers of the model, we develop a clearer picture of the patterns, structures, and beliefs that contribute to a specific event, problem, or issue. The top two layers of the model focus on what is happening, and the bottom two focus on why it is happening. More specifically, the first layer of the model, or the tip of the iceberg, focuses on what is immediately observable, while the second layer
draws attention to recurring patterns or trends. The third layer asks students to identify human-made and natural systems that contributed to or created these recurring patterns, and the final layer draws attention to the beliefs, assumptions, and values that inform these systems. We utilized the Iceberg Model to identify the underlying causes of the Dust Bowl and design the Dust Bowl IDM (see Figure 3).
2. The Iceberg Model, adapted from the Waters Center for Systems Thinking. https://waterscenterst.org/
The Dust Bowl Inquiry
There are a number of social studies and science concepts students might explore as they examine the causes of the Dust Bowl, including supply and demand, agricultural practices, weather patterns, and ecology. Given the time constraints educators face, this IDM focuses primarily on how beliefs about land use, government policies, and the science of soil erosion and stability intersected to create the Dust Bowl. This focus can help students gain insight into the importance of sustainable agriculture and the ways lessons from the past can help prevent similar ecological disasters in the future.
As students progress through the unit, they collaboratively build an Iceberg Model of the Dust Bowl with scaffolding from the teacher. The supporting questions of the inquiry align with the layers of the Iceberg Model and provide a
Figure
Figure 3.
Standards and Practices
Staging the Question
What were the underlying causes of the Dust Bowl, and how can understanding them help us prevent similar environmental disasters today?
C3 Framework
D2.His.10.3-5. Compare information provided by different historical sources about the past.
D2.His.14.3-5. Explain probable causes and effects of events and developments.
D2.His.16.3-5. Use evidence to develop a claim about the past.
Next Generation Science Standards
LS2.A. Interdependent relationships in ecosystems.
LS2.D. Social interactions and group behavior.
5-LS2-1. Systems and Systems Models. A system can be described in terms of its components and their interactions.
Systems and System Models
Students will be shown a historical photograph of a farm from the Dust Bowl and complete a See, Think, Wonder task. After discussing their ideas, the class will view and discuss three short videos to introduce the compelling question.
Slicing Up the Earth’s Land Resources by NationalAITC on YouTube
Grasslands Ecosystem by The Wild Report on YouTube
The Dust Bowl: Introduction from Ken Burns on PBS
Supporting Question 1 (Patterns)
How did the Great Plains’ population distribution and farming practices change before the Dust Bowl?
Supporting Question 2 (Systems & Structures)
What role did government policies play in changing the population and ecosystem of the Great Plains?
Create an annotated illustration to depict changes in the Great Plains Region.
Featured Sources
Source Set A:
• “Population and Environment in the U.S. Great Plains” (chapter; https://nap. nationalacademies.org/read/11439/ chapter/7)
• American Panorama: Land Acquisition & Dispossession, Mapping the Homestead Act 1863–1912 (https:// dsl.richmond.edu/panorama/ homesteading/)
Write a paragraph explaining how land policies contributed to population changes in the Great Plains and how these changes impacted soil health in the region.
Supporting Question 3 (Mental Models)
How did the beliefs about land use and economic opportunity influence the systems and policies that affected the Great Plains before the Dust Bowl?
Complete a 3-2-1 task.
• 3 beliefs about land
• 2 connections between these beliefs and land policies
• 1 question
Featured Sources Featured Sources
Source Set B:
• Homestead Act of 1862 (https://www.docsteach.org/ documents/document/homestead-act)
• Enlarged Homestead Act of 1909 (https://maint.loc.gov/law/ help/statutes-at-large/60th-congress/session-2/c60s2ch160. pdf )
• Boom Time from Ken Burns’s The Dust Bowl
• U.S. Industrialization and the Buffalo (https://gpb. pbslearningmedia.org/resource/buffalo-policy-plainsinquiry-design-gallery/video-gallery-the-american-buffalo/ kenburnsclassroom/), from Ken Burns’s The American Buffalo
Source Set C:
• Soil Activity (https://agclassroom.org/matrix/lesson/378/) from National Agriculture in the Classroom
• Soil Health Lessons in a Minute (https://www.youtube.com/ watch?v=Rpl09XP_f-w) from National Resources Conservation Service
Source Set D:
• American Progress (https://www.loc. gov/resource/ppmsca.09855/) (1873) painting
• Across the Continent (https://www. nga.gov/collection/art-objectpage.66574.html) (1868) painting
• Westward the Course of Empire Takes Its Way (https://www.aoc. gov/explore-capitol-campus/art/ westward-course-empire-takes-itsway) (1862) mural, Capitol Building
ARGUMENT What were the underlying causes of the Dust Bowl, and how can understanding them help us prevent similar environmental disasters today? Create a Warning Notice Infographic identifying similarities between the current environmental issue and the Dust Bowl, focusing both on human and natural causes and actions individuals, communities and governments can take to avoid another dust bowl.
EXTENSION Examine the origins of the conservation movement and specific actions taken in the early 20th century to try to avert disasters like the Dust Bowl. Taking Informed Action
UNDERSTAND Students will investigate region/community/state agricultural practices that limit erosion. Resource: Teachers read the book Erosion: How Hugh Bennett Saved America’s Soil and Ended the Dust Bowl
ASSESS Students will create a timeline showing how the Soil Conservation Act to the development of the National Resources Conservation Service (www.politico.com/story/2017/04/27/fdr-signs-soil-conservation-act-april-27-1935-237538).
ACT Students will investigate land recommended for a new development in their state and consider the environmental impacts of building there.
framework for how students move through the inquiry. Concepts, sources, and skills from social studies and science are integrated throughout the unit as students investigate each supporting question. Connecting science concepts to historical events can help students develop a deeper appreciation of the interconnectedness of human societies and the natural world. The Dust Bowl IDM is designed for use with fourth- and/or fifth-grade students. Though there are a number of extension activities teachers may choose to incorporate into this unit, the Dust Bowl IDM includes five lessons that can be taught across one week
Staging the Compelling Question
The inquiry opens with students examining a historical photograph of a farmer trying to work in the midst of the Dust Bowl (see Figure 1) and completing a See, Think, Wonder chart.12 Students then view a series of video clips introducing science concepts connected to the Dust Bowl. The first video focuses on the amount of arable land in the world, the second is about the ecosystem of the Great Plains, and the third video is the introduction to Ken Burns’s The Dust Bowl series.13 After each video, students revisit their See, Think, Wonder charts, adding new ideas and insights. Teachers will use a whole-class discussion to introduce the compelling question and the Iceberg Model. Working collaboratively and with teacher scaffolding, students create an Iceberg Model anchor chart as a shared graphic organizer for recording findings and key ideas after investigating each supporting question. Students have individual copies of the iceberg graphic organizer for their own notetaking.
Supporting Question One
The first supporting question (SQ1) aligns with the “patterns” layer of the Iceberg Model and focuses on change over time—a fundamental concept in social studies and science. Students examine sources to identify how the region’s population changed over time and how the increased population changed the land. Working with a partner, students examine a graph, an interactive map, and a short article to identify and document demographic and land use patterns on the Great Plains between 1860 and 1930. As pairs examine each source, they record their findings on their iceberg graphic organizer. By analyzing the graph, students can identify broad patterns related to population growth and land use.
The interactive map from American Panorama: Atlas of United States History14 will enable students to dig deeper into these patterns. A rich source providing a visual history of population changes in the Great Plains, this map tells a compelling story about homesteading and the dispossession of Indigenous nations and peoples. Questions to guide students’ exploration of this map might include the following: (1) How did the distribution of homesteading change over time? (2) Which territories were inhabited by Indigenous peoples
before homesteading began? and (3) How did the process of homesteading impact the Indigenous peoples, territories, or nations? The final source is an excerpt from an online textbook that provides a rich description of homesteading and the rapid proliferation of farms in the Great Plains region. Having examined each source, the class reconvenes to share their findings as the teacher adds new information to the second layer of the class Iceberg Model. Students will also record key findings on their iceberg graphic organizer. The formative task for this supporting question asks students to create an annotated illustration that depicts the change over time in the Great Plains.
Supporting Question Two
After students have developed an understanding of what was happening in the Great Plains region prior to the Dust Bowl, they are ready to explore why these changes occurred. This portion of the inquiry focuses on the underlying structures or systems that helped produce the patterns students identified as they investigated SQ1. There are several different humanmade and natural systems that could be included in an inquiry on the causes of the Dust Bowl—economic pressures, government policies, technological advances, and agricultural practices as well as climate and weather patterns, soil stability, and grassland ecosystem. Supporting Question 2 focuses specifically on government policies and soil stability.
To build on students’ introduction to the grasslands ecosystem from the first lesson, students complete an activity to learn about the importance of soil and soil stability. “What’s in Soil?” from National Agriculture in the Classroom15 provides hands-on learning activities that help students understand the importance of soil and its components. Students closely examine soil samples and investigate why air and water are the two most variable components of soil. Students then watch a short video from the National Resources Conservation Service that illustrates how agriculture impacts soil stability. Before shifting their focus to government policy, students summarize what they have learned about the importance of soil health and soil stability, recording their findings on their iceberg graphic organizer.
For the second component, students will learn about government policies that facilitated the rapid settlement of the Great Plains region and the equally rapid loss of homeland by Indigenous nations. Students read excerpts from the Homestead Act, the Dawes Act, and the Enlarged Homestead Act of 1909. Questions to support the reading and analysis of these primary sources might include the following: (1) What was the primary purpose of the Homestead Act? The Dawes Act? The Enlarged Homestead Act? (2) How did the Dawes Act differ from the Homestead Act’s approach to land distribution? and (3) What impact did the Homestead Act and the Enlarged Homestead Act have on land distribution and settlement patterns? Students can revisit the interactive map
from American Panorama to visualize the changes wrought by these land policies. Before examining this section’s final source(s), students should record their findings on their Iceberg Model graphic organizer.
Video clips from Ken Burns’s documentaries The Dust Bowl and The American Buffalo are the final sources in this section.16 We highly recommend elementary educators view the Dust Bowl documentary in its entirety prior to teaching this IDM. For the purposes of this inquiry, students view one clip from The Dust Bowl and one from The American Buffalo to identify how speculation and widespread slaughter of buffalo contributed to ecological disaster in the 1930s. Questions to support the viewing of these video clips might include the following: (1) How did speculation influence settlement in the Great Plains? and (2) How did economic interests drive the exploitation of the American buffalo? After the class views and discusses the video clips, the teacher adds new information to the Iceberg Model graphic organizer while students record their findings on their graphic organizer. Students write a paragraph explaining how land policies contributed to population changes in the Great Plains and how these changes impacted soil health in the region as the formative task for SQ2.
Supporting Question Three
The final supporting question (SQ3) aligns with the Mental Models layer of the Iceberg Model and focuses on beliefs and value systems. Students examine three nineteenth-century paintings to explore beliefs about land use that contributed to the Dust Bowl. Students break into home groups to complete a jigsaw activity, with each group focusing on one of the three paintings. Questions to guide students’ examination of each painting include the following: (1) What do you notice about people and the landscape in this painting? Who is represented? Who is missing? (2) What economic activities are depicted in the painting, and what do these suggest about people’s values and priorities? and (3) What message does the depiction of the landscape, people, and economic activities convey?
After examining their paintings, students regroup into expert groups with one representative from each home group sharing their painting analysis.17 The teacher reconvenes the class to summarize what the paintings revealed about prevailing beliefs related to land. The teacher adds new information to the class Iceberg Model graphic organizer while students record their findings on their graphic organizer. The formative task for SQ3 is a 3-2-1 activity to summarize prevailing beliefs and identify connections between these beliefs and land policies.
Summative Performance Task and Taking
Informed Action
Before completing the Summative Performance Task, students
work with a partner to review and discuss the completed Iceberg Model. Questions to guide this discussion include the following: (1) What recurring patterns do we see? (2) What structures or systems are influencing those patterns? and (3) What beliefs and assumptions influenced these structures or systems? After this paired discussion, the teacher reconvenes the whole class to discuss the compelling question: “What were the underlying causes of the Dust Bowl, and how can understanding them help us prevent similar environmental disasters today?” The teacher should also prompt students to identify alternative actions or policies that may have prevented or lessened the effects of the Dust Bowl.
Using insights from this discussion, students create a “Warning Notice” infographic that provides guidance on avoiding similar environmental disasters in the future. Working with a partner, students create a list of key underlying causes of the Dust Bowl, including natural and human factors. Next, partners select a region of the U.S. or the world (from a list curated by the teacher) facing soil instability due to drought and/or unsustainable agricultural practices. This region will be the focus for their “Warning Notice.” Partners create an infographic that highlights similarities between the current environmental issue and the Dust Bowl, focusing both on human and natural causes. The infographic should also include at least two actionable steps individuals, communities, and governments can take to mitigate the damages caused by unsustainable agricultural practices and/or drought.
Conclusion
This Dust Bowl IDM exemplifies how a systems thinking framework can be a powerful tool for interdisciplinary learning, encouraging students to see connections and relationships between different subjects and fostering a holistic understanding of complex issues. The Iceberg Model helps students look beneath the surface to investigate how environmental factors, like soil erosion and climate, interact with human activities, like government policies and farming practices. This process allows students to identify leverage points—moments in time and place when small, strategic actions could have altered the outcome. We hope our example prompts elementary educators to imagine how they might leverage systems thinking to design instruction that integrates effectively and meaningfully social studies and science.
Notes
1. Next Generation Science Standards, www.nextgenscience.org/.
2. Margaret Sauceda Curwen, Amy Ardell, and Laurie MacGillivray, “Hopeful Discourse: Elementary Children’s Activist Responses to Modern-Day Slavery Ground in Systems Thinking,” Literacy Research: Theory, Method and Practice 68, no. 1 (2019): 141, https://doi.org/10.1177/2381336919870284
3. Margaret Sauceda Curwen, Amy Ardell, Laurie MacGillivray, and Rachel Lambert, “Systems Thinking in a Second Grade Curriculum: Students Engaged to Address a Statewide Drought,” Frontiers in Education 3, no. 9 (2018): 2, https://doi.org/10.3389/feduc.2018.00090
4. “The Inquiry Design Model,” C3 Teachers, https://c3teachers.org/idm/
5. Gretchen S. Goode and Laurie MacGillivray, “The Construction of Systems
Thinking Pedagogy During a Professional Development Institute,” Journal of Pedagogical Research 7, no.4 (2023): 275, https://doi.org/10.33902/ JPR.202318879
6. Curwen et al., “Systems Thinking”; Peter M. Senge, Nelda CambronMcCabe, Timothy Lucas, Bryan Smith, and Janis Dutton, Schools that Learn: The Fifth Discipline for Parents, Educators and Everyone Who Cares About Education (Knopf Doubleday, 2000).
7. Curwen et. al., “Systems Thinking”; Senge et al., Schools that Learn; Waters Center for Systems Thinking, https://waterscenterst.org/
8. Curwen et al., “Systems Thinking”; Diana M. Fisher and Systems Thinking Association, “Systems Thinking Activities Used in K–12 Group for Up to Two Decades,” Frontiers in Education 8 (2023), https://doi.org/10.3389/ feduc.2023.1059733
10. Fisher and Systems Thinking Association, “Systems Thinking Activities.”
11. To learn more about systems thinking and various systems thinking tools, we recommend teachers visit The Waters Center for Systems Thinking (https://waterscenterst.org/).
12. For more information on the See, Think, Wonder method, visit Thinking Pathwayz at https://thinkingpathwayz.weebly.com/seethinkwonder.html
14. American Panorama: An Atlas of United States History, https://dsl.richmond. edu/panorama/.
15. Debra Spielmaker, “What’s in Soil?” National Agriculture in the Classroom, https://agclassroom.org/matrix/lesson/378/
16. Burns’s series is an invaluable resource for educators, and PBS Learning Media’s “Ken Burns in the Classroom” website provides teachers with selected clips that can be easily integrated into existing lessons. See https:// gpb.pbslearningmedia.org/collection/kenburnsclassroom/home/
17. For more information on the Jigsaw method, visit Reading Rockets at www. readingrockets.org/contentfinder?search=jigsaw
Summer
Virtual Conference
Participants will:
Michelle Reidel, Ph.D., is a Professor of Secondary Social Studies Education at Georgia Southern University. She can be reached at mreidel@ georgiasouthern.edu
Ariel Cornett, Ph.D., is an Assistant Professor of Elementary Social Studies Education at Georgia Southern University. She can be reached at kcornett@ georgiasouthern.edu
Erin Piedmont, Ph.D., is an Assistant Professor of Elementary Social Studies Education at Georgia Southern University. She can be reached at epiedmont@georgiasouthern.edu.
Kania Greer, Ed.D., is a Research Liaison at Kennesaw State University. She is the former Coordinator for STEM Education at Georgia Southern University. She can be reached at kgreer18@kennesaw.edu
Betsy Barrow, Ed.D., is an Associate Professor of Secondary Social Studies Education at Georgia Southern University. She can be reached at ebarrow@ georgiasouthern.edu
Alex Reyes, Ph.D., is an Associate Professor of Teaching Culturally and Linguistically Diverse Students (TCLD) at Georgia Southern University. She can be reached at areyes@georgiasouthern.edu
Wednesday, June 25 Thursday, June 26, 2025
The Power of Civil Discourse: Fostering Empathy and Understanding in the Classroom
The National Council for the Social Studies invites educators to the third annual Virtual Summer Conference. This year's conference will explore diverse perspectives within the classroom.
◆ LEARN and practice effective strategies for guiding students in active listening, empathetic communication, and respectful disagreement that allows for civil dialogue to thrive.
◆ EXPLORE how to incorporate diverse narratives and perspectives into classroom deliberations to challenge biases and promote understanding.
◆ EXAMINE the role of technology and digital tools in facilitating meaningful and inclusive student engagement.
◆ GAIN valuable insights from experienced educators and researchers on the importance of civil discourse in cultivating informed and engaged citizens.
◆ NETWORK with colleagues and share best practices for fostering a culture of respect and understanding in the classroom.
Register here using the camera on your smartphone
https://www.socialstudies.org/svc2025
Social Studies + Mathematics: Using a Slow Reveal Graph to Explore Black Members of Congress in U.S. History
Abigail Stebbins and Amy Brass
When teaching the Civil Rights Movement in elementary classrooms, heroic figures such as Rosa Parks and Martin Luther King Jr. tend to dominate the curricular landscape.1 While it is essential for students to learn about their contributions and struggles, it is equally important to frame the broader injustices they were combating. In this article, we share one avenue for contextualizing the Civil Rights Movement in upper elementary classrooms using a pedagogical strategy that integrates mathematics and social studies—slow reveal graphs.
Although often overlooked, the ability to read and interpret graphs is increasingly essential in social studies education. This includes teaching students to discern credible data, interpret numeric information through the lens of citizenship,2 and critically analyze data visualizations by asking questions about what information is included and excluded.3 By integrating mathematics with social studies education, students are better prepared to engage with and understand the complexities of the world, make informed decisions, and contribute to their communities as citizens. Slow reveal graphs offer one avenue to achieve these healthy integrative goals and purposefully teach more social studies throughout the school day.4 In this article, we explore how to leverage a slow reveal graph to inquire into historical data about Black members of Congress in U.S. History in relation to the Civil Rights Movement.
What is a Slow Reveal Graph?
To explicitly integrate social studies and mathematics in ways that create a healthy integration, we encourage students to interrogate historical injustices through slow reveal graphs. Slow reveal graphs promote reasoning about data through visual scaffolds and discussion as key features of a graph are slowly revealed.5 At first, students see only the shape of the graph without the title, labels, numbers, or keys. The teacher reveals the different aspects of the graph (e.g., title, labels) one at a time while engaging students in discussion that focuses on how the revealed information adds to their understanding of the graph and its context. During the discussion, the teacher asks students to make connections
across aspects of the graph and to make predictions as the graph becomes fully formed. This process supports students as they reason about the data represented in the graph and the context of the graph. The slow reveal graph discussion helps students to engage in the three components of graph comprehension: reading information directly displayed in the graph, making comparisons and finding relationships between the information displayed in the graph, and making predictions and identifying trends to extend the information displayed in the graph.6 As such, this process helps students gain a better understanding of the graphs they experience in social studies classes.7
By using data that highlight historical injustices as the basis for slow reveal graphs, teachers can engage students in meaningful learning about social studies and mathematics, encouraging them to question historical injustices in new ways. Specifically, the slow reveal graph we present here focuses on the number of Black Congress members. This slow reveal graph supports students in their historical thinking and chronological reasoning and aligns with the NCSS Theme of TIME, CONTINUITY, AND CHANGE . The students’ engagement with this slow reveal graph creates an environment in which they use mathematical knowledge and practices in conjunction with social studies knowledge and practices to wrestle “with issues of causality, connections, significance, and context with the goal of developing credible explanations of historical events and developments based on reasoned interpretation of evidence.”8 Table 1 provides the social studies and mathematics content and standards that align with this slow reveal graph from the NCSS Themes, C3 Framework, and the National Council of Teachers of Mathematics (NCTM).9
Example of a Slow Reveal Graph—Black Members of Congress in U.S. History
In this article, we share one specific example of a slow reveal graph related to Black members of Congress in U.S. History and designed for upper elementary classrooms (grades 3–5). After outlining the historical context of this specific slow
continued on page P4
PULLOUT
See “Social Studies + Mathematics: Using a Slow Reveal Graph to Explore Black Members of Congress in U.S. History” by Abigail Stebbins and Amy Brass in this issue.
Figure 1. Slide 1 of the Slow Reveal Graph (Introduction)
What do you notice?
What do you wonder?
Figure 2. Slide 2 of the Slow Reveal Graph (Revealing the x-axis)
What new information did we just learn?
Does it change your thinking about this graph? Why or why not?
What patterns are you seeing within the graph? What might explain those patterns?
What might this graph be about? Explain your thinking.
How does the shape of the graph at particular years support your prediction?
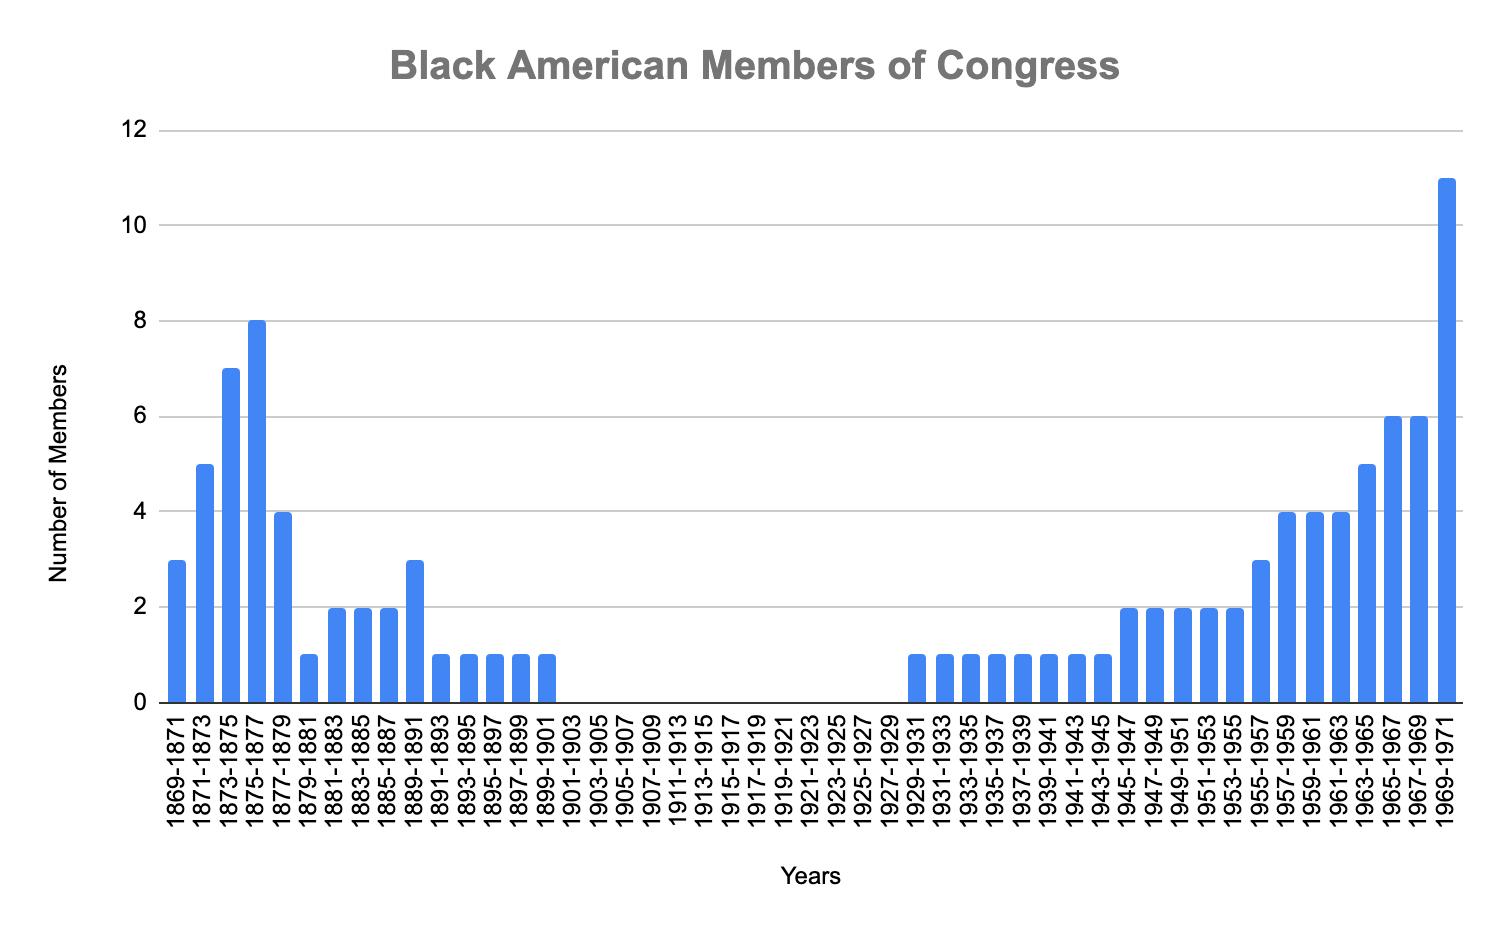
Black Members of Congress
Figure 3. Slide 3 of the Slow Reveal Graph (Revealing the Title)
What new information did we just learn?
Does it change your thinking about this graph? Why or why not?
Why does it make sense that the years are in groups of two?
What number do you predict for the largest number of Black Congress members shown on the graph (1969-1971)? Explain your thinking.
What do you think the graph is scaled by? In other words, what number does each horizontal line represent on the vertical axis? Why?
Black Members of Congress
Figure 4. Slide 4 of the Slow Reveal Graph (Revealing the y-Axis)
What new information did we learn? Are you surprised? Why or why not?
How can you use some of the dates on the graph to make sense of the patterns you are seeing?
Why might the number of Black Congress members have decreased to zero for a while after around 1890?
What might have accounted for the increase in Black Congress members at either end of the graph?
What do you predict the graph will look like if we would extend the graph from 1971 to the present? Why?
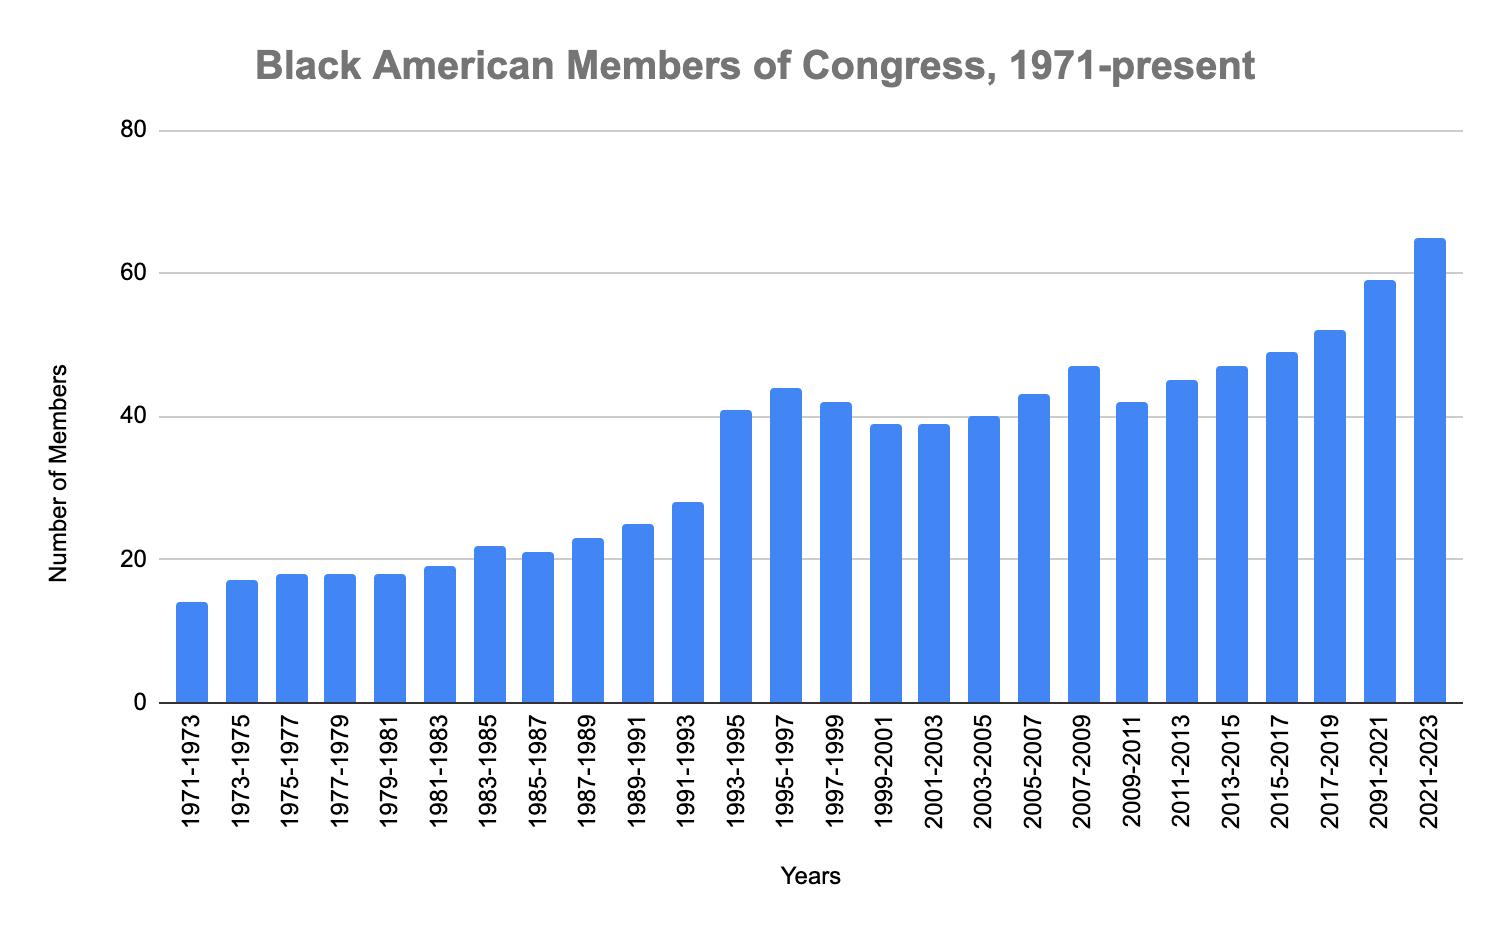
Black Members of Congress, 1971-present
Figure 5. Slide 5 of the Slow Reveal Graph (Introducing a Second Graph)
Does the graph match your prediction? Why or why not?
What do you notice? What do you wonder?
How is the scale of this graph different from the previous graph?
Why is paying attention to the scale of the graph important when comparing this graph with the previous graph?
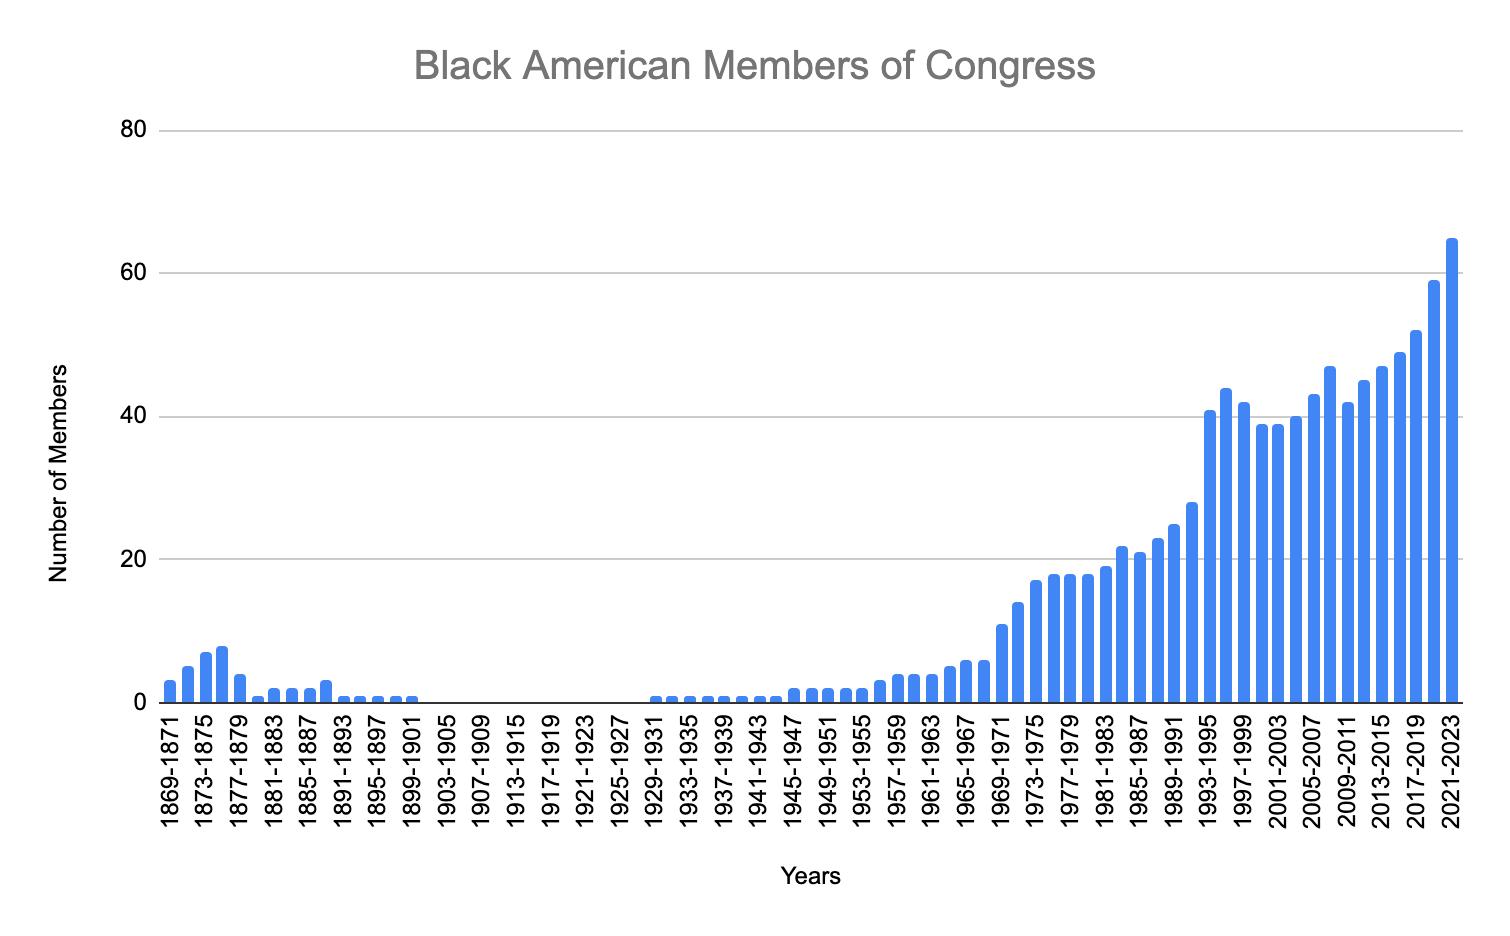
Black Members of Congress,
1869-present
Figure 6. Slide 6 of the Slow Reveal Graph (Combining the Two Graphs)
What do you notice about the overall graph that wasn’t obvious in the other graphs?
What historical events contribute to the changes you are seeing in the graph?
This is also not the complete story. Why not?
reveal graph, we walk through each phase of the slow reveal graph facilitation to demonstrate how to scaffold the inquiry around the data visualizations.
Historical Context
While this slow reveal graph about Black members of Congress in U.S. History could fit into a variety of social studies units in upper elementary classrooms depending on teachers’ learning goals, we situate this graph within the context of the Civil Rights Movement. In this slow reveal graph, students see how Black Congressional membership rises and falls with major events in the history of the United States, such as the end of Reconstruction, the rise of Jim Crow, and the beginning of the Civil Rights Movement. Examples of these events in United States history include:
• Jim Crow Laws: Jim Crow laws enforced racial segregation in the South between the end of Reconstruction in 1877 and the beginning of the Civil Rights Movement in the 1950s. However, these laws were about more than just segregation. These laws led to the inability of Black Americans to vote, let alone run for Congress. As a result, Black Americans were left with a constant threat of violence and white supremacy, lack of political representation, and second-class citizenship.10
• New Deal: New Deal was a program established under the administration of President Franklin D. Roosevelt in the 1930s. While the passage of the New Deal offered a broad series of programs and economic relief, they systematically excluded Black Americans. For example, unemployment insurance did not extend to agricultural and domestic workers, leaving many Black Americans without access to one of the main benefits of the New Deal.11
• GI Bill: Passed in 1944, the GI Bill extended to all veterans; however, the bill was administered by local authorities
who routinely and systematically excluded Black veterans through Jim Crow-style laws.12 Thus, the GI Bill largely benefitted white men and encouraged white flight to the suburbs.
• Voting Rights Act of 1965: The Civil Rights Movement’s push for the Voting Rights Act increased voter registration and participation among Black Americans. The increase of Black voters led to the election of more Black members of Congress.13
By engaging with the slow reveal graph, students can see why there was a need for the Civil Rights Movement as a way to gain political representation as it waned in the decades before the 1950s and 1960s. Moreover, by connecting the history of Black congressional representation to the Civil Rights Movement, students can consider the struggles and strides in the fight for racial equality and the need for ongoing efforts to sustain and build on these gains.
Slow Reveal Graph Overview
To highlight and explore this historical context, we designed a slow reveal graph for upper elementary (grades 3–5) classrooms. Because of the responsive, inquiry-based nature of teaching with a slow reveal graph, the amount of time to facilitate the lesson may vary between fifteen and twenty-five minutes, depending on students’ noticings and wonderings. To teach this lesson, teachers need the slide deck of the slow reveal graph (see Pullout in this issue) and prompting questions that align with each slide, which we share examples of in this article. The questions we provide are designed to encourage students’ historical thinking and chronological reasoning as they analyze and interpret the information that is slowly revealed in the graph. These questions reflect the components of graph comprehension14 and align with upper elementary social studies and mathematics content
Social Studies and Mathematics Content and Standards
Time, Continuity, and Change
• Studying the past makes it possible for us to understand the human story across time.
• Knowledge and understanding of the past enable us to analyze the causes and consequences of events and developments, and to place these in the context of the institutions, values and beliefs of the periods in which they took place.
D2.His.2.3-5. Compare life in specific historical time periods to life today.
D2.His.3.3-5. Generate questions about individuals and groups who have shaped significant historical changes and continuities.
D2.His.14.3-5. Explain probable causes and effects of events and developments.
D2.His.16.3-5. Use evidence to develop a claim about the past.
D3.3.3-5. Identify evidence that draws information from multiple sources in response to compelling questions.
D3.4.3-5. Use evidence to develop claims in response to compelling questions.
D4.2.3-5. Construct explanations using reasoning, correct sequence, examples, and details with relevant information and data.
Process Standards
• Reasoning and Proof—Make and investigate mathematical conjectures; Develop and evaluate mathematical arguments.
• Connections—Recognize and use connections among mathematical ideas; Recognize and apply mathematical in contexts outside of mathematics.
• Representation – Use representations to model and interpret physical, social, and mathematical phenomena.
Content Standard
• Data Analysis and Probability—Develop and evaluate inferences and predictions that are based on data.
standards (see Table 1). Students’ engagement with the slow reveal graph and prompting questions serve as a formative assessment throughout the lesson of their understanding of the data visualization and what they know and wonder about the Civil Rights Movement broadly and Black members of Congress specifically. This synergy of mathematics and social studies content and skills represents the healthy integrative nature of this pedagogical strategy.
Slide One: Introducing the Graph
The slow reveal graph begins by displaying the visual skeleton of the graph (see Figure 1 in the Pullout). The purpose of this slide is to build students’ curiosity. Because students are used to seeing complete graphs, they may wonder about what the displayed graph represents. To encourage their curiosity, ask students what they notice and what they wonder about the graph. Students may notice that there are two clusters of bars in this graph with a gap in the middle. They may also notice that the highest bars are on the sides of the graph. If students know the graph pertains to ideas related to the Civil Right Movement, teachers may also want to ask students about their predictions for the context of the graph. These are relevant questions for Slide 1:
• What do you notice?
• What do you wonder?
• What might this graph be about? Explain your thinking.
Slide Two: Revealing the x-Axis
After discussing students’ initial thoughts about the graph using Slide 1 (Figure 1 in the Pullout), display Slide 2 (Figure 2 in the Pullout). This slide provides additional context for students by revealing that the x-axis is labeled “Years.” Students also see that each bar represents a two-year period over the span of 100 years, from 1871 until 1971. In order to emphasize the newly revealed information, ask students to identify the new information they learned about the graph. Possible responses include the years represented by the graph, that each bar represents two years, and that the graph spans from 1871 to 1971. To encourage discussion about this slide, teachers may ask these questions:
• What new information did we just learn?
• Does it change your thinking about this graph? Why or why not?
• What patterns do you see within the graph? What might explain those patterns?
• What might this graph be about? Explain your thinking.
• How does the shape of the graph at particular years support your prediction?
Slide Three: Revealing the Graph Title
The third slide, shown in Figure 3 (see Pullout), reveals the title of the graph, “Black Members of Congress.” This provides additional context about the graph. Facilitate discussion centered on what the
students learned about the graph and what predictions students can make about the graph based on the title. These questions can be used to facilitate discussion about this slide:
• What new information did we just learn?
• Does it change your thinking about this graph? Why or why not?
• Why does it make sense that the years are in groups of two? (Possible responses might draw on the fact that term lengths for Congress members are multiples of two. For example, Representatives have terms of two years, and Senators have terms of six years.)
• What number do you predict for the largest number of Black Congress members shown on the graph (1969–1971)? Explain your thinking.
• What do you think the graph is scaled by? In other words, what number does each horizontal line represent on the vertical axis? Why?
Slide Four: Revealing the y-Axis
This slide completes the graph by revealing the y -axis information (see Figure 4 in the Pullout). Students may be surprised to learn that the highest number of Black Congress members during the time period shown in the graph was 11. Now that the graph is complete, teachers can encourage students to reason about the information in the graph using historical thinking. These questions scaffold students to connect their mathematical skills and social studies skills:
• What new information did we learn? Are you surprised? Why or why not?
• How can you use some of the dates on the graph to make sense of the patterns you see?
• Why might the number of Black Congress members have decreased to zero for a while after around 1890?
• What might have accounted for the increase in Black Congress members at either end of the graph?
• What do you predict the graph will look like if we would extend the graph from 1971 to the present? Why?
Slide Five: Introducing a Second Graph
The purpose of this slide is to introduce students to a graph with more current data. The graph in Figure 5 (see Pullout) displays the number of Black Congress members from 1971 to 2023. Students can discuss the changes in the number of Black Congress members during this time period and make predictions about why these changes occurred. Teachers can encourage discussion about this slide by asking these questions:
• Does the graph match your prediction? Why or why not?
• What do you notice? What do you wonder?
• How is the scale of this graph different from the previous graph?
• Why is paying attention to the scale of the graph important when comparing this graph with the previous graph?
Slide Six: Combining the Two Graphs
The students see a compilation of the two graphs on slide six, which is shown in Figure 6 (see Pullout). This slide makes it easier to examine the number of Black Congress members from 1871 to 2023. When discussing this slide, several connections to historical events can be made (e.g., Reconstruction, Civil Rights Movement, Jim Crow era). These questions can be used to encourage discussion with this slide:
• What do you notice about the overall graph that was not obvious in the other graphs?
• What historical events may contribute to the changes you see in the graph?
• This is also not the complete story. Why not? (Possible responses include that the graph does not show the entirety of the history of the United States and that the graph does not make it easy to compare the number of Black Congress members with the number of White Congress members and/or members of Congress who describe themselves with other ethnicities.)
After engaging students with the sixth and final slide of this slow reveal graph, teachers may engage students in a meaningful lesson wrap-up by discussing and synthesizing key takeaways from the inquiry. Examples of key takeaways from this slow reveal graph include the following:
• The initial election of Black members during Reconstruction, followed by their decline during the Jim Crow era, underscores the systemic barriers that the Civil Rights Movement aimed to dismantle.
• Examining the number of Black Congress members over time may help students understand the continuity and evolution of the fight for civil rights from Reconstruction through today.
• The rise of Black members of Congress during and after the Civil Rights Movement highlights the tangible outcomes that community organizing and activism can have on political and social change.
• Investigating the current number of Black members of Congress in light of historical data may initiate discussions of taking informed action to support ongoing need for advocacy for civil rights
Depending on state- and grade-specific content and learning standards, teachers can meaningfully conclude the slow reveal graph by tailoring discussion and extensions based on one or more of the takeaways we list here or based on students’ reflections and/or emergent inquiries.
Teaching with Slow Reveal Graphs
Slow reveal graphs are a healthy integrative strategy for engaging students in both mathematics skills and social studies concepts. In this article, we shared one example of
a slow reveal graph related to Black members of Congress; however, we encourage teachers to explore other slow reveal graphs that connect with other social studies content on the Slow Reveal Graphs website (http://slowrevealgraphs.com) and/ or make their own graphs to align with state- and gradespecific standards. To conclude this article, we share a list of overarching considerations for using and creating slow reveal graphs to achieve healthy integration.
1. Determine Integrative Learning Goals: Healthy integration requires the synergy of two or more content areas. As such, teachers should ensure learning goals reflect both mathematics skills related to data literacy and graphing, as well as social studies content and historical thinking.
2. Scaffold and Support: Offer students background information and context for understanding the slow reveal graph. This may include using vocabulary lists or referencing previous lessons that may support students’ interpretation of the graph.
3. Plan the Sequence: Carefully plan the sequence in which elements of the graph and/or data points are revealed. Start with the basic framework and gradually add data (e.g., x-axis y-axis, labels) in a purposeful way. Each reveal should prompt students to make predictions, ask questions, and engage with the data.
4. Encourage Participation: Before revealing each part of the graph, ask students to engage their analytical skills and make predictions. Leverage each reveal to facilitate discussion among students, including thoughts, hypotheses, and reactions to the data.
5. Promote Reflection: Encourage students to reflect on their initial hypotheses and how their thinking changes over time. Students’ inquiries could lead to possible extension lessons and discussions that are rooted in their noticings and wonderings.
6. Differentiate Instruction: Differentiate the graph by adjusting the pace of the reveal and the types of questions asked throughout. Slow reveal graphs lean heavily on visual analysis. To ensure all students, including those with different abilities, can engage with the graph, consider using screen readers, tactile graphs, or text descriptions.
7. Consider Timing: Slow reveal graphs can be used at different points of a unit. You may use the slow reveal graph at the beginning of a unit to spark inquiries or assess prior knowledge about a topic, midway through a unit for a content-specific lesson, or at any point in a unit as an assessment of student learning.
Slow reveal graphs help students connect their mathematical skills with their social studies skills to develop deeper understandings of issues and events. By using the specific slow reveal graph featured in this article, we invite students to
continued on page 25
From Digits to Difference: Taking Civic Action to Support Shelters and Empower Students
Erin V. Piedmont and Alesia Mickle Moldavan
Houselessness is an enduring and systemic social issue in the United States. The percentage of those without stable housing has risen, impacting children, individuals, and families across racial, ethnic, and gender subgroups.1 Of those unhoused during 2022, 30% were families with children who accessed shelters as temporary housing, which increased by 13% in a single year.2 Children encounter houselessness in multiple ways—through public spaces, media, and their lived experiences,3 and they are interested in and capable of learning about the issue.4 However, discussions about houselessness and social class are often regarded as “taboo topics,”5 which can create discomfort and reluctance among teachers.6 This hesitancy is particularly evident in states where legislation presents additional challenges to addressing such issues in the classroom. Nevertheless, research shows that elementary students who learn about houselessness understand root causes and explore ways to address the issue in their communities,7 though more is needed to understand how children comprehend and process these experiences.
The goals for social studies education are to cultivate informed, engaged, and active citizens. 8 Social studies experiences should transcend classroom walls, connecting children to communities and fostering civic competence needed to address real-world challenges.9 By humanizing social issues and centering the experiences of marginalized groups, such as people who are unhoused, teachers can disrupt harmful stereotypes and discrimination. Moreover, social studies lessons focused on systemic issues, like houselessness, enable children to engage in disciplinary thinking, empowering them to help create more equitable and just communities. In this article, we draw from the following standards: (1) C3 Framework for Social Studies Standards that center inquiry, (2) Learning for Justice’s Social Justice Standards
that foster antibias attitudes and collective social action, and (3) National Council of Teachers of Mathematics standards guiding mathematics concepts and skills.10 We propose a sample integrated lesson for teaching about houselessness with early childhood learners (grades K–2), centering mathematics as a tool for examining the needs of children, individuals, and families living in shelters.
Humanizing Language
It is important to recognize the influence of language in shaping how we perceive the humanity (e.g., identities, experiences) of others. Recently, the concept of home has expanded to encompass one’s community, including loved ones, pets, and traditions—elements of daily life that people hold regardless of their living situation.11 In contrast, the term house conveys the “structure in which all of this takes place.”12 In this article, we use the term houselessness, rather than homelessness, to emphasize that individuals currently unhoused are not without a home. Additionally, we use PeopleFirst Language, such as people experiencing houselessness rather than houseless people, to center the humanity of those affected by this ongoing social issue.
Integrating Social Studies with Mathematics
A healthy curriculum integration model allows students to become “integrated thinkers, making social studies connections with other content areas to understand and communicate their understanding of the world.”13 Mathematics is crucial in linking social studies content to students’ lives, particularly through data exploration, which can enhance democratic thought, encourage civic participation, and promote social justice. 14 In early elementary settings, students develop number sense—an intuitive understanding of numbers,
their magnitude and relationships, and how operations affect numbers.15 This foundational concept enables students to make reasonable approximations and informed judgments, enhancing their critical thinking and problem-solving skills. Students quickly learn that numbers tell stories, good and bad, and can be used to advocate for desired goals. For instance, a child recognizes that seven gummy bears are preferable to three and that a ten-minute wait for recess feels much longer than a two-minute wait. Even at an early age, children begin to use numbers to assess fairness and negotiate outcomes through mathematical reasoning.
Exploring numbers using real-life data can raise students’ awareness of current events and social issues16 and provide more authentic learning experiences to identify, collect, and analyze data. The practical aspect of interpreting real-life data develops students’ critical thinking skills and understanding of the meaning behind numbers, including human experiences. For example, studying economic inequality through data can humanize abstract concepts while fostering empathy and an understanding of different perspectives.
Establishing a Context to Bridge Connections with Diverse Texts
To connect mathematics with social issues, contexts must be explicitly defined to facilitate critical discussions that leverage mathematics to confront inequities.17 In elementary settings, diverse texts can ground mathematical discussions on identity, diversity, justice, and action.18 These texts can challenge traditional white, Westernized, and colonized perspectives19 while allowing students to reflect on themselves (mirrors),
learn about others (windows), and immerse themselves in others’ experiences (sliding glass doors).20 When students see their own experiences validated, understand diverse viewpoints, and feel empowered to effect change in their communities, learning becomes a humanizing experience that fosters empathy, critical thinking, and social justiceoriented civic engagement.21 Furthermore, diverse texts can present challenging topics sensitively, addressing issues like houselessness without highlighting specific instances that may reflect the experiences of students. Next, we share a sample lesson that utilizes a diverse text to illuminate and humanize a social issue, promote empathy, and shift narratives from pity to resilience and strength, ultimately empowering students to take action in their communities.
A “Place Value in Action: Helping Shelters Together” Lesson
This lesson enables students to explore shelters and the people they serve by using mathematical skills to analyze data. The compelling question framing this lesson is, “How can we support people living in shelters?” The lesson may extend across several days and be integrated into social studies, mathematics, or both, depending on scheduling to ensure a cohesive and effective learning experience (see sidebar).
Using a Diverse Text
We used the text A Place to Stay: A Shelter Story by Erin Gunti22 to humanize the experiences of people living in shelters. It provides insights into the daily lives of a mother and daughter living in a shelter, the challenges they encounter, and the
Academic Standards Used in this Lesson
Learning for Justice Social Justice Standards
Anchor Standard, Justice 14. Students will recognize that power and privilege influence relationships on interpersonal, intergroup, and institutional levels and consider how they have been affected by those dynamics. (JU.K-2.14)
Anchor Standard, Action 20. Students will plan and carry out collective action against bias and injustice in the world and evaluate what strategies are most effective. (AC.K-2.20)
C3 Framework Standards
D2.Civ.14.K-2. Describe how people have tried to improve their communities over time.
D2.Eco.1.K-2. Explain how scarcity necessitates decision making.
D4.3.K-2. Present a summary of an argument using print, oral, and digital technologies.
National Council of Teachers of Mathematics Standards
Pre-K–2 Expectations:
• Use multiple models to develop initial understandings of place value and the base-ten number system.
• Develop and use strategies for whole-number computations, with a focus on addition and subtraction.
• Use a variety of methods and tools to compute, including objects, mental computation, estimation, paper and pencil, and calculators.
support they receive from their communities. Additionally, the story emphasizes themes of resilience, hope, humanity, and empathy while using creative imagination to uplift those experiencing difficult times. Thus, the book is an entry point for exploring a complex and relevant social issue by broadening students’ perspectives on shelters and the people they support and initiating discussions about collective action.
Teachers can use the text as an interactive read-aloud to help students recognize that life is easier for some people and harder for others, and the reasons for that are not always fair (JU.K-2.14). At the beginning of the story, the protagonist expresses her disappointment upon arriving at the shelter, whispering to her mother, “This isn’t a house.”23 This moment provides an opportunity to discuss the complexity of terms such as home and house. Teachers can ask questions such as “What makes a home a home?” and “How might the word house mean something different than home?” to emphasize that many people associate home with elements beyond a physical structure. Throughout the text, teachers can guide students with questions such as, “What challenges do the girl and her mother face while staying at the shelter?” “How do the girl and her mother create a home within the shelter?” and “How does the shelter help its residents?”
Next, the teacher can guide students in exploring why people may become unhoused, helping them understand that systemic forces, rather than individual shortcomings, perpetuate the issue. To initiate this discussion, students can consider the question, “Why do people become unhoused?” K–2 learners may respond with reasons such as, “People do not have enough money” or “Someone does not have a job.” While these are valid responses, the teacher can deepen students’ understanding by introducing more complex systemic causes. For example, the teacher can explain that many people work jobs that do not provide sufficient wages to afford housing, that there may not be enough jobs for everyone, or that housing costs can be so high that even fulltime workers are unable to afford a home. These examples can help students understand the systemic forces contributing to houselessness and encourage them to brainstorm ways to support people experiencing it, including recognizing shelters as valuable resources.
To conclude, teachers can guide students in considering shelter needs by creating a T-Chart (see Figure 1) connecting people’s daily experiences and the accompanying items shelters must supply. To scaffold this process, students can reflect on the text by drawing pictures of what shelters might look like, including items that would make people feel welcomed and safe. Additional questions evoking social justice connections include “Where are shelters located in our community?” and “What supplies do shelters in our community need that students, families, and schools can provide?”
Using Real-Life Data Analysis
After students brainstorm the essential items needed in shelters, we recommend a place-based approach by examining shelters in the local community. To model, we use the context of Savannah, Georgia. While map analysis and interpretation can foster geographic thinking and spatial awareness, they can also stimulate curiosity and bridge community connections. Additional shelter information could include the number of people they support or other pertinent information to guide students’ data analysis (see Table 1).
Teachers can guide students in determining noticings and wonderings about the data, such as which shelters accommodate the greatest and least number of people. Students can also describe their reasoning using place value understanding of two-digit numbers concerning the tens and the ones positions and record the comparison results using the symbols >, =, and <. See Table 2 for possible questions and solutions that inform students’ understanding of shelter needs.
Additionally, students can use the data table (see Table 1) to solve addition and subtraction problems up to 20. Referencing the text and T-Chart, story problems can spark conversations about donated items needed to support shelters. As students look at various problems, they can discuss ways to support
Figure 1. T-Chart Sample
Table 1. Shelters in Savannah, Georgia. The data reflects information on the shelter’s websites and/or resource guides available through the ChathamSavannah Authority for the Homeless.
Possible Questions
1. Park Place Outreach shelters 15 children aged 11–17. Inner City Night Shelter helps 50 men and women. Which shelter helps more people? Draw a visual to describe the value of each digit in the tens and ones position. Then, compare the two-digit numbers with the symbols >, =, or <.
Solutions
2. Compare the number of people at Union Mission—Parkers House with the number of people at Temporary Assistance for Needy Families Residential. Draw a visual to describe the value of each digit in the tens and ones position. Then, compare the two-digit numbers with the symbols >, =, or <.
3. The Old Savannah City Mission and SAFE Shelter both shelter 48 people. Are these numbers equal, greater than, or less than the number of people sheltered at the Union Mission-Parker’s House?
Table 2. Sample Mathematics Problems: Place Value
15 < 50
Park Place Outreach shelters 15 people, which can be written in expanded form as one ten and five ones. Inner City Night Shelter supports 50 people, equal to five tens and zero ones. Since one ten is less than five tens, Inner City Night Shelters supports more people.
32 > 12
While both Union Mission—Parkers House and Temporary Assistance for Needy Families Residential have two ones, Union Mission— Parkers House has three tens, which is more than Temporary Assistance for Needy Families Residential, which has one ten.
48 > 32
Both Old Savannah City Mission and SAFE Shelter help shelter more people than the Union MissionParker’s House.
Possible Questions Solutions
1. Natasha has 12 kids staying at Park Place Outreach, so she needs 12 beds. She wants to put a toy on each bed but only has 7 toys. How many more toys does Natasha need so every bed has a toy? Draw a visual to describe the value of each digit in the tens and ones position. Then, solve the problem.
2. Union Mission—The Phoenix House can shelter 10 people. If the shelter serves breakfast and lunch for each person, how many meals do they need to serve for one day? Draw a visual to describe the value of each digit in the tens and ones position. Then, solve the problem.
3. Old Savannah City Mission provides jackets to keep people warm during the winter. They had 14 jackets but gave away 6. How many jackets are left? Draw a visual to describe the value of each digit in the tens and ones position. Then, solve the problem.
Natasha needs 5 more toys. When 5 ones are added to 7 ones, 10 ones can be regrouped to make one ten with 2 ones left over, which equals 12.
For 10 people each day, the shelter needs one ten for breakfast and one ten for dinner for a total of two tens, or 20 meals.
The 14 jackets can be written in expanded form as one ten and 4 ones. One ten can be regrouped as 10 ones. So, 14 ones minus 6 ones equals 8 ones. There are 8 jackets left.
donation collections, inspiring ideas to take action in their community. See Table 3 for sample problems and solution strategies.
Taking Informed Action
An essential aspect of preparing students for informed, engaged, and social justice-oriented civic engagement is providing opportunities to take action in their communities. For the final part of this lesson, students can utilize the knowledge developed during the interactive read-aloud and mathematics activities to consider ways to make communities fairer (AC.K-2.20). More specifically, students will create a plan for meeting the needs of people in shelters. At this point, they have explored people’s experiences utilizing shelters,
created a T-Chart of essential supplies shelters need, and analyzed data focusing on place value and operations related to local shelters.
To extend community partnerships and foster place-based learning, students can collaborate with a local shelter for an outreach project. They can gather data from the shelter’s website or engage directly with staff to understand their needs. For instance, the director or other staff can speak with students or share a letter disclosing their needs. Data collection could include the average number of shelter users, meals served, in-demand clothing resources, and suggestions for how students can assist. For instance, Park Place Outreach may need backpacks with school supplies. Students can facilitate this by soliciting donations from the community. To
Table 3. Sample Mathematics Problems: Addition and Subtraction
summarize and communicate the shelter’s needs, students can create an infographic that includes the shelter’s information, requested supplies, collection locations, and goals (see Figure 2). This infographic can be distributed at local places, such as libraries and grocery stores, and shared on digital platforms, including school websites and community social media pages. If the school offers a donation collection box, students can track weekly donations and calculate the remaining items needed to meet their goal, reinforcing mathematics content while connecting efforts to improve their communities.
Conclusion
Providing opportunities for elementary students to engage with enduring social issues, such as houselessness, is essential in preparing informed, engaged, and social justice-oriented citizens. Existing research reveals that children are not only aware of houselessness as an ongoing issue but that they are also capable of exploring it more deeply. The integrated “Place Value in Action: Helping Shelters Together” lesson shared in this article provides one example of how elementary students in grades K–2 can utilize mathematics skills and strategies to examine and solve the issue of houselessness within their communities.
Notes
1. “State of Homelessness: 2023 Edition,” National Alliance to End Homelessness, https://endhomelessness.org/homelessness-in-america/homeless ness-statistics/state-of-homelessness/
2. Tanya de Sousa, Alyssa Andrichik, Ed Prestera, Katherine Rush, Colette Tano, Micaiah Wheeler, and Abt Associates, The 2023 Annual Homelessness Assessment Report (AHAR) to Congress (The U.S. Department of Housing and Urban Development, 2023), www.huduser.gov/portal/publications/2023ahar-part-1-pit-estimates-of-homelessness.html
3. Sheng Kuan Chung and Dan Li, “Socially Engaged Art Education: Exploring Issues of Homelessness in an Elementary Art Classroom,” International Journal of Education & the Arts 21, no. 21 (2020): 1–20, http://doi.org/10.26209/ ijea21n21; Jinhee Kim, “Homelessness as Difficult Knowledge in Early Childhood Education,” Early Childhood Education Journal 48 (2020): 815–823, https://doi.org/10.1007/s10643-020-01045-5
4. Anna Falkner and Noreen Naseem Rodrìguez, “Toward an Equity-Centered Approach to Early Childhood Social Studies,” Young Children 79, no. 1 (2024): 7–15; Katie Anderson Knapp and Amy Hopkins, “What’s the Buzz? A K–5 School Uses the C3 Framework,” Social Studies and the Young Learner 30, no. 3 (2018): 9–18; Stephanie Serriere, Lori McGarry, David Fuentes, and Dana Mitra, “How Service-Learning Can Ignite Thinking,” Social Studies and the Young Learner 24, no. 4 (2012): 6–10.
5. Kim, “Homelessness as Difficult Knowledge,” 815.
6. Louise Derman-Sparks and Julie Olsen Edwards, Anti-Bias Education for Young Children and Ourselves (Association for the Education of Young Children, 2009).
7. Chung & Li, “Socially Engaged Art Education.”
8. “Powerful Teaching and Learning in Social Studies,” National Council for the Social Studies, April 2023, www.socialstudies.org/position-statements/ powerful-teaching-and-learning-social-studies
9. Walter C. Parker and Terence A. Beck, Social Studies in Elementary Education, 15th ed. (Pearson, 2017); Noreen Naseem Rodrìguez and Katy Swalwell, Social Studies for a Better World: An Anti-Oppressive Approach for Elementary Educators (W.W. Norton & Company, 2022).
10. National Council for the Social Studies, The College, Career, and Civic Life (C3) Framework for Social Studies State Standards: Guidance for Enhancing the Rigor of K–12 Civics, Economic, Geography, and History (National Council for the Social Studies, 2013); Learning for Justice, Social Justice Standards: The Learning for Justice Anti-Bias Framework, www.learningforjustice. org/frameworks/social-justice-standards; National Council of Teachers of Mathematics, Principles and Standards for School Mathematics (National Council of Teachers of Mathematics, 2000).
11. Scott Kerman, “Homeless, Houseless, and Unhoused: A Glossary of Terms Used to Talk About Homelessness,” Blanchet House, https://blanchethouse. org/homeless-houseless-unhoused-glossary-about-homelessness/.
12. Kerman, “Homeless, Houseless, and Unhoused,” para. 9.
13. Elizabeth Hinde, “Fractured Social Studies or Integrated Thinkers: The End Results of Curriculum Integration,” Social Science Research and Practice 4, no. 3 (2009): 125.
14. Ole Skovsmose and Paola Valero, “Democratic Access to Powerful Mathematical Ideas,” in Handbook of International Research in Mathematics
Figure 2. Sample Infographic
Education, ed. Lyn D. English (Lawrence Erlbaum Associates, 2002), 383–407; Anita A. Wager and David W. Stinson, eds., Teaching Mathematics for Social Justice: Conversations with Educators (National Council of Teachers of Mathematics, 2012).
15. National Council of Teachers of Mathematics, Principles to Actions: Ensuring Mathematical Success for All (National Council of Teachers of Mathematics, 2014).
16. Eric Gutstein, Reading and Writing the World with Mathematics: Toward a Pedagogy for Social Justice (Routledge, 2006).
17. Rochelle Gutiérrez, “Context Matters: How Should We Conceptualize Equity in Mathematics Education?” in Equity in Discourse for Mathematics Education: Theories, Practices, and Policies, eds., Beth Herbel-Eisenmann, Jeffrey Choppin, David Wagner, and David Primm (Springer, 2012), 17–23, https://doi.org/10.1007/978-94-007-2813-4_2
18. Montana Smithey and Alesia Mickle Moldavan, “The Food Drive Task: Problem Solving for Social Justice in the Elementary Grades,” Ohio Journal of School Mathematics 95, no. 1 (2023): 1–9, https://ohiomathjournal.org/index. php/OJSM/article/view/9623; Norline R. Wild, “Picturebooks for Social Justice: Creating a Classroom Community Grounded in Identity, Diversity, Justice, and Action,” Early Childhood Education Journal 51(2022): 733–741, https:// doi.org/10.1007/s10643-022-01342-1
19. Alesia Mickle Moldavan and Dittika Gupta, “Culturally Relevant Science Learning: Helping Students Culturally Connect with Science Through Picture Books,” Science & Children 61, no. 1 (2024): 70–76, https://doi.org/ 10.1080/00368148.2023.2292390
20. Rudine Sims Bishop, “Mirrors, Windows, and Sliding Glass Doors,” Perspectives: Choosing and Using Books for the Classroom 6, no. 3 (1990): ix–xi.
21. Rodrìguez and Swalwell, Social Studies for a Better World.
22. Erin Gunti, A Place to Stay: A Shelter Story, illus. Esteli Meza (Barefoot Books, 2019).
23. Gunti, A Place to Stay, 2.
SOCIAL STUDIES + MATHEMATICS
from page 18
reason mathematically and to reason historically about events impacting the number of Black members of Congress.
Notes
1. Christopher L. Busey and Irenea Walker, “A Dream and a Bus: Black Critical Patriotism in Elementary Social Studies Standards,” Theory & Research in Social Education 45, no. 4 (2017): 456–488, https://doi.org/10.1080/00933104 .2017.1320251
2. Alicia R. Crowe, “‘What’s Math Got to Do with it?’: Numeracy and Social Studies Education,” The Social Studies 101, no. 3 (2010): 105–110.
3. Tamara L. Shreiner, “Data Literacy for Social Studies: Examining the Role of Data Visualizations in K–12 Textbooks,” Theory & Research in Social Education 46, no. 2 (2018): 194–231.
4. References to “healthy integration” throughout comes from Elizabeth R. Hinde, “Fractured Social Studies or Integrated Thinkers: The End Results of Curriculum Integration,” Social Science Research and Practice 4, no. 3 (2009): 118–127.
6. Susan N. Friel, Frances R. Curcio, and George W. Bright, “Making Sense of Graphs: Critical Factors Influencing Comprehension and Instructional Implications,” Journal for Research in Mathematics Education 32, no. 2 (2001): 124–158.
7. Kristen Taurence, Tamara Shreiner, and Bradford Dykes, “Revealing the Power of Data Visualizations in Social Studies Through Slow Reveal Graphs,” Statistics Teacher, March 23, 2022, www.statisticsteacher.org/2022/03/23/ slowrevealgraphs/.
8. National Council for the Social Studies, The College, Career, and Civic Life (C3) Framework for Social Studies State Standards: Guidance for Enhancing the Rigor of K–12 Civics, Economic, Geography, and History (National Council for the Social Studies, 2013), 45.
9. National Council for the Social Studies, National Curriculum Standards for Social Studies: A Framework for Teaching, Learning, and Assessment (National Council for the Social Studies, 2010); National Council for the Social Studies, The College, Career, and Civic Life (C3) Framework for Social
Erin Piedmont is an Assistant Professor of Elementary Social Studies at Georgia Southern University. She can be reached at epiedmont@ georgiasouthern.edu
Alesia Mickle Moldavan is an Assistant Professor of Elementary Mathematics and Science Education at Georgia Southern University. She can be reached at amoldavan@georgiasouthern.edu
Studies State Standards; National Council of Teachers of Mathematics [NCTM]. (2000). Principles and standards for school mathematics. NCTM.
10. “What Was Jim Crow?” Jim Crow Museum, https://jimcrowmuseum.ferris.edu/ what.htm.
11. Terry Gross, “A ‘Forgotten History’ of How the U.S. Government Segregated America,” NPR: Fresh Air, May 3, 2017, www.npr.org/2017/05/03/526655831/ a-forgotten-history-of-how-the-u-s-government-segregated-america
12. Quil Lawrence, “Black Vets Were Excluded from GI Bill Benefits—A Bill in Congress Aims to Fix That,” NPR: All Things Considered, October 18, 2022, www.npr.org/2022/10/18/1129735948/black-vets-were-excluded-from-gi-billbenefits-a-bill-in-congress-aims-to-fix-th
13. “Congress and the Voting Rights Act of 1964,” National Archives, June 19, 2019, www.archives.gov/legislative/features/voting-rights-1965
14. Friel, Curcio, and Bright, “Making Sense of Graphs.”
Abigail Stebbins is an Assistant Professor of Elementary Education at The Ohio State University. She can be reached at stebbins.47@osu.edu
Amy Brass is an Assistant Professor of Mathematics Education at the University of New Mexico. She can be reached at abrass@unm.edu
“Bluey-conomics”: It’s Not All About the Money
Alexa Quinn, Stephen Day, and Lauren Shifflett
In this article, we describe ways to use the television series Bluey to examine economic concepts in children’s daily lives. We identify and unpack parts of Bluey episodes that might serve as the basis for lessons or discussions with young children. We explain how economic decision-making can have either “market” or “nonmarket” contexts, which is to say that economics is not only about money!
In the twelfth episode of the award-winning children’s television show Bluey , 1 Bluey brings home a classroom puppet that she is supposed to entertain for the weekend. Her family (father Bandit, mother Chilli, and younger sister Bingo) makes grand plans for how they will surpass previous entries in Bob Bilby’s memory book, but despite good intentions spend much of the time watching cartoons. After Chilli shows everyone some photographs that capture their abundant screen time, the children decide to get back to playing with one another and make lots of memories. It is great TV, and furthermore a great tool for teaching economics to young children.
Economics is the study of how people make choices when they encounter limited options. A good definition for young children is “thinking about how we make choices when we can’t get everything we want.” These choices do not necessarily need to be about money. Economists distinguish between market and nonmarket choices. Market choices have to do with buying and selling goods and services using money and are guided by prices. Nonmarket choices include pretty much everything else—the vast majority of choices! In nonmarket choices, people act “economically” in that they face tradeoffs, weigh costs and benefits, and respond to incentives. But the choices they face and the incentives they follow do not necessarily have to do with money, trade, production, or consumption. Their choices are often more subtle and are governed by cultural and societal norms.
The “Bob Bilby” episode of Bluey portrays what is for many U.S. families a relatable dilemma about how to make choices about device use. Screen time for young children is on the rise, with families recognizing beneficial new learning opportunities while simultaneously expressing worries about how much is too much.2 This consideration of costs and benefits is an example of economics in action, and Bluey is full of examples like this.
Teaching Economics with Bluey: The “Why” and the “How”
Bluey itself is a leading player in the current media landscape, topping U.S. streaming charts in 2023.3 Produced in Australia beginning in 2018, the show has successfully navigated the transition from the local to global market.4 The sevenminute episodes illustrate the humor and deeper meaning in everyday situations and are popular with both children and adults.5 Much children’s programming features overt socioemotional or academic lessons, such as PBS Kids’ Daniel Tiger’s Neighborhood, with episodes focused on going to the dentist or what to do if you feel upset, or Molly of Denali, which was designed by researchers to teach about informational text.6 In contrast, Bluey takes place primarily in and around a family home, offering fewer explicit lessons but lots to learn for children and parents alike.7
Television shows that students watch outside of school can be great instructional resources, if mediated by a teacher. In addition to increasing engagement through multimodal content, using television shows offers opportunities to connect to students’ interests and funds of knowledge.8 Furthermore, teachers can direct student attention to aspects of a show that the students might not have noticed or considered.9 In “Bob Bilby,” this could be highlighting the opportunity cost of the choice to watch cartoons or asking students to identify factors that make the memory book activity more difficult for some families than others. State or national standards can guide teachers as they identify these connections. The C3 Framework outlines content standards across disciplines. In Table 1, we link K–2 and 3–5 economics standards to possible Bluey episodes and suggest discussion questions (and possible answers) for use in classrooms.
Pedagogy focused on developing critical media literacy with young children highlights the importance of students engaging in both analysis and production of media.10 Teaching economics with Bluey , then, can involve watching and
C3 Framework Indicators*
Economic Decision Making
D2.Eco.1.K-2. Explain how scarcity necessitates decision making.
D2.Eco.1.3-5. Compare the benefits and costs of individual choices.
Economic Decision Making
D2.Eco.2.K-2. Identify the benefits and costs of making various personal decisions
D2.Eco.2.3-5. Identify positive and negative incentives that influence the decisions people make
Exchange and Markets
D2.Eco.3.K-2. Describe the skills and knowledge required to produce certain goods and services.
D2.Eco.3.3-5. Identify examples of the variety of resources (human capital, physical capital, and natural resources) that are used to produce goods and services.
Exchange and Markets
D2.Eco.5.K-2. Identify prices of products in a local market.
D2.Eco.5.3-5. Explain the role of money in making exchange easier.
Exchange and Markets
D2.Eco.6.K-2. Explain how people earn income.
D2.Eco.6.3-5. Explain the relationship between investment in human capital, productivity, and future incomes.
Exchange and Markets
D2.Eco.7.K-2. Describe examples of costs of production.
D2.Eco.2.3-5. Identify positive and negative incentives that influence the decisions people make.
The National Economy
D2.Eco.12.K-2. Describe examples of the goods and services that governments provide.
D2.Eco.12.3-5. Explain the ways in which the government pays for the goods and services it provides.
The Global Economy
D2.Eco.14.K-2. Describe why people in one country trade goods and services with people in other countries.
D2.Eco.14.3-5. Explain how trade leads to increasing economic interdependence among nations.
Suggested Bluey Episode(s)
“Shops” (S1, E23)
Bluey struggles to decide what role she wants to play in a game of shops and frustrates her friends by restarting the game every time she changes her mind.
“Ice Cream” (S2, E47)
Bluey and Bingo convince Bandit to buy them ice cream, but their treats melt while they try to decide on a fair way to trade licks.
“Ragdoll” (S3, E24)
Bluey finds money on the ground, and the kids ask Bandit to drive them to the corner store to buy ice cream. He insists that “it tastes better when you work for it.” He then goes limp or “ragdoll.” The girls have to use various resources to get him into the car.
“Burger Shop” (S2, E32)
Bluey and Bingo operate a business in the tub. The game is an end-of-bath delay tactic, as Bandit has been convinced by a parenting book that he should let the kids make all their own decisions. The burger shop charges five dollarbucks per burger, which Bandit repeatedly pays. As the kids get colder and Bandit becomes more frustrated by their decision to stay in the tub, he eats all the remaining burgers. When the bill comes, he cannot afford the $100 price, so he gets into the bath to “wash dishes” instead.
“Whale Watching” (S3, E22)
Bluey pretends to be a boat captain providing a whale watching service. Bluey and Bingo exchange money for a ticket, with a money-back guarantee.
“Pizza Girls” (S3, E19)
Bluey and Bingo are making mud pizzas and delivering them to the grown-ups, but their pedal car’s wheel keeps falling off.
Public goods are things that governments can provide better than markets. Public goods in Bluey include the roads, (“Road Trip,” S2, E46), the military (“Army,” S2, E16), the police (“Sleepover,” S1, E39).
“Markets” (S1, E20)
The children face tough decisions about what to buy.
Trade between countries is just like having a much bigger market. One that covers the whole world! When people from all over the world trade, it gives us a lot more market choices.
Suggested Discussion Questions and Possible Answers
Why does Bluey have a hard time choosing one role in the game of shops? (She can only pretend to be one person at a time, and she can’t decide between all the options.)
What are the benefits and costs of Bandit’s decision to give the kids his ice cream at the end? (Benefits: The girls stop crying; the girls get another chance to try sharing; Costs: He doesn’t get to eat any ice cream; the girls might not learn their lesson.)
What natural, human, and capital resources do the kids use to get their dad to the car? (Human capital as the girls work to roll dad through the house; human capital as they plan a better way; capital resources when they use the skateboard and roller skates to make the job easier; human capital to enlist neighbor Wendy’s support)
How does money make it easier for Bluey and Bingo to run their burger shop business? (Customers can pay for the products and the burger shop owners can use the money to buy things they want. This is easier than trying to get things they want [food, shelter, etc.] from the customers directly via barter.
How does a “money-back guarantee” affect Bluey’s pretend business? (If she doesn’t do a good job and provide a good experience for her customer, then she returns the money, which means she doesn’t get an income, and might lose future income if the customer tells others they didn’t like the service.)
Should the children give up on the pedal car (“Pedally”)? (No, the girls should keep fixing the wheel. It’s important to stick with something you started; They should leave Pedally—it’s not worth the extra work to fix. They should deliver pizzas by hand for now and find a new way later.)
If you go to the library, do you have to pay for books? Why not? If a police officer helps you, do you have to pay? Why not?
(No, these goods and services have been paid for with taxes.)
Would their choice be easier or more difficult if the market was much bigger, with way more choices? (Easier, because they would be more likely to find what they want. Or more difficult, because having lots of choices makes it harder to choose—higher opportunity cost.)
* National Council for the Social Studies, The College, Career, and Civic Life (C3) Framework for Social Studies State Standards: Guidance for Enhancing the Rigor of K–12 Civics, Economic, Geography, and History (National Council for the Social Studies, 2013).
discussing episodes as well as creating media in response. For example, students might be asked to create an advertisement to publicize one of the Heeler children’s imagined businesses, craft a review of an episode that comments on how realistically it portrayed a real-life challenge that children face, or rewrite an episode to portray a different decision than the one the characters in the show chose.
The creative dramatics and imaginative play that are illustrated so well in Bluey are also a valuable form of pedagogy.11 Students might create and narrate tableaux (still figures representing a scene from a story or history) to represent economic concepts observed during an episode. After watching all or part of a Bluey episode and engaging in discussion, students might be asked to reenact a scene with a different choice and imagine how it would change the outcome. See Michelle Pieczura’s article, “Decidedly Dramatic! The Power of Creative Drama in Social Studies,” for more ideas.
As a foundation for these strategies, we recommend that teaching economics with Bluey center on purposeful discussions. 12 Purposeful discussion should include comprehension questions related to the details of an episode with the purpose of clarifying concepts13 and open-ended questions that prompt inquiry about character motivation and decision-making.
A specific discussion routine that is well-suited to exploring decision-making in Bluey is collaborative reasoning, 14 in which the teacher poses a central question concerning a dilemma faced by a character in the story. After posing the question, students first explain their position. Then they build on and challenge one another’s thinking with additional reasons and evidence from the story. After the discussion, a final poll is taken to see where everyone stands.15
In this article, we highlight many examples of texts (in the form of Bluey episodes) that are likely to support powerful talk. In addition, we provide a variety of text-based and open-ended questions to promote student dialogue. We suggest teachers
plan for a combination of discussion, creative dramatics, and media creation when using Bluey to teach economics in elementary classrooms.
Nonmarket Decision-Making in Bluey
Economics often uses market prices to express value—but not all the time. Economics is not only about money. People can use economic thinking to understand decisions outside the marketplace, too. Bluey does a masterful job showing nonmarket decisions in family life. These situations can be both funny and distressing at the same time, which is what makes them so compelling. Oftentimes, the humor in Bluey spotlights situations in which innocent children’s games cause the adults discomfort. For example, in the episode entitled “Fancy Restaurant” (S2, E17), the children set up a date night for the parents and proudly serve them an appalling concoction made of refrigerator condiments. (Bandit gallantly eats both adults’ portions and thereby wins Chilli’s affection. The date was a success after all!) In other episodes, the parents make decisions that the children don’t understand, such as in “Mr Monkeyjocks” (S2, E38), when Chilli and Bandit ask Bluey and Bingo to choose which of their dozens of stuffed animals to donate. The children, of course, claim that they are in love with all the animals—even the ones they never play with. Choices are discussed frequently in Bluey, and many involve abstract ideas rather than tangible resources. For example, in “Grannies” (S1, E28), Bluey must choose between playing a make-believe game the way she envisions it and maintaining Bingo’s participation in the antics. Each of these episodes highlights some tension and even contradiction in the various goals that people pursue in normal life. And all of these situations abound with examples of decision-making, which is to say, economics. Economics is often believed to be the study of money. Some think that economic thought is crassly consumeristic, but economics is actually the study of how people make choices when faced with scarcity. Scarcity is when one cannot reach all their goals
Discussion Questions: Nonmarket Decisions in Bluey
• What are some things that you want, but you can’t get with money? Does it take money to have friends? (Possible answer: no, friends don’t take money. Other examples could be making new rules for a game; spending family time; or giving your teacher a hug!)
• In “Fancy Restaurant,” why does Bandit eat the yucky food that his children make? (Possible answer: because Chilli and the children being happy is more important to him than eating something that he likes.)
• In “Mr Monkeyjocks,” why did the kids suddenly like a toy so much that they never played with? (Possible answer: because they didn’t like the idea of something being taken away from them, even if they usually didn’t play with it.)
• In “Grannies,” what does Chilli mean by the question “Do you want to be right, or do you want Bingo to keep playing?” (Possible answer: it means that when we make a choice, we have to give something up. In this story, Bluey had to give up winning the argument if he wanted Bingo to keep playing the game.)
with the available resources.16 Put differently, economics is the study of ends and means or choices and plans. Bluey frequently shows the complexity and tension in trying to meet common relational goals in a family and with friends.
In “Fancy Restaurant,” Bandit has to choose whether to sacrifice his children’s happiness (by rejecting the food they made and are proud of), Chilli’s comfort (by making her eat her portion of the food), or his own comfort. Happiness and comfort are the goals he is trying to achieve, but he cannot achieve all of them for all the people involved. He decides that the best choice is to sacrifice his own comfort, which leads to a happy ending. Ironically, he chooses to consume something that, frankly, grosses him out. His goal is not his own comfort, but Chilli’s. Bandit’s actions might not seem like they fit under the famous economic goal of “self-interest.” But in this case, and many others, self-interest is aiming for goals that an individual thinks are more important than money or comfort.17 A collaborative reasoning discussion based on this episode could involve asking students, “Should Bandit have eaten the ‘special dish’?” and asking students to share ideas and consider their peers’ reasoning. Students could offer and discuss various positions and explanations (No, he might get sick; No, you shouldn’t eat food if you do not want it or you think it might be unsafe; Yes, he wants to protect Chili from eating it; Yes, he doesn’t want to hurt Bingo’s feelings). The lesson could close with a final poll or opportunity for groups to act out potential outcomes of different choices.
Bluey provides a unique opportunity to spotlight economic decision-making in family relationships and social life. For example, the forced choice between stuffed animals in “Mr Monkeyjocks” could be used to introduce the idea of opportunity cost: the potential benefit of an option other than
the one chosen. In “Mr Monkeyjocks,” the opportunity cost of a choice among beloved stuffed animals is the value of the animal not selected, while the opportunity cost of a choice not to give up any toys might be access to the space the toys take up or the missed opportunity to share with others. Students could be asked to brainstorm similar examples of choices and opportunity costs in their own lives. In the episode, Bluey and Bingo come to realize through their play that scarcity can increase value (“When you have everything you want … nothing feels special anymore”18), and they end up selecting a basketful of toys to donate so that other kids can enjoy them.
Bluey also offers opportunities for teachers and students to gain a broader view of decision-making, with personal goals that may be altruistic and that are fundamentally dependent on context. In the episode entitled “Grannies,” the mother challenges Bluey with the following scarcity situation: “Do you want to be right, or do you want Bingo to keep playing?”19 After confirming that she can’t have both, Bluey has to determine what her highest priority is: Is it being right, or being happy? One way to investigate this question (and others like it) is to use a decision-making model. The class could make a T-chart on which they do a cost–benefit analysis of Bluey’s choice. They could use a side-by-side T-chart, or “Decision Tree,” to clarify what both choices are. Teachers can find resources for how to use decision-making models at the Virginia Council on Economic Education website (vcee. org/economic-decision-making).
Market Economics in Bluey
We also see examples of market decisions in Bluey The words market and nonmarket are terms that teachers can use with students. If a teacher does not wish to introduce this vocabulary, then they can simply refer to “choices,” which will
Bluey “Markets” Lesson Outline
• Watch full episode or clips from Bluey episode “Markets” (S1, E20; 7 minutes). Ask children to notice:
○ The different goods and services at the market
○ How Bluey makes the decision about how to spend her $5
○ The path that Bluey’s $5 takes through the market
• After discussing the episode, begin the simulation. Assign children a booth (e.g., honey stand) and supply three natural, human, and capital resource cards that don’t match their booth (e.g., rake, egg, florist), as well as a $5 bill to write their name on.
• Ask children to complete three rounds of purchases from their classmates to procure the correct productive resources they need to operate their booth (e.g., bee, beekeeper, jar).
• Finally, debrief the simulation. Create a web by asking children to pass yarn to the classmate whose $5 they ended up with, illustrating circular flow and the interconnectedness of participants in a market. The goal of a market is that everyone—both consumers and producers—is working together to get the things they want.
You can find the full lesson plan, all materials, and pilot notes online at https://youreconomicsuccess. org/k-1-lesson-plans/
cover most economic situations. However, we do believe that understanding the distinction between market and nonmarket economic choices will help teachers teach about decisionmaking more clearly.
One example of market choices is in the episode entitled “Work” (S1, E31). In it, the family plays a game in which they run a factory that makes drainpipes. When Bandit (the father) manages the factory, the children successfully make drainpipes. But when Bluey takes over as boss, she acts capriciously and even cruelly toward her so-called employees. This management style results in no drainpipes being produced.
The drainpipe factory demonstrates a characteristic of the market economy called the circular flow model (see Figure 1). Circular flow is an economic model that shows the mutual connection between producers and consumers; money flows in a circle between the two. It demonstrates that consumers support businesses by buying products and providing resources in the form of work and investments, and businesses in turn support consumers by selling products and paying wages.20 A teacher can use this concept to explain to lower elementary students that everyone in the economy, at some level, shares both fortune and misfortune with one another. We are interconnected.
A teacher can connect circular flow (i.e., interdependence) with the market economic concepts of income and productivity. They could ask their students the following questions:
• “When did the factory make more drainpipes: when Bandit was the boss, or Bluey?”
• “What did Bluey do to make it so her factory didn’t produce any drainpipes?”
• “If the factory doesn’t make any drainpipes, can they sell any drainpipes?”
• “If the factory doesn’t sell any drainpipes, will they be able to pay their workers?”
A final episode example, true to its name, is “Markets” (S1, E20). In this episode, Bluey gets a $5 bill from the Tooth Fairy. When Bluey spends the $5 at a booth at the farmer’s market, the worker at the booth subsequently spends it at another booth, whose worker spends it at another booth, and so on. Eventually Bluey gets the $5 bill back. The same $5 bill facilitates multiple market transactions. These interactions demonstrate the following characteristics of a market economy:
• A market is where people buy and sell goods and services.
• In a market, consumers and producers (i.e., buyers and sellers) decide on what the prices of things will be. If the price is too high, consumers will not buy what is for sale.
• A market has a circular flow. The money goes around and around as people continue to trade.
An elementary teacher can clarify these points for students by saying,
• “Money makes it easier for us to trade,”
• “Trade makes us depend on each other,” and
• “Producers are also consumers” or “Sellers are also buyers.”
We developed a classroom lesson (see sidebar) that uses Bluey, discussion, and a simulation to demonstrate these characteristics of markets. We piloted it in multiple secondgrade classrooms. Second graders reacted with excitement when their teacher revealed they would be watching clips from Bluey. One student knew the “Markets” episode by
Figure 1. Circular Flow Model
Figure 2. Market Trade from Simulation Activity
heart and recited the lines alongside the on-screen characters! Following the episode and discussion, students successfully distinguished between natural, capital, and human resources in the interactive market simulation (see Figure 2 and Figure 3).
Critical Analysis and Taking Informed Action
Finally, Bluey can be used to help students develop a critical lens. With portrayals of everyday life, Bluey episodes present opportunities to consider how accurately scenarios from the show map on to students’ lives and experiences. Children can also regularly be asked to consider “whose voices are heard, and whose are missing?”21 or “which values and points of view are represented, and which are absent?”22 For example, in “Markets,” we see much more from the perspective of the consumer than we do from the producers of the various goods and services that Bluey considers buying. Might each of them have a different perspective on how Bluey should spend her money? This type of perspectivetaking related to different roles in a market economy is an important skill in
developing critical economic literacy.23
There are also Bluey episodes that provide valuable entry points to considering occupations in modern society. Chilli and Bandit are both working parents who share childcare responsibilities. However, in “Mums and Dads” (S1, E41), two friends at Bluey’s school pretend to care for a child but cannot agree on who should go to work. This episode opens up discussion about occupations, gender norms, and the role of childcare in dual-income families. Questioning media portrayals of gender, race, class and power is at the core of critical media literacy.24
Dimension 4 of the C3 Framework challenges educators to consider how to prepare students for action based on disciplinary learning. The imaginative play featured in Bluey episodes illustrates an entry point to taking action for young children. For example, in the aforementioned episode “Work”, Bluey and Bingo are hired by Bandit as employees in a drainpipe factory. Bluey eventually takes over but abuses her power as a boss. Frustrated with working conditions, Bandit quits and pursues a different career. The episode offers opportunities to practice
identifying goods and services, but it also invites questions about the treatment of workers and workers’ rights. Students might be asked to consider other actions Bandit the employee might have taken or be encouraged to act out the scene in different ways. When youth recreate media, they are taking action.25
Conclusion
The television show Bluey demonstrates both the anxiety and the humor that results from tough family decisions. Sometimes decisions are motivated by money, production, and consumption, but usually they are not. In this article, we highlighted both market and nonmarket choices in Bluey, and suggested classroom questions and standards alignments that make use of economic thinking. With these tools, teachers and students have a fun and accessible way to question why people make the choices that they do. In addition, Bluey provides an opportunity to develop critical media and critical economic literacy skills as students analyze, discuss, and create media in the classroom.
Notes
1. Bluey, created and written by Joe Brumm (Ludo Studio, 2018–2023).
2. B. Auxier et al., “Parenting Children in the Age of Screens,” Pew Research Center, July 28, 2020, https://www.pewresearch.org/internet/2020/07/28/ parenting-children-in-the-age-of-screens/; Victoria Rideout et al., Common Sense Census: Media Use by Tweens and Teens, 2021 (Common Sense, 2022).
3. The Nielsen Company, “Streaming Unwrapped: Streaming Viewership Goes to the Library in 2023,” January 2024, www.nielsen.com/insights/ 2024/streaming-unwrapped-streaming-viewershipgoes-to-the-library-in-2023/
4. Anna Potter, “Globalising the Local in Children’s Television for the Post-Network Era: How Disney+ and BBC Studios Helped Bluey the Australian Cattle Dog Jump the National Fence,” International Journal of Cultural Studies 24, no. 2 (2021): 216–232, https://doi.org/10.1177/ 1367877920941869
5. Stephen Thompson, host, Pop Culture Happy Hour, podcast, “‘Bluey’ Is a Kids Show With Lessons For Everyone,” NPR, September 7, 2022, www.npr.org/transcripts/1119060042
6. Joy Lorenzo Kennedy et al., “The Efficacy of Digital Media Resources in Improving Children’s Ability to Use Informational Text: An Evaluation of Molly of Denali From PBS KIDS,” American Educational Research Journal 59, no. 6 (2022): 1194–1228 https://doi. org/10.3102/00028312221113326.
Figure 3. Market Web from Simulation Activity
7. David Isaacs and Chris Elliot, “What Bluey Can Teach Us About Parenting and Grandparenting,” Journal of Paediatrics and Child Health 58 (2022): 6–7. https://doi.org/10.1111/jpc.15620
8. Luis C. Moll et al., “Funds of Knowledge for Teaching: Using a Qualitative Approach to Connect Homes and Classrooms,” Theory and Research in Social Education 31, no. 2 (1992): 132–141, https://doi.org/10.1080/ 00405849209543534
9. Susan Saltrick et al., Television Goes to School: The Impact of Video on Student Learning in Formal Education (Corporation for Public Broadcasting: Center for Children and Technology, 2004), https://dcmp.org/learn/173
10. Jeff Share, Media Literacy is Elementary: Teaching Youth to Critically Read and Create Media, 2nd ed. (Peter Lang Publishing, 2015).
11. Michelle Pieczura, “Decidedly Dramatic! The Power of Creative Drama in Social Studies,” Social Studies and the Young Learner 25, no. 3 (2013): 9–12.
12. Dot McElhone, Text Talk: Engaging Readers in Purposeful Discussions, IRA E-ssentials series (International Reading Association, 2014), www. literacyworldwide.org/get-resources/ila-e-ssentials/8045
13. Claude Goldenberg, “Instructional Conversations: Promoting Comprehension Through Discussion,” The Reading Teacher 46 (1992): 316–326.
14. Ann-Marie Clark et al., “Collaborative Reasoning: Expanding Ways for Children to Talk and Think in School,” Educational Psychology Review 15, no. 2 (2003): 181–198, https://psycnet.apa.org/doi/10.1023/A:1023429215151.
15. Clark et al., “Collaborative Reasoning,” 184.
16. National Council on Economic Education et al., Voluntary National Content Standards in Economics (Council for Economic Education, 1997).
17. Robert A. Black, “What Did Adam Smith Say About Self-Love?” Journal of Markets & Morality 9, no. 1 (2006): 7–34, www.marketsandmorality.com/ index.php/mandm/article/viewFile/310/299
18. Bluey, season 2, episode 38, “Mr Monkeyjocks,” written by Joe Brumm, directed by Richard Jeffery, aired November 5, 2020, on ABC Kids Australia, 6:02.
19. Bluey, season 1, episode 28, “Grannies,” written by Joe Brumm, directed by Joe Brumm, aired April 2, 2019, on ABC Kids Australia, 4:16.
20. June Gilliard and Phillip Saunders, eds., A Framework for Teaching Basic Economic Concepts: With Scope and Sequence Guidelines, K–12, vol. 4 (Council for Economic Education, 1995).
21. Allan Luke and Peter Freebody, “Shaping the Social Practices of Reading,” in Constructing Critical Literacies, eds. Sandy Muspratt, Allan Luke, and Peter Freebody (Hampton Press, 1997) as cited in Mitzi Lewison et al., “Taking on Critical Literacy: The Journey of Newcomers and Novices,” Language Arts 79, no. 5 (2002): 383, https://doi.org/10.58680/la2002255
22. Alice Miriam Sullivan, “‘I Don’t Buy It’: Critical Media Literacy in the Fifth Grade,” Social Studies and the Young Learner 28, no. 2 (2015): 14.
23. Agata Soroko, “Teaching Young People More Than ‘How to Survive Austerity’: From Traditional Financial Literacy to Critical Economic Literacy Education,” Theory & Research in Social Education 51, no. 1 (2023): 128–156, https://doi.org/10.1080/00933104.2022.2104674
24. Douglas Kellner and Jeff Share, “Critical Media Literacy: Crucial Policy Choices for a Twenty-First-Century Democracy,” Policy Futures in Education 5, no. 1 (2007): 59–69, https://doi.org/10.2304/pfie.2007.5.1.59
25. Share, Media Literacy is Elementary
Alexa Quinn is an Assistant Professor in the College of Education at James Madison University. She can be reached at quinn4am@jmu.edu
Stephen Day is a Term Associate Professor and Director of the Center for Economic Education at Virginia Commonwealth University. He can be reached at shday@vcu.edu. You can read more about teaching with Bluey at Stephen’s blog, “Paper Robots: Helping Families Talk About Money and Work.”
Lauren Shifflett is the Assistant Director of the James Madison University Center for Economic Education. She can be reached at shiffllh@jmu.edu
Write For Us!
NCSS welcomes manuscripts from members interested in publishing in one of our periodicals—Social Education, Middle Level Learning, or Social Studies and the Young Learner.
We are looking for substantive articles and lesson plans in any of the social studies disciplines. We are very interested in publishing more articles on psychology and geography.
We welcome articles on the following topics:
• Social and Emotional Learning
• Teaching Civil Discourse
• Formative Assessments
• Fostering a Global Mindset
• Teaching about Climate Change
• Teaching Social Studies to English Language Learners
• Teaching about Equity and Diversity
• Promoting Cultural Inclusion
• My Favorite Lesson Plan
Young Learner
NCSS is strongly committed to advocacy for the social studies. We welcome articles on any form of advocacy in which you have engaged.
For more details (including the preferred length of manuscripts and procedures for submitting them), see www.socialstudies.org/publications/ how-submit
Teaching Writing in the Social Studies
Joan Brodsky Schur
NCSS Bulletin 118, 143 pages, 2020
Good writing skills are a pathway to academic success and a lifelong asset for students. The social studies disciplines offer excellent opportunities for the development of these skills because social studies subjects require students to present information clearly and accurately, to summarize different perspectives, and to construct persuasive arguments.
In this book, Joan Brodsky Schur draws on her extensive experience as a teacher of both social studies and English to show how social studies teachers can integrate excellent writing instruction into their courses. In every chapter, she recommends several writing strategies, each of which is embedded in social studies content, to show how thinking skills, mastery of information, and writing reinforce one another. The chapters of the book present a structured progression in which students become proficient at writing on a small scale—for example, through short writes, or paragraphs about clearly defined topics—as the foundation for more ambitious projects such as essays and research papers.
This book offers invaluable suggestions that will help social studies teachers in grades 7 through 12 to teach the skills of communication and self-expression that will enable students to achieve their college and career goals and become effective citizens with a voice in American society.
Joan Brodsky Schur is a social studies consultant, author, and teacher who taught both social studies and English to students in New York City for three decades. She is the author or co-author of six books for teachers on topics related to United States and world history, including Eyewitness to the Past: Strategies for Teaching American History in Grades 5–10.
NCSS Item number 205000
Price: $42.95 (list price)
$32.95 (NCSS member price)
Purchase 10 or more copies and save 20% off the non-member price. Order online at www. socialstudies.org/store. To order by phone, call 1-800-683-0812. To order by purchase order, please email as attachments to bookstore@ncss.org; fax to 301-779-8596, or mail to NCSS Publications, 7100 Old Landover Road Suite 500 Hyattsville MD 20785. Any order including a check as payment should be sent to: NCSS, P.O. Box 79078, Baltimore, MD 21279-0078.
Social
Studies for the Next
Generation:
Purposes, Practices, and Implications of the College, Career, and Civic Life (C3) Framework for Social Studies State Standard
NCSS Bulletin 113, 144 pp. (including introductory chapters), 2013.
The groundbreaking book featuring an inquiry-based framework for enhancing social studies state standards and linking social studies education to the Common Core State Standards for English Language Arts and Literacy in History/Social Studies. The book includes the entire C3 document, ”College, Career, and Civic Life (C3) Framework for Social Studies State Standards: Guidance for Enhancing the Rigor of K-12 Civics, Economics, Geography, and History,” which was produced by social studies curriculum experts working in collaboration with a Task Force of 15 professional organizations in the field of social studies. It also presents valuable introductory chapters that interpret the Framework, and discuss its context, the central concept of the Inquiry Arc, the connections between C3 and the Common Core standards, the links between C3 and the national social studies standards, and appropriate assessments for C3.
Member/List Price: $32.95 / $42.95
Purchase 10 or more copies and save 20% off the non-member price. Order online at www.socialstudies.org/store
To order by phone, call 1-800-683-0812. To order by purchase order, please email as attachments to bookstore@ncss.org; fax to 301-779-8596, or mail to NCSS Publications, 7100 Old Landover Road Suite 500 Hyattsville MD 20785. Any order including a check as payment should be sent to: NCSS, P.O. Box 79078, Baltimore, MD 21279-0078