Biodiversity in Focus: United States Edition


 Pond-cypress basin swamp NatureServe Global Status: Vulnerable (G3)
Photo by Galyna Andrushko
PRESIDENT


 Pond-cypress basin swamp NatureServe Global Status: Vulnerable (G3)
Photo by Galyna Andrushko
PRESIDENT
At this moment, species are going extinct faster than any time in human history. Given limited resources available for land management, conservation, and research, we need to make the most effective decisions to ensure the survival of natural communities. Data should be driving these decisions. NatureServe’s Biodiversity in Focus: United States Edition provides a sample of the best data available for decision-making for one of the most complex systems that exists: life on Earth.
To effectively protect biodiversity, we must understand it. This report considers and answers five essential questions about how to ensure biodiversity is adequately protected going forward:
1. How many species and ecosystems are at risk?
2. Are species and ecosystems adequately protected?
3. What are the major threats to biodiversity?
4. Where is imperiled biodiversity concentrated?
5. Where do we go from here?
The answers provide actionable insights that can inform high-level policies and forward-thinking initiatives.
The United States contains a vast array of species and ecosystems that are part of our shared cultural and natural heritage. This biological diversity on our state, tribal, and federal lands is intrinsically, ecologically, and economically important. I believe society has an obligation to protect all nature—both common and rare.
Throughout history, governments, organizations, and individuals have set aside large areas for environmental protection. However, many of those efforts have prioritized the conservation of inorganic features, such as scenic vistas, geologic formations, or glaciers, rather than the survival of imperiled species. As a result, many rare and endangered species remain unprotected and, often, so do the ecosystems of which they are a part. Given the scale of the current extinction crisis, now is the time to prioritize biodiversity conservation.
The United States is a global leader in science and was an early leader in conservation. If we are going to use our financial resources efficiently and effectively to maximize the value of policy initiatives such as America the Beautiful and Recovering America’s Wildlife Act, decision-makers need the most accurate and up-to-date information to inform conservation decisions.
NatureServe’s North American Network supports biodiversity conservation today through data and analyses that provide the insights needed to protect the well-being of our plants, animals, and natural communities for present and future generations.


Optimistically yours,


 Sean T. O’Brien, Ph.D. President and CEO
P.S. Visit www.natureserve.org/bif to view an online version of this report, a detailed appendix, corresponding data, websites, and footnotes.

For nearly 50 years, NatureServe has developed data and methods to comprehensively assess the conservation status of North American plant and animal species. As the authoritative source for data on U.S. and Canadian biodiversity, NatureServe is uniquely suited to answer questions about species and ecosystems and the extent to which they are threatened. The NatureServe Network is comprised of more than 60 member programs which are predominantly natural heritage programs and conservation data centers within state and provincial agencies and universities. Together, we develop, curate, analyze, and share biodiversity information to support informed decisions about managing, protecting, restoring, and conserving our natural heritage.
NatureServe’s conservation status ranks are widely used throughout the conservation community and are regarded as highly credible by scientists, government agencies, and privatesector organizations. We provide conservation status information at multiple geographic scales to support state, regional, or national level conservation decisions. These assessments are freely available on NatureServe Explorer, which contains information on tens of thousands of species and ecosystems.1
NatureServe assesses species and ecosystems as imperiled or at risk based on a consistent methodology.2 We rank species and ecosystems—the unique vegetation types that provide habitats for species—into categories ranging from Possibly Extinct (H) to Critically Imperiled (1) to Secure (5). Each assigned conservation status rank is determined at three geographic scales: global, national, and subnational (e.g., state level)— G, N, S ranks respectively.3
1 All conservation status ranks and supporting documentation for the species and ecosystems tracked by NatureServe are available at explorer.natureserve.org.
2 The term imperiled is used throughout this report. In instances where imperiled refers to the conservation rank, it appears as Imperiled (G2).
3 Additional ranks designate Presumed Extinct species (GX/NX/SX); Unrankable species (GU/NU/SU); species not yet ranked (GNR/NNR/SNR); and species for which ranks are not applicable because, for example, the species is a hybrid or vagrant to the area (GNA/NNA/SNA). More information on NatureServe’s ranking methodology can be found at explorer.natureserve.org/AboutTheData/DataTypes/ConservationStatusCategories.

Karner blue (Plebejus samuelis)
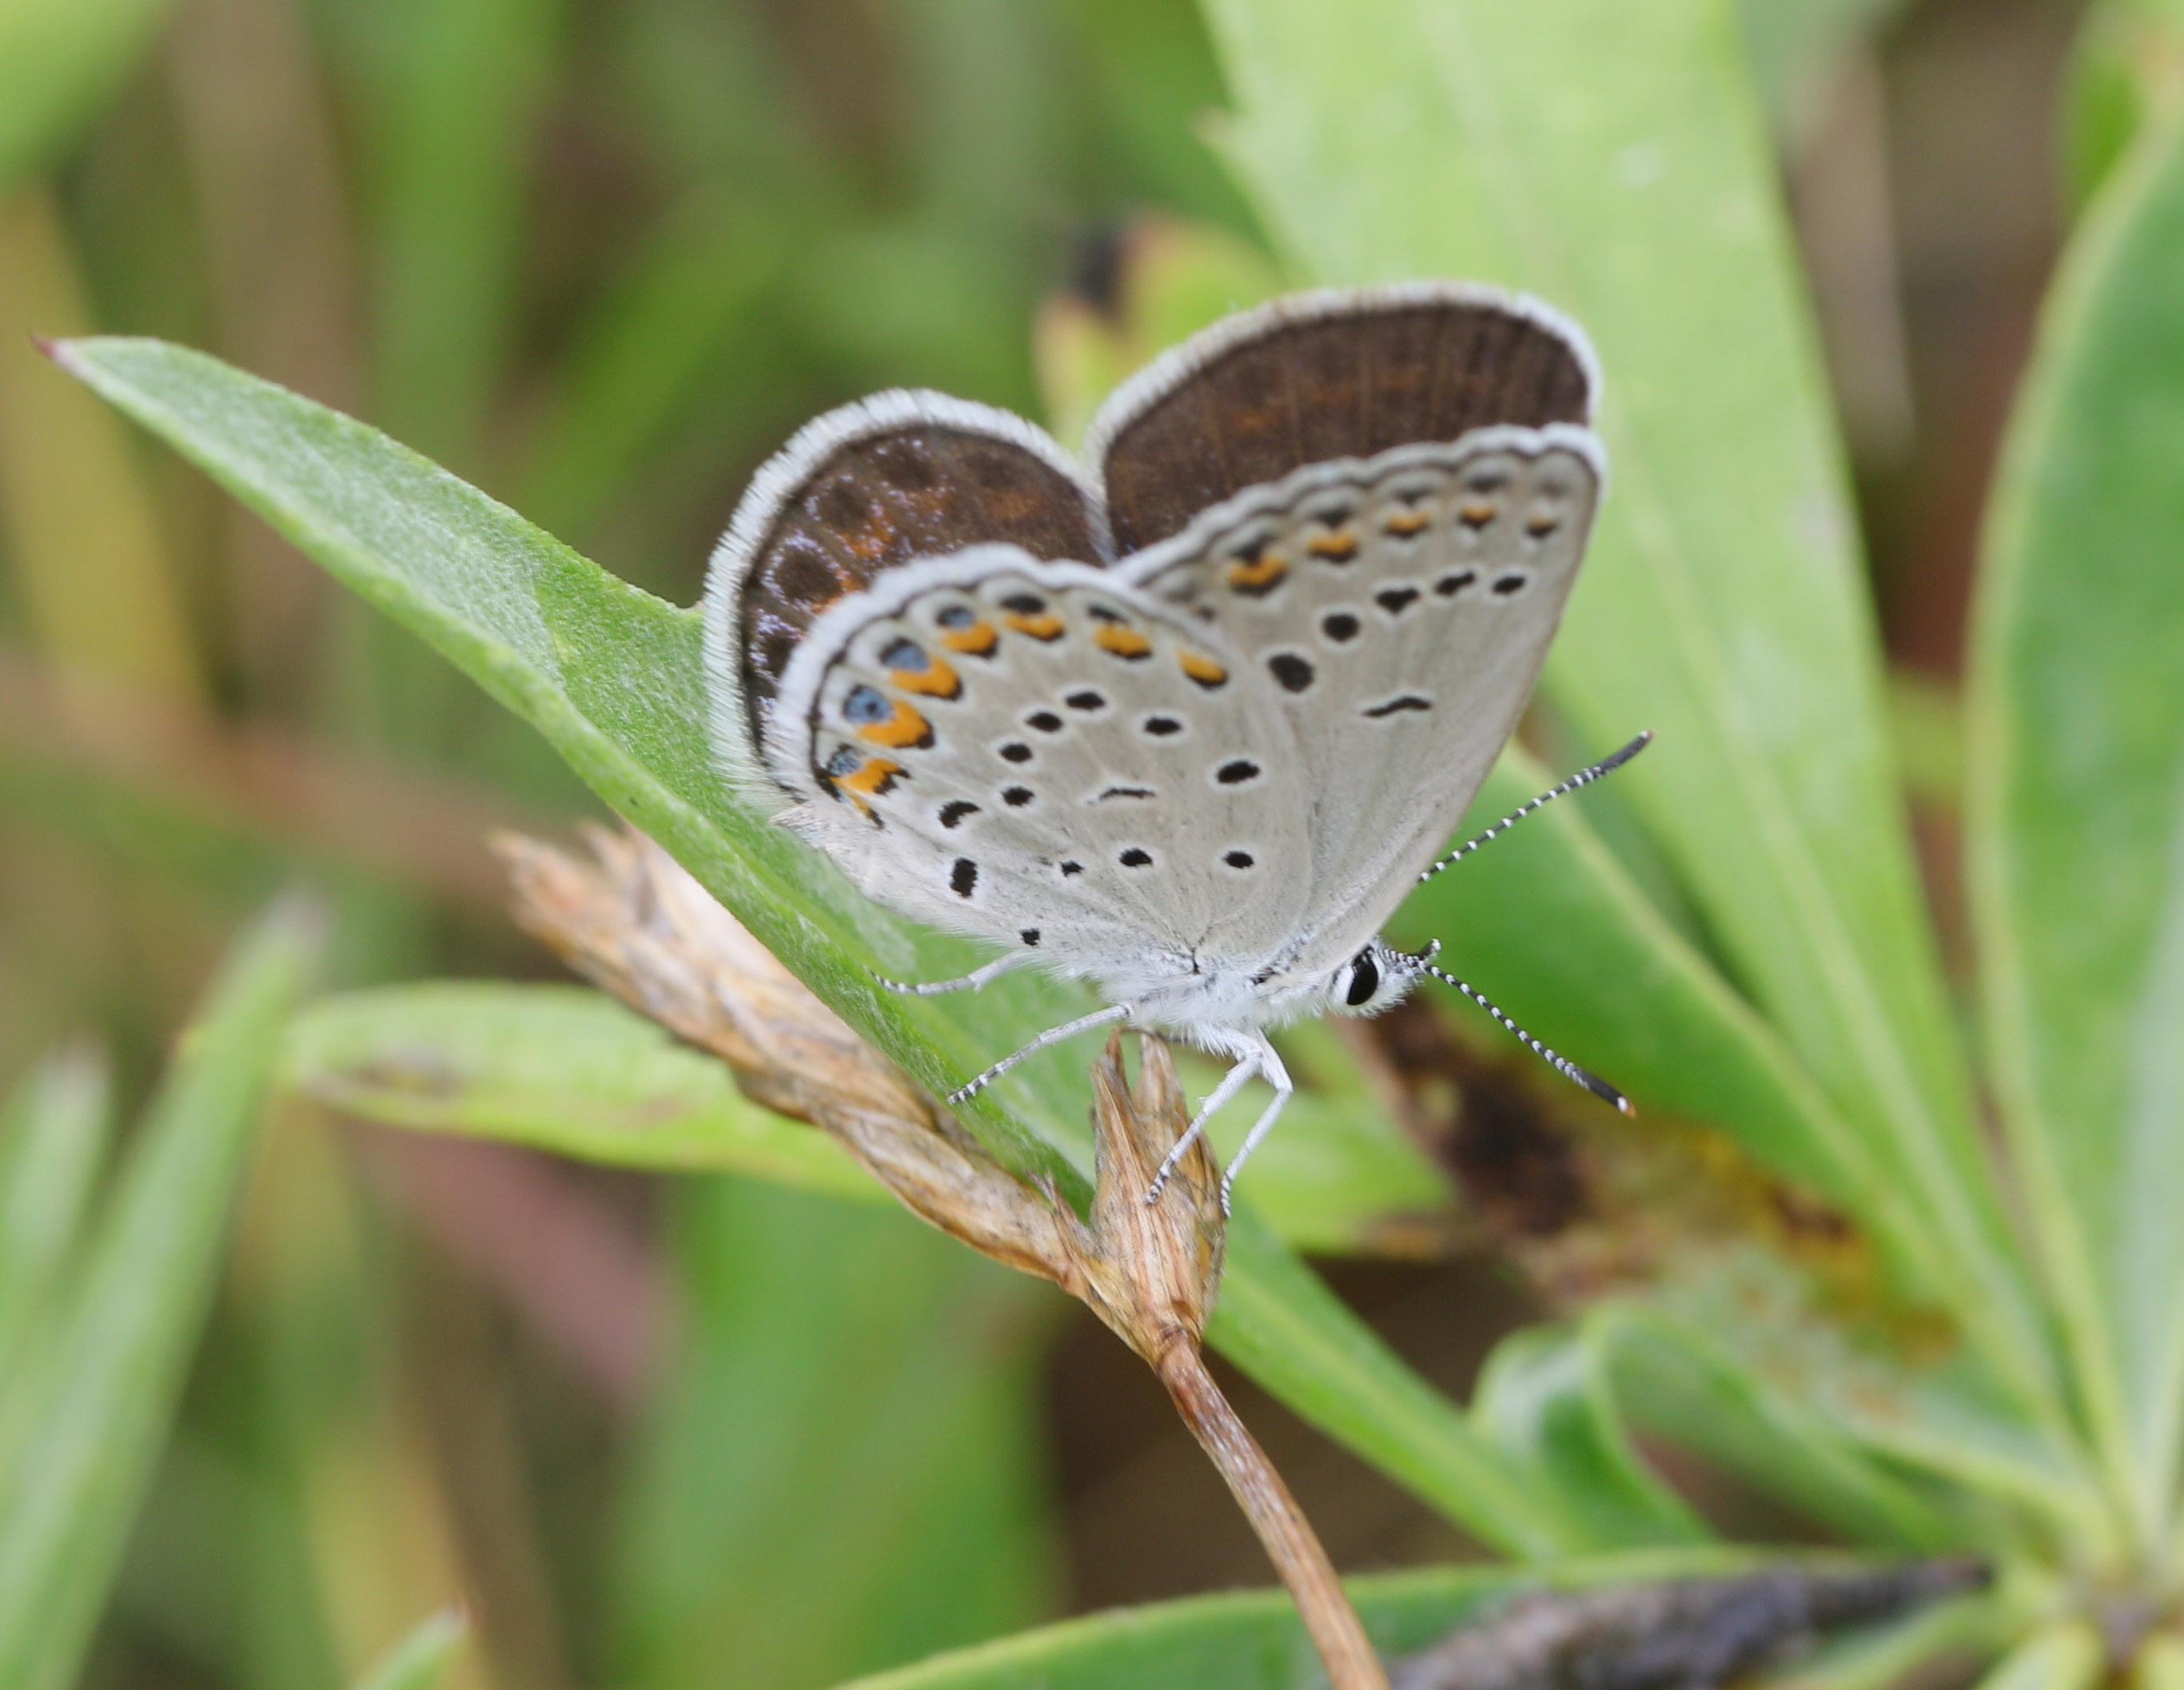
NatureServe Global Status: Critically Imperiled (G1)
ESA Listing Status: Endangered


Imperiled species are defined as those that are at high risk of extinction, which equates to NatureServe global conservation status ranks of Possibly Extinct (GH), Critically Imperiled (G1), or Imperiled (G2). We define at-risk species as all those that are imperiled (GH, G1, G2) as well as those that are Vulnerable (G3) and could become imperiled without intervention.
Possibly Extinct — known only from historical occurrences but still some hope of rediscovery


Critically Imperiled — at very high risk of extinction due to factors such as a very restricted range, very few populations or occurrences, very steep declines, and/or very severe threats
Imperiled — at high risk of extinction due to factors such as a restricted range, few populations or occurrences, steep declines, and/or severe threats
Vulnerable — at moderate risk of extinction due to factors such as a fairly restricted range, relatively few populations or occurrences, and recent and widespread declines and/or threats
Apparently Secure — at fairly low risk of extinction due to factors such as an extensive range and/or many populations or occurrences, but with possible cause for some concern because of recent local declines and/or threats
Secure — at very low risk of extinction due to a very extensive range, abundant populations or occurrences, and little to no concern about declines or threats
For nearly 50 years, NatureServe conservation status ranks have been accepted by the U.S. government as a tool for identifying at-risk species and ecosystems and for informing both policy and on-the-ground management actions. While the federal Endangered Species Act (ESA) also focuses on species that are at risk, limits on staff and funding have precluded federal assessments of all the species considered at risk using NatureServe methodology. Our status ranks augment federal listings by offering a framework for evaluating the health of additional species and ecosystems on state, national, and global scales. Moreover, they provide status information for species that have not been listed or that are being evaluated for listing under the ESA. Conservation status ranks are calculated by using a replicable, openly available methodology that relies on published information and on data and analyses by experts at NatureServe and our member programs in each state.4 Ecosystems are assessed based on their risk of range-wide collapse. Some ecosystems, such as freshwater lakes and streams, caves, or coastal marine ecosystems, are not addressed in this report.
Imperiled Vulnerable Apparently Secure
At Risk
While both terrestrial and aquatic species are evaluated using our system, at the ecosystem level, NatureServe focuses on terrestrial communities. To define ecosystem units, NatureServe uses the National Vegetation Classification (NVC), a system to categorize ecosystem types that was developed by NatureServe and the Network in collaboration with federal agencies. The NVC is coordinated with the Federal Geographic Data Committee and the Ecological Society of America and is a standard for reporting on vegetation types.5
The NVC is hierarchical, with finer-scale units (e.g., California coastal redwood forests) nested within broader-scale units (e.g., temperate forests, boreal forests, and woodlands). In this report, we use the word ecosystem to refer to any of the 398 terrestrial NVC groups, a mid-scale classification unit within the hierarchy. NatureServe has developed provisional conservation status ranks for about 90% of the NVC groups, and these are reported here. Similar to species, NVC ecosystems with a global conservation status rank of G1 or G2 are considered imperiled, and ecosystems ranked as G1, G2, or G3 are considered at risk.
5 See Franklin et al. “Building the United States National Vegetation Classification.” Annali di Botanica 2 (2012): 1–9, rosa.uniroma1.it/rosa04/annali_di_botanica/article/view/9261.


Number of Species (Best Estimate of % At Risk)
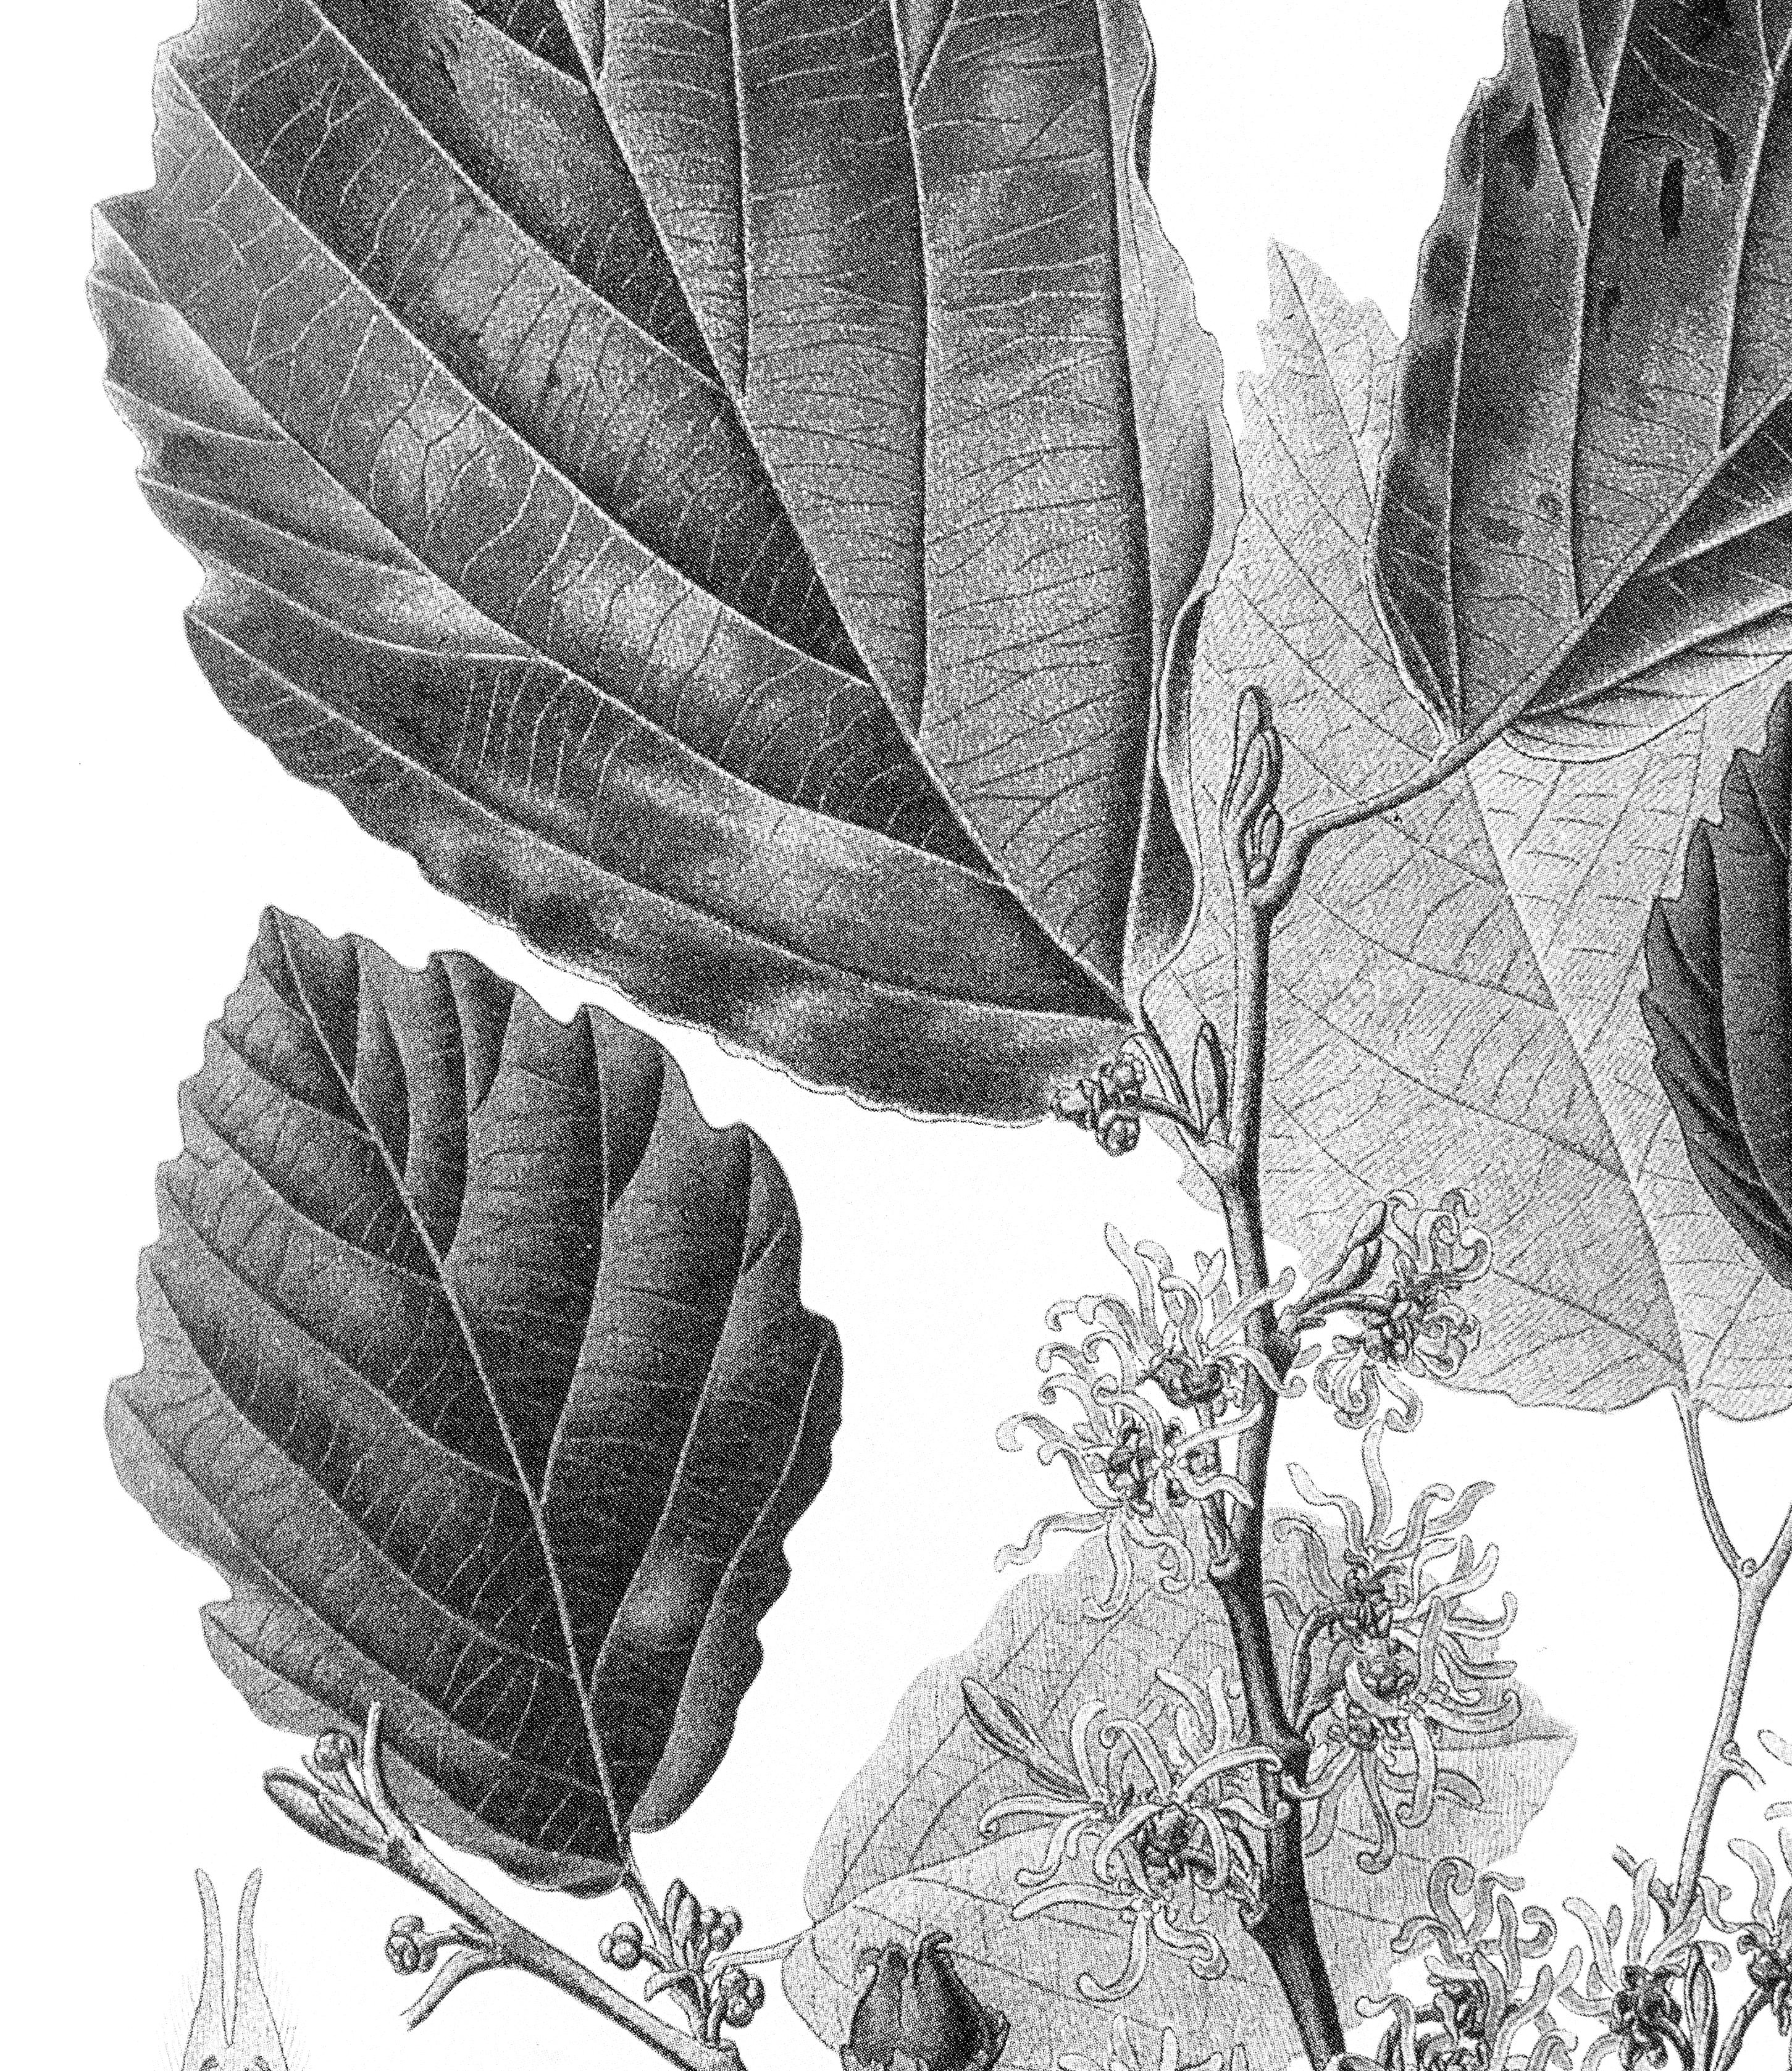
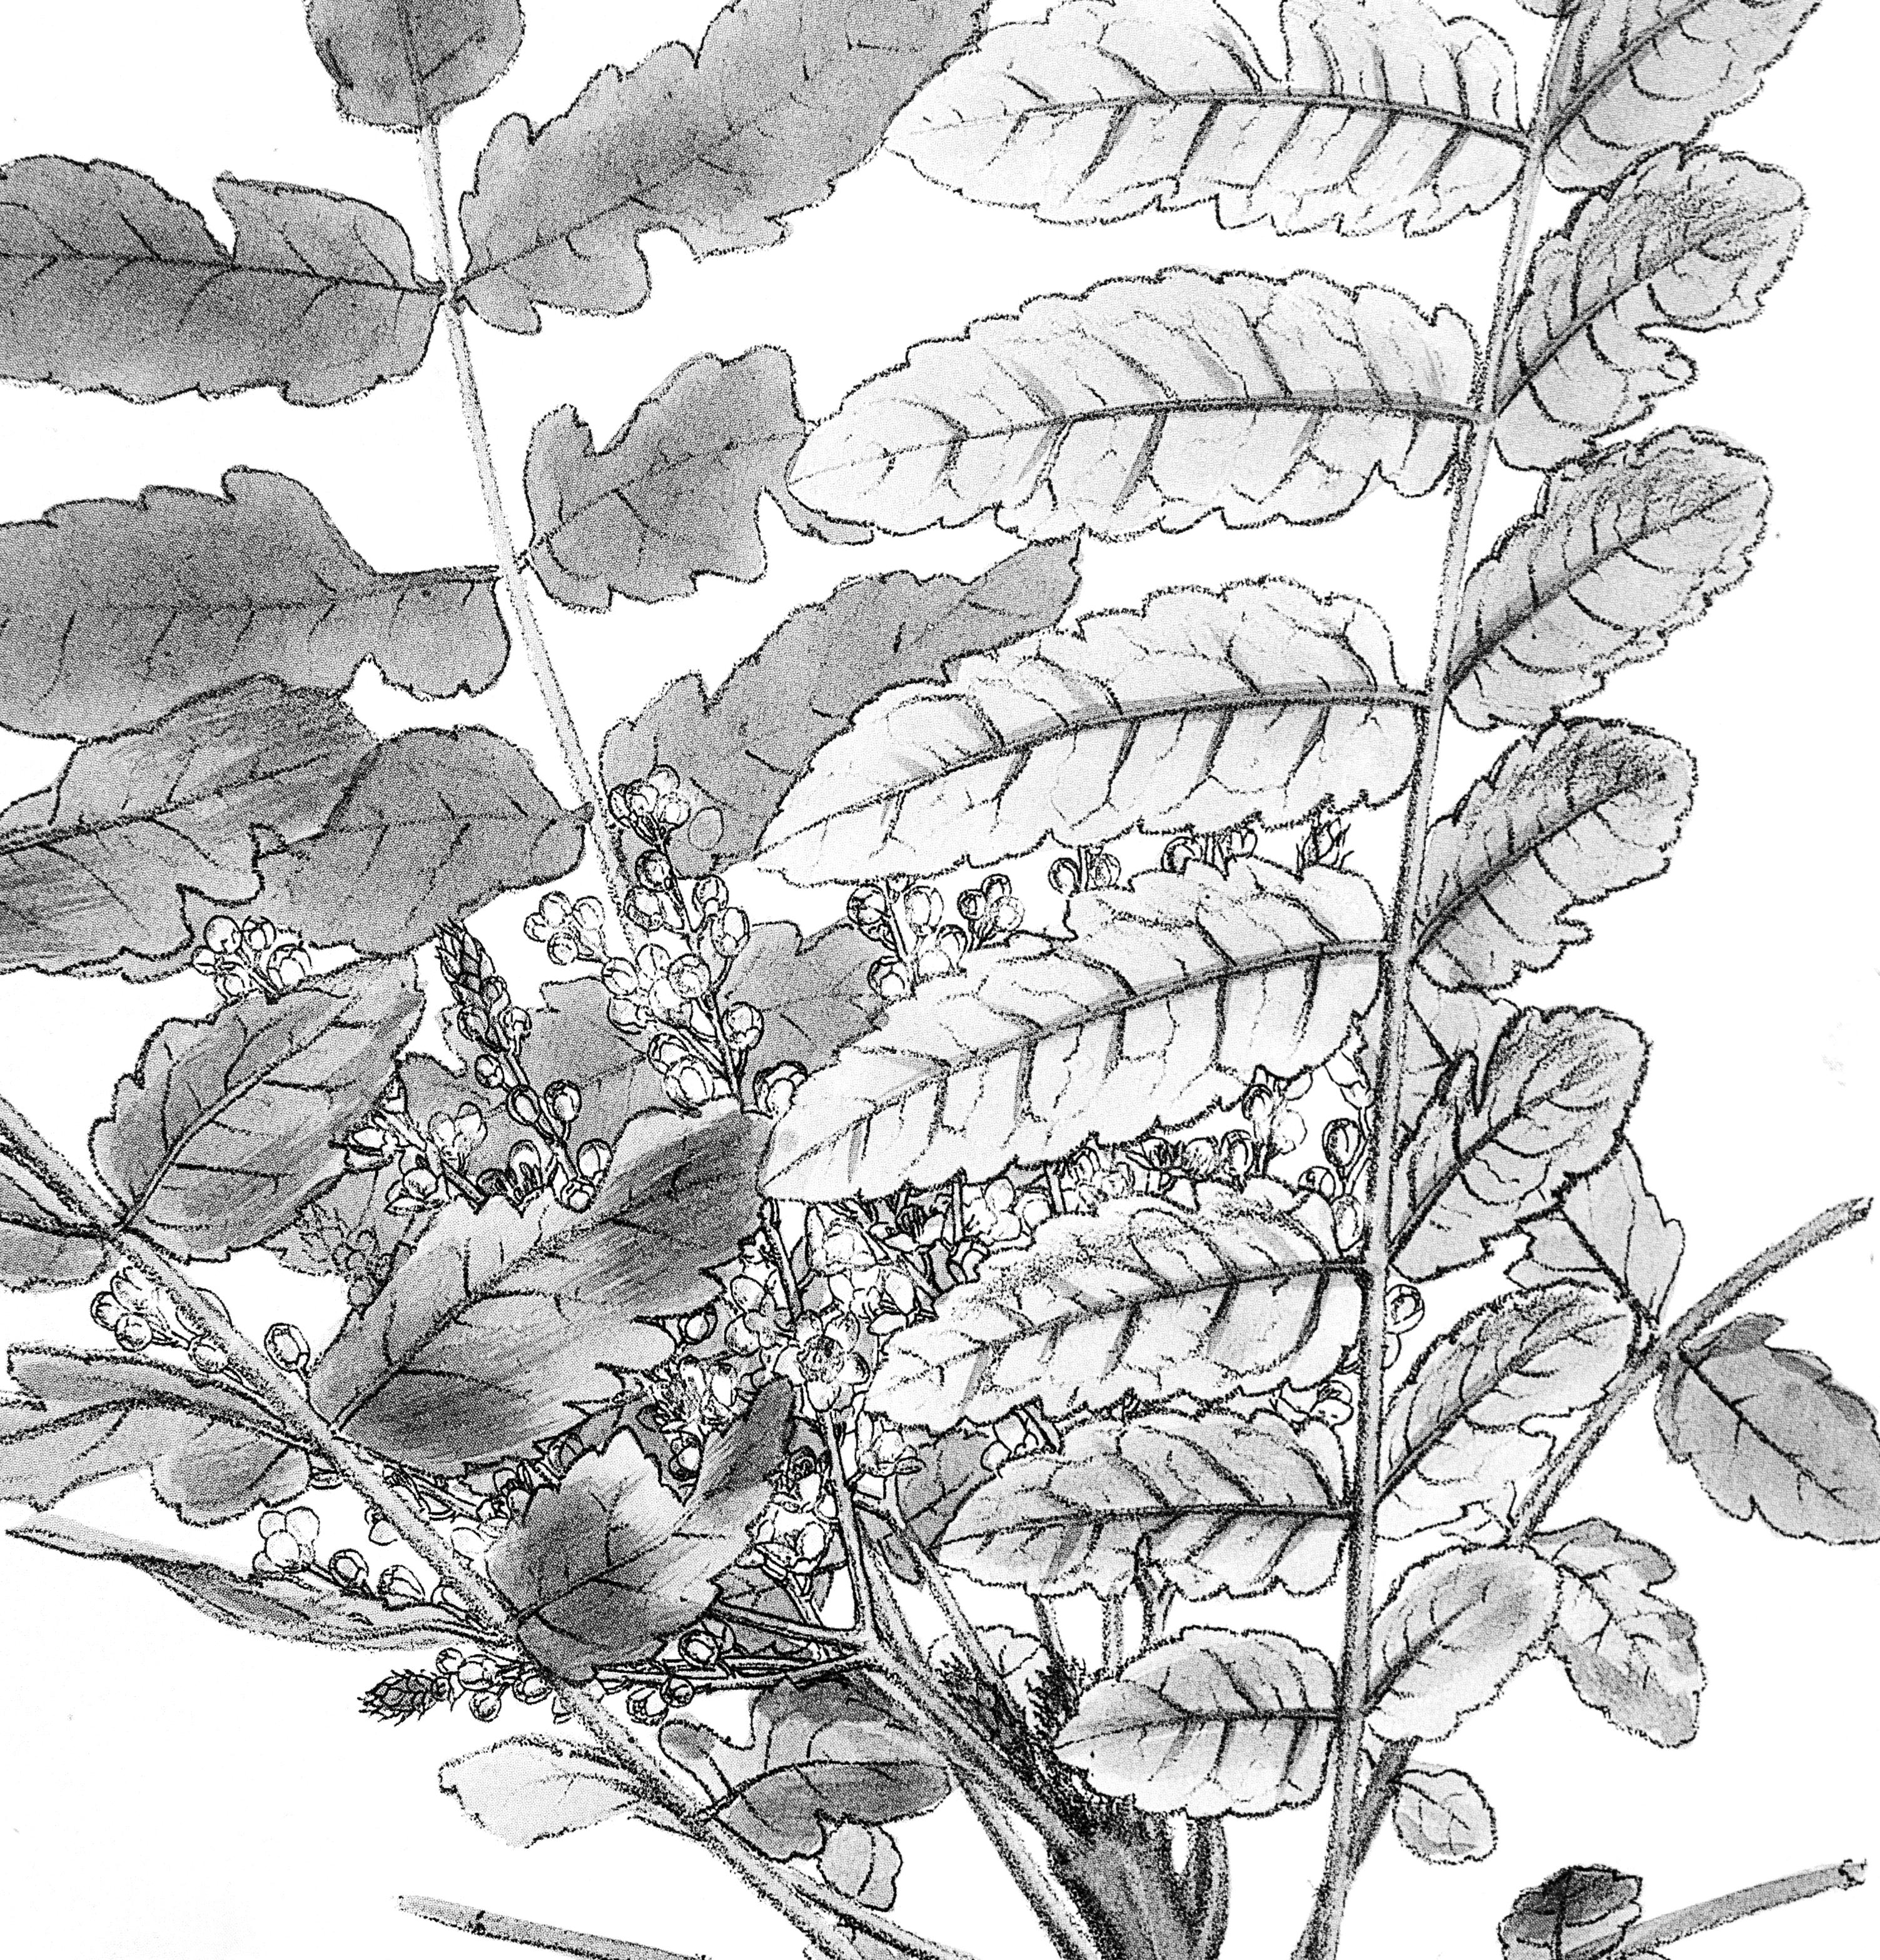
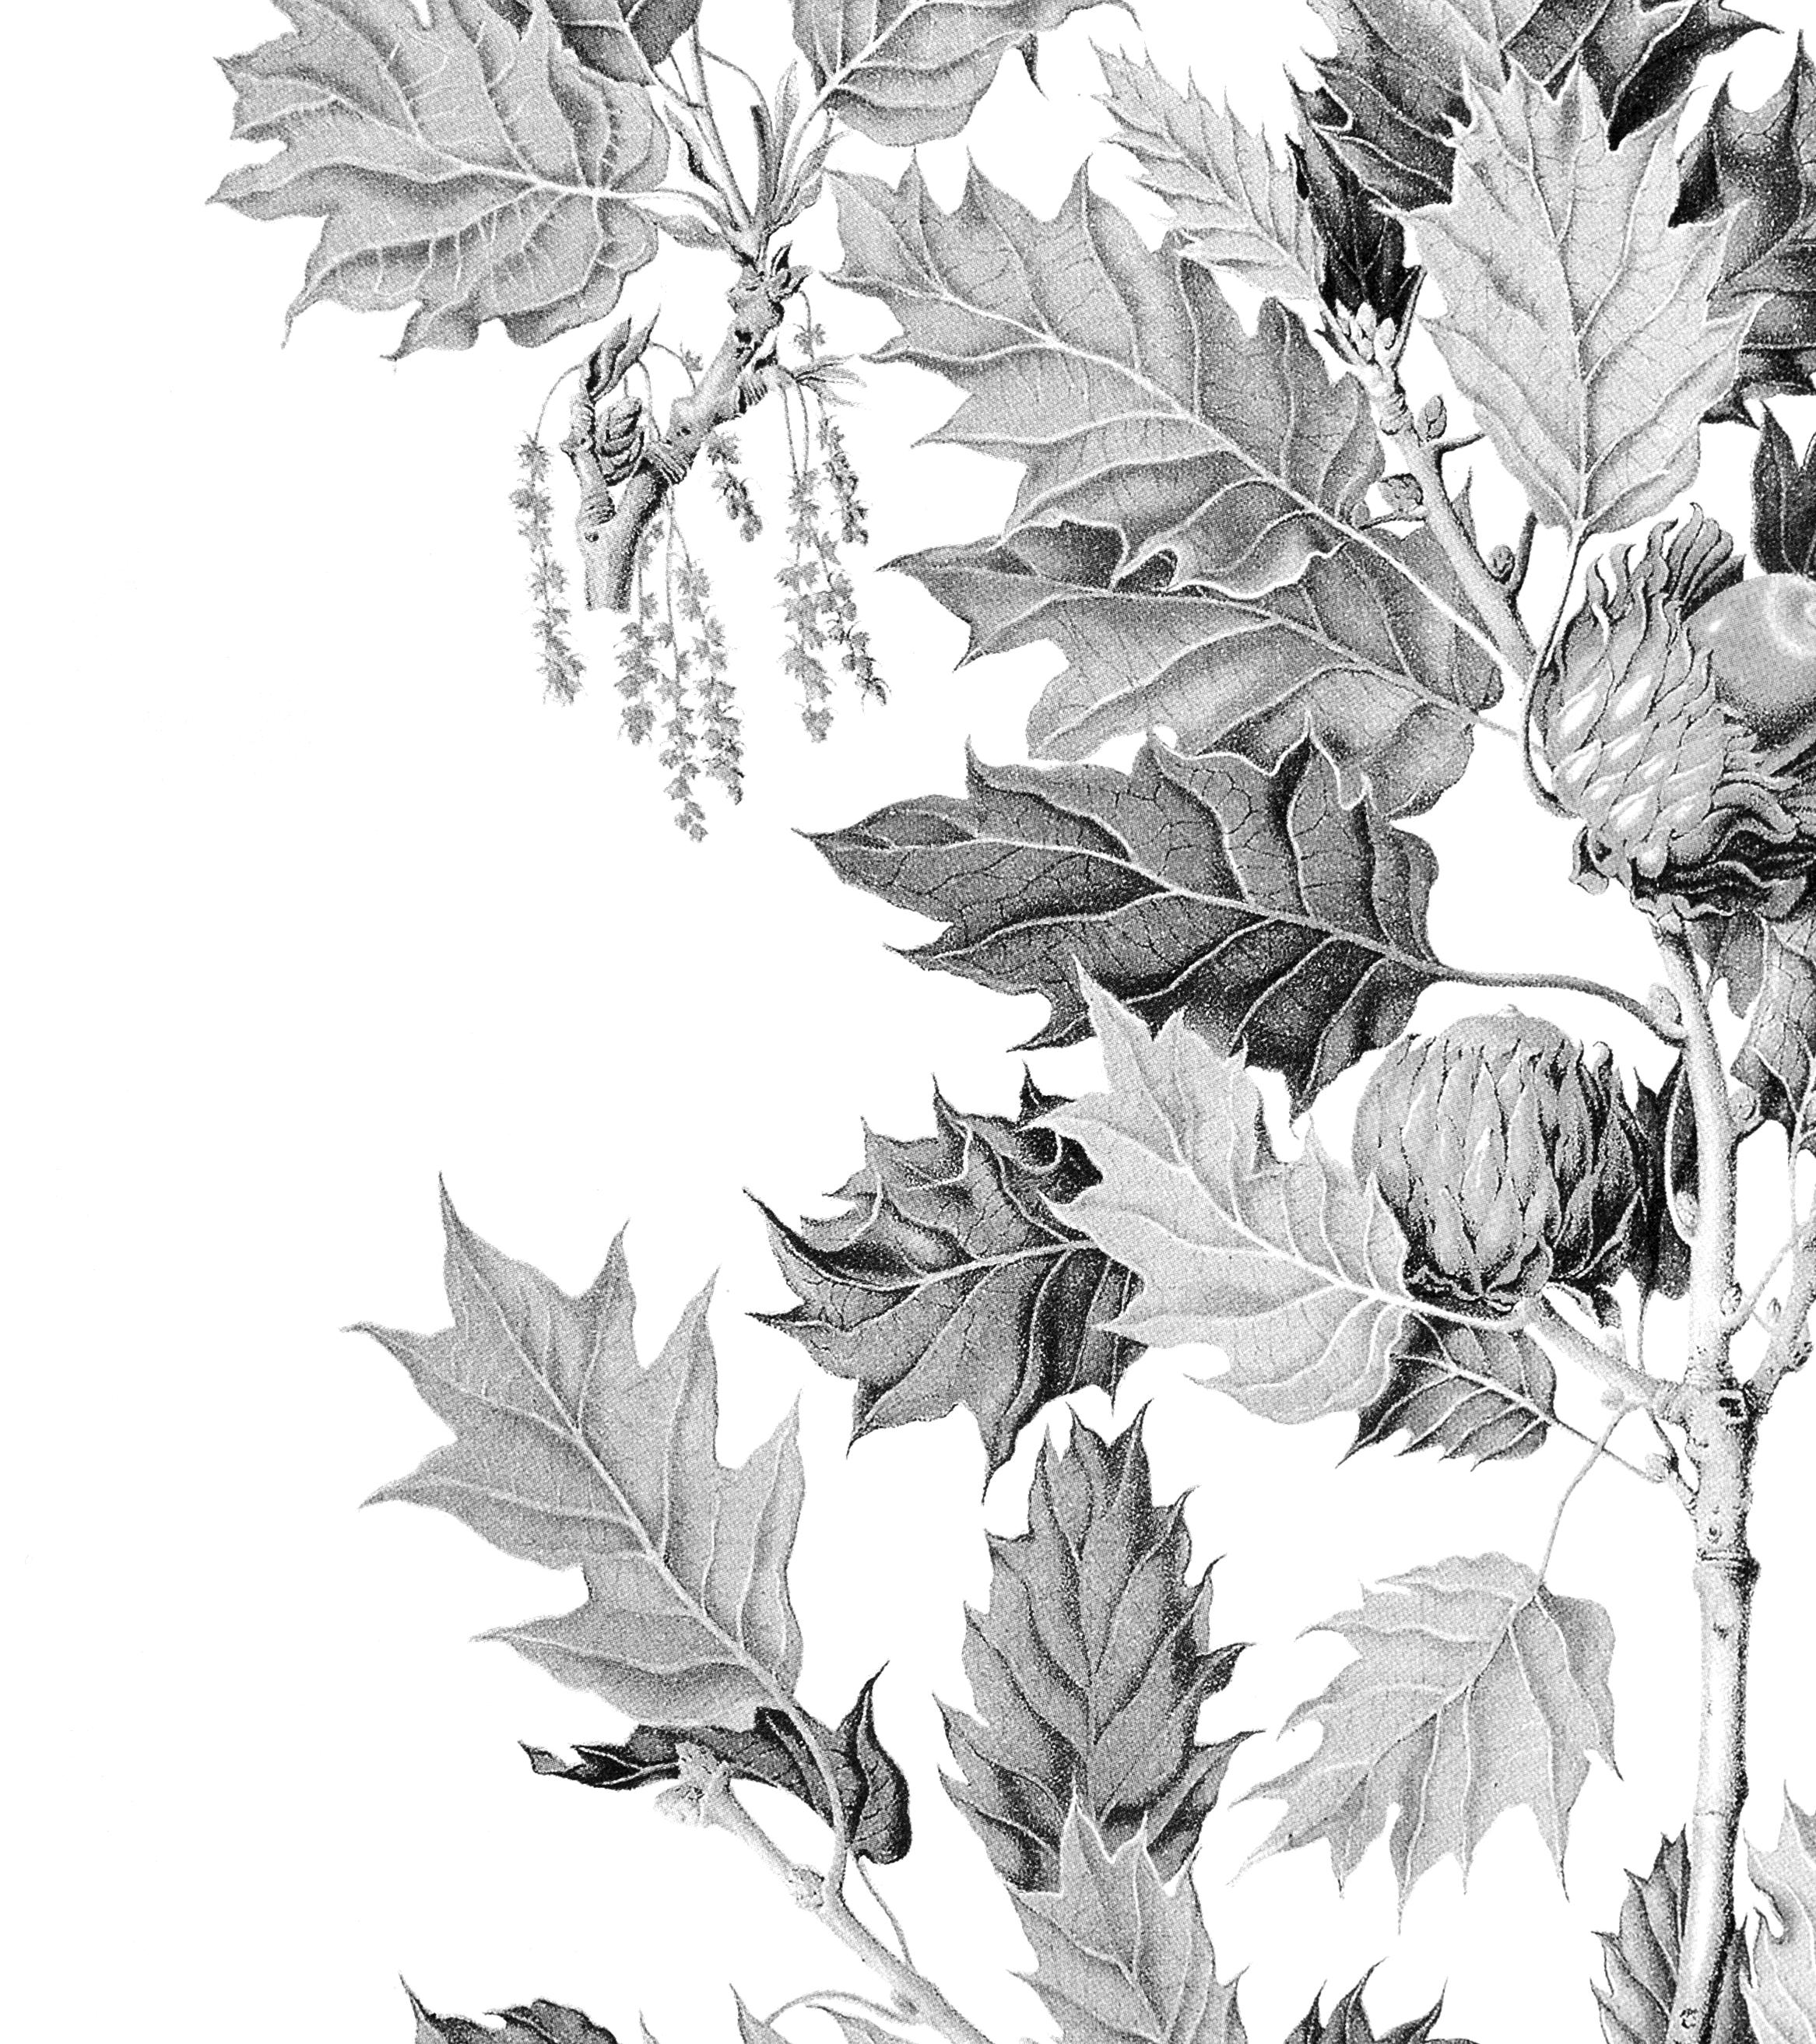
Diverse and healthy plant communities provide the foundation for abundant wildlife and resilient ecosystems. However, according to NatureServe data, 34% of all plant species in the United States are at risk of extinction.6 This is an alarming general finding, but certain taxa face even greater threats. For example, 48% of cactus species are at risk of extinction, while around 200 tree species (about 20%) are at risk of extinction. Of the hundreds of grass species that form our nation’s great prairies
and marshes, about 19% are at risk of vanishing forever. Preventing plant extinction is essential to maintaining ecosystem function and the services that wildlife and people rely upon.
6 This analysis is based on information extracted from NatureServe’s database of biodiversity in 2022. The highlighted groups of species do not represent all kinds of plants but include examples of native plant groups that are likely to be familiar to people throughout the United States. The reported percentage of species at risk is a best estimate that assumes that the same percentage of unassessed species (GU/GNR) are at risk as species whose conservation status has been assessed (G1-G5 species); see online appendix for more information. www.natureserve.org/bif
NatureServe
ESA


Rusty-patched


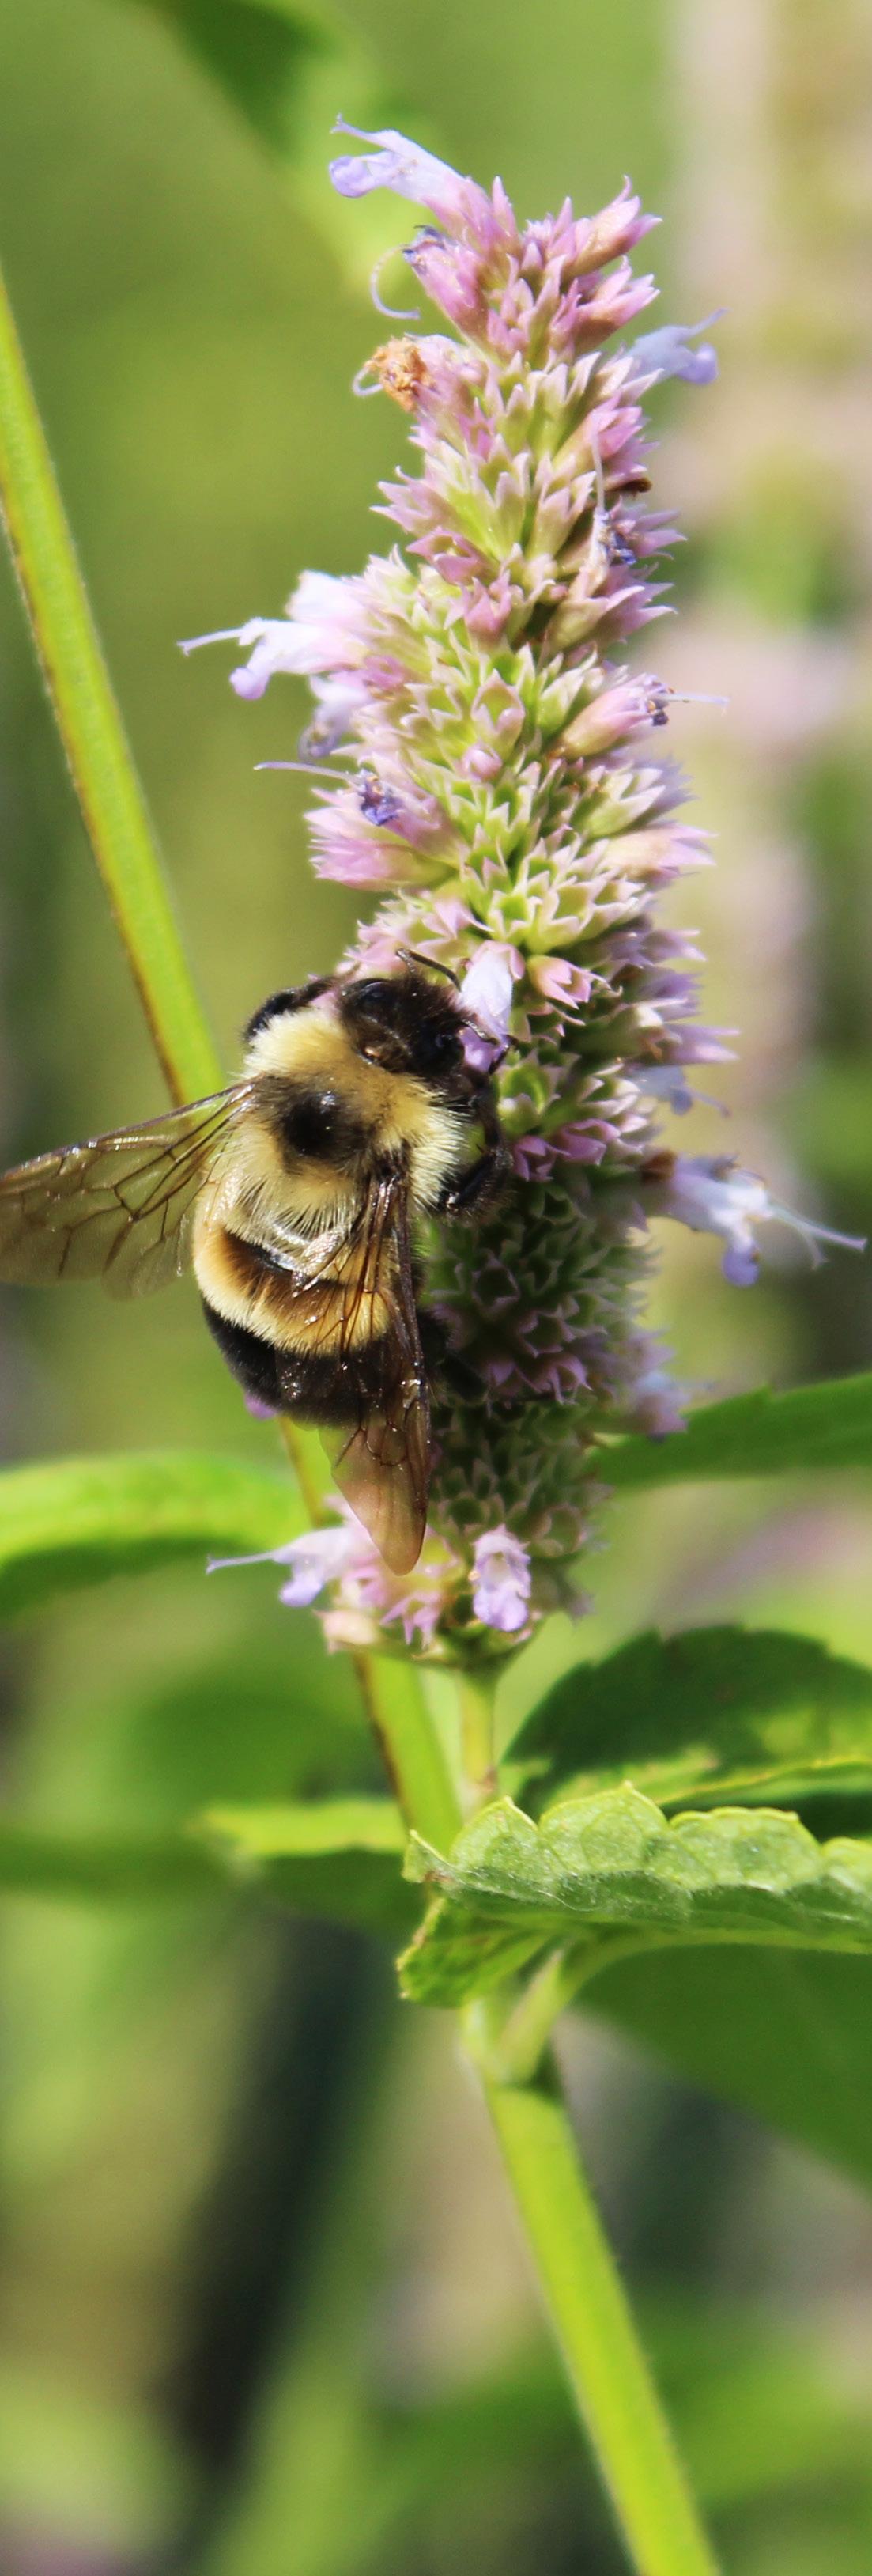
An alarming percent of animal species are at risk of extinction in the United States— 40%, according to our estimate.7 As a group, species associated with fresh water, including amphibians, snails, mussels, crayfish, and many aquatic insects, have the highest percentage of at-risk species, highlighting the importance of conservation strategies to protect freshwater ecosystems. Among pollinators, bees are particularly threatened, with 37% of assessed species at risk. The conservation needs of these, and other invertebrate species, are often overlooked, yet many invertebrates are integral to maintaining the ecological functions of freshwater and terrestrial ecosystems.
7 This analysis is based on information extracted from NatureServe’s database of biodiversity in 2022. It includes animals in comprehensively assessed taxonomic groups native to all 50 states. The reported percentage of species at risk is a best estimate that assumes that the same percentage of unassessed species (GU/GNR) are at risk as species whose conservation status has been assessed (G1-G5 species); see online appendix for more information. www.natureserve.org/bif
NatureServe
NatureServe Global Status: Critically Imperiled (G1)

ESA Listing Status: Endangered


Overall, 41% of the ecosystems in the United States are known to be at risk of range-wide collapse due to extensive threats such as land-cover conversion.8, 9 Tropical ecosystems in the U.S. are all under substantial risk, but account for relatively small proportions in number and area. Temperate grasslands, boreal grasslands, and shrublands stand out among highly threatened ecosystems that extend over vast areas of the country, with 51% of the 78 grassland types known to be at risk of range-wide collapse. Temperate forests, boreal forests, and woodlands have also experienced multiple pressures, leading to an at-risk status for 40% of the 107 types of native U.S. forests.

Documenting the conservation status for ecosystems supports efforts to prioritize conservation actions that can restore imperiled and at-risk ecosystems. Land management decisions made at the ecosystem level benefit both ecosystems and the species they support.
8 Collapse involves a transformation of identity, loss of defining features, and/or replacement by a novel ecosystem. It occurs when all ecosystem occurrences lose defining biotic or abiotic features and when characteristic native biota are no longer sustained.


9 This analysis is based on the provisional global conservation rank of NVC groups occurring in all 50 U.S. states, as extracted from NatureServe’s database of biodiversity in 2022.

All Ecosystems
Tropical Forests
Tropical High Montane Grasslands and Shrublands

Tropical Savannas, Grasslands, and Shrublands


Number of Ecosystems (% At Risk)
Central and northern tallgrass oak openings and barrens
NatureServe Global Status: Imperiled (G2)
Temperate Forests, Boreal Forests, and Woodlands
Shrub and Herb Wetlands
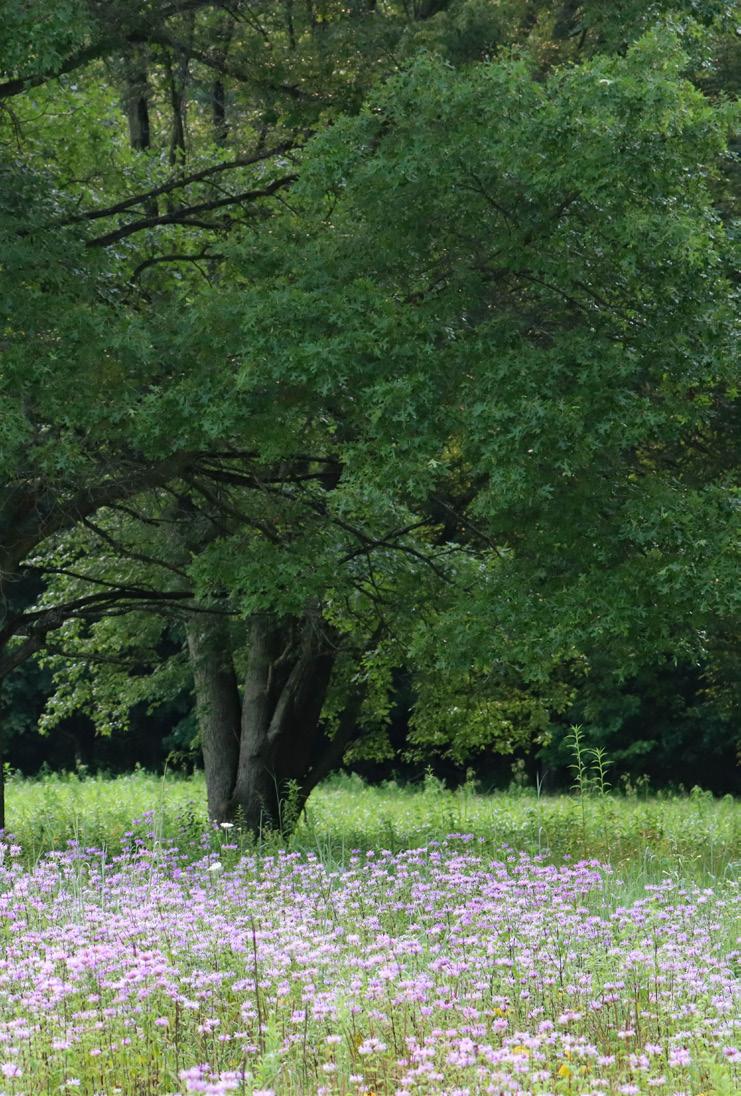

Temperate Grasslands, Boreal Grasslands, and Shrublands Warm Deserts
Cool Semi−deserts
NatureServe Global Status: Imperiled (G2)
details on this methodology at www.natureserve.org/bif.


13 Hunter Jr., Malcom L. “A Mesofilter Conservation Strategy to Complement Fine and Coarse Filters.” Conservation Biology 19, no. 4 (2005): 1025-1029. doi.org/10.1111/j.1523-1739.2005.00172.x.
14 This analysis is based on the modeled distribution of habitats for select imperiled species in the contiguous United States. Vulnerable (G3) species and certain invertebrate taxonomic groups are not included because of a lack of comprehensive habitat maps for these taxa. See Hamilton et al. “Increasing Taxonomic Diversity and Spatial Resolution Clarifies Opportunities for Protecting US Imperiled Species,” Ecological Applications 32 no. 3 (April 2022): e2534, esajournals.onlinelibrary.wiley.com/doi/full/10.1002/eap.2534.


15 Threats data were analyzed based on NatureServe’s database of biodiversity in 2022.


16 Habitat loss is presented for NVC subclasses. See Comer et al. “Long-Term Loss in Extent and Current Protection of Terrestrial Ecosystem Diversity in the Temperate and Tropical Americas.” PLoS One 15, no. 6 (June 2020): e0234960, journals.plos.org/plosone/article?id=10.1371/journal.pone.0234960.


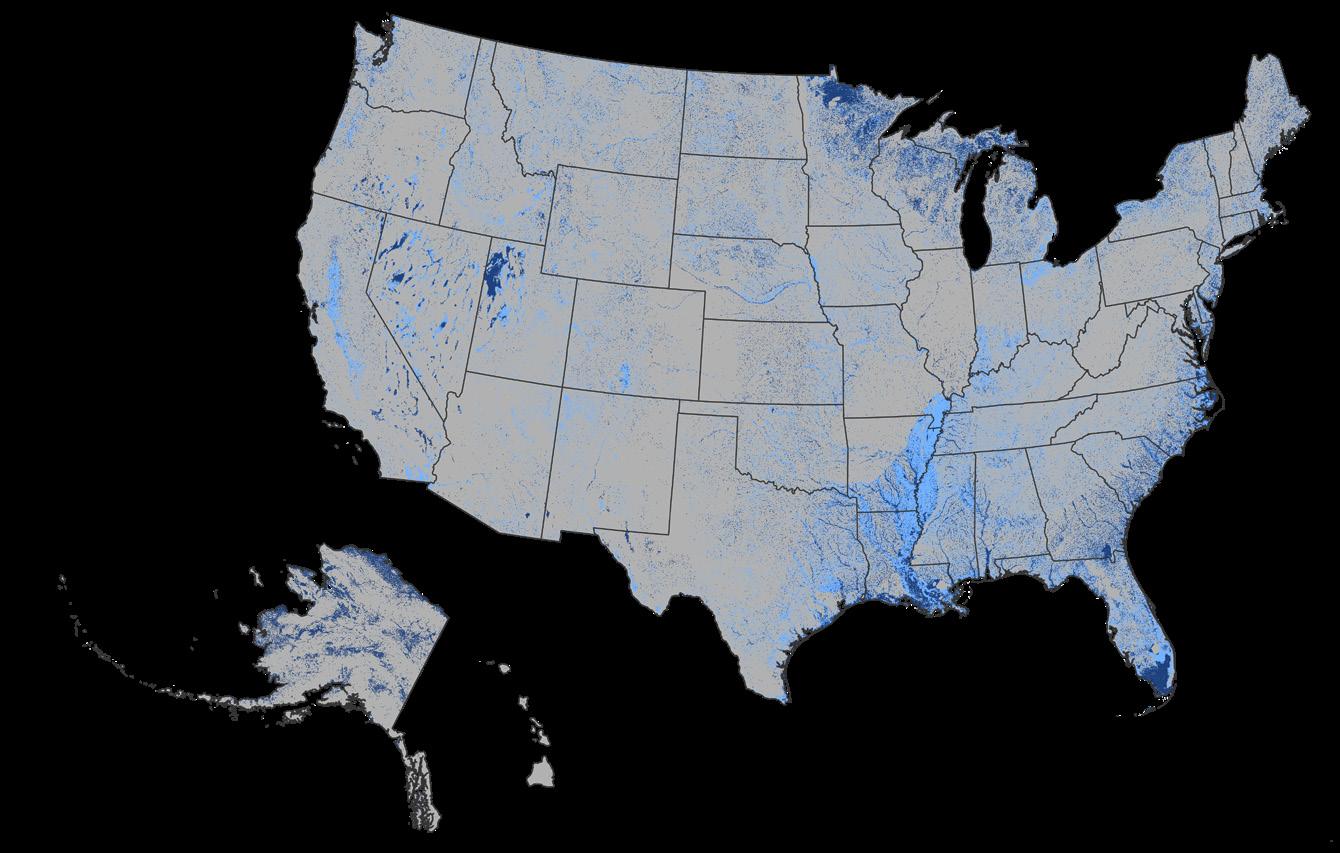




17 Note that the genera of yellow-faced bees, the only native bees in Hawaiʻi, have not been comprehensively assessed and are not included in this analysis. For more information on included and excluded species, see online appendix. www.natureserve.org/bif


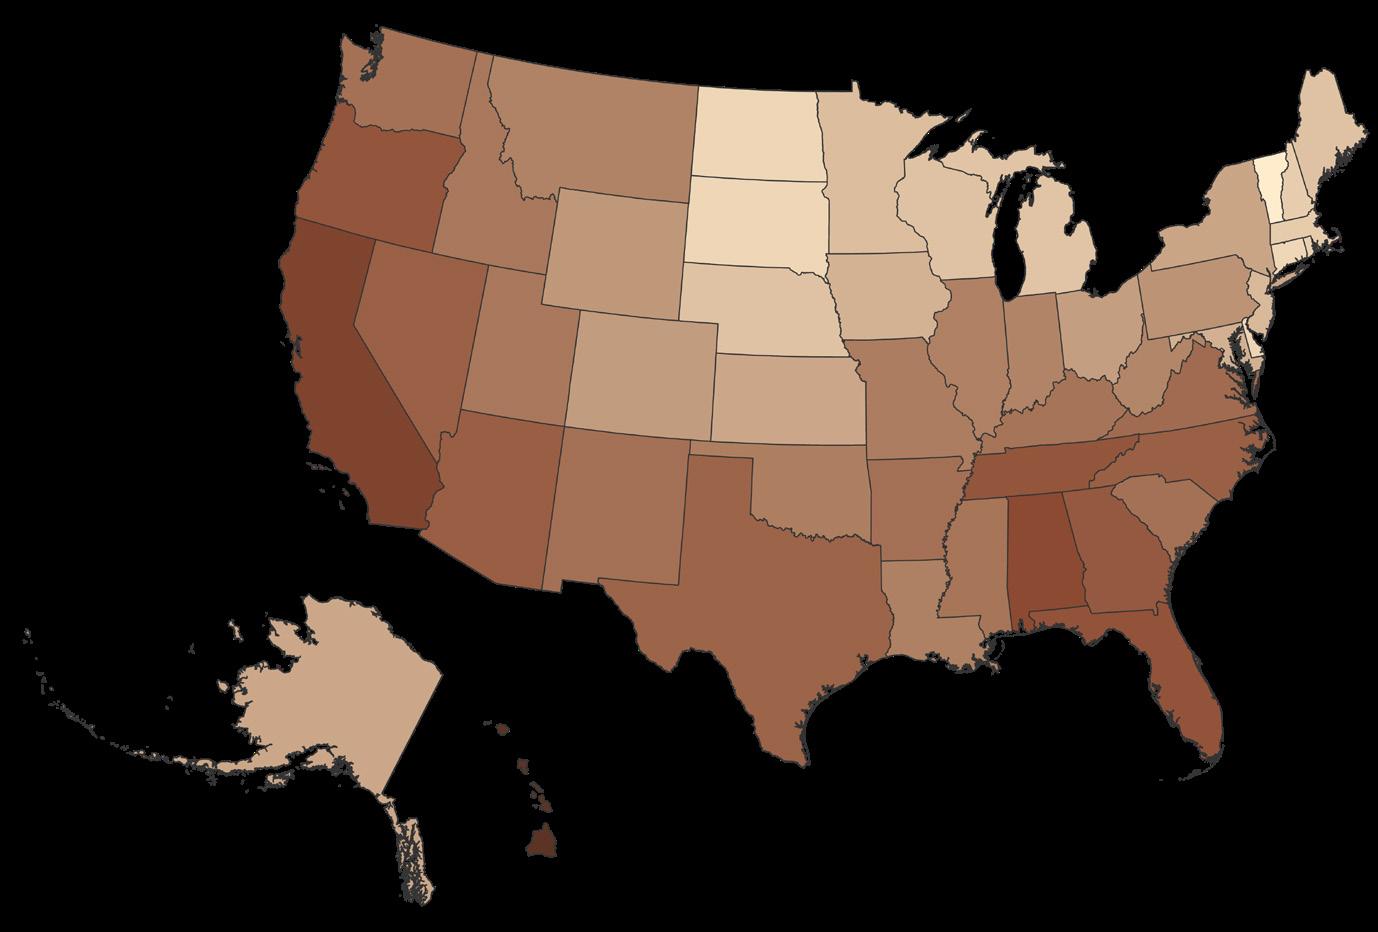
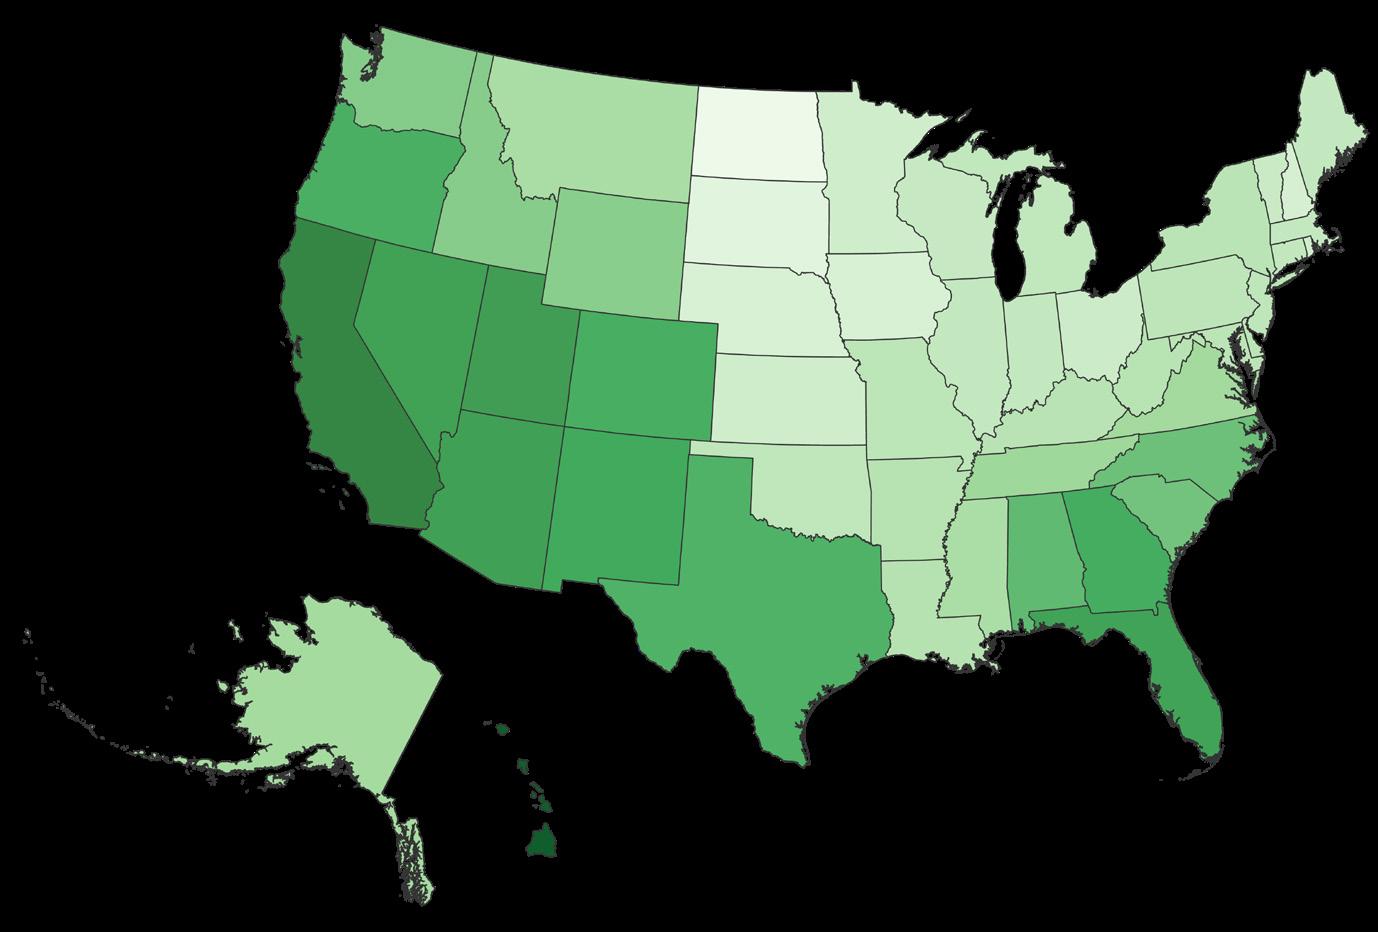
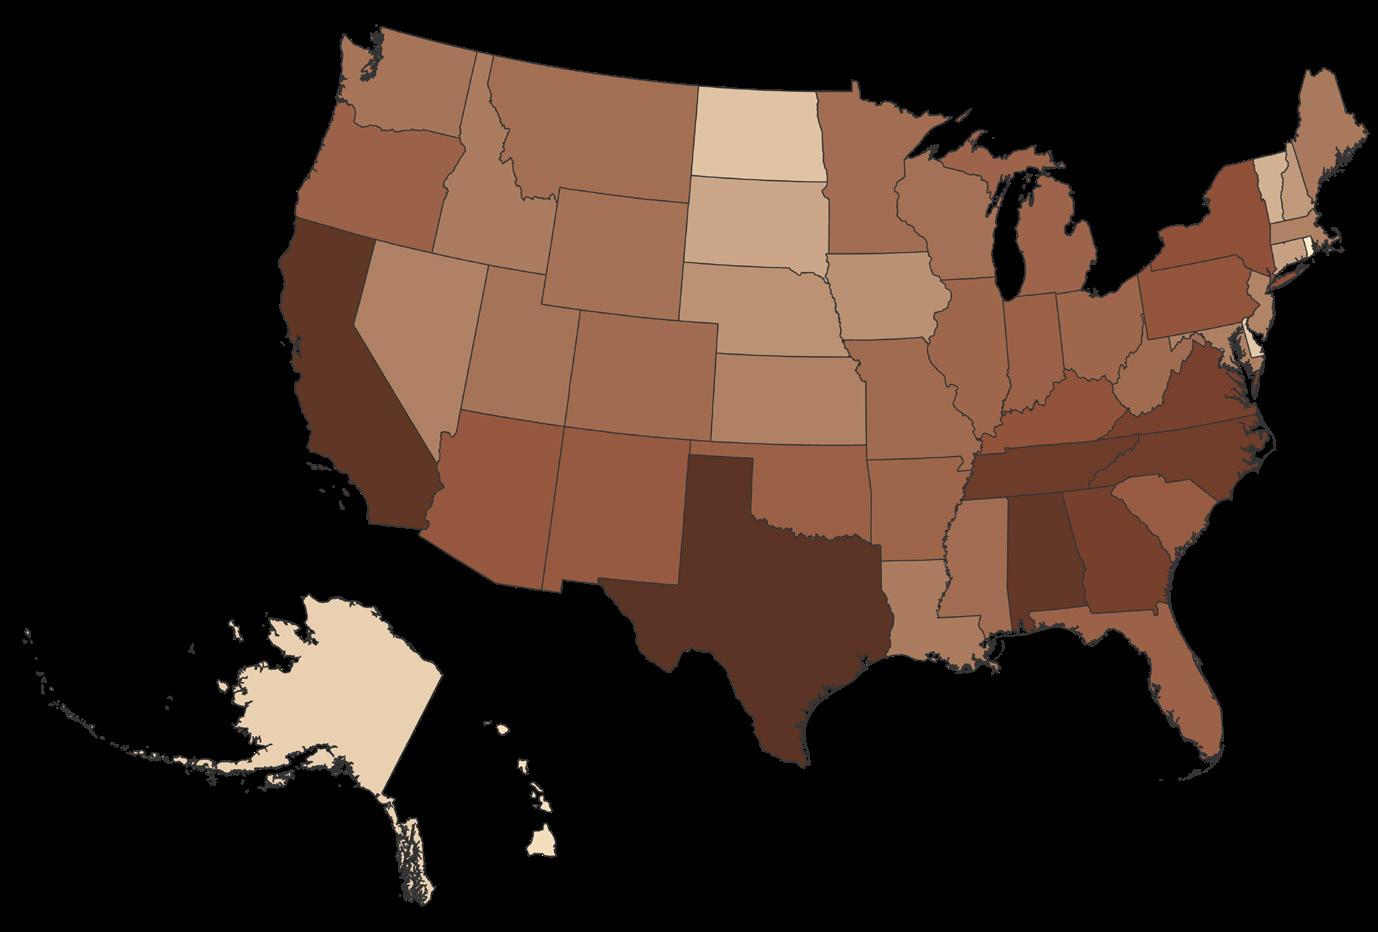
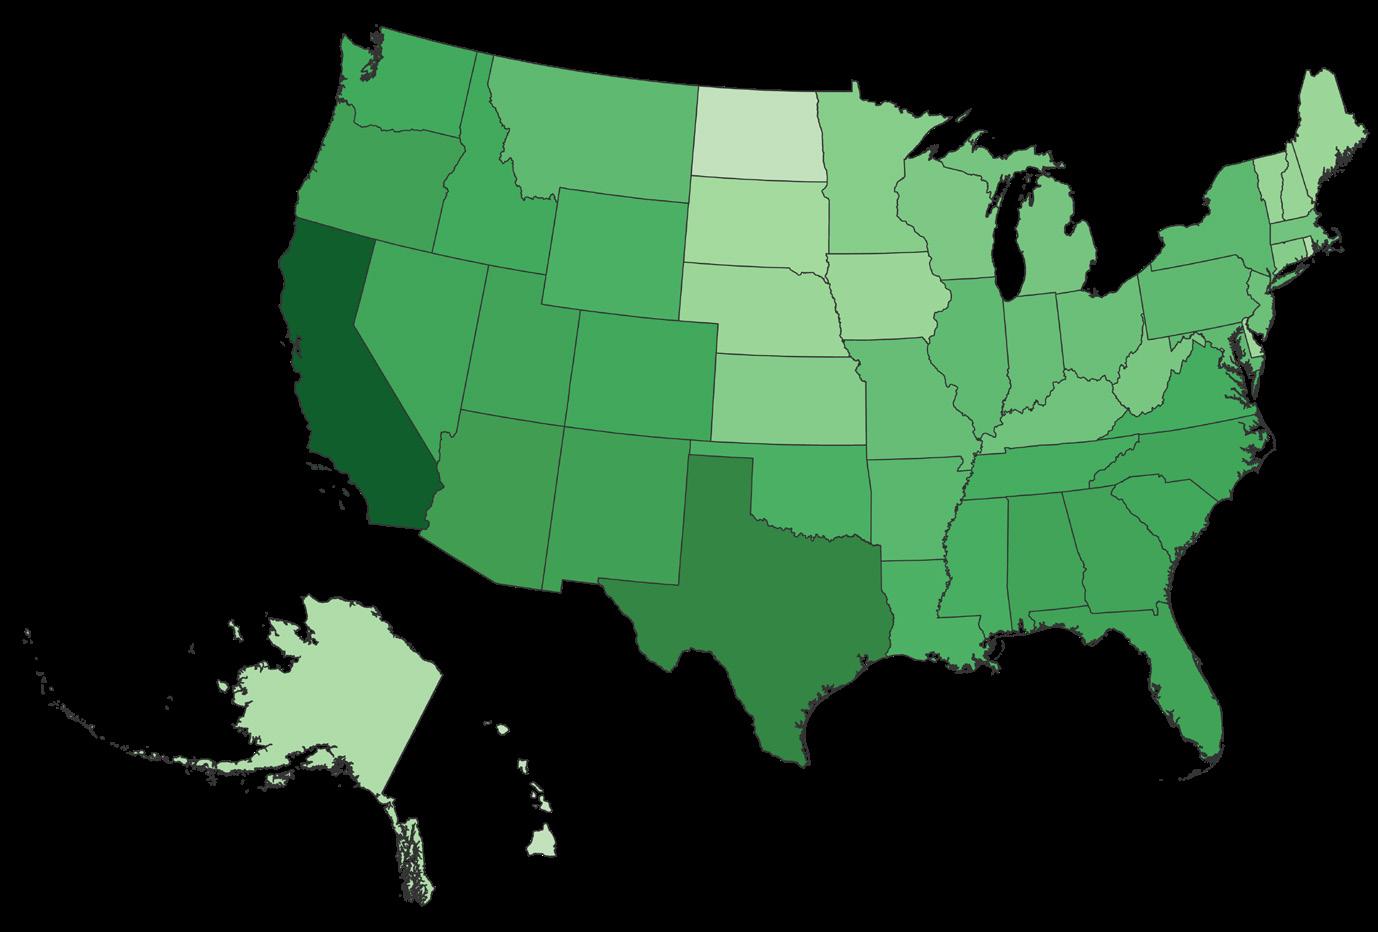


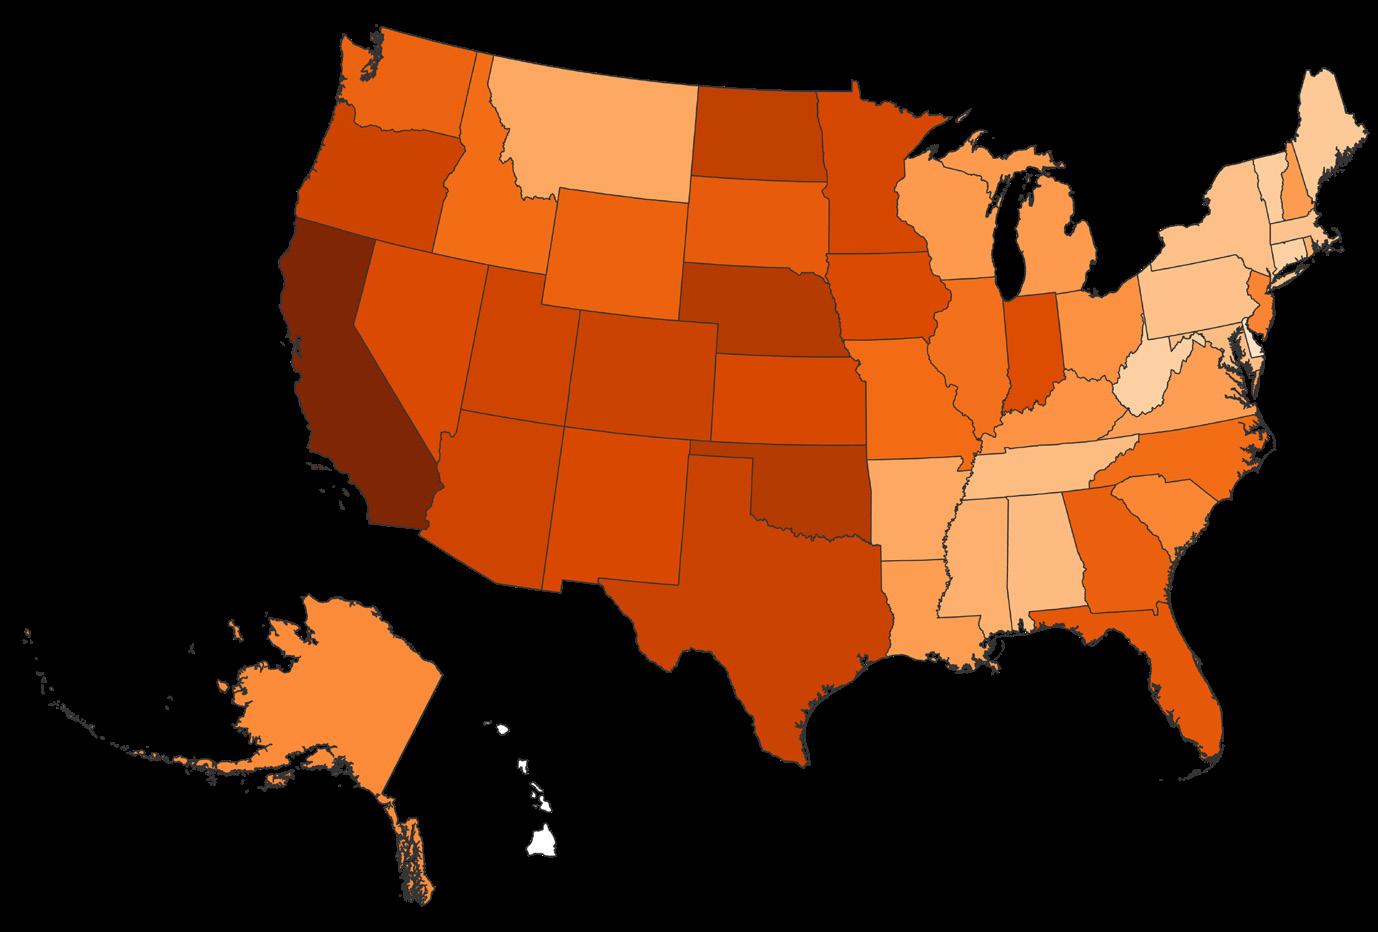
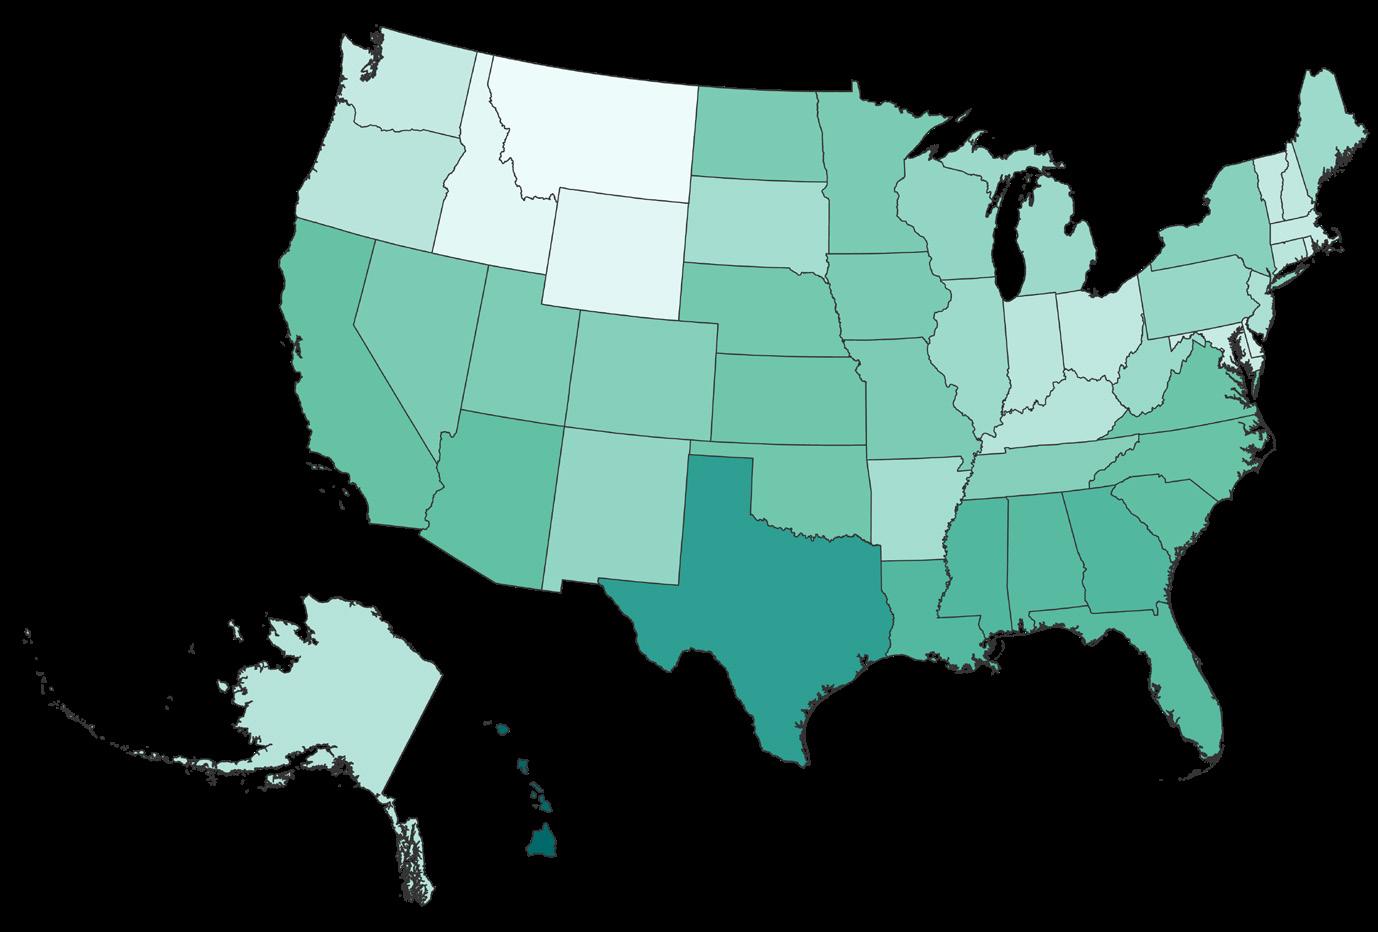

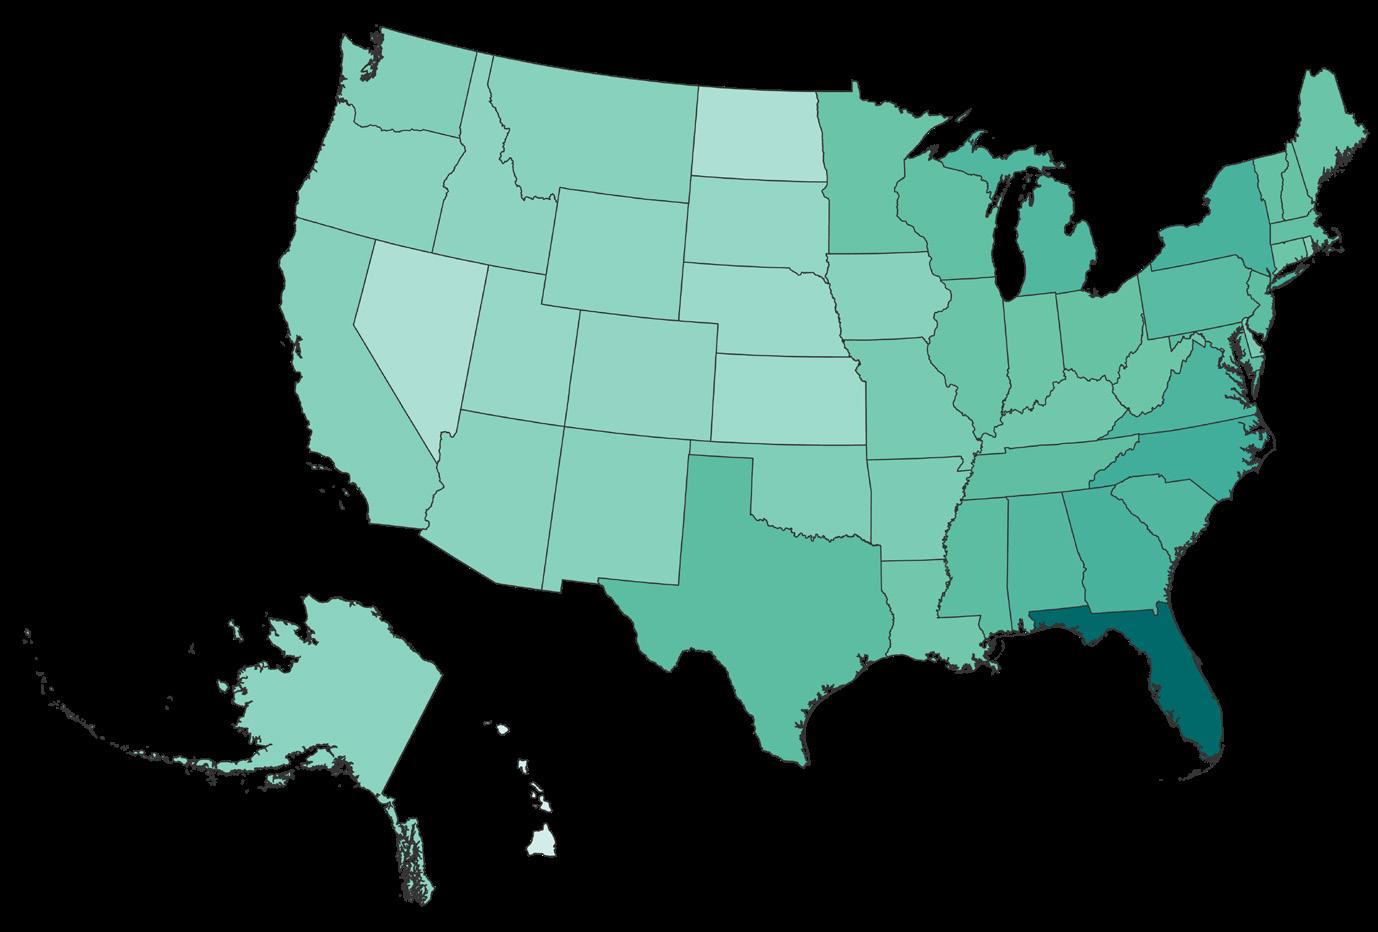


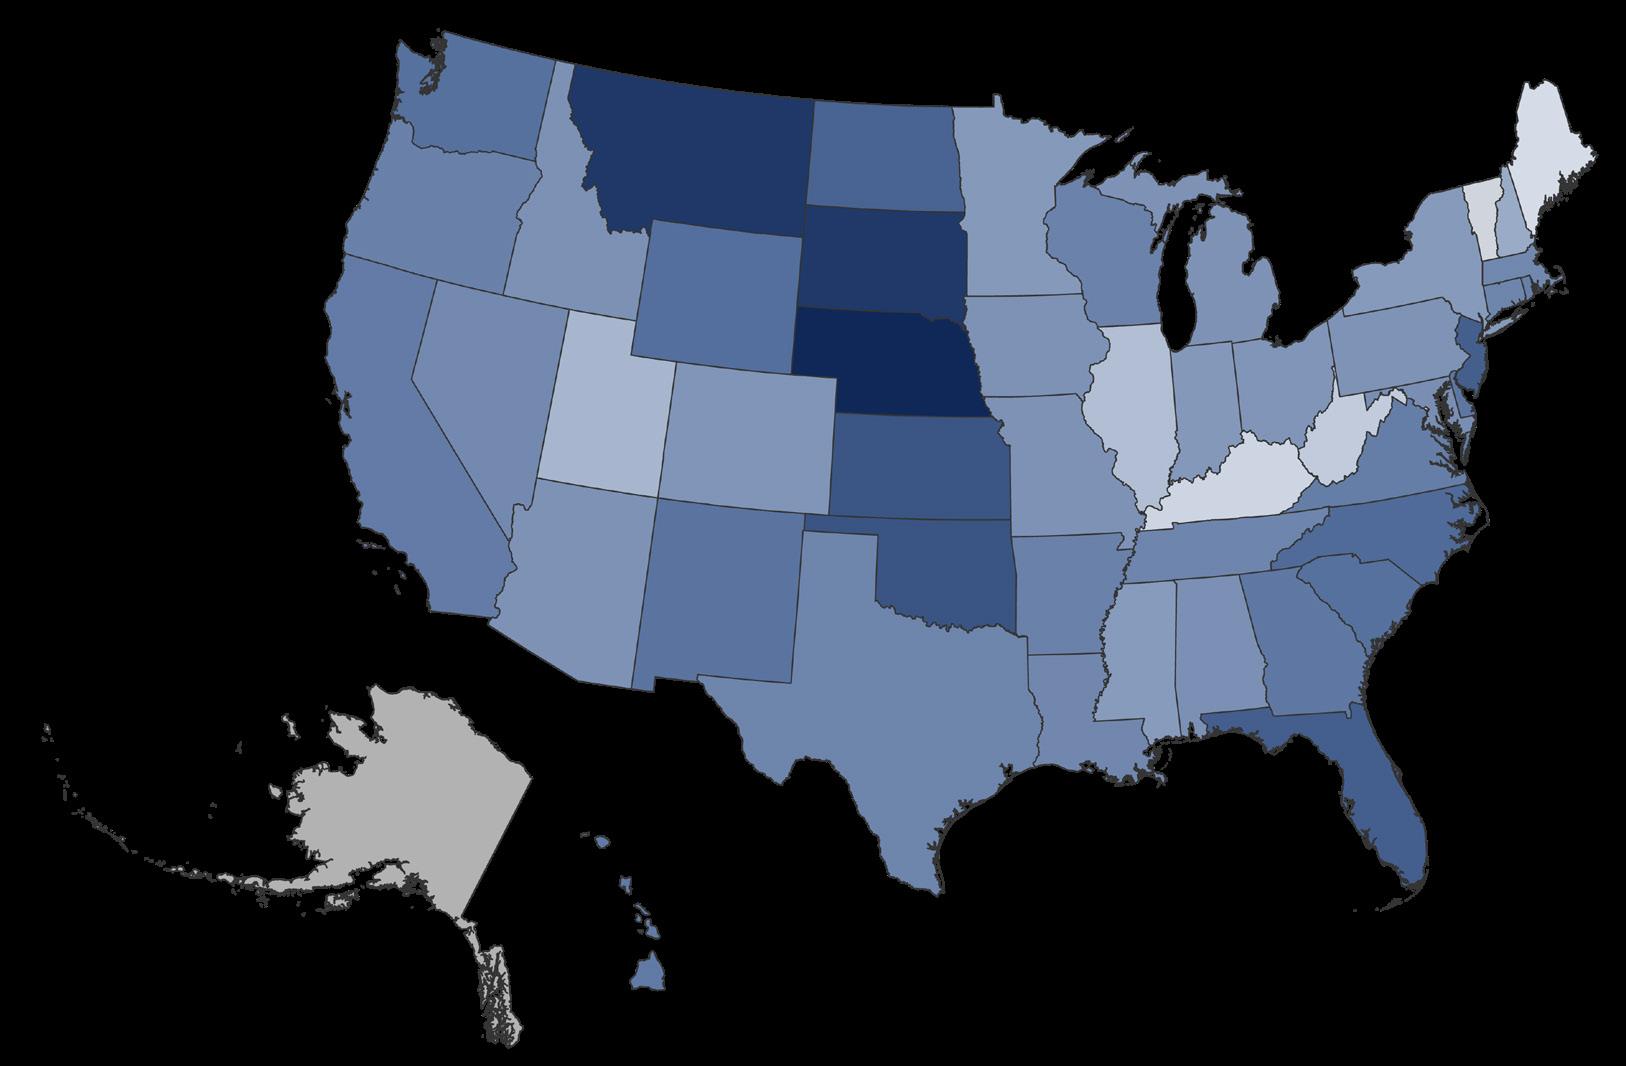

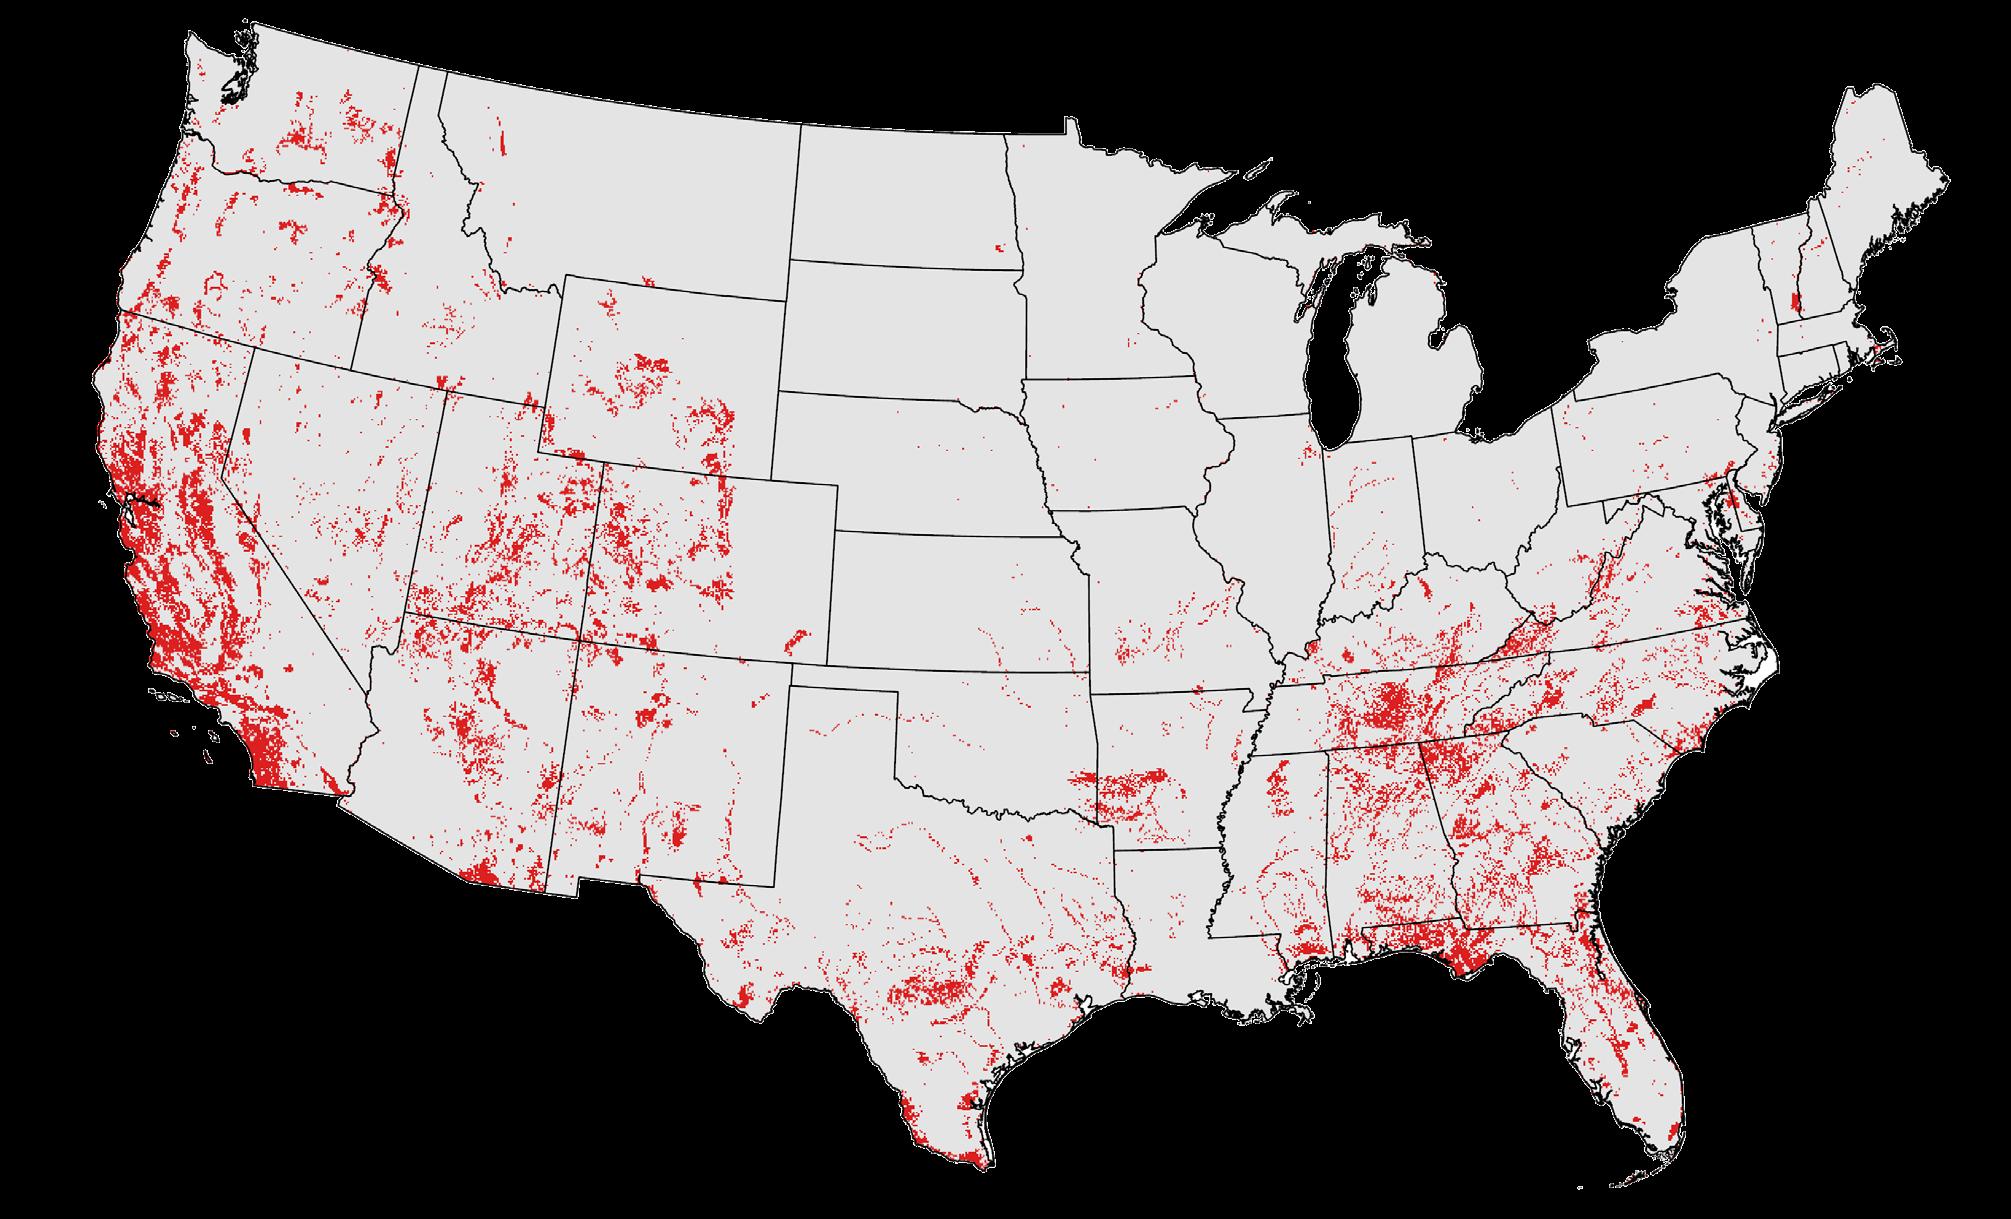
As with patterns in species diversity, patterns in ecosystem diversity vary based on geography. Our data show that more U.S. ecosystems are found in topographically diverse regions (e.g., mountains, coastal areas) or in large and biogeographically diverse states such as Texas and California.19
Geographical patterns for at-risk ecosystems reflect the legacy of human land use. The prevalence of at-risk ecosystems is high in the South, especially in Florida. In the western Great Plains, many states have relatively low ecosystem diversity, but contain large areas of at-risk grasslands. For example, Montana, South Dakota,
and Nebraska score high for percentage of state area with at-risk ecosystems. In mountainous western states, there is a high diversity of ecosystems but those that are at risk are largely limited to low elevations where the human footprint is greatest; thus, those states score relatively low for percentage of state area with at-risk ecosystems.
18 Distribution and conservation status for NVC groups is not yet available for Alaska. See online appendix for more information on Alaska ecosystems of conservation concern.
19 Ecosystem counts are based on state distribution data for NVC groups extracted from NatureServe’s database of biodiversity in 2022. The percentage of state area with at-risk ecosystems is calculated based on the mapped distribution of at-risk NVC groups. Mapped information on the extent of at-risk ecosystems in Alaska was not available at the time of reporting.

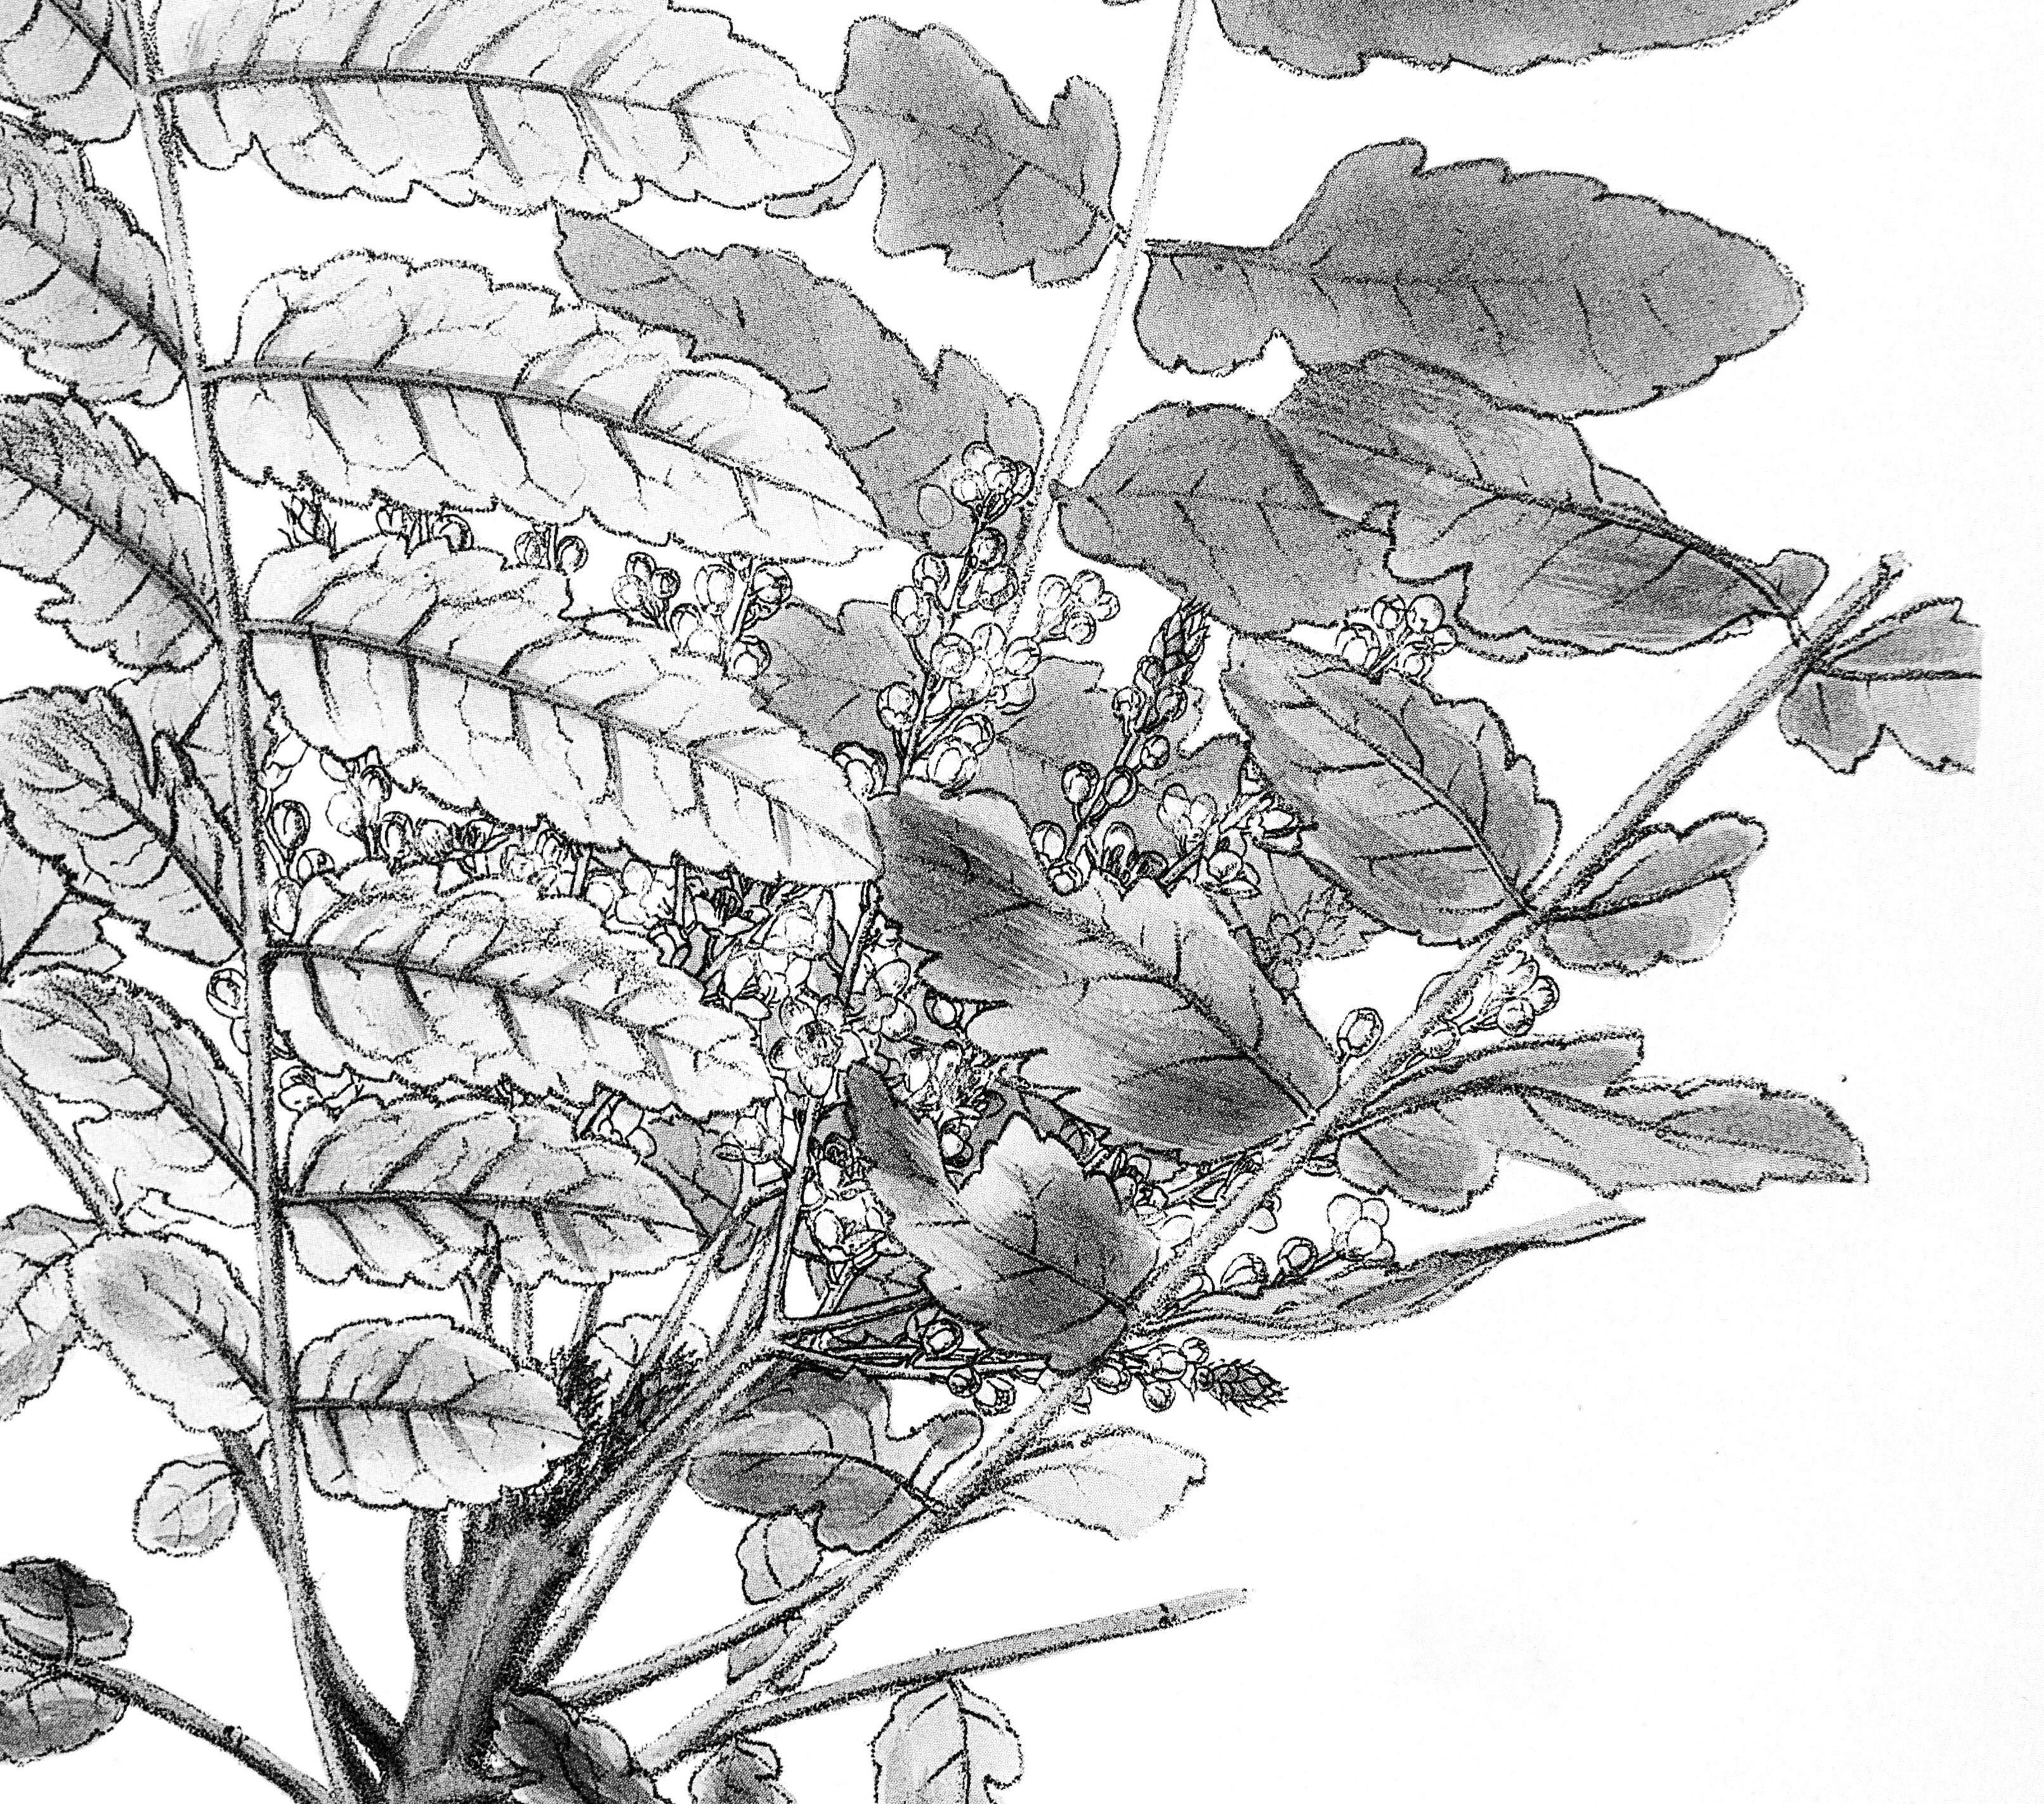

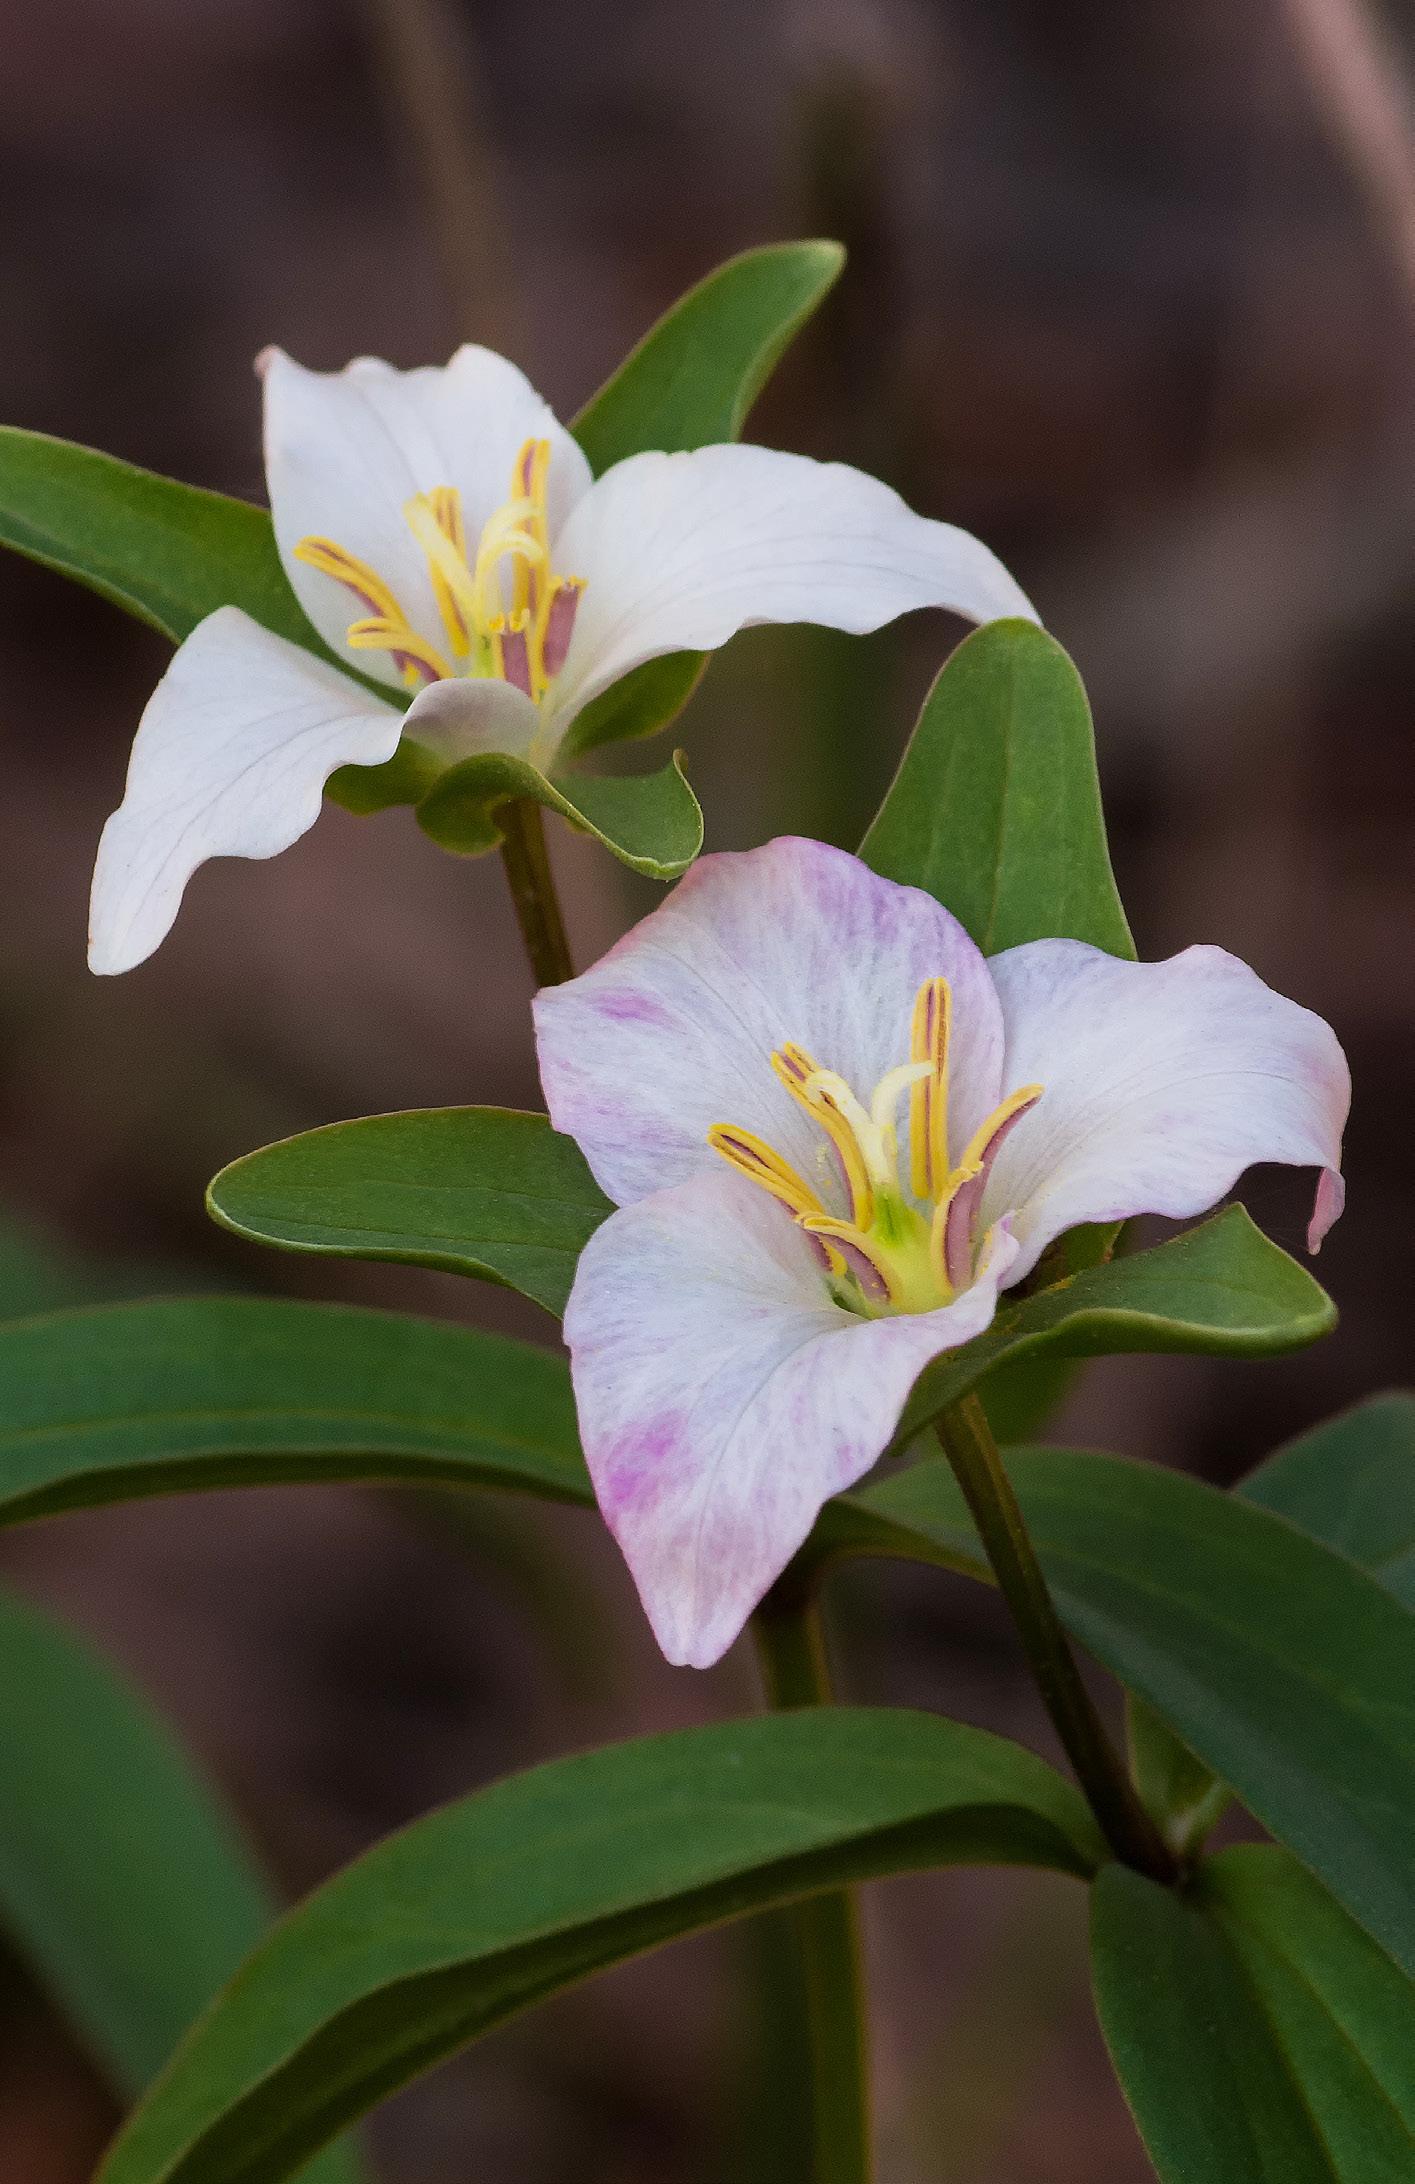


NatureServe Global Status: Critically Imperiled (G1) ESA Listing Status: Under Review
These investments, guided by State Wildlife Action Plans, will need the most comprehensive and scientifically sound data available. This report provides a high-level look at the challenges faced by biodiversity in the United States and some of the data available to help make the most effective decisions.
Moreover, America the Beautiful and the 30x30 global initiative call for conservation of 30% of the planet’s land and water by 2030. Meeting this goal requires investments in land acquisition and management to maximize value for biodiversity conservation. Strategies
that protect the persistence of the full diversity of natural ecosystems (coarse-filter conservation) should be complemented by strategies that address the needs of individual species at risk of extinction (fine-filter conservation). NatureServe data make this possible.

Recognizing which species and ecosystems are at risk, and whether at-risk biodiversity is sufficiently protected, is foundational information. Documenting current threats and where they occur is critical for identifying the likely location of future threats and for determining conservation strategies. Data can inform
NatureServe
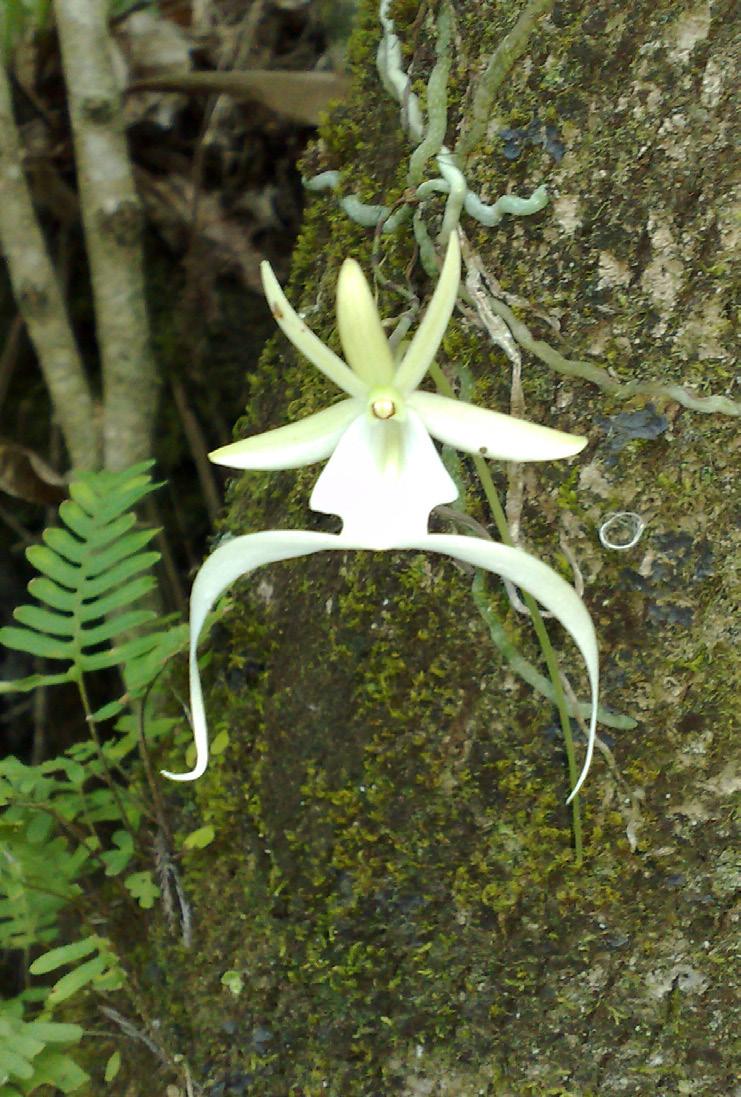


Importance


decisions about how to expand existing protected areas and better manage working lands. NatureServe and NatureServe
Network data are already used by federal and state governments, and the private sector to make conservation decisions. NatureServe’s data on the location of at-risk species and ecosystems can also be analyzed with other information, such as spatial data on land management and protection, to identify regions of conservation importance.21
To make the best decisions possible, we need an understanding of our natural heritage. We need to know what biological resources exist, where they occur, and which ones are most at risk. As global change rapidly alters the environment, we need continued investment to ensure that we have the most comprehensive and current information. Accessible and accurate data about the status and trends of our nation’s biodiversity empowers all stakeholders to make decisions that positively impact species and ecosystems throughout the United States. This knowledge will ensure that our nation’s biodiversity is protected for generations to come.
Monterey
(Cupressus macrocarpa)
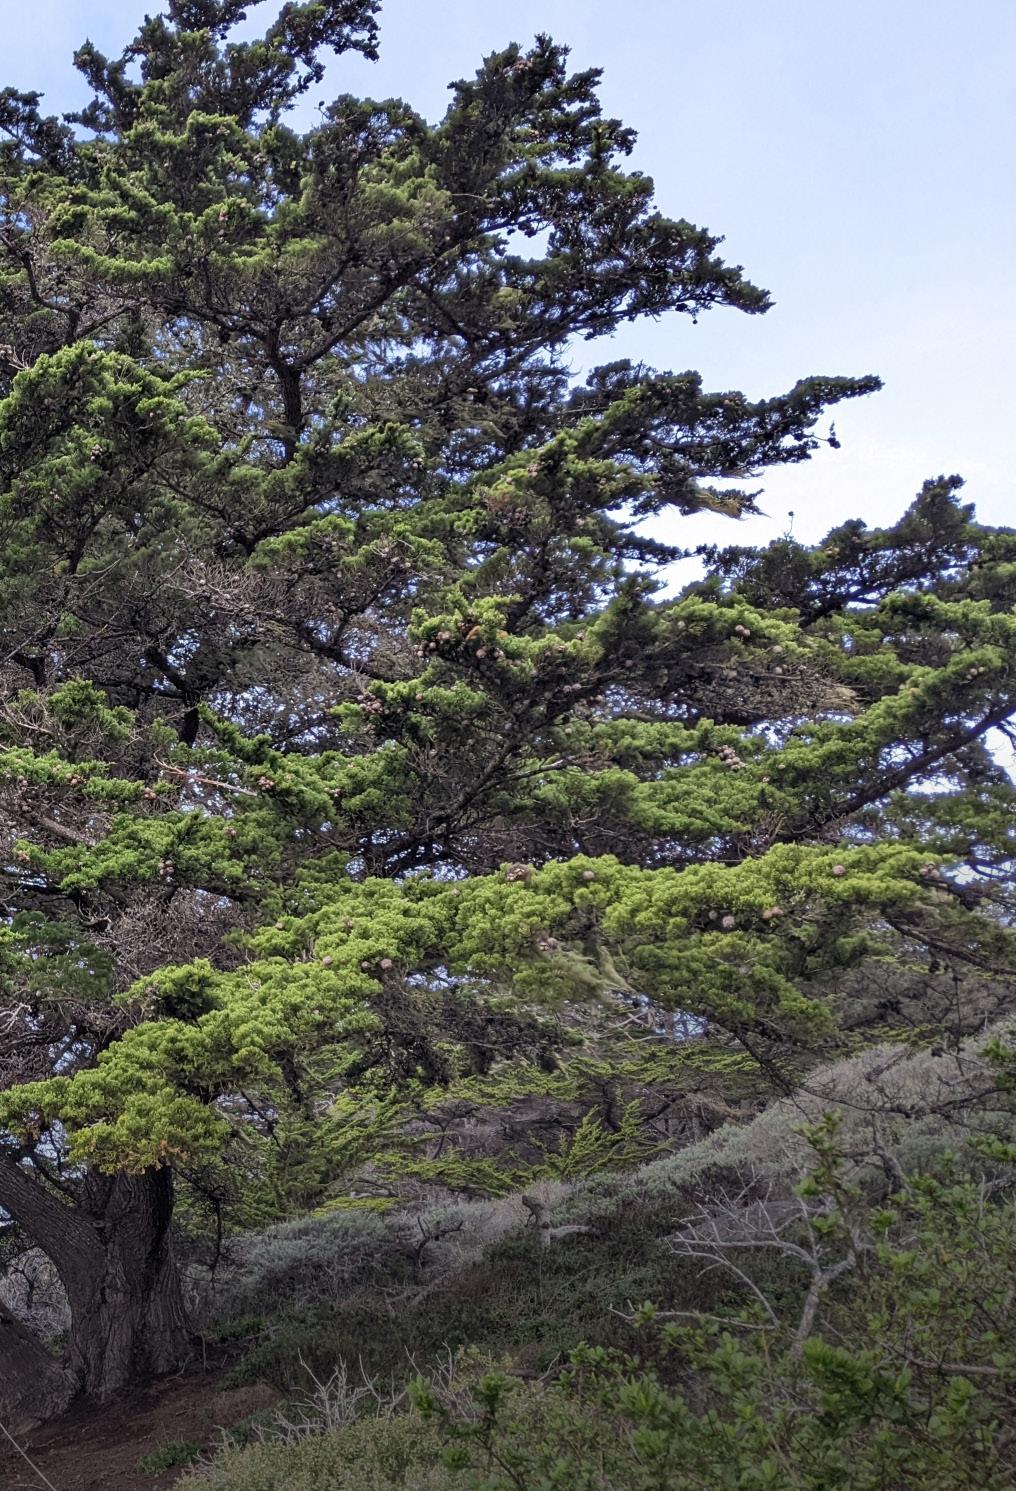
NatureServe Global Status: Critically Imperiled (G1)
Red-cockaded woodpecker (Dryobates borealis)

NatureServe Global Status: Vulnerable (G3)


ESA Listing Status: Endangered
NatureServe


Utah prairie dog (Cynomys parvidens)
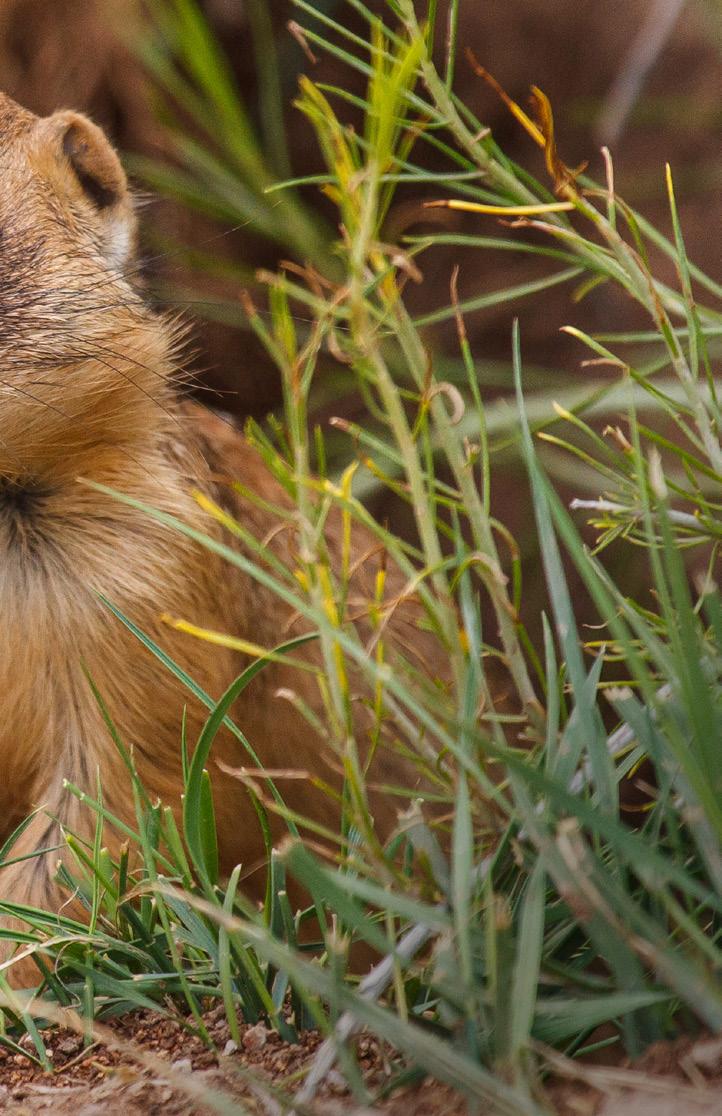
NatureServe Global Status: Imperiled (G2)
ESA Listing Status: Threatened
NatureServe Global Status:
Dusky gopher frog (Lithobates sevosus)

NatureServe Global Status: Critically Imperiled (G1)
ESA Listing Status: Endangered

Bachman’s sparrow (Peucaea aestivalis)
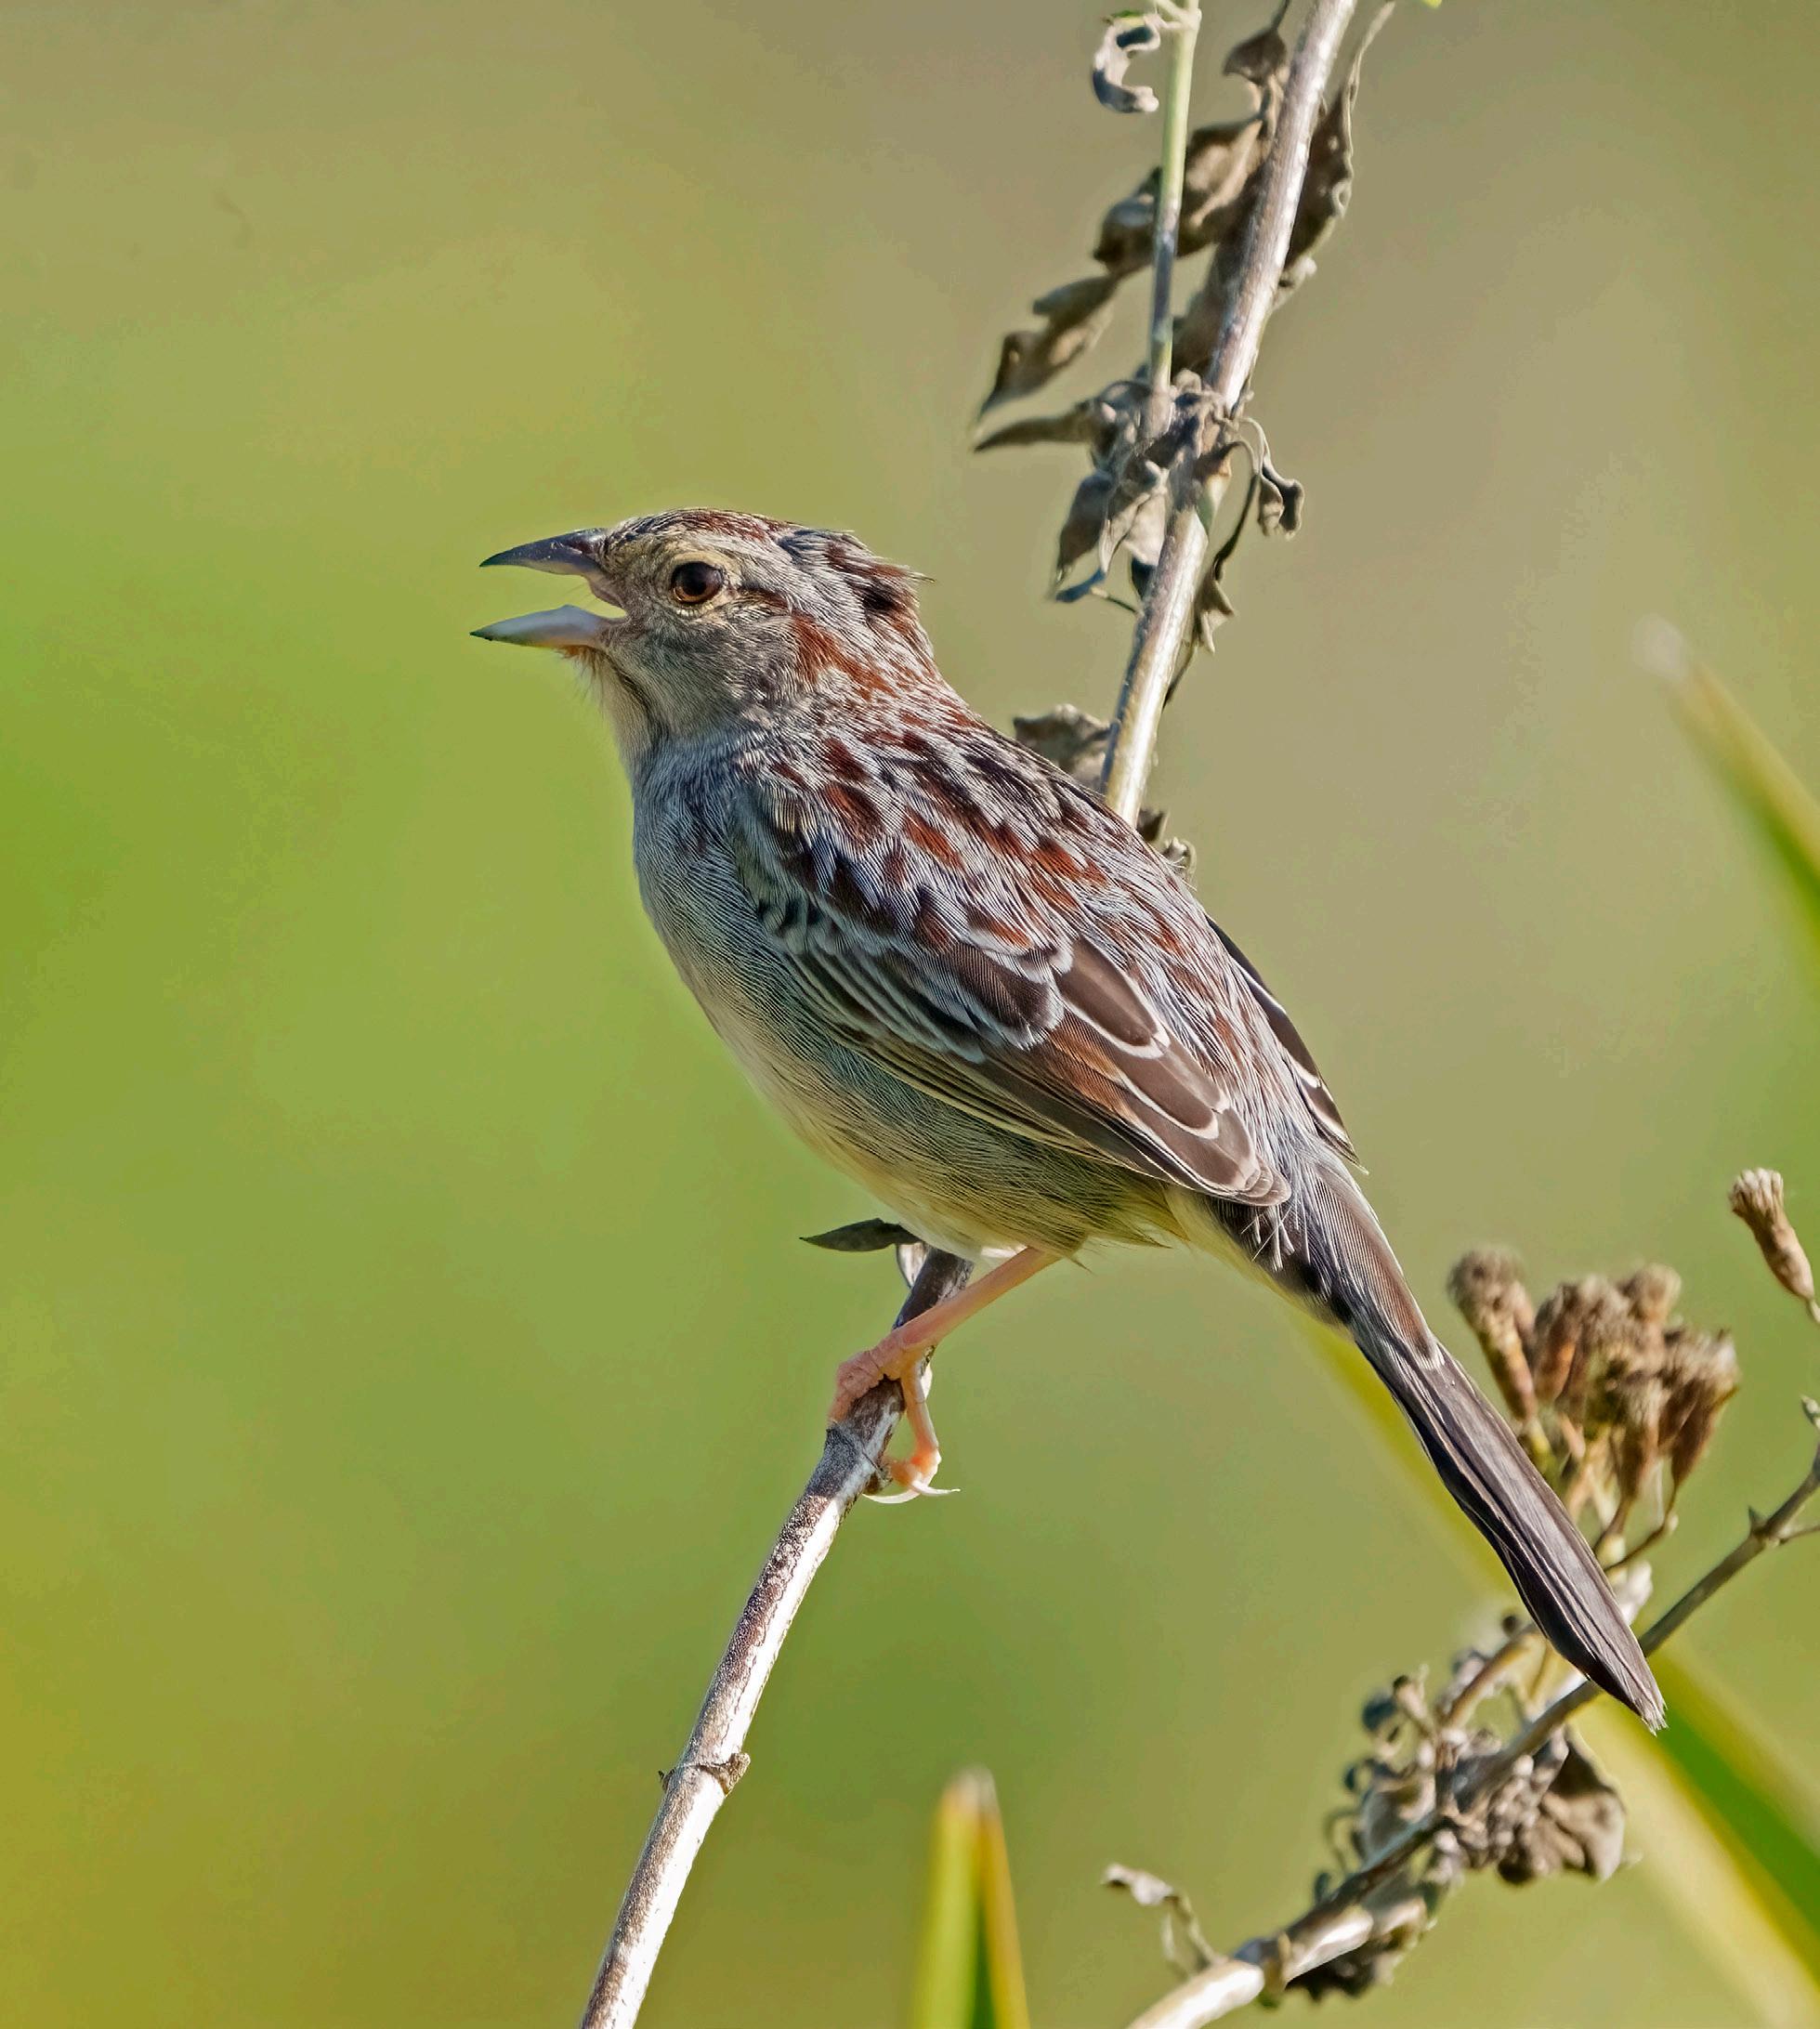
NatureServe Global Status: Vulnerable (G3)
Front Cover Photo: Mojave mid-elevation mixed desert scrub
NatureServe Global Status: Vulnerable (G3)
Photo by Sundry Photography
Back Cover Photo: Minnesota trout-lily (Erythronium propullans)
NatureServe Global Status: Critically Imperiled (G1)
ESA Listing Status: Endangered
Photo by Brian (Flickr)
Page 8 photos, left to right: Desert valley fishhook cactus (Sclerocactus spinosior)
NatureServe Global Status: Imperiled (G2)
Photo by Janel Johnson (iNaturalist)
A burrowing crayfish (Cambarus fetzneri)
NatureServe Global Status: Vulnerable (G3)
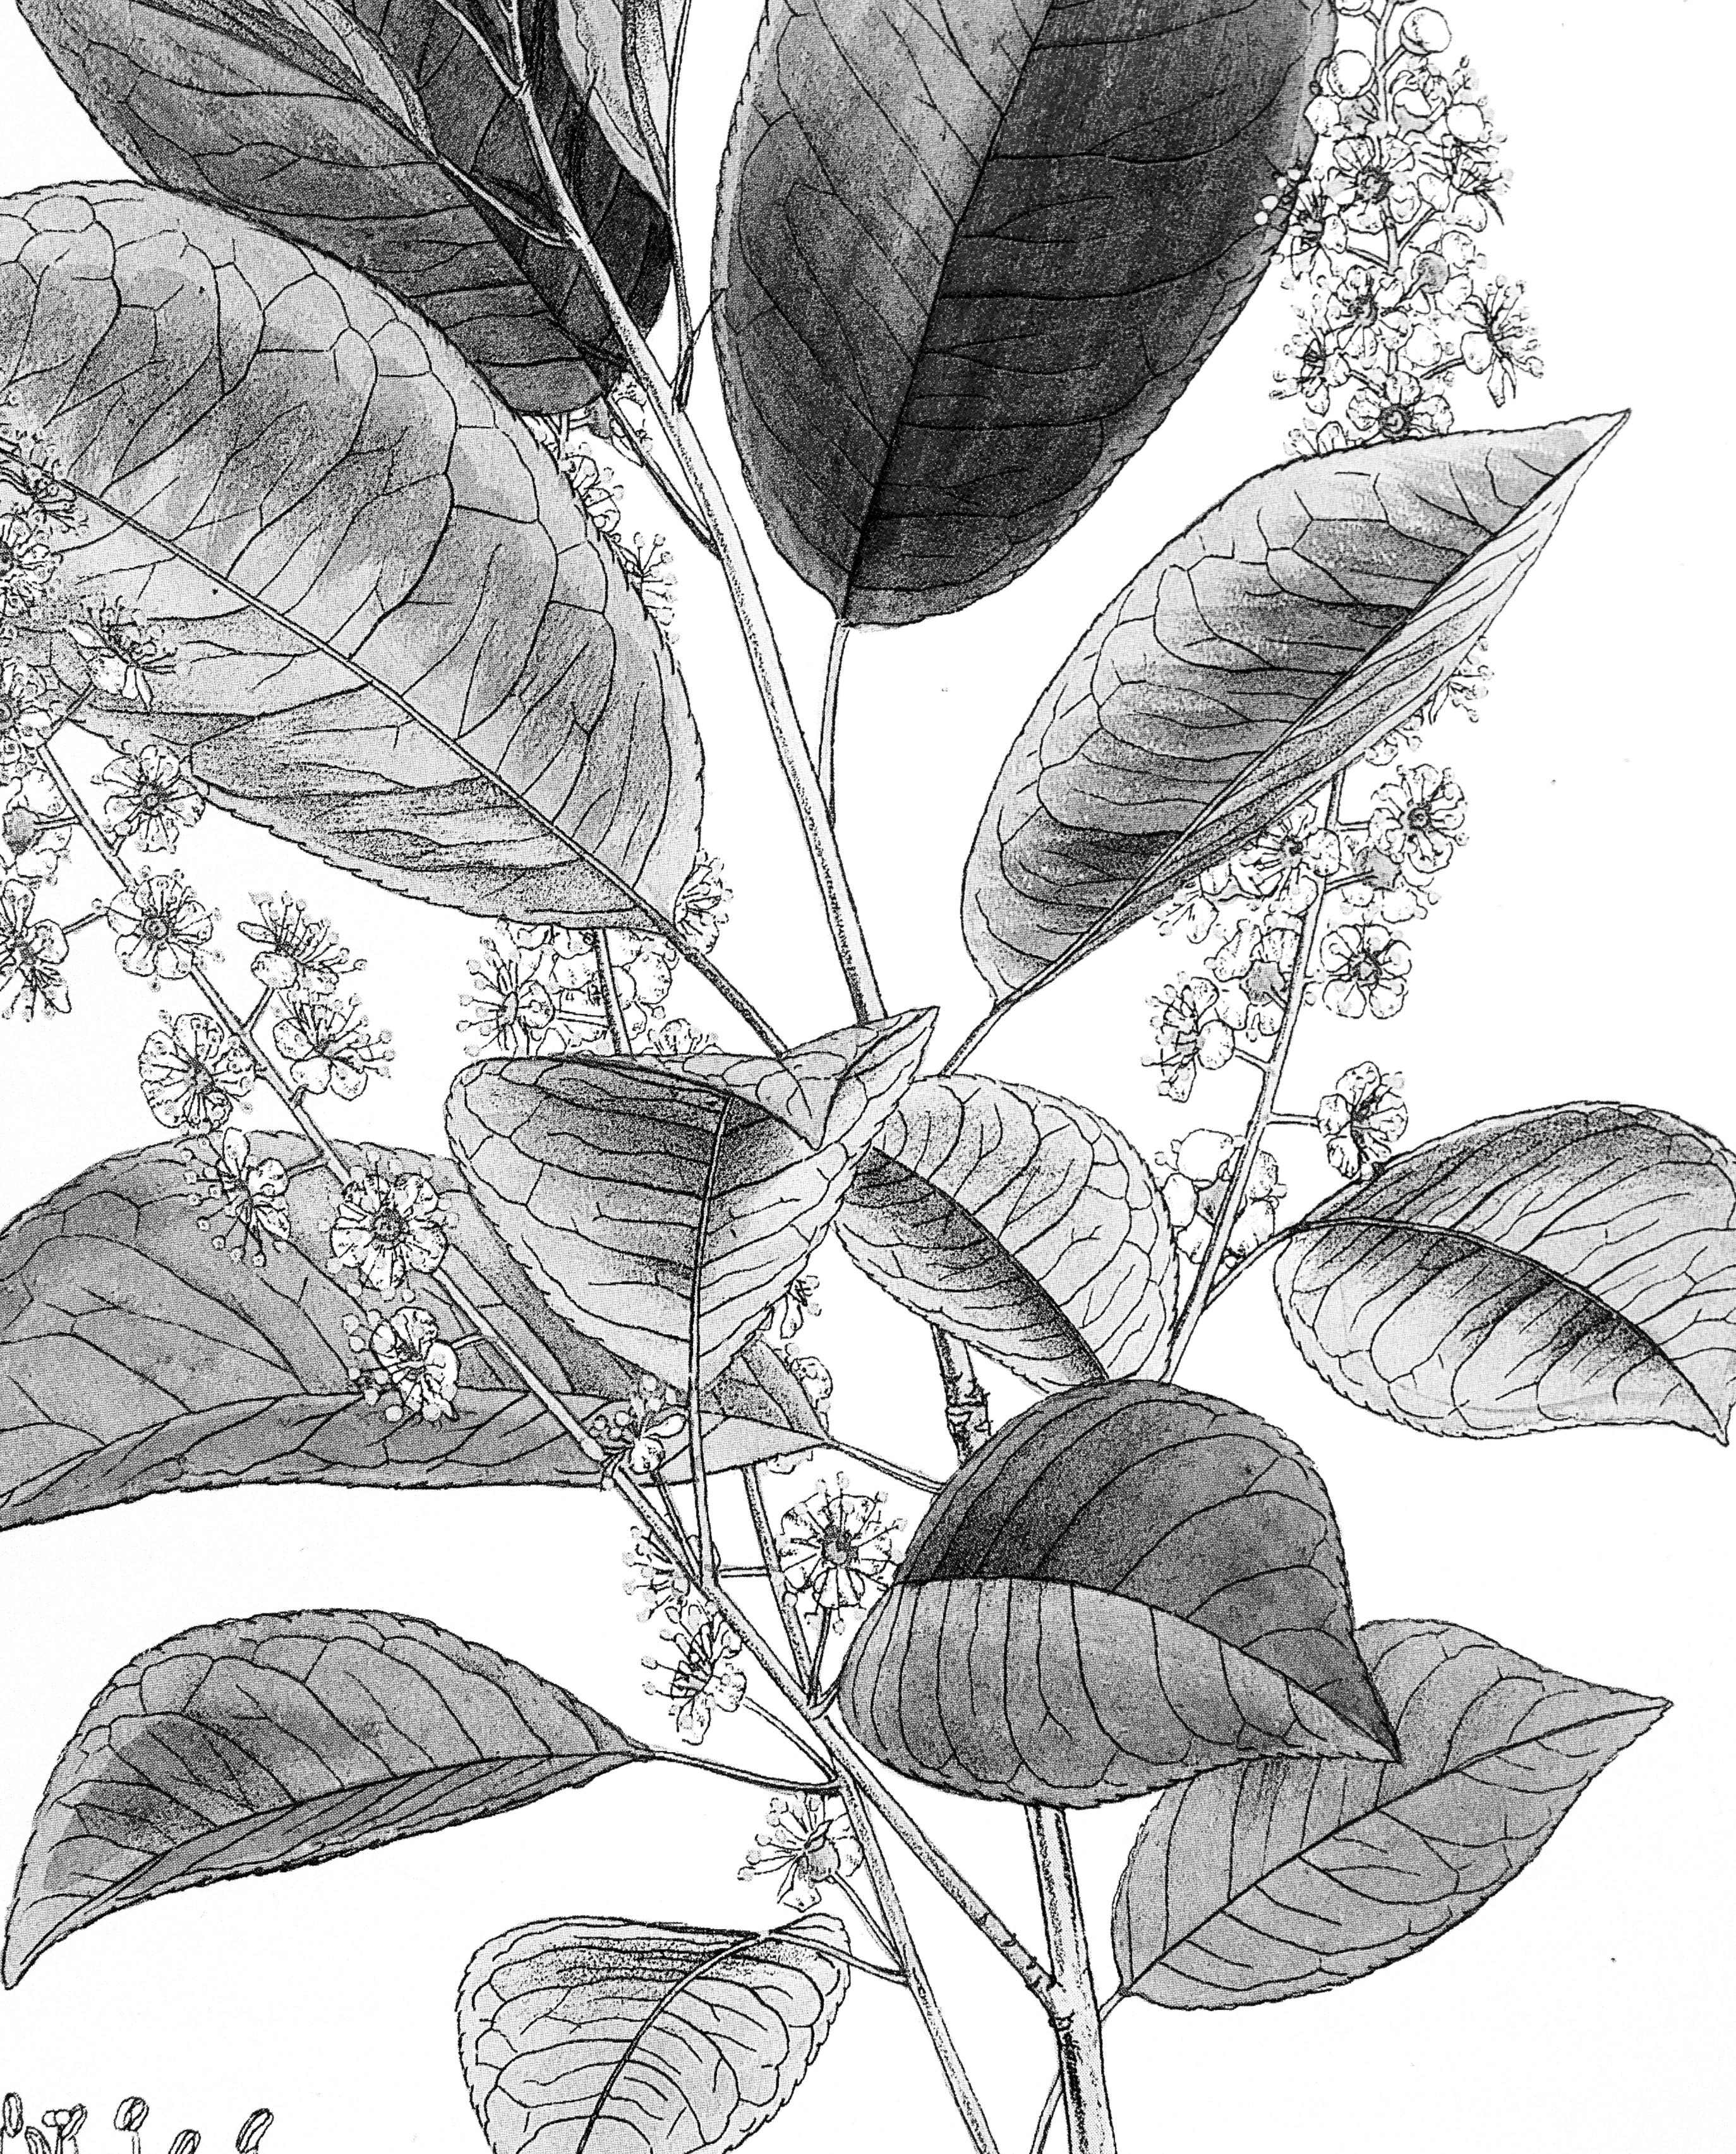

Photo by Chris Lukhaup
Northern tallgrass prairie
NatureServe Global Status: Imperiled (G2)
Photo by Marilena
Graphic Design by Ensemble Media, Inc.





The data that support the findings of this report are available. To access those data, a detailed appendix, and an online version of NatureServe’s Biodiversity in Focus: United States Edition, please visit www.natureserve.org/bif.
Contact info@natureserve.org for high-resolution figures included in this report.
Citation:
NatureServe. 2023. Biodiversity in Focus: United States Edition.


NatureServe: Arlington, VA
www.NatureServe.org
© 2023, NatureServe, 2550 South Clark Street, Suite 930, Arlington VA 22202, USA. All Rights Reserved.