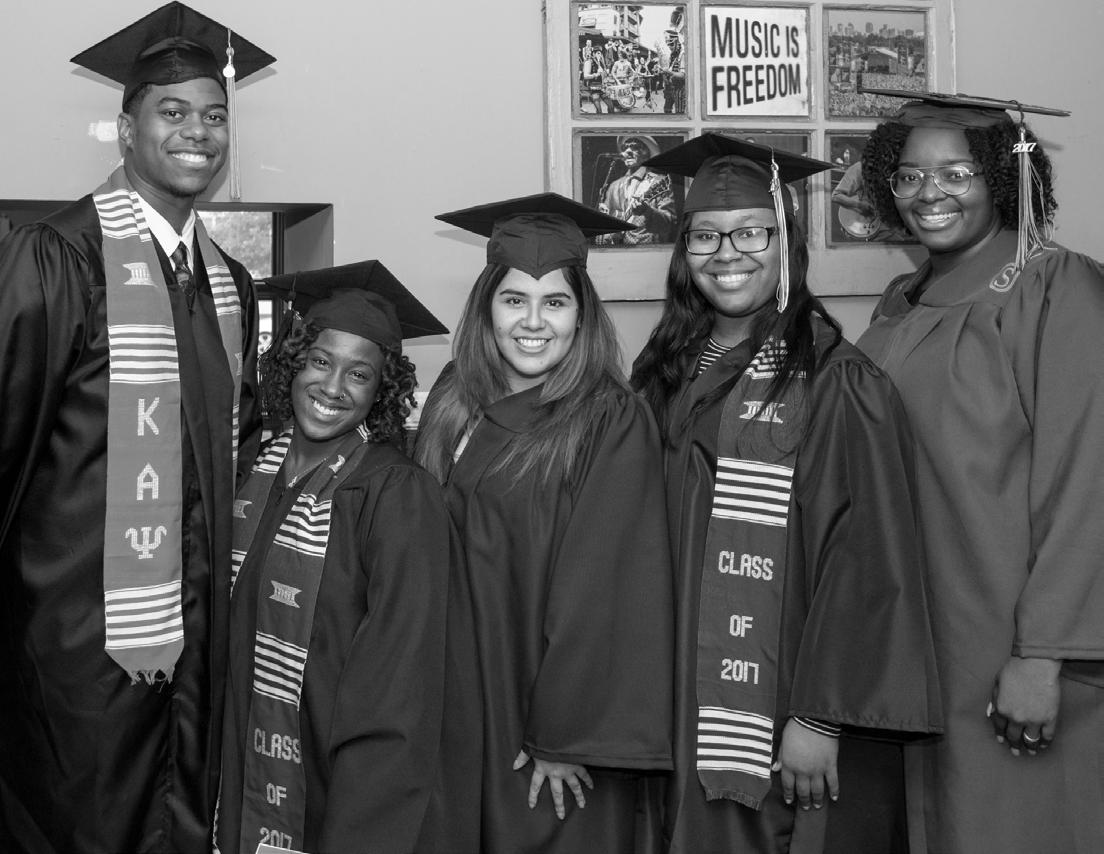
College Track’s 2019
Social Mobility Report
INSIGHTS INTO OUR GRADUATES‘ POST-COLLEGE OUTCOMES

1
Introduction
For the third consecutive year, College Track surveyed its college graduates to determine whether their bachelor’s degrees have opened them up to a life of opportunity and agency.
We often hear affirming stories like Estefania’s who shares:
“When I completed my degree, I got my dream job as a systems engineer at Boeing. There are moments when I look around the room of engineers and see that I am the only woman of color, but I remember that I am a Latina woman working on underwater vehicles. I have earned my way here.”
-Estefania, College Track East Palo Alto, MIT graduate
Is Estefania’s experience representative of all our college graduates? With 500 alumni and a 66% response rate (see appendix A), we are in a strong position to examine the relationship between education and career as well as contribute to the national conversation around upward social mobility in 21st century America.
• Can we count on higher education to be a powerful motor for helping youth embark on a life with more choice and financial security than their parents?
• What additional behaviors in college yield more successful career paths?
Building on last year’s report, we continue to examine both absolute and relative measures of upward mobility for graduates at several stages post-college graduation.
Key Findings
We are increasingly optimistic about our graduates’ career outcomes.
• With every passing year in the workforce, our graduates’ income increases compared to their parents and exceeds the national average for all bachelor’s degree holders.
• They also score strong on measures of agency, such as alignment of their current job with their interests and career aspirations, particularly for our graduates who chose careers in the public interest.
We continue to surface lessons learned, which we immediately share with our younger students and feed into program improvement:
• How you go to college matters as much as where you go to college: the first section of this report highlights the critical behaviors necessary to unleash the power of a degree.
• Borrowing more than $30,000 to complete a bachelor’s degree is not recommended: our younger graduates seldom enter careers where earnings can cover monthly payments for loans exceeding this threshold. Borrowing more than $30,000 is unnecessary for many college paths, and College Track ensures our students choose these paths.
Page 3 College Track

Getting the most out of a college degree
2
Students choose how to spend their time in college and maximize the campus experience. If we can isolate behaviors that yield better career outcomes, younger generations will benefit from this wisdom. Results from our third annual study reinforce findings from prior years with progressively more robust quantitative findings 4
Internships are the most important factor in finding employment, even after controlling for other college behaviors, academic characteristics, and student demographics. Having one internship in college increases a student’s odds of being employed by 45%; two or more internships by 50%.
Graduating from a “Best Fit College” increases one’s chances of employment by 20%. We define a Best Fit College as one with high graduation rates, low debt postgraduation, and support services for first-generation and low-income students.
STEM (Science, Technology, Engineering & Math) majors are 20% more likely to be employed and earn more at their 1st job compared to any other major. “Second best” are social science majors: they are 30% more likely to be employed than those who major in all other non-STEM disciplines (eg liberal arts, psychology, business).
A handful of in-college behaviors appear to impact finding a job upon graduation: having a welldefined college plan, being part of a club on campus (and having a leadership role in that club), and attending networking events all increase employment chances by 10 to 40%. Strong academic performance also correlates with better outcomes, including college and high school GPA.
Page 5 College Track

Detailed Findings: Fresh Graduates
3
OUR GRADUATES FIND JOBS FASTER THAN THE NATIONAL AVERAGE AT COMPETITIVE WAGES 1
70% of recent graduates were employed within six months of graduation compared to 64% nationally. 50% are employed fulltime compared to 58% nationally. For those employed full-time, salaries are in line with those reported for recent graduates from all socioeconomic backgrounds, averaging $51,250 compared to $50,253.1 Of the 30% who were not employed at the six month mark, 9% were in graduate school2 and 7% found a job within a year, which leaves 14% still searching for employment 10 months after college graduation.
Bachelor’s degree holders employed within six months of graduation
More College Track graduates have a job within 6 months
**National 68%
70% N=40 2016 70% N=57 2017
higher than the national average of 64%
50% vs. 58% nationally
Page 7 College Track
N=34 2015 62% COLLEGE TRACK • POST-COLLEGE OUTCOMES College Graduation Year
NACE, First Destination Survey: 2014 to 2017
of survey respondents
**SOURCE:
*Number
average
Fewer have a full-time job: N=120 Before 2015
Fresh Graduates
ONE YEAR LATER, EVERYONE’S ON TRACK!
How do graduates fare two years after college graduation? In last year’s survey, seven fresh graduates were still looking to land a job. In this year’s survey, nearly all 2016 graduates are either employed or in graduate school!3 Darius’ story illustrates the winding path some graduates encounter after college4
“Like a lot of college students, once you get your degree and are out into the real world, I didn’t have a plan. So I applied and applied for jobs and nothing hit at all. I started working at FedEx and Costco because I had bills to pay. I would wake up at 3am and go to Fedex with my UC Santa Cruz hoodie on. People would look at me like, ‘What are you doing here, did you go to school there?’ but I would just get on the belt and do my job, and then go to Costco at 1pm until closing. I was fortunate enough to get my first real job doing a violence prevention curriculum for juveniles in detention so they can make improvements once they get out. That opened the door and now I’m getting my Master’s in Public Administration.”
-Darius, College Track Oakland, UC Santa Cruz B.A., San Jose State University MPA candidate
SPOTLIGHT
Page 8 College Track
ONE
WHAT ABOUT GRADUATE SCHOOL?
Today, 13% of our 2017 graduates are enrolled in graduate school (9% as their primary activity and another 4% also have a full-time job). This figure jumps to 30% for graduates who are one year older, and by the time they are 30-36 years-old, 22% have a graduate degree and another 15% are enrolled. This means that up to 37% of College Track bachelor’s degree holders are on track to earn a graduate degree, in line with graduate school enrollment and completion for all Americans with a bachelor’s degree.4
College Track alumni earn graduate degrees on par with the national average
National average for all American’s with a Bachelor’s degree*
2017,
Institute
*Who Goes to Graduate School and Who Succeeds?,
Urban
13% <25 yrs old N=50 30% 25 yrs old N=44
26-30 yrs old N=62 Graduated Enrolled 37% 30-36 yrs old N=60 Graduated Enrolled or Graduated Enrolled Enrolled Enrolled SPOTLIGHT TWO Page 9 College Track
31%
COLLEGE TRACK FRESH GRADUATES EARN ENOUGH TO PAY BACK THEIR LOANS
Graduates who work full-time are able to repay their loans, provided they did not borrow more than $30,000. While our proportion of borrowers is constant year-over-year, the average debt is higher. We anticipated this trend, and we started communicating the $30,000 threshold to our younger cohorts several years ago. Now, we proactively guide them to “Best Fit Colleges,” institutions where the average debt for our graduates is four times smaller than at what we call “expensive colleges” (small liberal arts colleges, Art schools, and HBCUs). We found that our 2017 graduates from such colleges borrowed over $45,000 to pay for their bachelor’s degrees compared to $10,000 for those who attended Best Fit Colleges (primarily flagship public institutions).5 ^We
COLLEGE TRACK • POST-COLLEGE OUTCOMES
At their first job, College Track graduates who borrowed >$30k can repay their loans within 10 years
Step 1
College Track graduates take out average loans*
Step 2
Those with loans under $30k can repay with first job salaries
75% borrowed less than $25k and can definitely repay
Step 3
Graduates from Best Fit Colleges have the lowest loans**
*Compared
***Includes non-borrowers
in Louisiana; TICAS (2018), Student debt and the class of 2017.
use the federal gainful employment rule for colleges; loan repayment should not exceed 8% of income. This is based on a small sample study of 16 borrowers with full-time jobs. **On par and likely better than graduates from similar backgrounds: NCES (2017) Repayment of Student Loans as of 2015 found an 8% default rate among all Bachelor’s degree holders and a 35% default rate among Pell grant recipients (regardless of whether they graduated), 3 times higher than non Pell grant recipients. So default rates for low-income graduates is likely higher than 18%.
to 50% of graduates in California and 48%
Louisiana $27,000 California $23,000 College Track $24,500
Loans
Graduation*** Best Fit N=19 Public College N=8 Arts/HBCU N=6
18%
$10,500 $12,500 $46,000 Page 10 College Track
VS
Upon
7% borrowed $25-30k and can likely repay
borrowed more and less likely to repay
Detailed Findings: Older Graduates
4
COLLEGE TRACK GRADUATES ARE UPWARDLY MOBILE
While it may take a few years post-graduation for a student to start earning more money than their parents, the trend is undeniable: College Track graduates are upwardly mobile. Right out of college, 60%6 make more money than at least one of their parents and by the time they are 30 this ratio jumps to 87%. This is higher than last year’s report and continues to exceed the national average for all students.
Our
graduates are upwardly mobile
I earn more than my parents do now
The impact of a college degree increases over time: 87% of our oldest graduates earn more than their parents, far exceeding the national average.^
•
COLLEGE TRACK
POST-COLLEGE OUTCOMES
*Number of survey respondents who were employed full-time, excluding the 12 individuals who said they “did not understand the question.” ^The American Dream Quantified at Last, David Leonhardt, NYT, Dec 2016
30+ years old N=52 26-29 years old N=57 25 years old N=27 <25 years old N*=15 60% 70% 82% 87%
Page 12 College Track
COLLEGE TRACK GRADUATES EXPERIENCE STRONGER CAREER OUTCOMES WITH EVERY YEAR IN THE WORKFORCE
Several years out of college, 89% of graduates are employed full-time, up from 82% last year. The median wage for full-time workers has also increased to $57,500, up from last year and now higher than the national median for bachelor’s degree holders ages 24 to 35 working full-time.7 These employment data show that College Track graduates have bridged the opportunity gap by not only out-earning their parents’ salaries, but also earning on par with the national average for all graduates, regardless of economic background.
89% of College Track graduates are employed full-time, up from last year, with no big differences amongst genders.
All N=135 82% 10% 8% All N=180 89% 6% 5% 2017 2018
TRACK • POST-COLLEGE OUTCOMES
Track graduates are employed full time Full-time Part-time Not working Male-identified N*=32 88% 12% Male-identified N*=43 86% 7% 7% 2017 2018 Female-identified N=103 11% 9% 80% Female-identified N=137 4% 6% 90% 2017 2018
COLLEGE
College
Graduates from 2016 and earlier, excluding those who are in graduate school or say they are voluntarily unemployed. Male employment this year is lower than last due to three graduates currently looking for work. Such variations from year to year are due to the outsized impact of a handful of graduates on our average.
Page 13 College Track
SPOTLIGHT THREE
DO OUR GRADUATES HAVE TWO JOBS TO PAY FOR COST OF LIVING?
We uncovered that 13% of our older graduates who are employed fulltime also have a second job—yet the nature of these second jobs is not predominantly an after-hours hustle to help pay the bills, such as valet attendant, ride-share driver, or waiter. On the contrary, most of these “two jobers” have developed a second activity that enhances their career or even presents an entrepreneurial opportunity, such as a Director of Diversity and Inclusion who started a consulting practice or a Graphic Designer also working as an illustrator. We interviewed Tevah to learn more about this “Millennial Hustle” 4
“From a young age, I made it my mission to support artists, businesses, and nonprofits making a difference and help grow their audiences using marketing, media, and culture. The pursuit of this mission has led me down a colorful career path, from songwriting and video creation to entrepreneurship and public speaking, each giving me unique perspectives and skills I use today. Currently, I run a creative firm called Nspired Media that advertises those making an impact in the world. I also sit on the global business marketing team of a large tech company where free marketing e-courses I create are read by millions of small businesses across the globe.”
-Tevah, College Track Oakland, George Mason University graduate
Page 14 College Track
Taking Action

5
Predictors of better outcomes after college
In our survey we ask a range of questions about behaviors in college that lead to better career outcomes. We analyze the impact of these behaviors on finding a job within six months and securing stable income. Detailed results are documented in Appendix B. The sample size is small for this type of statistical analysis, yet this year we were able to run a multi-variable regression model on 70 recent graduates, confirming last year’s findings:
• One internship increases the rate of securing full-time employment six months after graduation by nearly 40% and two internships by 50%
• Majoring in STEM increases both chances of employment (20%) and income ($9,000)8
In addition, several other factors continue to appear significant on single variable regressions:
• Graduating from a Best Fit College increases the chance of employment by 20%
• Majoring in social sciences, as compared to another major that is also not STEM (eg liberal arts, business) increases chances of employment by 30%
• Having a well defined plan for postgraduation increases the chance of employment by 10%
Because national research suggests they are important9, we will continue investigating the following college experiences that do not currently appear significant in our data::
• Having a faculty member mentor
• Participating in a campus group or organization
• Holding a leadership role on campus
• We found no direct relationship between paid hours worked and career outcomes, controlling for GPA. However, national research continues to point to the importance of not relying too heavily on work to pay for college so we will keep encouraging our students to work less than 15 hours per week
Page 16 College Track
We captured these findings in easy tips to share with college students.
Do you know a student in college?
Share our tips with them4
TIPS FOR INCREASING THE VALUE OF YOUR COLLEGE DEGREE
1
2
secure two internships keep your loans less than $30,000
3
4
maintain a high GPA work fewer than 15 hours per week
5
identify a faculty mentor
6 attend networking events
7
8
get involved in clubs on campus have a plan for after college Page 17 College Track

Career Choice
6
MANY COLLEGE TRACK GRADUATES CHOOSE CAREERS IN PUBLIC INTEREST
Nearly two thirds of College Track alumni say their job is in the public interest or public service field, which primarily includes education, government, and non profit employers. Our graduates employed in the for- profit sector occasionally identify their work as benefitting the public, as illustrated in Darwin’s story4
“I thought I wanted to be a lawyer, but then I got an internship with President Obama’s speechwriting team during the 2012 campaign. Fighting for a vision of America that provided opportunity for everyone was inspiring-it reminded me of the people at College Track who did so much for me. I am where I am because of those who paid it forward. Because of them, I now get to work on social impact initiatives and campaigns at a national public affairs and political consulting firm, work that I love and believe in.”
-Darwin, College Track Oakland, UCLA Graduate
Darwin has chosen this career path because it resonates with his personal experience and his belief that many individuals can be lifted up from poverty if people like himself work towards this goal. Darwin acknowledges that his wages are lower than what he would have earned as a lawyer, and this experience is confirmed in our data below. Yet our data also show that all other indicators of social mobility and career satisfaction are on par or higher in public interest careers than in the other sectors.
Page 19 College Track
Our
graduates favor jobs in the public interest
Nearly 2/3 say their job is in the public interest
Wages are lower in public interest jobs
Yet social mobility is high for any career choice
I
Note: Individuals who earned their degree from 2006 to 2017 and are employed full-time, excluding those who reported wages below $30,000, or above $150,000, as these few could not be quantified.
My
Public interest careers are more satisfying
COLLEGE TRACK GRADUATES CHOOSE
PUBLIC
MANY
CAREERS IN
INTEREST
78% $58,000 $52,000 $67,000 $88,000 81% COLLEGE TRACK • POST-COLLEGE OUTCOMES
earn more money than my parents
PUBLIC INTEREST Non-profit, schools, government, hospitals, universities, law firms OTHER SECTORS Tech, retail, medicine, pharmaceutical 61% 39% N=54 N=41 N=38 N=15 AGE 25-30 AGE 30-36
Interest N=93
Public
N=56
Other sectors
vs. vs. 74% 61% Public Interest N=77
N=54 vs. vs. Page 20 College Track
job is aligned to my interests + career aspirations
Other sectors
THE EMPLOYMENT LANDSCAPE IS HARD TO NAVIGATE, EVEN WITH A BACHELOR’S DEGREE
This year we asked our graduates if their “job requires a bachelor’s degree” and we found that 27% responded “no”- including a line cook, a train operator, an underwriter, a fraud investigator, and day-care staff. Nationally, the ratio of bachelor’s degree holders “over-qualified” for their occupation is similar, with higher ratios for younger graduates and for those who graduated in a weak economy10 and lower for those who have a graduate degree.
We found these factors to be true for our graduates: for instance, those working in a strong Bay Area labor market are more likely to report a job requiring a bachelor’s degree (78%) than those outside California (59%). Yet we also found that our African American alumni were more likely to be overqualified for their current employment (only 58% say their job requires a bachelor’s degree), hinting at the well known reality of discrimination in the workplace.
We are concerned by these findings because jobs that require a bachelor’s degree pay a lot more: in our sample of 132 individuals who graduated from college more than two years ago and are currently working, the median wage is $20,000 higher for those whose job requires a bachelor’s degree and 13% more report having health insurance (87% vs 74%).11
In years to come we will continue to examine the factors that lead to such under-matching. But we are taking immediate action for our current students, supporting them with internships and post-college plans.
DACA Works
Last year we reported on-the-job outcomes for DACA recipients, which clearly showed that DACA works! For several years, College Track Dreamers had the experience of starting and graduating college with DACA — but this experience is suddenly halted, and now our college Dreamers live without the security that they can compete for a job after they earn their degree. Laura’s story reminds us of the tragedy of this loss: “For me, having DACA didn’t just allow me to live and work in the U.S. It offered an opportunity to pay it forward, advocate for immigrant communities, and help give voice to the voiceless. I graduated from UC Santa Cruz with dual degrees in Latin American Studies and Politics. As a paralegal at The American Bar Association, I plan to get my law degree and become an immigration attorney.”
-Laura, College Track East Palo Alto, U.C. Santa Cruz Graduate
Page 21 College Track

Conclusion
7
College Track’s growing alumni network puts us in a strong position to examine the relationship between college and career as well as the levers to achieving upward social mobility in 21st century America. This year’s research re-affirms our belief that a four-year college degree paves the way to a life of opportunity and agency. Our graduates’ income levels are on par with that of bachelor’s degree holders nationwide and they experience high measures of choice, including where to work, how to align that work to long-term career goals, and whether to continue graduate studies.
One of the key lessons we took away from our investigation is that how one goes to college matters as much as where one goes to college. And we captured some of the critical behaviors that all college students can implement, such as monitoring loan thresholds, linking majors to particular career plans, and getting involved on campus, to be successful.
Our relentless pursuit of what it takes to achieve equity in America will be evidence-based. We will continue to survey our alumni yearly and adapt our model as their number grows to over 1,600 by 2024 across California, Louisiana, Colorado, and the D.C. Metro Area.
Page 23 College Track
Appendix A:
METHODOLGY
At the time of the survey we had 390 graduates and 290 responded (66% response rate), an impressive increase over last year’s 53%, thanks to several efforts. We continued to improve our survey administration rate, but we also used Linkedin for 2017 graduates who did not respond to their first survey (we found 9) and for 2016 or earlier graduates who responded last year but not this year (we confirmed the employment status of all 38). As can be seen in the table below, respondents generally resemble the overall population with a few exceptions: younger graduates seem more likely to respond, as are students who attended a Best Fit College and earned better grades in high school.
RESPONDENT (N=260) NON-RESPONDENT (N=130) Women 75% Men 25% Women 73% Men 27% Gender Race Region College Type Graduation Yr. Yrs To Earn Degree H.S. GPA Latino 46% <2010 16% 2011-2014 46% 2016 17% 2017 22% 4 years 60% 5 yrs 26% 6 yrs 7% 7+ yrs 8% 4 years 58% 5 yrs 20% 6 yrs 8% 7+ yrs 12% <3.0 21% >3.0 71% <3.0 42% >3.0 58% Missing 7% SF Bay Area 72% LA 7% Other 21% No Information Best Fit 70% Other 30% Other 58% <2010 32% 2011-2014 42% 2016 17% 2017 9% Black 28% Asian 20% P.I. 3% Other 4% Latino 50% Black 38% Asian 8% P.I. 3% Other 2% 2017 grads only 2017 grads only Employed survery takers only Best Fit 42% Page 24
Appendix B:
REGRESSION RESULTS: IMPACT OF VARIOUS COLLEGE BEHAVIORS ON CAREER OUTCOMES
For the third consecutive year we asked students several questions about behaviors in college that could influence career outcomes. This year, we had sufficient respondents (combining graduates from 2015 to 2017) to run a more sophisticated analyses. In addition to examining the individual impact of academic and behavioral features on career outcomes, we also looked at their relative impact, controlling for all others. With the exception of internships (the more the better for employment outcomes!) not all these factors appear to be significant every year or in every model. However, our samples are still modest so we will continue studying the relationship between these behaviors and career outcomes as our number of graduates grows.
is from the pooled 2015-2017 graduating classes. Only observations with complete data on these measures were included and the top earners (income >=$75K) were excluded.Employed model is run on all observations. Income model is only run for those who are employed.
Employment Income Statistically significant factors, even when controlling for all demographic, academic, and behavioral factors One internship (compared to none) 0.4 5 More than one internship (compared to none) 0.5 10 STEM major (compared to “not STEM “) 0.2 9 Observations 68 45 Not (yet) statistically significant in the full model, but appear significant in single variable models that control for demogaphics Best Fit college 0.2 4 Social Science major (compared to neither STEM nor social science) 0.3 5 11th grade GPA (for every 1 point increase) 0.2 9 Had well-defined post-college plan (compared to no plan) 0.1 2 Involved in at least 1 club 0.2 2 Held leadership role in a club 0.4 10 Attended networking event 0.3 -11 Not (yet) statistically significant in any model Had at least
job
Had faculty
College GPA Observations 83 to 118 53 to 78 p<0.10 p<0.05 p<0.001 Data
Page 25 College Track
1
in college
mentor
• How long after earning your degree did it take you to secure a job? What type of employment?
• How much do you earn in a year before taxes?
• How much in loans did you have at the end of your studies?
• Do you earn more than your parents do now?
• Is your job in the Public Interest/ Public Service field?
• On a scale of 1 to 5, how would you say your current job aligns with your career aspirations:
• Does your current job require a bachelor’s degree?
• At any point during college, did you have a job to help you pay the bills that was not directly linked to your studies or future career plans?
• At any point in college did you have an internship (or co-op, or workstudy, or job) that was related to your studies or future career plans?
• Did you have a well-defined postcollege plan at any point during college (e.g. you had identified specific roles that you would seek after college, you had identified specific area of graduate study and the right graduate school)?
• Did you have a “mentor-like” relationship with a faculty member or instructor?
• In the past 12 months (while in college), were you involved in a club/organization at your college?
• Did you have a leadership role with that club/organization?
• In the past 12 months did you attend a networking event? (Help Note: For example a career fair, internship fair, event for scholarship recipients or event that includes alumni from your college).
DISCUSSED IN THIS REPORT
Appendix C: SURVEY QUESTIONS
Page 26 College Track
ENDNOTES
(1) National data from NACE First Destinations Survey (2017). Median incomes were also comparable: $47,500 for College Track recent graduates compared to $48,044 nationally.
(2) Some graduates are both employed full-time and in graduate school for a total graduate school enrollment of 13%.
(3) We have current visibility (either via this year’s survey or Linked-in) on 38 of the 40 class of 2016 who took our survey last year - assuming the two for whom we don’t know are unemployed: 70% are employed FT (up from 58%), 10% part-time, 15% in graduate school, and 5% still looking for employment.
(4) https://www.urban.org/sites/default/files/ publication/86981/who_goes_to_graduate_scho ol_and_who_succeeds_1.pdf - 39% of bachelor’s degree holders enrolled in grad school within 4 years of college graduation and 37% of bachelor’s degree holder 25 years and older (ie a wider sample than our current CT graduates) have a graduate degree.
(5) They can be affordable with the right amount of aid and scholarships, but this is not a systematic occurrence for our students so, on a case by case basis, we guide them away from financially unsustainable situations.
(6) Our samples of recent graduates are still small, so we see considerable variation of this result from year to year: last year, when the class of 2016 took our survey within a year of college graduation, 78% said they earned more than at least one parent, compared to only 60% this year.
(7) NCES (2017), Status and Trends in the education of racial and ethnic groups.
(8) Among recent graduates, the most popular majors are Social Science (21%), STEM (21%), Business (13%) and Psychology (11%). Nationally there are fewer Social Sciences (7%), more Business graduates (26%, this is the most popular major) and comparable STEM (20%)The Economic Value of College Majors (2015), Georgetown CEW (p. 11).
(9) Strada. Gallup annual survery of college students and graduates.
(10) Mismatch, Fen 2017, Stephen Rose, Urban.org
(11) College Track Social Mobility Report memo, Dec 2018, Rebecca Gleit, Stanford University PhD candidate.
Page 27 College Track
© 2019, College Track, Inc. Visit collegetrack.org
