Asian/Pacific Islander American Chamber of Commerce & Entrepreneurship
Policy Agenda

ACE POLICY AGENDA 2019
LETTER FROM LEADERSHIP
The Asian/Pacific Islander American Chamber of Commerce and Entrepreneurship (National ACE) represents the voice of the Asian American and Pacific Islander (AAPI) business community and advocates for AAPI entrepreneurs.
Since our founding in 2013, our goal has been clear: to improve the economic and social well-being of the AAPI community. By working with policymakers, business leaders, and private and public stakeholders, we have advocated for public policies that promote growth in our economy, ultimately providing AAPIs with more successful business and economic opportunities.
This is the third publication of our policy agenda, which updates and adds new information to our first two publications, issued in 2014 and 2017.
The goal of this document is to emphasize the policy needs of our diverse community to the White House, to Members of Congress, and to state and local lawmakers. In doing so, it is our hope that we can collaborate and find equitable solutions to address challenges facing our community.
The National ACE 2019 Policy Agenda includes discussion on several critical issues facing our communities and offers common sense, reasonable solutions that should be considered by political and business leaders of all backgrounds.
As shown in this publication, the AAPI business community has made significant contributions to American society with our strong economic output, productivity, ingenuity, and job creation. As the fastest growing ethnic community in the United States, we are confident that our contributions will continue to grow in the years to come.
Our community and economic strength continue to flourish, and we hope to accomplish even more through meaningful input, cooperation, collaboration, and active support from our leaders in the public sector. We stand ready to engage in the policy discussions which will incite positive change for our community.


2
Amar Shokeen Chair, Board of Directors
Jimmy Ferguson Policy Committee Chair
Chiling Tong President and CEO
INTRODUCTION
HEADER: SUBHEADER
National ACE
The Asian/Pacific Islander American Chamber of Commerce and Entrepreneurship (National ACE) was established in 2013 to represent the business interests of Asian Americans and Pacific Islanders (AAPIs) and to improve their economic and social well-being.
National ACE works with policy makers, business leaders and private and public sector stakeholders to advocate for public policies that promote growth in our economy, so that more AAPIs can be successful in creating business opportunities and good jobs.
This policy agenda builds upon our first two publications – issued in 2014 and 2017 – which set forth our top legislative and regulatory policy priorities to aid our mission of supporting AAPI entrepreneurs.
National Ace’s Core Values and Strategies
Deliver Powerful Advocacy:
Represent the united voice of the AAPI business communities and advocate for policy priorities that support our community by working with national, state, and local lawmakers in a nonpartisan approach.
Provide Business Solutions:
Connect local and regional AAPI chambers of commerce, MOU partners, and other stakeholders across the country and provide innovative business solutions through quality programs and services.
Increase Economic Opportunities:
Contribute to our nation’s economic growth, business development, and government efficiency by supporting programs and policies that create more AAPI business owners, entrepreneurs, and corporate leaders.
Maintain Organizational Sustainability:
Build and operate a strong and sustainable organization recognized by peers and policymakers alike as an effective and high performing representative of the national AAPI business community.
1
ACE POLICY AGENDA 2019
HEADER: SUBHEADER ASIAN AMERICANS & PACIFIC ISLANDERS
Asian Americans & Pacific Islanders
According to the U.S. Census Bureau’s 2017 estimates, 22.5 million individuals, or 6.9 percent of the U.S. population, identify themselves as Asian American or Pacific Islander ¹
Yet, it is no easy task to combine all AAPIs into one ethnic category because we can trace our ancestral roots to more than 40 countries and over 50 ethnic subgroups. Across this very diverse community of AAPIs, one can hear over 100 languages and dialects being spoken, in addition to English.
While there may be some differences among the ethnic subgroups, many of the challenges we face are identical. Recent immigrants face difficulties with issues such as language barriers and cultural unfamiliarity, lack of role models or mentors, and limited upward mobility and advancement opportunities in their professions.
We also believe that by harnessing the assets and resources of the broader AAPI community, we can contribute to our nation’s economy together in more meaningful ways. Here are some of our combined community’s demographic characteristics:
AAPI by the Numbers
• AAPIs remain the fastest-growing population segment in America, increasing by 46 percent between 2000 and 2010, four times faster than the growth of the total U.S. population.² The U.S. Census Bureau projects that by 2065, AAPIs will make up 14 percent of the U.S. population.³
• The impressive economic strength of the AAPI community is demonstrated by the increase of AAPI-owned businesses in the past decade; between 2007 and 2012, the number of AAPI business owners grew from 1.5 to 1.9 million, a staggering 24 percent growth rate.⁴
• The buying power of the combined AAPI community is the fastest growing of all racial groups in the U.S. The buying power of AAPIs reached an impressive $986 billion in 2017, which is 6.8 percent of the U.S. total. This number is expected to increase to $1.3 trillion by 2022.⁵
• AAPI-owned businesses generate over $700 billion in annual revenue.⁶
• AAPIs are the nation’s wealthiest consumer segment. In 2017, the median household income for AAPIs was $81,331, surpassing the national median income of $61,312.⁷
• Despite being the nation’s wealthiest consumer segment, there are AAPI subgroups which suffer high rates of poverty. This is often overlooked due to the financial success of the community as a whole. For example, Hmong, Cambodian, and Laotian Americans suffer some of the highest poverty rates, at 38 percent, 29 percent, and 18.5 percent, respectively.⁸
2
HEADER: SUBHEADER
AAPI WOMEN ENTREPRENEURS
As of 2018, there are 1.1 million Asian American businesses owned by women, which represents a growth of 7 percent from 2016.⁹ As much as 39 percent of Asian American women identify themselves as entrepreneurs.¹⁰ While the majority of AAPI-owned businesses are male-owned, within some Asian subgroups, there is less of a gender disparity. For instance, 51 percent of both Filipino- and Vietnamese-owned businesses are women-owned.¹¹
Asian American women own 9 percent of all women-owned businesses in the U.S. and they hire over 1 million workers generating $170.4 billion in revenue.¹² Likewise, there are 36,787 businesses owned by Native Hawaiian and Pacific Islander women that employ 20,443 workers and generate $2.5 billion in revenues.¹³
Asian American women own 9% of all women-owned businesses in the United
States
AVERAGE ANNUAL REVENUE PER AAPI WOMEN-OWNED FIRM
$184,669
HIGHEST AMONGST ALL MINORITY-OWNED BUSINESSES
7.7% MORE THAN ALL WOMEN-OWNED BUSINESSES
From 2017 to 2018, Asian American women-owned businesses grew by 7 percent. At $184,669, the average annual revenue generated per firm by Asian American women-owned businesses is the highest among all minority owned businesses and 7.7 percent more than the average of all women-owned businesses.¹⁴
According to a 2017 Nielson study, the number of American businesses with an Asian woman majority owner increased by 44 percent over the past 5 years, a 54 percent increase.¹⁵
The number of Native Hawaiian or Pacific Islander women-owned businesses grew by 6.3 percent between 2017 and 2018.¹⁶ Women-owned firms make up 47 percent of all Native Hawaiian or Pacific Islander businesses.¹⁷
Entrepreneurship by AAPI women across the board continues to grow, however, data shows that AAPI women continue to face disproportionate challenges gaining access to capital and other resources necessary for success.
National ACE supports measures that enhance women’s participation in the workforce and in starting businesses by ensuring an even playing field between male and female workers and entrepreneurs. National ACE also supports measures that enhance women’s ability to access capital and other resources that are necessary for the success of their businesses.
3
ACE POLICY AGENDA 2019
HEADER: SUBHEADER AAPI MILLENIAL ENTREPRENEURS & ACE NEXTGEN
Millennials [generally considered to be those born between the early 1980s and the late 1990s] are the largest generation in the American workforce, with 56 million Millennials working or currently looking for work. Millennials make up over one-third of the U.S. workforce, nearly a quarter of the total U.S. population at 75 million,¹⁸ and account for 30 percent of the voting age population.¹⁹ Interestingly, almost half – 44 percent of Millennials are minorities.²⁰ Millennials are also the largest and fastest-growing group of consumers.
Asian Americans make up 6 percent of the U.S. Millennial population²¹ and AAPI Millennials make up the largest group of young entrepreneurs. Among AAPIs, Millennials make up nearly 40% of the total AAPI population in the U.S. In fact, 16 percent of Asian-owned businesses are run by those under the age of 35, compared to only 14 percent of Millennial American business owners as a whole.²²
In comparison, 28 percent of Asian-owned businesses are run by those above the age of 55, while 41 percent of American businesses as a whole are run by individuals over 55.²³
This data demonstrates that AAPI Millennials are critical stakeholders in both the AAPI and mainstream business ecosystems, and that their voices will be influential in the policy-making process affecting business issues.
National ACE recognizes the value of working with and nurturing the leadership of AAPI Millennial Entrepreneurs early on, and we developed a unique program geared towards mentoring, networking, and skills-development for these entrepreneurs.
ACE NextGen
ACE NextGen is the premier organization for elevating the success of AAPI Millennial entrepreneurs. ACE NextGen creates and connects a vibrant community of entrepreneurial-minded AAPIs, provides support and resources for the Asian community, and educates through helping AAPIs develop an entrepreneurial mindset and skillset.
The ACE NextGen Program highlights important traits that set AAPI Millennial entrepreneurs apart from other business owners and entrepreneurs:
• AAPI Millennial entrepreneurs are risk takers, creative thinkers, and are highly driven.
• AAPI Millennial entrepreneurs are more flexible and can adjust easily to fast-changing domestic and global business environments. As one of the most technologically inclined ethnic groups in America, AAPIs have learned to adopt technology to business rather than be conquered by it.
• AAPI Millennial entrepreneurs are socially conscious and believe in the importance of corporate responsibility. AAPI Millennial entrepreneurs recognize the need for incorporating hiring policies and business models that cannot be replaced by robotics, despite growing pressure to incorporate automation into the workforce.
By thoughtfully developing a comprehensive program that speaks uniquely to this enterprising generation, National ACE supports the pathway to success by building a platfor m which responds to their needs of efficiency, efficacy, and access to resources. National ACE believes that that through this program, AAPI Millennial entrepreneurs will not only be successful, but will continue to significantly contribute to the U.S. both economically and socially. National ACE will continue to invest in the next generation of entrepreneurs.
4
AAPIs own 6.2 percent of all small businesses in the U.S., accounting for nearly 2 million total businesses employing over 3.5 million workers.
AAPIs own 6.2 percent of all small businesses in the U.S., according to the most recent Kauffman index,²⁴ accounting for nearly 2 million businesses and employing over 3.5 million workers.²⁵ AAPIs own businesses across all sectors, including retail, hospitality, professional, manufacturing, and healthcare. AAPI-owned small businesses make hugely important contributions to the economy that includes revitalizing older neighborhoods, creating new and sustainable jobs, and fueling innovation. Given these contributions, more resources should be invested in supporting these small businesses.
In a survey by National CAPACD, researchers found that some of the major challenges for AAPI small business owners are limited English proficiency and access to affordable business support in their languages of origin.²⁶ Additionally, the survey also reported that 40 percent of AAPI small business owners do not turn to anyone for advice due to lack of affordable assistance.²⁷
The U.S. Census Bureau estimated in 2015 that Asian Americans accounted for 11.5 percent of the manufacturing workforce.²⁸ In 2017, the Trump Administration passed the Tax Cuts and Jobs Act, which set into motion a number of new deductions and credits that will impact the way businesses operate. The new tax law includes changes in tax code for the manufacturing industry that will impact the way manufacturers file their taxes.
The new tax plan repealed what was known as Section 199, which allowed business owners to take a 9 percent deduction on income from qualified production activities, meant to be an incentive for domestic manufacturing.²⁹
National ACE supports efforts made by the government and by third parties to accurately count all members of the AAPI community to best demonstrate our contributions and to ensure that we receive the right representation.
5 ACE POLICY AGENDA 2019 SMALL BUSINESS
ACCESS TO CAPITAL
According to the U.S. Census Bureau, by the year 2044, more than half of Americans will belong to a minority group. This major demographic shift will have a significant impact on the make-up of business ownership, and ensuring greater access to capital for minorities will become a greater concern to the health and sustainability of the U.S. economy in the years to come.
In our 2017 Policy Agenda, it was reported that access to capital was a barrier to access for minority business owners across the board. Recent findings from the Federal Reserve Bank of Cleveland’s 2016 Small Business Credit Survey and the Department of Commerce’s Minority Business Development Agency (MBDA) indicate that access to capital continues to be a challenge that minority business owners struggle to navigate.
Disparities in Access to Capital:
Minority-owned businesses are less likely to receive loans than non-minority owned businesses.
• Non-minority-owned businesses are three times as likely to be approved for a loan than minority-owned businesses.³⁹
Minority-owned businesses receive lower loans compared to non-minority owned businesses.
• Of low-risk applicants, 40 percent of minority-owned businesses received the full amount sought compared to 68 percent on non-minority business owners.⁴⁰
• For medium to high risk applicants, only 21 percent of minority businesses received the full amount sought compared to 32 percent of non-minority businesses.⁴¹
LOW-RISK LOAN APPLICANTS HIGH-RISK LOAN APPLICANTS
40%
68%
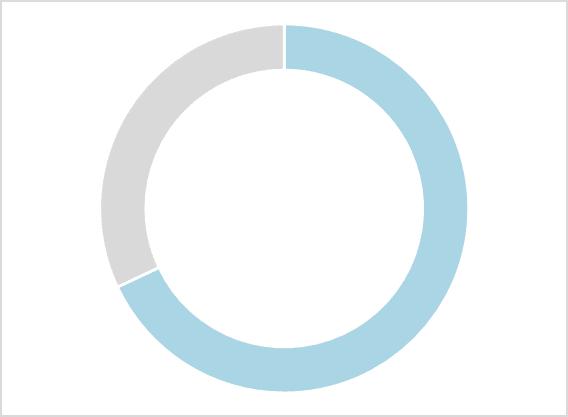
MINORITY-OWNED BUSINESSES THAT RECEIVED FULL AMOUNT SOUGHT
NON-MINORITY OWNED BUSINESSES THAT RECEIVED FULL AMOUNT SOUGHT

21%
32%
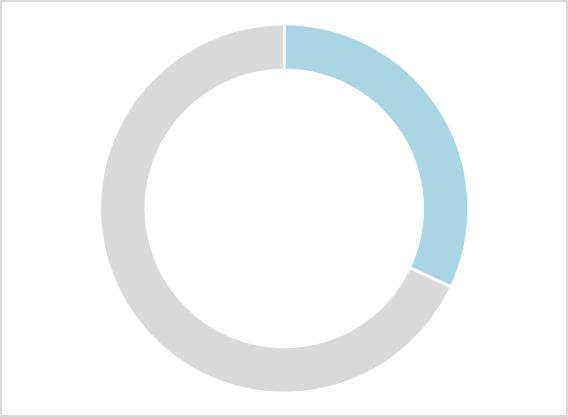
MINORITY-OWNED BUSINESSES THAT RECEIVED FULL AMOUNT SOUGHT
NON-MINORITY OWNED BUSINESSES THAT RECEIVED FULL AMOUNT SOUGHT
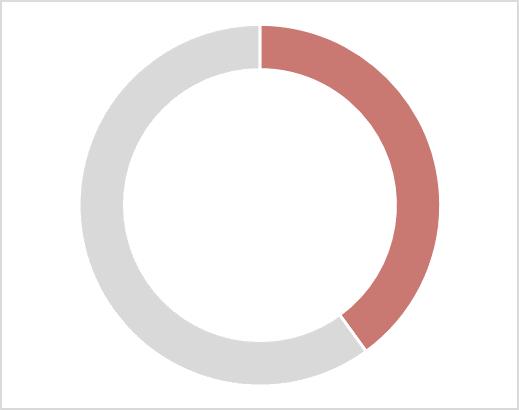
Minority-owned businesses are less likely to apply for loans due to rejection fears compared to non-minority businesses.
• 40 percent of minority-owned businesses did not apply for loans compared with 14 percent of non-minority-owned businesses.⁴²
6
Minority-owned businesses pay higher interest rates that non-minority-owned businesses.
• Minority-owned businesses paid higher interest rates on loans – 7.8 percent on average compared to 6.4 percent for non-minority-owned businesses.⁴³
Non-minority owned businesses are 3x as likely to be approved for a loan than minority-owned businesses
AVERAGE INTEREST PAID ON LOANS 3X
7.8%
MINORITY-OWNED BUSINESSES
AAPI Access to Capital
6.4%
NON-MINORITY OWNED BUSINESSES

A 2016 Kauffman Foundation report, entitled “Startup Financing Trends by Race: How Access to Capital Impacts Profitability,” provided insight specific to AAPI entrepreneurs:
Asian entrepreneurs are most likely to rely on personal and family savings as a source of startup capital.
• 73.2 percent of Asian entrepreneurs and 55.7 percent of Native Hawaiians and Pacific Islanders rely on family and personal savings.⁴⁴
Native Hawaiian and Pacific Islander entrepreneurs are most likely to avoid seeking additional financing due to fear of rejection.
• 60.2 percent of Native Hawaiian and Pacific Islander entrepreneurs avoid seeking additional financing.⁴⁵
• 43.6 percent of Asian entrepreneurs avoid seeking additional financing.
Non-Hispanic White entrepreneurs are most likely to secure business loans from banks and other financial institutions.
• 19 percent of non-Hispanic white entrepreneurs secure business loans from banks and other financial institutions compared to 16 percent of AAPIs.⁴⁶
The Kauffman Foundation’s report concluded that minority-owned businesses disproportionately suffer due to the cost of and lack of access to capital.
National ACE supports efforts to level the playing field for AAPIs in obtaining access to capital. By adopting policies that promote fair lending, prohibit lender disparity, and increase transparency of small business lending, the government can help make more capital available to AAPI entrepreneurs and increase efficiency and equity in the process.
7 ACE POLICY AGENDA 2019
ACCESS TO CONTRACTING OPPORTUNITIES
Contracts with government agencies, corporations, universities, and hospitals are critical for the survival and growth of small businesses. A report by JP Morgan Chase entitled “Helping Entrepreneurs of Color Grow their Businesses” found that minority-owned businesses rely much more on contracting opportunities than non-minority-owned businesses do:
• 90 percent of minority-owned firms report that their growth is mainly attributed to contracting opportunities with large organizations,⁴⁷ compared to 68 percent on nonminority owned businesses.
• 82 percent reported growth to government contracting opportunities,⁴⁸ compared to 48 percent of non-minority owned businesses.
Despite this, contracting opportunities for small minority-owned businesses remain low. In our 2016 report, we highlighted the MBDA paper entitled “Contracting Barriers and Factors Affecting Minority Business Enterprises: A Review of Existing Disparity Studies.” In the report, the MBDA concluded that despite the contracting opportunities available to all small business owners, disparity between minority and non-minority businesses exists at the state and local levels.
A recent white paper published by the National Minority Supplier Development Council shows that disparities continue to exist. In fact, the paper shows that some of the greatest disparities are within Asian American professional services, African American construction services, and Hispanic American architecture and engineering services.⁴⁹ These three groups have the most difficulty securing contracting opportunities in public and private sectors.
Some of the barriers to contracting opportunities for minority-owned small businesses include:
• Companies’ preference to work with contractors with prior experience, demonstrated work product, and a “solid reputation”;⁵⁰
• Outright prejudicial treatment based on racism in both public and private sectors;⁵¹ and
• Lack of access to informal networks that influence learning about obtaining public contracting opportunities.⁵²
While many government agencies encourage contracting to small, women, and minority-owned and/or disadvantaged businesses, most companies and government agencies do not disaggregate data to show which businesses are awarded public and private contracts.
National ACE encourages government agencies to adopt contracting goals that specify assistance to AAPI-owned businesses, as well as publicly sharing this data on a regular basis.
Considering that many AAPI business owners are recent immigrants with language barriers and lack sufficient knowledge about the process of starting and operating a business in the U.S., we believe that the government can do more to reach these small business owners. We encourage outreach in a way that is meaningful and ensures that all qualified businesses have full and fair access to contracting opportunities.
National ACE and our local and regional partner organizations stand ready to partner with government agencies and private-sector contractors to accomplish these goals.
8
CYBER SECURITY
As our daily lives become more intertwined with technology and the internet, the need for a stable, safe, and resilient cyberspace is paramount. Economic vitality and national security depend on a strong, safe cyberspace. If our cyberspace is compromised by cyber threats, such as sophisticated cyber actors, there is an increased risk of other countries exploiting our vulnerabilities to steal money and information, and to develop the capabilities to disrupt, destroy, or threaten the delivery of essential services.⁵³
The U.S. has been victim of a number of cyber-attacks over the past several years, resulting in increased public interest in this policy area. According to a recent report released by the Department of Defense Task Force on Cyber Deterrence, the capabilities of other nations are likely to “far exceed” U.S. ability to defend key critical infrastructures over the next decade.
While cyber-attacks on the U.S. economy and communications systems pose a major threat to the strength and credibility of the U.S., we cannot underestimate the threat of cyber-attacks within our borders and against small businesses and entrepreneurs. According to data compiled by SCORE, almost half of all cyber-attacks are directed at small businesses.⁵⁵ In other words, cyber-attacks against small businesses represent 43 percent of all cyber-attacks in the U.S.⁵⁶
The Top Three forms of Cyber-Attacks in the U.S.
Macro Malware
Macro malware attacks accounted for 113,000 cyber-attacks in 2017; this is malware that is embedded within files.⁵⁷
Online Banking
Online banking malware attacks accounted for 66,000 cyber-attacks in 2017; this is malicious software that steals banking credentials, often through key logging.⁵⁸
Ransomware
Ransomware accounted for 54,000 cyber-attacks in 2017; this is malware that is downloaded from compromised sites or infected files that lock a device until a ransom is paid.⁵⁹
AAPIs own 6.2 percent of all small businesses in the U.S., accounting for nearly 2 million total businesses employing over 3.5 million workers. Millions of AAPI-owned small businesses and their employees are at risk of a cyber-attack, and with the cost of cyber-attacks per year averaging $34,604 for small businesses,⁶⁰ we cannot ignore the risk. Rather, we must increase our efforts to ensure the safety and stability of AAPI small businesses against cyber-attacks, especially given that a mere 16 percent of small businesses in the U.S. report being confident in their cyber security readiness.⁶¹
National ACE supports the use of cyber instruments as a means to deter other countries from committing damaging cyber-attacks against the U.S. that have the potential to compromise our economy and communications systems. National ACE also supports the efforts of the government and the private sector to protect and prepare small businesses against the threat of a cyber-attack.
9 ACE POLICY AGENDA 2019
DEVELOPING AAPI LEADERS
The number of AAPIs in the workforce has grown by at least 20 times since 1960, reaching about 8.9 million workers, or 6.1 percent of the total American workforce.⁶² AAPIs make up a significant portion of the professional workforce, especially among technology companies. In fact, at least 27 percent of the professional staff at Google, HP, Intel, LinkedIn, and Yahoo! identify as AAPI.⁶³ Yet, the number of AAPIs working at or promoted to leadership positions across industries lags far behind the rate of our population growth.
AAPIs in the Private Sector:
AAPIs are the nation’s wealthiest consumer segment and our representation in the workforce continues to grow every year. Yet, if one were to visit the board rooms of the Fortune 500 companies, or C-Suite offices across the country, it would take some time to find an AAPI senior executive or board member.
A recent report by Deloitte, entitled “Women and Minorities on Fortune 500 Boards: More Room to Grow,” highlighted the vast underrepresentation of women and minorities on boards of the Fortune 500 and uncovered some disheartening figures about growth for minorities as a whole. For AAPIs, the report found that:
From 2016 through 2018, AAPI men gained 25 seats on Fortune 500 boards, a 20.3 percent increase.⁶⁴
AAPI women gained 17 seats on Fortune 500 boards in 2018, an increase of 38.6 percent from 2016.⁶⁵
These modest increases represent an improvement for the AAPI community, though the study found that boards will frequently pull from a pool of existing minorities rather than bringing in new faces.⁶⁶ One of the strongest correlations with board diversity was tenure of the company on the Fortune 500 list.⁶⁷
While AAPIs make up a considerable portion of the workforce in Silicon Valley – most notably among five of the top technology companies – AAPIs continue to be underrepresented in senior leadership positions. In fact, studies show that white men are twice as likely to be promoted to managerial and executive positions than Asian men.⁶⁸ Despite the progress made by white women in the workforce, the same cannot be said of Asian women, who continue to move up the executive ladder at a much slower rate.⁶⁹ Given the large number of AAPIs in the technology sector, the absence of AAPI leadership is particularly disappointing.
Lack of AAPI representation in leadership roles is not limited to the technology industry. According to a study done by the Yale Law School and the National Asian Pacific American Bar Association,
10
Asian Americans are well represented in law, making up over 10 percent of graduates at 30 top law school.⁷⁰ Once again, despite this representation, Asian Americans have the highest attrition rates as well as the lowest ratio of partners to associates among all racial groups.⁷¹
AAPI in Leadership
AAPI in STEM FIELDS
50% vs 14%
Total Workforce vs. Executive Board Positions in Silicon Valley
57% vs 17%
Tech Workers vs Leading Technology Teams at Yahoo
41% vs 19%
Employees vs Managerial Roles at Facebook AAPI U.S. MEMBERS OF CONGRESS: 3.7% (20 of 535)
AAPIs in the Public Sector:
Representation of AAPIs in the public sector is just as important as in the private sector. In order for our nation and our governments to accurately represent the American people, it is critical that laws and policies reflect demographic changes.
In the 116th Congress, there are 20 Asian Americans and Pacific Islander elected officials, a new high, surpassing 18 AAPIs in the 115th Congress.⁷² This is the second Congress in a row in which AAPIs have hit a high of elected officials, which is representative of the increasing AAPI population. As the demographic makeup of our country continues to change rapidly, it is critical that our laws and policies change with it to ensure that they reflect those changes and anticipate challenges before they arise or become broader issues.
National ACE believes it is the responsibility of both the government and active citizens to participate in a way that ensures each voice is heard in our law-making processes. We will continue to identify and encourage more AAPIs to seek elective office and to be appointed to serve in policy-making positions across the political spectrum.
National ACE will also continue to encourage and work with the private sector to ensure that more AAPIs have an opportunity to advance in senior leadership positions, expand their professional networks, and build the essential skills they need to succeed.
National ACE encourages both the government and private sector employers to do all they can to ensure that AAPIs are represented at all levels, and that qualified AAPIs have a seat at the negotiating table in corporations and in government alike.
11 ACE POLICY AGENDA 2019
DISAGGREGATED DATA
The AAPI community is a very diverse group, which has made collecting quality data about our community a challenge. As the AAPI community continues to grow, data collectors have failed to make distinctions between sub-Asian American groups and the unique challenges faced by each diverse group.
There are at least 40 ethnic subpopulations compromising the AAPI population,³⁰ which is not accounted for in current or recent data. AAPIs are one of the hardest groups to count in the U.S.³¹ “The Census Bureau attributes this to the fact that many AAPIs fall into a category of “racial and ethnic minorities who do not speak English fluently, are lower income persons, undocumented immigrants and who distrust the government.”
While there is limited data on levels of trust in the government among AAPIs, the Census Bureau suggests that because Asian immigrants can come from countries that do not have a census system in place or that have used such as a system to harm community members, there may be a heightened distrust among AAPIs.³²
Making sure everyone is counted:
• Nearly 32 percent of AAPIs living in America are non-citizens;³³
• AAPIs account for roughly 14 percent of the undocumented population;³⁴ and
• Only 35 percent report having high rates of limited English proficiency.³⁵
Indeed, there is a high risk that certain members of the AAPI community will not be accounted for in the 2020 Census.
A survey released by the Census Bureau entitled “The 2020 Census Barriers, Attitudes, and Motivators Study (CBAMS)” yielded alarming results: only 55 percent of Asian Americans that were surveyed indicated that they were “extremely” or very likely” to fill out the Census form.³⁶ Furthermore, 38 percent of Asian Americans said that they were “not too familiar” or “not at all familiar” with the Census.³⁷ Most shockingly, the survey revealed that 41 percent of Asian Americans reported concerns that the Census will be used against them.³⁸
Policymakers use census data to reapportion seats in Congress and to redistribute billions of dollars for federal, state, and local resources, making a complete and accurate Census count a social and economic necessity. As we prepare for the 2020 Census, it is important that the right steps are taken to ensure that all AAPIs are correctly counted so that our interests are appropriately represented, and resources are properly distributed. It is critical that the government make every effort to ensure that everyone in the U.S. is counted, including AAPIs. National ACE fully supports an increase in the number of languages in the video and printed guides provided by the Census Bureau, the collection of Census responses in as many languages as possible, and an increase in the number of languages to choose from when answering Census questions.
National ACE supports efforts by the government and private sectors to disaggregate the collection and analysis of data relating to the AAPI community. We also support the utilization of third parties to help the government collect and evaluate data and to improve the efficiency of the collection process.
12
ECONOMIC DEVELOPMENT
The AAPI business landscape is one of the most vibrant and fastest growing in the U.S. today. This is particularly true in emerging industries such as information technology, biomedical healthcare industry, pharmaceuticals, scientific, and technical services. As of 2018, AAPIs make up 6.8 percent of the total U.S. population. Together, AAPIs make up 6.1 percent of the total workforce in the U.S., according to the most recent U.S. Census Bureau data.⁷³
The contributions of AAPI-owned businesses are remarkable – employing 3.6 million workers⁷⁴ with nearly $1 trillion in spending power and generating over $700 billion in annual revenue.⁷⁶
AAPI Growth in Technology
• Asian Americans make up large portions of employees at technology giants in the Silicon Valley such as Google (34 percent) and Facebook (41 percent).⁷⁷
• Asian American workers account for 6 percent of the workforce and make up 27 percent of all technology sector workers.
AAPI Growth in Medical, Pharmaceutical, and Biomedical Industries
• AAPIs are the second most represented group for occupations such as physicians (20 percent), pharmacists (18 percent), and dentists (14.5 percent).⁷⁸
AAPI growth in Information Technology (IT)
• AAPIs account for the largest percentage of IT workers, compromising 18 percent of all IT workers.⁷⁹
The number of AAPIs working in emerging industries has increased substantially over the last decade. However, AAPIs still face an uphill battle being welcomed into the C-Suite. A study conducted by the Wharton School and the University of Amsterdam found that Asian Americans are two and half times more likely to be appointed as CEOs when companies are struggling rather than succeeding.⁸⁰ Furthermore, a number of companies, such as Goldman Sachs, reported that while 27 percent of its U.S. professional workforce were Asian American, only 11 percent of its U.S. executives and managers and none of its executive officers were Asian American.⁸¹
AAPI Income
• The buying power of Asian Americans increased by 257 percent between 2000 and 2017, which exceeds increases in buying power for all other racial and ethnic groups in the U.S.; and
• The median income for Asian Americans is $76,000 and $54,900 for Native Hawaiians and Pacific Islanders, surpassing the national median income of $55,300.⁸²
AAPI income and buying power has and continues to increase. AAPIs are often referred to as the wealthiest ethnic group in the U.S., which can be attributed to both immigration and higher levels of education.
Despite this progress, AAPIs also experience the greatest income inequality of all ethnic groups in the U.S. The 90th percentile of AAPIs earns 10.7 times more at $133,529 than the 10th percentile of AAPIs at $12,478 per year.⁸³
National ACE supports research that focuses on income inequality within the AAPI community.
National ACE also supports measures that enhance the ability of AAPIs to be promoted to executive positions and that support upward mobility for AAPIs in the workplace.
13 ACE POLICY AGENDA 2019
EDUCATION AND THE WORKFORCE
Access to Education at Every Level
AAPIs are one of the fastest growing ethnic groups in the U.S., currently accounting for nearly 7 percent of the total population. According to the U.S. Census Bureau, AAPIs will make up roughly 9.4 percent of the total population by 2060.⁸⁴ As of 2010, AAPIs make up 5 percent of all students enrolled in public schools, and are expected to make up 6 percent by 2020.⁸⁵ To invest in the education and the future of AAPIs is to invest in the future of the American economy. National ACE supports efforts by the government to enact policies that will prepare students for a competitive workforce and provide them with the tools to succeed.
Education among AAPI subgroups:
Disparities between different subgroups of the AAPI community can be demonstrated by the quality of education among the subgroups. For example, in 2014, among all Asian students ages 16-24, the high school dropout rate was 3 percent. However, the 5 Asian subgroups below had much higher dropout rates:
• Burmese – 27 percent dropout rate⁸⁶
• Nepalese – 20 percent dropout rate⁸⁷
• Laotian – 9 percent⁸⁸
• Cambodian – 8 percent⁸⁹
Examining disaggregated data among AAPIs reveals that, despite the stereotype that all AAPIs achieve higher academic success than other groups, Southeast Asian Americans tend to struggle more academically and have the highest poverty rates among communities of color.⁹⁰ The model minority myth perpetuates the exclusion of AAPIs within the larger discussion on the needs of racial and ethnic minorities in both public and higher education.
AAPIs in STEM and in the Workforce
The most recent U.S. Census Bureau data available shows that there are about 8.9 million AAPI workers in America, accounting for 6 percent of the total workforce.⁹¹ AAPIs fill critical gaps in the labor market, such as those in science, technology, engineering, and mathematics (STEM). STEM careers are projected to play a key role in U.S. economic growth going forward. The STEM field adds 800,000 new jobs to the economy, growing 37 percent faster than the U.S. economy as a whole.⁹² One in six AAPIs hold jobs in science, technology, engineering, or mathematics.⁹³ In other words, AAPIs are more than twice as likely to work in STEM than U.S. workers overall, making up 15.1 percent of the overall STEM workforce.⁹⁴
Wages Among AAPIs
Wage earnings among AAPIs ranges from sector to sector, though a Pew Research Center study highlights important facts about wages for AAPIs:
• Asian men are the only group that out-earn their white counterparts, earning a median $24 an hour, compared to $21 an hour for white men.⁹⁵
• On average, women tend to earn less than white men and men in their own racial or ethnic group. Asian women earn a median $17 an hour, compared to $18 for white women, $21 for white men and $24 for Asian men.⁹⁶
It is important that we work toward leveling the playing field and ensure that all Americans are fairly compensated for their work. This is why National ACE supports efforts by the private sector and by the government to close the wage gap between the highest earners and AAPIs performing the same job.
14
HEALTHCARE
Healthcare remains one of the most complex policy areas in America today. According to a recent Gallup Poll, 80 percent of Americans say that healthcare is extremely or very important to their vote.⁹⁷ Among AAPIs, healthcare is an extremely important issue for 50 percent of Asian Americans,⁹⁸ which is why National ACE supports policies that will increase access to affordable healthcare and medicine for AAPIs.
Access to healthcare varies among Asian Americans, Native Hawaiians, and Pacific Islanders. Research shows that Native Hawaiians and Pacific Islanders (NHPIs) are more likely to be uninsured than Asian Americans, and as a result, typically face greater health risks and suffer from health conditions more often.⁹⁹
Native Hawaiians and Pacific Islanders:
• NHPIs tend to fare worse than Asian Americans on health measures: 12 percent of NHPIs report having either fair or poor health, 10 percent report ever having diabetes, and a striking 19 percent report ever having asthma.¹⁰⁰
• 23 percent of non-elderly NHPIs report struggling to pay medical bills and while the uninsured rate for NHPIs has declined since passage of the Affordable Care Act (ACA), 11 percent of NHPIs were uninsured as of 2016.¹⁰¹
Asian Americans:
• Asian Americans tend to fare better than both NHPIs and White Americans on health measures: only 6 percent of Asian Americans report having fair or poor health, 4 percent report ever having diabetes, and 8 percent report ever having asthma.¹⁰²
• Interestingly, only 9 percent of non-elderly Asian Americans report struggling to pay medical bills, a stark difference from NHPIs (23 percent) and White Americans (16 percent).¹⁰³ As of 2016, 7 percent of Asian Americans were uninsured, compared to 7 percent of uninsured White Americans.¹⁰⁴
Healthcare among AAPI Women:
Despite the significant health insurance gains among all ethnic groups across the U.S. since the Affordable Care Act was implemented, coverage disparities remain, particularly with Native Hawaiian Pacific Islander women.
• Research found that 16 percent of NHPI women are uninsured, compared to 8 percent of white women.¹⁰⁵
• One in three low-income NHPI women are uninsured, compared to 1 in 6 low-income white women.
• In states that have not expanded Medicaid coverage, NHPI women have some of the lowest rates of health insurance coverage.
15 ACE POLICY AGENDA 2019
Data released by the U.S. Census Bureau shows that, since the implementation of the ACA, there have been significant health insurance gains for Asian American women.
• 8 percent of Asian women are uninsured, similar to white women, roughly 8 percent of whom are also uninsured.¹⁰⁶
• Only 1 in 5 low-income Asian women are uninsured, a similar rate to the 1 in 6 low-income white women who are uninsured, and lower than the 1 in 3 low-income NHPI women who are uninsured.¹⁰⁷
• Similar to NHPI women in states where Medicaid coverage has not been expanded, Asian women have the lowest rates of health insurance coverage.
NATIVE HAWAIIANS & PACIFIC ISLANDERS
ASIAN AMERICANS
REPORT AS FAIR OR POOR HEALTH
12%
NON-ELDERLY STRUGGLING TO PAY MEDICAL BILLS WOMEN UNINSURED
LOW-INCOME WOMEN UNINSURED
23% 16% 1 in 3
6% 9% 8% 1 in 5
Healthcare among Aging AAPIs:
According to a recent report released by AARP, 14 percent of AAPIs aged 50 or older do not have health insurance, compared to only 9 percent of the total U.S. population. Among AAPIs 65 and older, 6 percent are uninsured, compared to only 1 percent of the total population.¹⁰⁹
Data on healthcare and access to health insurance for AAPIs is often limited and outdated, this is partially due to the “model minority myth” which suggests that all AAPIs are doing better socially, economically and academically than other minority groups.
National ACE supports more research into the health and healthcare of AAPIs to better inform public leaders of the challenges that AAPIs face on a day-to-day basis. National ACE also supports legislation that increases access to healthcare for low-income Asian Americans, Native Hawaiians, and Pacific Islanders as these groups tend to disproportionately lack access to affordable healthcare.
16
In 1960, AAPIs made up only 5 percent of all foreign-born Americans. According to recent Census data, 39 percent of immigrants that arrived in the U.S. between 2010 and 2017 arrived from Asia.¹¹⁰
By 2055, AAPIs are projected to be the largest immigrant group in the U.S.
By 2055, AAPIs are projected to be the largest immigrant group in the U.S.¹¹¹ This surge in our foreign-born population is a result of the landmark 1965 Immigration and Nationality Act, which for the first time in U.S. history, allowed large scale immigration from countries other than those in Western Europe.
The 1965 law replaced a quota system based on national origin with a policy based on uniting families. This enabled the first wave of Asian immigrants following the 1965 law to eventually sponsor their extended families to immigrate once they settle into their new lives in America.
Because the new immigration law also placed a preference for people with certain desirable skills, many educated Asians decided to move to America to pursue economic opportunities that they would never have in their underdeveloped home countries.
That background partially explains why so many AAPI immigrants tend to start their own businesses as soon as they are able to save up enough cash from working in whatever jobs they are able to find as new arrivals. Additionally, because of the family preference policy, many of these new immigrant entrepreneurs would recruit their recently-immigrated siblings and relatives as reliable workers in their small businesses.
AAPI entrepreneurs take different paths to come to the U.S., including student visas to gain higher education, H1-B visas for highly-skilled workers, and EB-5 immigrant investor program.
National ACE supports immigration reform that first secures our borders, while also providing pathways for more educated and skilled workers to immigrate and contribute to the U.S. economy.
We celebrate the long and proud history of AAPI immigrants and their families who continue to exhibit a consistent pattern of entrepreneurship, which ultimately benefits the U.S. economy.
17 ACE POLICY AGENDA 2019 IMMIGRATION
INTERNATIONAL COMMERCE
Trade and Tariffs
In our previous edition of this report, we praised the Trump Administration’s position on international trade, that “it can be used to grow our economy…revitalize our nation’s suffering communities.” This is a position that we continue to maintain, as international commerce provides an excellent opportunity to grow our nation’s economy, create more jobs, and maintain security and stability throughout the world.
AAPIs Impact for International Commerce
AAPI-owned businesses are uniquely positioned to play a vital role in fostering strong international relationships between America and the Asian Pacific market, providing the U.S. with a great opportunity for economic growth and prosperity.
The Asia-Pacific Region
• The Asia-Pacific Region accounts for approximately 39 percent of the world’s population, 60 percent of the world’s total GDP, and 47 percent of the world’s trade.¹¹²
• In 2016, U.S. goods and services traded with Asia-Pacific region economies totaled to $2.8 trillion, while exports totaled to $1.6 trillion.¹¹³
• Impressively, U.S. exports to the region totaled $972.2 billion, a 7.4 percent increase from 2016.¹¹⁴
• Trade between America and the Asia-Pacific region supports over 3.4 million jobs in the U.S., amounting to 30 percent of the 11.5 million jobs supported by our exports around the world.
In other words, the Asia-Pacific region remains one the America’s most valuable trade partners, generating trillions in revenue each year. The Asia-Pacific region is the second most traded market for the U.S., following the Western Hemisphere.
Intellectual Property
Intellectual property rights are increasingly becoming an important factor for business, academia, and innovation in the U.S. and around the world. This is particularly true in the field of technology, which employs more AAPIs than nearly any other sector of the U.S. economy. Additionally, intellectual property protection is critical for small business owners. Without intellectual property protection, inventors, innovators, and artists risk not being fully compensated for their work.
The Intellectual Property Commission estimates that international intellectual property theft accounts for losses of roughly $300 billion per year.¹¹⁵ Intellectual property theft can be detrimental for small business owners, especially those who do not have the resources to seek and secure legal help once their ideas are used without permission.
National ACE supports efforts by the government to protect intellectual property of small business owners, entrepreneurs, artists, and innovators in our communities.
18
PRIVACY
As the Internet and technology irreversibly become more integrated into our daily lives, it is essential that the privacy of Americans is protected with the development of each new platform, app, and device. In the last three years, there has been a 42 percent increase in the number of people using the internet.¹¹⁶ Given this exponential increase in internet users, National ACE fully supports efforts by the government to implement stronger, more consistent privacy protections and efforts by the private sector to practice them. National ACE strongly believes that consumers should understand how their data is used and shared and should have the opportunity to consent to data collection and have access to that data.
The Dark Side of Data Collection
As we navigate the increasing complexities of the 21st century’s Digital Age, consumers remain vulnerable to a company’s ability to discriminate against certain communities. Companies collect data with cookies, heatmaps, GPS tracking, license plate images, signal trackers, the monitoring of in-store Wifi activity, and social media activity, among others.¹¹⁷
Through legal means or otherwise, it is not difficult to obtain information on an individual’s race, income, credit score, etc. from one’s browsing history, location, and other private information.¹¹⁸ This mass collection of data has resulted in targeted ads, hidden bias, data discrimination, and the exploitation of vulnerable groups. Harmful data collection has also resulted in different price advertisements based on factors such as race and location of the consumer. Often, more vulnerable groups are exposed to higher prices and inflated interest rates for credit opportunities than the less vulnerable.¹¹⁹
Americans on Data Collection
Data privacy remains a top issue for most Americans, yet a large portion of Americans do not understand how companies share their personal information. The National Cyber Security Alliance released a survey finding that 91 percent of U.S. internet users worry about online privacy, while only 31 percent understand how their information is used.¹²⁰ In fact, 68 percent of U.S. internet users responded as more concerned about not knowing how personal data collected online is used than they were about losing their main source of income.¹²¹ With this mind, National ACE believes that consumers have the right to know what information is being collected as well as a reasonable understanding on how that information will be used or shared.
19 ACE POLICY AGENDA 2019
TAXES AND REGULATIONS
AAPI-owned businesses share the same level of dissatisfaction as all businesses in the U.S. about having to deal with burdensome government regulations and bureaucratic red-tape requirements. At the same time, AAPI-owned businesses are more than willing to pay their fair share of taxes.
At the end of 2017, Congress passed the Tax Cuts and Jobs Act – the first major piece of legislation enacted by the Trump Administration. The new tax code set into motion new deductions and credits that will affect all business owners tax liability differently. Most notably, the new tax law cuts the corporate tax rate from 35 percent to 21 percent.
Tax Cuts and Jobs Act
There are several deductions and changes for business owners packaged within the Tax Cuts and Jobs Act. Some of the major changes and deductions include:
The Pass-Through Deduction:
• The pass-through entity passes profits and losses through to the owner, rather than paying income taxes as a separate entity. Under the new tax plan, small businesses can take a 20 percent income deduction.¹²²
Increased Write-Offs for Large Expenses:
• Business owners can now write off the entire cost of an equipment purchase rather than partially writing it off each tax season.¹²³ Previously, business could only deduct up to $510,000 in equipment purchases and can now deduct up $1 million in equipment purchases. ¹²⁴
• Small business owners can now deduct 100 percent of the cost of an asset the year it is purchased, whereas before only 50 percent of the value was deductible.¹²⁵
Business Interest Deduction:
• Previously, the business interest deduction was an important part of the tax code that helped small business owners taking out loans to cover operational costs; interest on business loans were previously deductible as an ordinary business expense.¹²⁶ Under the new tax law, the business interest deduction is reduced to 30 percent, having a major impact on the way that small business owners file taxes.¹²⁷
Employee Meal Deduction:
• Under the new tax law, the deduction for food expenses is cut to a 50 percent deductible.
Entertainment and Transportation Deductions:
• The Tax Cuts and Jobs Act does away entirely with deductions for entertainment, however, the law does still allow for meals related to client services to be deducted up to 50 percent. Similarly, business owners can no longer deduct the cost of providing employee parking, public transportation passes, and bike commute reimbursements.¹²⁸
20
The “Retail Glitch”
• The Tax Cuts and Jobs Act includes a provision known as the “100 percent bonus depreciation”. The provision was intended to help businesses, by allowing them to immediately deduct the cost of certain investments.¹²⁹
• Due to congressional oversight, the law inadvertently excludes categories for improvement property investment from the provision. Due to this glitch, improvement property investments may face a higher tax burden.¹³⁰
• National ACE supports efforts to fix the “Retail Glitch.”
Sale of depreciable property between related taxpayers
• Many AAPI small businesses are family-owned, and many businesses are passed down through generations, which makes U.S. tax code § 1239 a challenge for the community.
• Tax code § 1239 requires that any gains recognized in an exchange between related parties to be treated as ordinary income, and will be treated as such, even if the purchaser decides not to depreciate the asset or chooses another method of expensing.¹³¹
The new law will change the way that many small businesses operate on a day-to-day basis, and we continue to advocate for more ways in which the government can reduce the tax burden for AAPI-owned businesses.
AAPI-Owned Businesses:
There are approximately 1.9 million Asian-owned businesses¹³² and 55,000 Native Hawaiian Pacific Islander-owned businesses in the U.S. The combined AAPI community employs 3.6 million Americans. Most AAPI-owned businesses employ fewer than 20 people and 10 percent employ 500 or more employees.¹³³
Stated differently, of the 3.6 million people employed by AAPI-owned businesses, 3.2 million are employed by firms with fewer than 500 employees.
National ACE supports all efforts to reduce or eliminate the number of taxes and fees, bureaucratic regulations, and compliance requirements that are not essential to meet legitimate government licensing and enforcement needs.
We also support reducing or eliminating duplicative compliance requirements mandated by multiple federal agencies, or by different levels of governments.
We believe effective use of technology and data-sharing by the government can accomplish many of the goals it seeks without having to make multiple requests to small businesses, which are focused on trying to sustain and grow their operations.
National ACE supports any innovative programs or services that may be offered to AAPI-owned businesses to assist them with easier and less-costly compliance processes.
21 ACE POLICY AGENDA 2019
TECHNOLOGY
Technology continues to become a more integrated part of our everyday lives. It is a major component of the way that we approach business, healthcare, government operations, and personal communication with one another. Advances in technology have made our lives more convenient, allowed for our world to move much faster, and overall, has improved our quality of life.
AAPIs in Technology
Silicon Valley is renowned worldwide as one of the largest technological hubs. Between 2012 and 2018, the Valley generated $140 billion in revenue – mostly through startups and venture capital –leading Beijing ($72 billion), New York ($36 billion), and Shanghai ($23 billion).¹³⁴
As of 2015, Asian Americans made up 47 percent of the professional workforce in Silicon Valley.¹³⁵ In fact, among the 5 largest technology companies – Google, HP, Intel, LinkedIn, and Yahoo! – Asians and Asian Americans represent 27 percent of the professional workforce.¹³⁶
Asian Americans have played an important role in technological advances coming out of Silicon Valley. Although, despite making up such a large portion of the professional high-tech workforce, there are very few AAPIs in leadership positions among technology companies.¹³⁷
A 2018 report by McKinsey shows a significant correlation between executive team diversity and financial performance, finding that diverse executive teams are 15 percent more likely to experience above average profitability than companies with less diverse executive teams.¹³⁸ National ACE supports efforts by the private sector to elevate more AAPIs to leadership positions in the high-tech sector and across all sectors. Furthermore, National ACE wants to see broader private sector efforts to ensure that AAPIs develop the professional skills they need to succeed in senior leadership roles.
Technology in Healthcare
Technology has become a critical tool in the medical field and has saved countless lives as a result. The medical market in Asia is booming, so much so that by 2025, it could account for a third of the global market.¹³⁹ Given the community’s ties with Asian-Pacific nations, AAPIs have the potential to play an important role in the field of medical technology.
22
23 ACE POLICY AGENDA 2019
NATIONAL ACE BOARD OF DIRECTORS
Chair of the Board:
Amar Shokeen, CEO, Apolis
Directors:
Mariko Carpenter, Vice President, Strategic Community Alliances, Nielsen
Ed Chan, Senior Vice President & Chief Network Engineering Officer, Verizon
Andrew Chau, Co-Founder, Boba Guys
Jamie E. Chung, SVP and General Counsel, Walmart U.S. eCommerce
Tracey Doi, Chief Financial Officer and Group Vice President, Toyota Motor North America
Karen Eng, President and CEO, CSMI
Jimmy Ferguson, Owner/Operator, J-C’s McD’s Ltd.; Chair, Asian McDonald’s Operators Association
Garrett Gin, Senior Vice President/Market Executive, Local Markets Organization, Bank of America
Dennis Huang, Executive Director and Chief Executive Officer, Asian Business Association
Bill Imada, Founder, Chairman, & Chief Connectivity Officer, IW Group, Inc.
Susan Jin Davis, Chief Sustainability Officer, ComcastNBCU
Pat Fong Kushida, President & CEO, California Asian Pacific Chamber of Commerce
Shau-wai Lam, Chairman Emeritus, DCH Auto Group
Christopher K. Law, National Vice President, Asian Initiatives, UnitedHealthcare
Marty Lorenzo, Vice President Legal, Affairs & Assistant Corporate Secretary, Petco
Ian So, ACE NextGen Board Chairman and Co-Founder & CEO, Chicken & Rice Guys
Thear Sy Suzuki, Americas Advisory Talent Leader, EY
Terrez Marriott Thompson, Vice President, Global Supplier Diversity, The Coca-Cola Company
Wallace K. Tsuha, President, The Tsuha Foundation
Helene Yan, Vice President, Business Strategy, Interpublic Group of Companies
24
ACKNOWLEDGEMENT
The publication of the third Asian and Pacific Islander American Chamber of Commerce and Entrepreneurship (ACE) Policy Agenda was made possible by a wide array of supporters, especially our Policy Committee Chairman Jimmy Ferguson, Development Committee Chairman Bill Imada, President and CEO Chiling Tong, Vice President of Development Daniel Oliver, and Executive Assistant Michelle Im
National ACE would also like to thank Public Private Strategies, whose team provided content and policy advisement, Andrew Chau and Jesse Fresnedi for the graphics and design, and the board of directors and members of the Policy Committee for providing insights into the preparation of this report.
If you have any questions about the content of this publication or would like to recommend additional ideas to be considered for future versions, please contact:
National ACE 1300 Pennsylvania Avenue, NW Suite 700 Washington, DC 20004 ceo@nationalace.org
25 ACE POLICY AGENDA 2019
REFERENCES
1. The Asian Real Estate Association of America “State of Asian America” (201718) Retrieved from https://www.dropbox. com/s/9gtjzt98yfmj0h3/StateofAsia2018_ vFINAL_3.pdf?dl=0The Leadership Conference Education Fund (2018, April) “Will you Count? Asian Americans and Native Hawaiians and Pacific Islanders (NHPHIs) in the 2020 Census” Retrieved from http://civilrightsdocs.info/pdf/census/2020/Fact-Sheet-AA-NHPI-HTC.pdf
2. The Leadership Conference Education Fund (2018, April) “Will you Count? Asian Americans and Native Hawaiians and Pacific Islanders (NHPHIs) in the 2020 Census” Retrieved from http:// civilrightsdocs.info/pdf/census/2020/ Fact-Sheet-AA-NHPI-HTC.pdf
3. Pew Research Center (28 September 2015) “Modern Immigration Wave Brings 59 million to U.S., Driving Population Growth and Change through 2065” Retrieved from https://www.pewhispanic. org/2015/09/28/modern-immigrationwave-brings-59-million-to-u-s-driving-population-growth-and-changethrough-2065/
4. Frauenfelder, Mary (27 July 2016) U.S. Census Bureau “Asian Owned Businesses Nearing 2 Million” Retrieved from https://www.census.gov/newsroom/ blogs/random-samplings/2016/07/asianowned-businesses-nearing-two-million. html
5. New American Economy (2017, October) Power of the Purse: How Asian Americans and Pacific Islanders Contribute to the U.S. Economy” Retrieved from http://www.newamericaneconomy.org/ wp-content/uploads/2017/10/NAE-AAPI-v14.pdf
6. Nielson (5 May 2018) “Asian Americans: Digital Lives and Growing Influence” Retrieved from https://www. nielsen.com/content/dam/corporate/ us/en/reports-downloads/2018-reports/ asian-american-consumer-report-may%20 2018.pdf
7. Peter G. Peterson Foundation (2018, September) “Income and Wealth in the United States: An Overview of Recent Data” Retrieved from https://www.pgpf. org/blog/2018/09/income-and-wealth-inthe-united-states-an-overview-of-data
8. Chen Sammi (10 May 2018) “Racial Wealth Snapshot” Retrieved from https://prosperitynow.org/blog/racial-wealth-snapshot-asian-americans
9. Giese, Catherine (10 December 2018) “U.S. Small Business Employment and Growth: All the Statistics you need to Know” Retrieved from https://www. fundera.com/blog/small-business-employment-and-growth-statistics
10. Gunasekara, Surya (29 May 2018)
“The Trump Economy is a boon for Asian American Small Business Owners” Retrieved from https://www.washingtonexaminer.com/opinion/op-eds/ the-trump-economy-is-a-boon-for-asianamerican-small-business-owners
11. National CAPACD “Small Business,
Big Dreams” Retrieved from https:// www.nationalcapacd.org/wp-content/ uploads/2019/03/CAPACD_SmallBusinessReport_final_web.pdf
12. U.S. Census Bureau (2015) “Selected Population Profile n the United States: 2015 American Community Survey 1-year Estimates” Retrieved from https://factfinder.census.gov/faces/tableservices/jsf/ pages/productview.xhtml?src=bkmk
13. Almeleh, Shira (25 January 2019)
“How the Trump Tax Plan Will Affect your Small Business” Retrieved from https:// www.fundera.com/blog/trump-tax-plan
14. American Express OPEN (2018, April)
The 2018 State of Women-owned Businesses Report: A Summary of Key Trends, 2007, 2012, 2017, 2018.” Retrieved from https://ventureneer.com/wp-content/ uploads/2018/08/2018-state-of-womenowned-businesses-report_FINAL.pdf
15. APartnership (11 February 2019)
“Asian Americans: New Faces of Entrepreneurship” Retrieved from http:// apartnership.com/asian-americans-entrepreneurship/
16. American Express OPEN (2018, April)
The 2018 State of Women-owned Businesses Report: A Summary of Key Trends, 2007, 2012, 2017, 2018.”
17. Rosen, Elizabeth (19 March 2018)
“Asian American Women forge new paths as Entrepreneurs” Retrieved from https://asia.nikkei.com/Location/ Rest-of-the-World/North-America/AsianAmerican-women-forge-new-paths-asentrepreneurs
18. Frey, William H. (January 2018) “The Millennial Generation: A Demographic Bridge to America’s Diverse Future” Retrieved from https://www.brookings. edu/research/millennials/
19. Nielson (1 January 2017) “Multicultural Millennials: The Multiplier Effect” Retrieved from https://www.nielsen.com/ us/en/insights/reports/2017/multicultural-millennials--the-multiplier-effect.html
20. U.S. Small Business Administration, Office of Advocacy (2012) “Survey of Small Business Owner Facts: Asian Owned Businesses in the United States” Retrieved from https://www.sba.gov/ sites/default/files/SBO_Facts_AOB.pdf
21. Woo, Nichole and Bucknor, Cherrie (2015) “Asian American and Pacific Island Workers Today” Retrieved from http:// cepr.net/publications/reports/asian-american-and-pacific-islander-workers-today
22. Chen, Liyan (27 April 2018) “How Asian Americans can break through the Bamboo Ceiling” Retrieved from https:// www.bloomberg.com/diversity-inclusion/ blog/asian-americans-can-break-bamboo-ceiling/
23. Deloitte (2018) “Women and Minorities on Fortune 500 Boards: More Room to Grow” Retrieved from https://deloitte. wsj.com/riskandcompliance/2019/03/12/ women-and-minorities-on-fortune-500boards-more-room-to-grow/
24. Ramakrishnan, Karthick and Lee, Jennifer (17 October 2017) “Despite
what you might have heard, Asian American CEOs are the Exception, not the Norm” Retrieved from https://www. latimes.com/opinion/op-ed/la-oe-ramakrishnan-lee-asian-american-executives-20171019-story.html
25. Gee, Buck and Peck, Denise (31 May 2018) “Asian Americans are the Least Likely Group in the U.S. to be promoted to Management” Retrieved from https:// hbr.org/2018/05/asian-americans-arethe-least-likely-group-in-the-u-s-to-bepromoted-to-management
26. Constante, Agnes (26 December 2018) “For second Congress in a row, elected Asian Americans and Pacific Islanders hit new high” Retrieved from https://www.nbcnews. com/news/asian-america/second-congress-row-elected-asian-americans-pacific-islanders-hit-new-n950371
27. JP Morgan Chase (December 2018) “Helping Entrepreneurs of Color Grow their Businesses: Early Insights from the Ascend 2020 Initiative” Retrieved from http://icic.org/wp-content/uploads/2018/12/ICIC_Ascend2020_Report_r8_final_post.pdf
28. The National Minority Supplier Development Council (2017) “The Business Case for Minority Business Enterprises: Fueling Economic Growth, White Paper” Retrieved from http://www.nmsdc.org/ wp-content/uploads/v3Alt-Wht-8.5-x11Single.pdf
29. U.S. Department of Commerce, Minority Business Development Agency (MBDA) (December 2016) “Contracting Barriers and Factors Affecting Minority Business Enterprises: A Review of Existing Disparity Studies” Retrieved from http://www.chicagomsdc.org/downloads/ ContractingBarriers_DisparityStudies.pdf
30. Woo, Nichole and Bucknor, Cherrie (May 2015) “Asian American and Pacific Islanders Today” Retrieved from http:// cepr.net/publications/reports/asian-american-and-pacific-islander-workers-today
31. New American Economy (2017) “Power of the Purse: How Asian Americans and Pacific Islanders Contribute to the Economy” Retrieved from http:// research.newamericaneconomy.org/ wp-content/uploads/2017/10/NAE-AAPI-v14.pdf
32. Shang, Eva (22 Feb 2016) “CEOs in the Making: The Youngest Asian-Americans in Tech” Retrieved from https:// www.nbcnews.com/news/asian-america/ ceos-making-youngest-asian-americanstech-n516691
33. U.S. Department of Health and Human Services (2015) Sex, Race, and Ethnic Diversity of U.S. Health Occupations (2010-2012)
34. Beckhusen, Julia (2016 August) “Occupations in Information Technology” Retrieved from https://www.census. gov/content/dam/Census/library/publications/2016/acs/acs-35.pdf
35. Lee, Jennifer (9 September 2018) “Study Finds Asian Americans are more
likely to be made CEOs of Struggling Companies” Retrieved from https:// www.thedp.com/article/2018/09/ upenn-penn-philadelphia-asian-american-ceo-wharton-research
36. Gee Buck and Peck, Denise (31 May 2018) Harvard Business Review “Asian Americans Are the Least Likely Group in the U.S. to be Promoted to Management” Retrieved from https://hbr. org/2018/05/asian-americans-are-theleast-likely-group-in-the-u-s-to-be-promoted-to-management
37. Runes, Charmaine (10 May 2018) Urban Institute “What’s behind the wealth gap in Asian American and Pacific Islander communities?” Retrieved from https://www.urban.org/urban-wire/ whats-behind-wealth-gap-asian-american-and-pacific-islander-communities
38. Sullivan, Justin (11 July 2018) “Asian Americans now most economically divided group in the U.S., report finds” retrieved from https://www.nbcnews. com/news/asian-america/asian-americans-now-most-economically-divided-group-u-s-report-n890646
39. Almeleh, Shira (25 January 2019) “How the Trump Tax Plan Will Affect Your Small Business” Fundera. Retrieved from https://www.fundera.com/blog/trumptax-plan
40. York, Erica (30 May 2018) “The Fixtures Fix: Correcting the Drafting Error Involving the Expensing of Qualified Improvement Property”
41. The American Institute of Certified Tax Coaches “The Hazards of Selling to a Related Party” Retrieved from https:// certifiedtaxcoach.org/hazards-of-sellingto-a-related-party/
42. The Small Business Administration (2012) “Survey of Small Business Owners Facts: Asian-Owned Businesses in the United States” Retrieved from https:// www.sba.gov/sites/default/files/SBO_ Facts_AOB.pdf
43. The Small Business Administration (2012) “Survey of Small Business Owner Facts: Native Hawaiian and Pacific Islander Businesses in the United States” Retrieved from https://www.sba.gov/sites/ default/files/SBO_Facts_NHPIOB.pdf
44. Colby, Sandra L and Ortman, Jennifer M. (March 2015) “Projections of the Size and Composition of the U.S. Population: 2014 to 2060” Retrieved from https:// www.census.gov/content/dam/Census/ library/publications/2015/demo/p251143.pdf
45. Ramakrishnan, Karthick and Ahmed, Farah, Z. (Center for American Progress) (2014) “Education: Part of the “State of Asian Americans and Pacific Islanders” Series” Retrieved from https://www. americanprogress.org/wp-content/uploads/2014/04/AAPI-Education.pdf
46. Higher Education Today, American Council on Education (30 October 2017) “AANAPISIs: Ensuring Success for American and Pacific Islander Students” Retrieved from https://www.highered-
26
today.org/2017/10/30/aanapisis-ensuring-success-asian-american-pacific-islander-students/
47. Bureau of Labor Statistics (October 2017) “Labor Force Characteristics by Race and Ethnicity, 2016” Retrieved from https://www.bls.gov/opub/reports/ race-and-ethnicity/2016/home.htm
48. New American Economy (October 2017) Power of the Purse: How Asian Americans and Pacific Islanders Contribute to the U.S. Economy” retrieved from http://research.newamericaneconomy. org/wp-content/uploads/2017/10/ NAE-AAPI-v14.pdf
49. Nguyen, Minh (1 July 2016) “Wage Gap between Races, Genders persists as Asian Men top average earnings: Report” Retrieved from https://www. nbcnews.com/news/asian-america/racialgender-wage-gap-persists-asian-american-men-top-average-n602076
50. Smith, Lindsay S. (14 September 2018) “Asian Americans Make Up most of the News U.S. Immigrant Population” Retrieved from https://www.nationalgeographic.com/culture/2018/09/asian-immigrants-latin-americans-united-statesstudy-news/
51. Pew Research Center (23 September 2015) “Asians Projected to Become the Largest Immigrant Group, Surpassing Hispanics” Retrieved from https:// www.pewhispanic.org/2015/09/28/ modern-immigration-wave-brings-59million-to-u-s-driving-population-growthand-change-through-2065/ph_2015-0928_immigration-through-2065-05/
52. National CAPACD (2018) “Small Business, Big Dreams” Retrieved from https://www.nationalcapacd.org/wp-content/uploads/2019/03/CAPACD_SmallBusinessReport_final_web.pdf
53. The Leadership Conference Education Fund (17 April 2018) “Will you Count? Asian Americans and Native Hawaiians and Pacific Islanders (NHPIs) in the 2020 Census” Retrieved from https://censuscounts.org/wp-content/ uploads/2019/03/Fact-Sheet-AA-NHPIHTC.pdf
54. Administrative Records, Internet, and Hard to Count Working Group (2018) National Advisory Committee on Racial, Ethnic, and Other Populations” Retrieved from https://www2.census.gov/cac/nac/ reports/2016-07-admin_internet-wg-report.pdf
55. Runes, Charmaine and Park Yuji (9 July 2019) “Census 2020: Ensuring “hard-to-count” Asian Americans count at the federal, state and local levels” Retrieved from https://www.urban.org/ urban-wire/census-2020-ensuring-hardcount-asian-americans-count-federalstate-and-local-levels
56. Ramakrishnan, Karthick and Wong, Janelle AAPI Data (29 January 2019) “Census 2020 has a big Asian American Problem” Retrieved from http://aapidata. com/blog/census2020-asian-am-problem/
57. Davey, Lizzie (Axel) (28 August 2018) “How Concerned are Consumers Really when it comes to Data Privacy?” Retrieved from https://medium.com/@ AxelUnlimited/how-concerned-are-consumers-really-when-it-comes-to-data-privacy-21c4587ddc5c
58. Ucros, Melody (12 January 2018) “10 Sneaky Ways Companies Are Collecting Data to Understand Customers” Retrieved from https://medium.com/@ melodyucros/10-sneaky-ways-companies-are-collecting-data-to-understand-customers-be0b9089d54a
59. Newman, Nathan (How Big Data Enables Economic Harm to Consumers, especially to Low-Income and Other Vulnerable Sectors of the Population” Retrieved from https://www.ftc.gov/ system/files/documents/public_comments/2014/08/00015-92370.pdf
60. Kaye, Kate (7 January 2016) “Data-Driven Targeting of Vulnerable Groups? Be Careful, says FTC” Retrieved from https://adage.com/ article/digital/careful-targeting-vulnerable-groups-ftc/302030
61. TRUSTe and the National Cyber Security Alliance (2016) “U.S. Consumer Privacy Index” Retrieved from https:// www.trustarc.com/resources/privacy-research/ncsa-consumer-privacy-index-us/
62. The Department of Homeland Security (2019) “Cybersecurity” Retrieved from https://www.dhs.gov/topic/cybersecurity
63. The Department of Defense Task Force on Cyber Deterrence (2017) “Cyber Deterrence Report” Retrieved from https://www.acq.osd.mil/dsb/ reports/2010s/DSB-CyberDeterrenceReport_02-28-17_Final.pdf
64. SCORE “43% of Cyberattacks Target Small Businesses” (11 October 2018) Retrieved from https://www. prnewswire.com/news-releases/43-of-cyberattacks-target-small-businesses-300729384.html
65. HISCOX “Small Business Cyber Risk Report (2018) Retrieved from https:// www.hiscox.com/documents/2018-Hiscox-Small-Business-Cyber-Risk-Report. pdf
66. Newport, Frank (2 November 2018) Gallup “Top Issues for Voters: Healthcare, Economy, Immigration” Retrieved from https://news.gallup.com/poll/244367/ top-issues-voters-healthcare-economy-immigration.aspx
67. Asian and Pacific Islander American Vote (9 October 2018) “2018 Asian American Voter Summery” Retrieved from http://aapidata.com/wp-content/ uploads/2018/10/2018-AA-Voter-Surveyreport-Oct9.pdf
68. The Henry J. Kaiser Family Foundation (2018 January) “Health and Healthcare for Asian Americans, Native Hawaiians and Other Pacific Islanders (NHOPIs) in the United States” Retrieved from https://www.kff.org/infographic/ health-and-health-care-for-asian-ameri-
cans-native-hawaiians-and-other-pacificislanders-nhopis-in-the-united-states/
69. National Partnership for Women and Families (2018 April) “Native Hawaiian and Pacific Islander Women’s Access to Health Insurance” Retrieved from http:// www.nationalpartnership.org/our-work/ resources/health-care/native-hawaiian-and-pacific-islander-health-insurance-coverage.pdf
70. The National Partnership for Women and Families (2018, April) “Asian Women’s Access to Healthcare” Retrieved from http://www.nationalpartnership. org/our-work/resources/health-care/ asian-womens-health-insurance-coverage.pdf
71. AARP (2015 January) “The Health and Healthcare of Asian Americans and Pacific Islanders Age 50+” Retrieved from https://www.aarp.org/content/dam/ aarp/home-and-family/asian-community/2015-01/AARP-Report-Health-andHealthcare-AAPIs-50-Jan2015.pdf
72. Department of Commerce Minority Business Development Agency (2010, January) “Disparities in Capital Access between Minority and Non-Minority-Owned Businesses: The Troubling Reality of Capital Limitations Faced by MBEs” Retrieved from https://www. mbda.gov/sites/mbda.gov/files/migrated/files-attachments/DisparitiesinCapitalAccessReport.pdf
73. The Federal Reserve Bank of Cleveland (2017, November) “Small Business Credit Survey: Report on Minority-Owned Firms” Retrieved from https:// www.opportunityfund.org/assets/docs/ sbcs%20minority-owned%20businesses%20report%202016.pdf
74. Department of Commerce Minority Business Development Agency (2010, January) “Disparities in Capital Access between Minority and Non-Minority-Owned Businesses: The Troubling Reality of Capital Limitations Faced by MBEs”
75. Nielson (5 May 2018) “Asian Americans: Digital Lives and Growing Influence” Retrieved from https://www. nielsen.com/content/dam/corporate/ us/en/reports-downloads/2018-reports/ asian-american-consumer-report-may%20 2018.pdf
76. Kauffman Foundation (2016, October) “Startup Financing Trends by Race: How to Access Capital Impacts Profitability” Retrieved from https://www. kauffman.org/-/media/kauffman_org/ research-reports-and-covers/2016/ase_ brief_startup_financing_by_race.pdf
77. Schubarth, Cromwell (26 June 2018) “Silicon Valley still dominates the world in venture, startups, new report shows” Retrieved from https://www.bizjournals. com/sanjose/news/2018/06/26/siliconvalley-still-dominates-the-world-in.html
78. North West Asian Weekly (2 December 2017) “Asian American Leaders in tech, Silicon Valley” Retrieved from http://nwasianweekly.com/2017/12/
asian-american-leaders-in-tech-silicon-valley/
79. Chen, Liyan (27 April 2018) “How Asian Americans can break through the Bamboo Ceiling” Retrieved from https:// www.bloomberg.com/diversity-inclusion/ blog/asian-americans-can-break-bamboo-ceiling/
80. All Things Considered, NPR Staff (17 May 2015) “Often Employees, Rarely CEOs” Challenges Asian-Americans Face in Tech” Retrieved from https://www. npr.org/2015/05/17/407478606/oftenemployees-rarely-ceos-challenges-asianamericans-face-in-tech
81. McKinsey (January 2018) “Delivering through Diversity” Retrieved from https://www.mckinsey.com/~/ media/mckinsey/business%20functions/ organization/our%20insights/delivering%20through%20diversity/delivering-through-diversity_full-report.ashx
82. Hynes, Casey (31 October 2017) “As Asian Medical Markets Grow, so do Biotech and Medtech Opportunities” Retrieved from https://www.forbes.com/ sites/chynes/2017/10/31/as-asian-medical-markets-grow-so-do-biotech-and-medtech-opportunities/#2589f3bcb254
83. Office of the United States Trade Representative (2017) “U.S.-APEC Trade Facts” Retrieved from https://ustr.gov/ trade-agreements/other-initiatives/ asia-pacific-economic-cooperation-apec/ us-apec-trade-facts
84. The Intellectual Property Commission (May 2013) “The IP Commission Report” Retrieved from http://ipcommission.org/ report/IP_Commission_Report_052213. pdf
27 ACE POLICY AGENDA 2019
FOOTNOTES
1. The Asian Real Estate Association of America “State of Asian America” (2017-18) Retrieved from https://www.dropbox.com/s/9gtjzt98yfmj0h3/StateofAsia2018_vFINAL_3. pdf?dl=0
2. The Leadership Conference Education Fund (2018, April) “Will you Count? Asian Americans and Native Hawaiians and Pacific Islanders (NHPHIs) in the 2020 Census” Retrieved from http://civilrightsdocs.info/pdf/census/2020/Fact-Sheet-AA-NHPI-HTC.pdf
3. Pew Research Center (28 September 2015) “Modern Immigration Wave Brings 59 million to U.S., Driving Population Growth and Change through 2065” Retrieved from https://www. pewhispanic.org/2015/09/28/modern-immigration-wave-brings-59-million-to-u-s-drivingpopulation-growth-and-change-through-2065/
4. Frauenfelder, Mary (27 July 2016) U.S. Census Bureau “Asian Owned Businesses Nearing 2 Million” Retrieved from https://www.census.gov/newsroom/blogs/random-samplings/2016/07/asian-owned-businesses-nearing-two-million.html
5. Nielson (5 May 2018) “Asian Americans: Digital Lives and Growing Influence” Retrieved from https://www.nielsen.com/content/dam/corporate/us/en/reports-downloads/2018-reports/asian-american-consumer-report-may%202018.pdf
6. New American Economy (2017, October) Power of the Purse: How Asian Americans and Pacific Islanders Contribute to the U.S. Economy” Retrieved from http://www.newamericaneconomy.org/wp-content/uploads/2017/10/NAE-AAPI-v14.pdf
7. Peter G. Peterson Foundation (2018, September) “Income and Wealth in the United States: An Overview of Recent Data” Retrieved from https://www.pgpf.org/blog/2018/09/ income-and-wealth-in-the-united-states-an-overview-of-data
8. Chen Sammi (10 May 2018) “Racial Wealth Snapshot” Retrieved from https://prosperitynow.org/blog/racial-wealth-snapshot-asian-americans
9. American Express OPEN (2018, April) The 2018 State of Women-owned Businesses Report: A Summary of Key Trends, 2007, 2012, 2017, 2018.” Retrieved from https://ventureneer.com/wp-content/uploads/2018/08/2018-state-of-women-owned-businesses-report_FINAL.pdf
10. APartnership (11 February 2019) “Asian Americans: New Faces of Entrepreneurship” Retrieved from http://apartnership.com/asian-americans-entrepreneurship/
11. IBID
12. American Express OPEN (2018, April) The 2018 State of Women-owned Businesses Report: A Summary of Key Trends, 2007, 2012, 2017, 2018.”
13. IBID
14. IBID
15. Rosen, Elizabeth (19 March 2018) “Asian American Women forge new paths as Entrepreneurs” Retrieved from https://asia.nikkei.com/Location/Rest-of-the-World/North-America/ Asian-American-women-forge-new-paths-as-entrepreneurs
16. American Express OPEN (2018, April) The 2018 State of Women-owned Businesses Report: A Summary of Key Trends, 2007, 2012, 2017, 2018.”
17. IBID
18. Frey, William H. (January 2018) “The Millennial Generation: A Demographic Bridge to America’s Diverse Future” Retrieved from https://www.brookings.edu/research/millennials/
19. IBID
20. IBID
21. Nielson (1 January 2017) “Multicultural Millennials: The Multiplier Effect” Retrieved from https://www.nielsen.com/us/en/insights/reports/2017/multicultural-millennials--the-multiplier-effect.html
22. U.S. Small Business Administration, Office of Advocacy (2012) “Survey of Small Business Owner Facts: Asian Owned Businesses in the United States” Retrieved from https://www. sba.gov/sites/default/files/SBO_Facts_AOB.pdf
23. IBID
24. Giese, Catherine (10 December 2018) “U.S. Small Business Employment and Growth: All the Statistics you need to Know” Retrieved from https://www.fundera.com/blog/small-business-employment-and-growth-statistics
25. Gunasekara, Surya (29 May 2018) “The Trump Economy is a boon for Asian American Small Business Owners” Retrieved from https://www.washingtonexaminer.com/opinion/opeds/the-trump-economy-is-a-boon-for-asian-american-small-business-owners
26. National CAPACD “Small Business, Big Dreams” Retrieved from https://www.nationalcapacd.org/wp-content/uploads/2019/03/CAPACD_SmallBusinessReport_final_web.pdf
27. IBID
28. U.S. Census Bureau (2015) “Selected Population Profile n the United States: 2015 American Community Survey 1-year Estimates” Retrieved from https://factfinder.census.gov/faces/ tableservices/jsf/pages/productview.xhtml?src=bkmk
29. Almeleh, Shira (25 January 2019) “How the Trump Tax Plan Will Affect your Small Business” Retrieved from https://www.fundera.com/blog/trump-tax-plan
30. National CAPACD (2018) “Small Business, Big Dreams” Retrieved from https://www. nationalcapacd.org/wp-content/uploads/2019/03/CAPACD_SmallBusinessReport_final_web. pdf
31. The Leadership Conference Education Fund (17 April 2018) “Will you Count? Asian Americans and Native Hawaiians and Pacific Islanders (NHPIs) in the 2020 Census” Retrieved from https://censuscounts.org/wp-content/uploads/2019/03/Fact-Sheet-AA-NHPI-HTC.pdf
32. Administrative Records, Internet, and Hard to Count Working Group (2018) National Advisory Committee on Racial, Ethnic, and Other Populations” Retrieved from https://www2. census.gov/cac/nac/reports/2016-07-admin_internet-wg-report.pdf
33. Runes, Charmaine and Park Yuji (9 July 2019) “Census 2020: Ensuring “hard-to-count” Asian Americans count at the federal, state and local levels” Retrieved from https://www. urban.org/urban-wire/census-2020-ensuring-hard-count-asian-americans-count-federal-state-
and-local-levels
34. IBID
35. IBID
36. Ramakrishnan, Karthick and Wong, Janelle AAPI Data (29 January 2019) “Census 2020 has a big Asian American Problem” Retrieved from http://aapidata.com/blog/census2020asian-am-problem/
37. IBID
38. IBID
39. Department of Commerce Minority Business Development Agency (2010, January) “Disparities in Capital Access between Minority and Non-Minority-Owned Businesses: The Troubling Reality of Capital Limitations Faced by MBEs” Retrieved from https://www.mbda. gov/sites/mbda.gov/files/migrated/files-attachments/DisparitiesinCapitalAccessReport.pdf
40. The Federal Reserve Bank of Cleveland (2017, November) “Small Business Credit Survey: Report on Minority-Owned Firms” Retrieved from https://www.opportunityfund.org/ assets/docs/sbcs%20minority-owned%20businesses%20report%202016.pdf
41. IBID
42. IBID
43. Department of Commerce Minority Business Development Agency (2010, January) “Disparities in Capital Access between Minority and Non-Minority-Owned Businesses: The Troubling Reality of Capital Limitations Faced by MBEs” 44Kauffman Foundation (2016, October) “Startup Financing Trends by Race: How to Access Capital Impacts Profitability” Retrieved from https://www.kauffman.org/-/media/kauffman_ org/research-reports-and-covers/2016/ase_brief_startup_financing_by_race.pdf
45. IBID
46. IBID
47. JP Morgan Chase (December 2018) “Helping Entrepreneurs of Color Grow their Businesses: Early Insights from the Ascend 2020 Initiative” Retrieved from http://icic.org/wp-content/uploads/2018/12/ICIC_Ascend2020_Report_r8_final_post.pdf
48. IBID
49. The National Minority Supplier Development Council (2017) “The Business Case for Minority Business Enterprises: Fueling Economic Growth, White Paper” Retrieved from http:// www.nmsdc.org/wp-content/uploads/v3Alt-Wht-8.5-x11-Single.pdf
50. U.S. Department of Commerce, Minority Business Development Agency (MBDA) (December 2016) “Contracting Barriers and Factors Affecting Minority Business Enterprises: A Review of Existing Disparity Studies” Retrieved from http://www.chicagomsdc.org/downloads/ContractingBarriers_DisparityStudies.pdf
51. IBID
52. IBID
53. The Department of Homeland Security (2019) “Cybersecurity” Retrieved from https:// www.dhs.gov/topic/cybersecurity
54. The Department of Defense Task Force on Cyber Deterrence (2017) “Cyber Deterrence Report” Retrieved from https://www.acq.osd.mil/dsb/reports/2010s/DSB-CyberDeterrenceReport_02-28-17_Final.pdf
55. SCORE “43% of Cyberattacks Target Small Businesses” (11 October 2018) Retrieved from https://www.prnewswire.com/news-releases/43-of-cyberattacks-target-small-businesses-300729384.html
56. IBID
57. IBID
58. IBID
59. IBID
60. HISCOX “Small Business Cyber Risk Report (2018) Retrieved from https://www.hiscox. com/documents/2018-Hiscox-Small-Business-Cyber-Risk-Report.pdf
61. IBID
62. Woo, Nichole and Bucknor, Cherrie (2015) “Asian American and Pacific Island Workers Today” Retrieved from http://cepr.net/publications/reports/asian-american-and-pacific-islander-workers-today
63. Chen, Liyan (27 April 2018) “How Asian Americans can break through the Bamboo Ceiling” Retrieved from https://www.bloomberg.com/diversity-inclusion/blog/asian-americans-can-break-bamboo-ceiling/
64. Deloitte (2018) “Women and Minorities on Fortune 500 Boards: More Room to Grow” Retrieved from https://deloitte.wsj.com/riskandcompliance/2019/03/12/women-and-minorities-on-fortune-500-boards-more-room-to-grow/
65. IBID
66. IBID
67. IBID
68. Ramakrishnan, Karthick and Lee, Jennifer (17 October 2017) “Despite what you might have heard, Asian American CEOs are the Exception, not the Norm” Retrieved from https://www.latimes.com/opinion/op-ed/la-oe-ramakrishnan-lee-asian-american-executives-20171019-story.html
69. IBID
70. Gee, Buck and Peck, Denise (31 May 2018) “Asian Americans are the Least Likely Group in the U.S. to be promoted to Management” Retrieved from https://hbr.org/2018/05/asianamericans-are-the-least-likely-group-in-the-u-s-to-be-promoted-to-management
71. IBID
72. Constante, Agnes (26 December 2018) “For second Congress in a row, elected Asian Americans and Pacific Islanders hit new high” Retrieved from https://www.nbcnews. com/news/asian-america/second-congress-row-elected-asian-americans-pacific-islanders-hit-new-n950371
28
73. Woo, Nichole and Bucknor, Cherrie (May 2015) “Asian American and Pacific Islanders Today” Retrieved from http://cepr.net/publications/reports/asian-american-and-pacific-islander-workers-today
74. New American Economy (2017) “Power of the Purse: How Asian Americans and Pacific Islanders Contribute to the Economy” Retrieved from http://research.newamericaneconomy. org/wp-content/uploads/2017/10/NAE-AAPI-v14.pdf
75. Nielson (5 May 2018) “Asian Americans: Digital Lives and Growing Influence” Retrieved from https://www.nielsen.com/content/dam/corporate/us/en/reports-downloads/2018-reports/asian-american-consumer-report-may%202018.pdf
76. New American Economy (2017, October) Power of the Purse: How Asian Americans and Pacific Islanders Contribute to the U.S. Economy” Retrieved from http://www.newamericaneconomy.org/wp-content/uploads/2017/10/NAE-AAPI-v14.pdf
77. Shang, Eva (22 Feb 2016) “CEOs in the Making: The Youngest Asian-Americans in Tech” Retrieved from https://www.nbcnews.com/news/asian-america/ceos-making-youngest-asianamericans-tech-n516691
78. U.S. Department of Health and Human Services (2015) Sex, Race, and Ethnic Diversity of U.S. Health Occupations (2010-2012)
79. Beckhusen, Julia (2016 August) “Occupations in Information Technology” Retrieved from https://www.census.gov/content/dam/Census/library/publications/2016/acs/acs-35.pdf
80. Lee, Jennifer (9 September 2018) “Study Finds Asian Americans are more likely to be made CEOs of Struggling Companies” Retrieved from https://www.thedp.com/article/2018/09/upenn-penn-philadelphia-asian-american-ceo-wharton-research
81. Gee Buck and Peck, Denise (31 May 2018) Harvard Business Review “Asian Americans Are the Least Likely Group in the U.S. to be Promoted to Management” Retrieved from https://hbr.org/2018/05/asian-americans-are-the-least-likely-group-in-the-u-s-to-be-promoted-to-management
82. Runes, Charmaine (10 May 2018) Urban Institute “What’s behind the wealth gap in Asian American and Pacific Islander communities?” Retrieved from https://www.urban.org/ urban-wire/whats-behind-wealth-gap-asian-american-and-pacific-islander-communities
83. Sullivan, Justin (11 July 2018) “Asian Americans now most economically divided group in the U.S., report finds” retrieved from https://www.nbcnews.com/news/asian-america/ asian-americans-now-most-economically-divided-group-u-s-report-n890646
84. Colby, Sandra L and Ortman, Jennifer M. (March 2015) “Projections of the Size and Composition of the U.S. Population: 2014 to 2060” Retrieved from https://www.census.gov/ content/dam/Census/library/publications/2015/demo/p25-1143.pdf
85. Ramakrishnan, Karthick and Ahmed, Farah, Z. (Center for American Progress) (2014) “Education: Part of the “State of Asian Americans and Pacific Islanders” Series” Retrieved from https://www.americanprogress.org/wp-content/uploads/2014/04/AAPI-Education.pdf
86. IBID
87. IBID
88. IBID
89. IBID
90. Higher Education Today, American Council on Education (30 October 2017) “AANAPISIs: Ensuring Success for American and Pacific Islander Students” Retrieved from https:// www.higheredtoday.org/2017/10/30/aanapisis-ensuring-success-asian-american-pacific-islander-students/
91. Bureau of Labor Statistics (October 2017) “Labor Force Characteristics by Race and Ethnicity, 2016” Retrieved from https://www.bls.gov/opub/reports/race-and-ethnicity/2016/ home.htm
92. New American Economy (October 2017) Power of the Purse: How Asian Americans and Pacific Islanders Contribute to the U.S. Economy” retrieved from http://research.newamericaneconomy.org/wp-content/uploads/2017/10/NAE-AAPI-v14.pdf
93. IBID
94. IBID
95. Nguyen, Minh (1 July 2016) “Wage Gap between Races, Genders persists as Asian Men top average earnings: Report” Retrieved from https://www.nbcnews.com/news/asian-america/racial-gender-wage-gap-persists-asian-american-men-top-average-n602076
96. IBID
97. Newport, Frank (2 November 2018) Gallup “Top Issues for Voters: Healthcare, Economy, Immigration” Retrieved from https://news.gallup.com/poll/244367/top-issues-voters-healthcare-economy-immigration.aspx
98. Asian and Pacific Islander American Vote (9 October 2018) “2018 Asian American Voter Summery” Retrieved from http://aapidata.com/wp-content/uploads/2018/10/2018-AA-Voter-Survey-report-Oct9.pdf
99. The Henry J. Kaiser Family Foundation (2018 January) “Health and Healthcare for Asian Americans, Native Hawaiians and Other Pacific Islanders (NHOPIs) in the United States” Retrieved from https://www.kff.org/infographic/health-and-health-care-for-asian-americansnative-hawaiians-and-other-pacific-islanders-nhopis-in-the-united-states/ 100. IBID
101. IBID
102. IBID
103. IBID
104. IBID
105. National Partnership for Women and Families (2018 April) “Native Hawaiian and Pacific Islander Women’s Access to Health Insurance” Retrieved from http://www.nationalpartnership.org/our-work/resources/health-care/native-hawaiian-and-pacific-islander-health-insurance-coverage.pdf
106. The National Partnership for Women and Families (2018, April) “Asian Women’s Access
to Healthcare” Retrieved from http://www.nationalpartnership.org/our-work/resources/ health-care/asian-womens-health-insurance-coverage.pdf
107. IBID
108. IBID
109. AARP (2015 January) “The Health and Healthcare of Asian Americans and Pacific Islanders Age 50+” Retrieved from https://www.aarp.org/content/dam/aarp/home-and-family/ asian-community/2015-01/AARP-Report-Health-and-Healthcare-AAPIs-50-Jan2015.pdf
110. Smith, Lindsay S. (14 September 2018) “Asian Americans Make Up most of the News U.S. Immigrant Population” Retrieved from https://www.nationalgeographic.com/culture/2018/09/asian-immigrants-latin-americans-united-states-study-news/
111. Pew Research Center (23 September 2015) “Asians Projected to Become the Largest Immigrant Group, Surpassing Hispanics” Retrieved from https://www.pewhispanic. org/2015/09/28/modern-immigration-wave-brings-59-million-to-u-s-driving-populationgrowth-and-change-through-2065/ph_2015-09-28_immigration-through-2065-05/
112. Office of the United States Trade Representative (2017) “U.S.-APEC Trade Facts” Retrieved from https://ustr.gov/trade-agreements/other-initiatives/asia-pacific-economic-cooperation-apec/us-apec-trade-facts
113. IBID
114. IBID
115. The Intellectual Property Commission (May 2013) “The IP Commission Report” Retrieved from http://ipcommission.org/report/IP_Commission_Report_052213.pdf
116. Davey, Lizzie (Axel) (28 August 2018) “How Concerned are Consumers Really when it comes to Data Privacy?” Retrieved from https://medium.com/@AxelUnlimited/how-concerned-are-consumers-really-when-it-comes-to-data-privacy-21c4587ddc5c
117. Ucros, Melody (12 January 2018) “10 Sneaky Ways Companies Are Collecting Data to Understand Customers” Retrieved from https://medium.com/@melodyucros/10-sneaky-ways-companies-are-collecting-data-to-understand-customers-be0b9089d54a
118. Newman, Nathan (How Big Data Enables Economic Harm to Consumers, especially to Low-Income and Other Vulnerable Sectors of the Population” Retrieved from https://www. ftc.gov/system/files/documents/public_comments/2014/08/00015-92370.pdf
119. Kaye, Kate (7 January 2016) “Data-Driven Targeting of Vulnerable Groups? Be Careful, says FTC” Retrieved from https://adage.com/article/digital/careful-targeting-vulnerable-groups-ftc/302030
120. TRUSTe and the National Cyber Security Alliance (2016) “U.S. Consumer Privacy Index” Retrieved from https://www.trustarc.com/resources/privacy-research/ncsa-consumer-privacy-index-us/
121. IBID
122. Almeleh, Shira (25 January 2019) “How the Trump Tax Plan will Affect you Small Business” Fundera. Retrieved from https://www.fundera.com/blog/trump-tax-plan
123. IBID
124. IBID
125. IBID
126. IBID
127. IBID
128. IBID
129. York, Erica (30 May 2018) “The Fixtures Fix: Correcting the Drafting Error Involving the Expensing of Qualified Improvement Property”
130. IBID
131. The American Institute of Certified Tax Coaches “The Hazards of Selling to a Related Party” Retrieved from https://certifiedtaxcoach.org/hazards-of-selling-to-a-related-party/
132. The Small Business Administration (2012) “Survey of Small Business Owners Facts: Asian-Owned Businesses in the United States” Retrieved from https://www.sba.gov/sites/ default/files/SBO_Facts_AOB.pdf
133. The Small Business Administration (2012) “Survey of Small Business Owner Facts: Native Hawaiian and Pacific Islander Businesses in the United States” Retrieved from https:// www.sba.gov/sites/default/files/SBO_Facts_NHPIOB.pdf
134. Schubarth, Cromwell (26 June 2018) “Silicon Valley still dominates the world in venture, startups, new report shows” Retrieved from https://www.bizjournals.com/sanjose/ news/2018/06/26/silicon-valley-still-dominates-the-world-in.html
135. North West Asian Weekly (2 December 2017) “Asian American Leaders in tech, Silicon Valley” Retrieved from http://nwasianweekly.com/2017/12/asian-american-leaders-in-tech-silicon-valley/
136. Chen, Liyan (27 April 2018) “How Asian Americans can break through the Bamboo Ceiling” Retrieved from https://www.bloomberg.com/diversity-inclusion/blog/asian-americanscan-break-bamboo-ceiling/
137. All Things Considered, NPR Staff (17 May 2015) “Often Employees, Rarely CEOs” Challenges Asian-Americans Face in Tech” Retrieved from https://www.npr. org/2015/05/17/407478606/often-employees-rarely-ceos-challenges-asian-americans-facein-tech
138. McKinsey (January 2018) “Delivering through Diversity” Retrieved from https://www. mckinsey.com/~/media/mckinsey/business%20functions/organization/our%20insights/delivering%20through%20diversity/delivering-through-diversity_full-report.ashx
139. Hynes, Casey (31 October 2017) “As Asian Medical Markets Grow, so do Biotech and Medtech Opportunities” Retrieved from https://www.forbes.com/sites/chynes/2017/10/31/ as-asian-medical-markets-grow-so-do-biotech-and-medtech-opportunities/#2589f3bcb254
29 ACE POLICY AGENDA 2019


nationalace.org @nationalace nationalace
