Copyright © 2024 by Singapore Indian Development Association (SINDA)
Author/ Publisher
Singapore Indian Development Association (SINDA) 1 Beatty Road, Singapore 209943
Tel: 1800 295 3333
Web: www.sinda.org.sg

Copyright © 2024 by Singapore Indian Development Association (SINDA)
Author/ Publisher
Singapore Indian Development Association (SINDA) 1 Beatty Road, Singapore 209943
Tel: 1800 295 3333
Web: www.sinda.org.sg
Since its establishment in 1991, SINDA has been dedicated to uplifting the Singapore Indian community and fostering collective progress As Singapore has experienced significant social, economic, and political changes in recent decades, the Indian community has evolved in tandem with the national population. While considerable advancements have been made, it is crucial to gain a deeper understanding of shifts within the community in key areas such as population demographics, educational attainment, employment, income levels, health, and social indicators This knowledge will enable SINDA and other community organizations to identify specific intervention areas more effectively and better serve the Singapore Indian population
This report examines important indices reflecting the progress of the Singapore Indian community over the past decade It includes statistics from publicly available sources, such as the Singapore Population Census (2010 and 2020), the Education Statistics Digest (2022), and the National Population Health Survey (2019–2022), along with other relevant resources
The report provides an in-depth analysis of the Indian resident population within the broader demographic context, exploring citizenship status, gender distribution, fertility rates, and the age and religious profiles of Indians in Singapore, highlighting changes over the past decade. In education, the report showcases the significant progress made by Singapore Indians emphasising improvements across primary, secondary, and higher education levels
The employment statistics shed light on the economic activity of Singapore Indians in comparison to other residents, mapping workforce distribution by industry and gender Additionally, it examines household trends, including income levels and living arrangements among Indian families
The social trends discussed encompass marriage and divorce rates, languages spoken at home, and drug abuse statistics In terms of health, this report analyzes life expectancy trends among Singapore Indians, the median age of suicide, diabetes prevalence, and the mental health status of the community
We hope this booklet provides valuable insights for policymakers, planners, researchers, and community leaders looking to understand and meet the needs of the community We would also like to take this opportunity to express our gratitude to our volunteers, community partners, donors, and corporate organisations who collaborate with SINDA to address community needs and support our mission of community upliftment
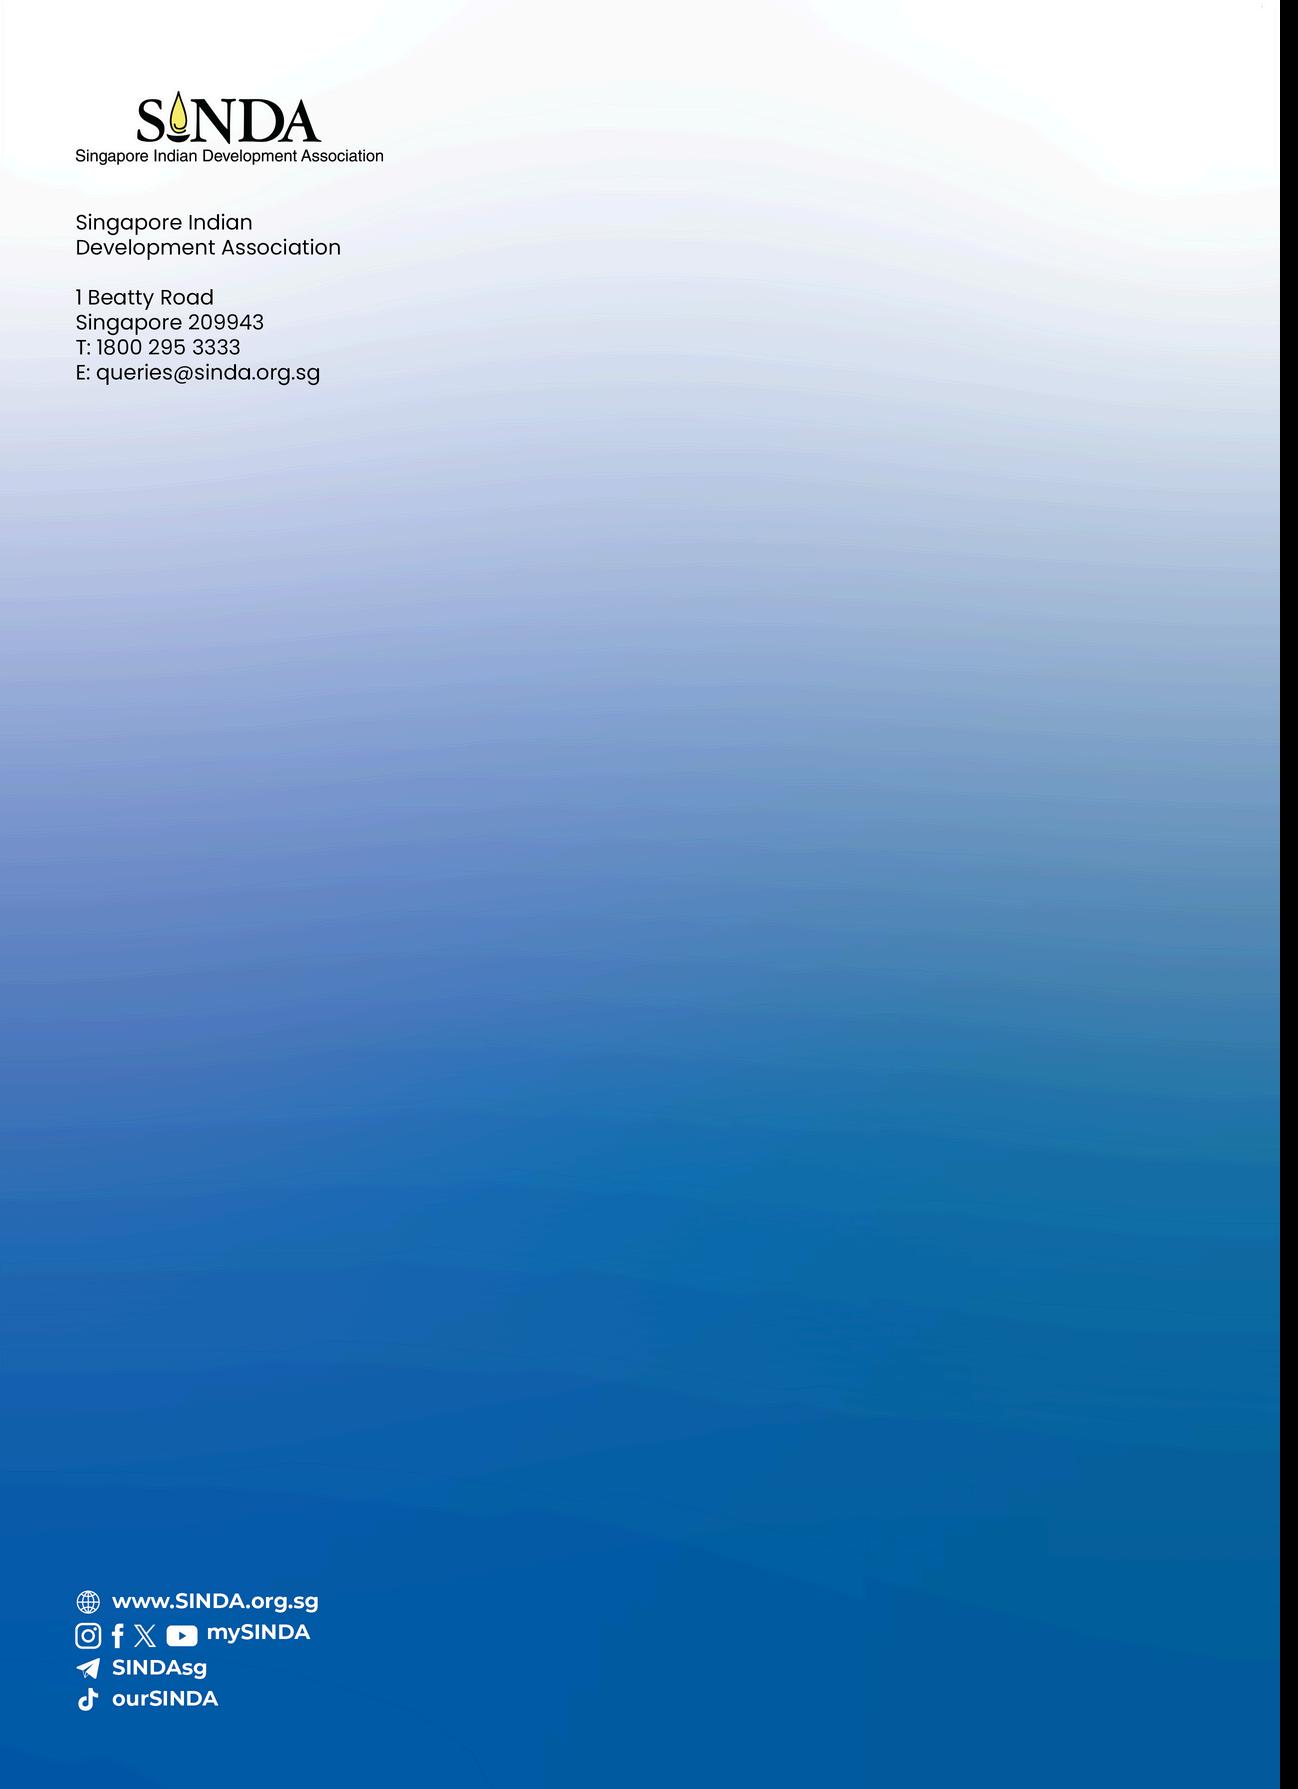
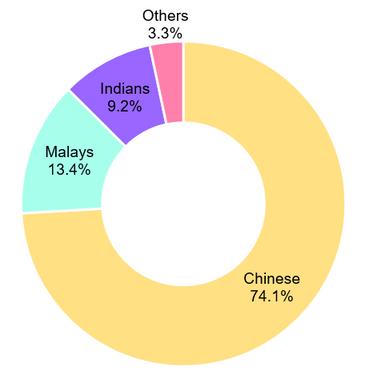
ETHNIC COMPOSITION OF TOTAL RESIDENT POPULATION
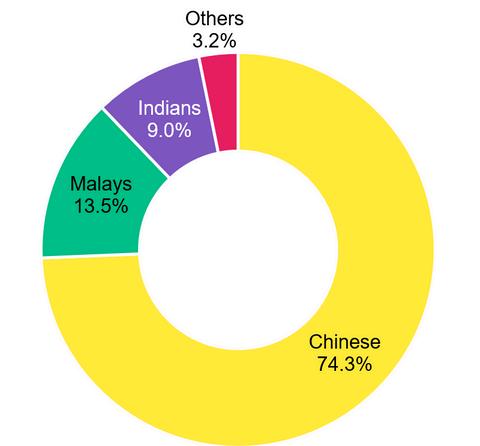
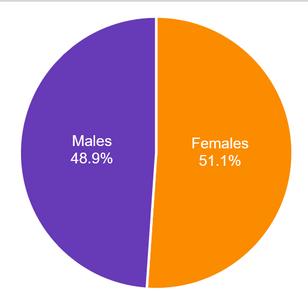
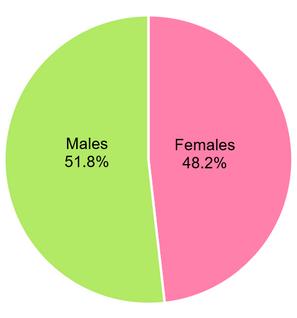
SEX COMPOSITION OF TOTAL AND INDIAN RESIDENT POPULATIONS
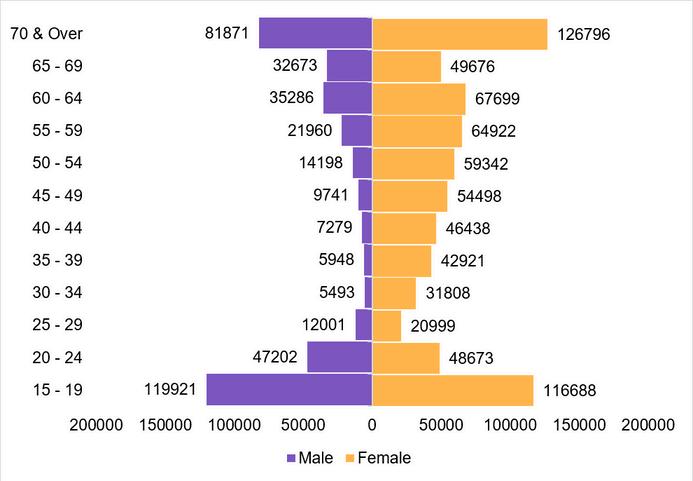
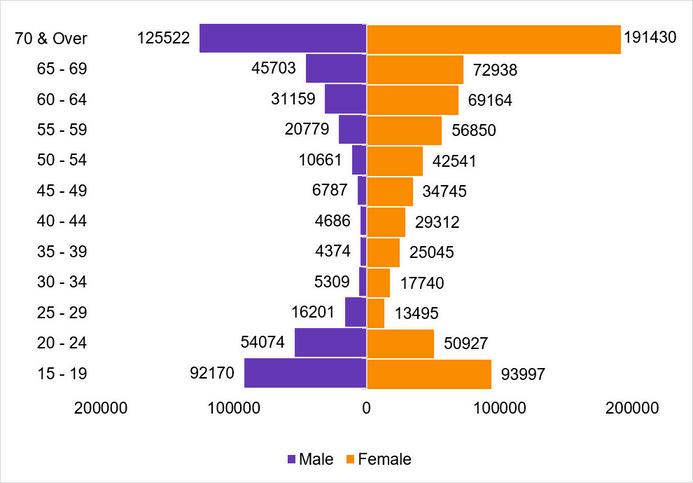
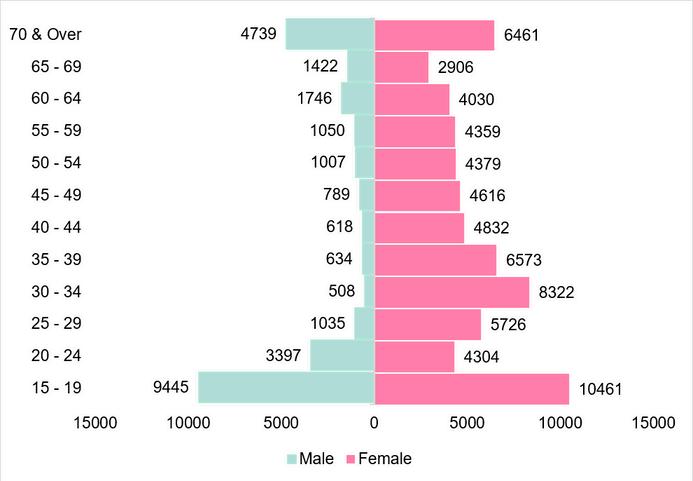
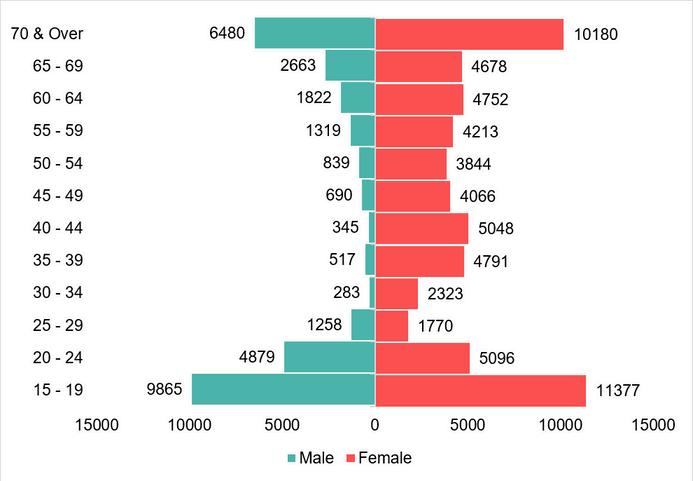
TOTAL AND INDIAN RESIDENT POPULATION BY AGE GROUP
DEPENDENCY RATIO OF TOTAL AND INDIAN RESIDENT POPULATIONS
FERTILITY RATES OF TOTAL RESIDENT POPULATION
RELIGIOUS COMPOSITION OF INDIAN RESIDENT POPULATION
COMPOSITION OF INDIAN RESIDENT POPULATION BY SUB-ETHNICITY
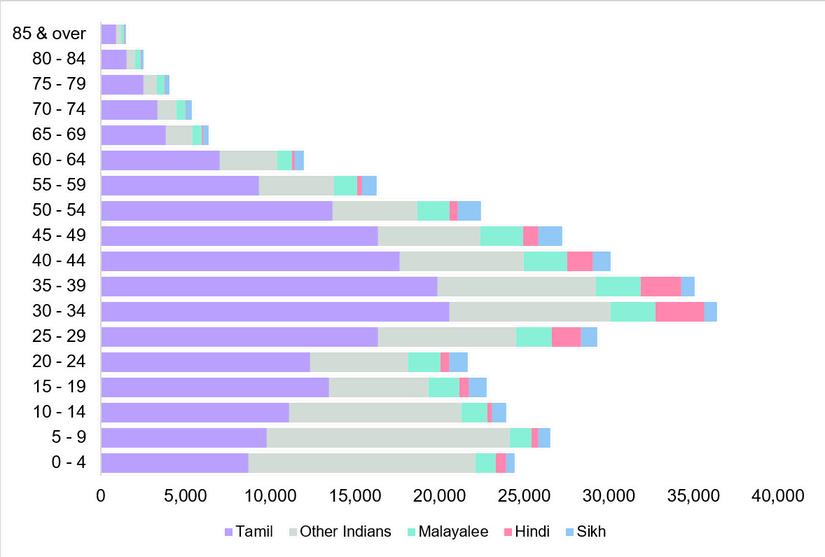
COMPOSITION OF INDIAN RESIDENT POPULATION BY SUB-ETHNICITY AND AGE GROUP
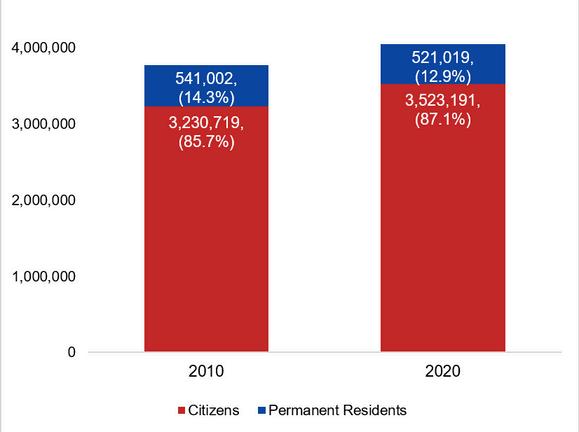
CITIZENSHIP STATUS OF TOTAL AND INDIAN RESIDENT POPULATIONS
EDUCATION 2.0
1
PERCENTAGE OF N(A)-LEVEL STUDENTS WHO PASSED MATHEMATICS
PERCENTAGE OF N(A)-LEVEL STUDENTS WHO PASSED MOTHER TONGUE
PERCENTAGE OF O-LEVEL STUDENTS WITH AT LEAST 5 O-LEVEL PASSES
PERCENTAGE OF O-LEVEL STUDENTS WHO PASSED ENGLISH LANGUAGE
PERCENTAGE OF O-LEVEL STUDENTS WHO PASSED MATHEMATICS
PERCENTAGE OF A-LEVEL STUDENTS WITH AT LEAST 3 H2 PASSES & PASS IN GENERAL PAPER OR KNOWLEDGE AND INQUIRY HIGHEST QUALIFICATION OF INDIAN RESIDENT POPULATION AGED 15 AND ABOVE
PERCENTAGE OF A-LEVEL STUDENTS WHO PASSED GENERAL PAPER OR KNOWLEDGE AND INQUIRY
INDIAN
PREVALENCE OF SUFFICIENT TOTAL PHYSICAL ACTIVITY IN TOTAL RESIDENT POPULATION BY ETHNICITY
CRUDE PREVALENCE OF DAILY SMOKING IN TOTAL RESIDENT POPULATION BY ETHNICITY
CRUDE PREVALENCE OF BINGE DRINKING IN TOTAL RESIDENT POPULATION BY ETHNICITY
SUICIDES IN TOTAL RESIDENT POPULATION BY ETHNICITY
NUMBER OF SUICIDES IN TOTAL RESIDENT POPULATION
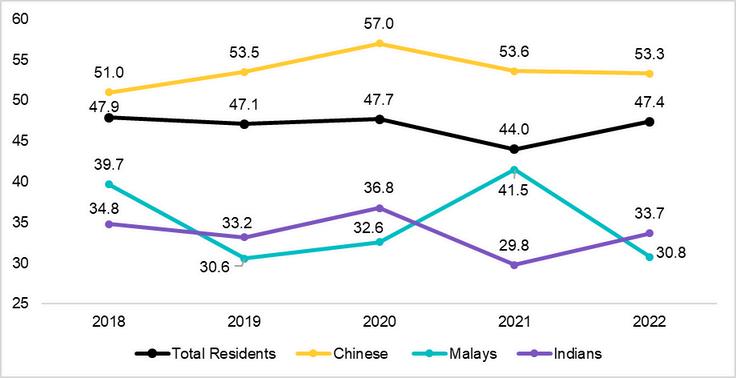
MEDIAN AGE OF SUICIDES IN TOTAL RESIDENT POPULATION BY ETHNICITY
CRUDE PREVALENCE OF POOR MENTAL HEALTH IN TOTAL RESIDENT POPULATION BY ETHNICITY
The Indian Resident population increased from 348,119 in 2010 to 362,274 in 2020. However, the proportion of Indian Residents decreased from 9 2% in 2010 to 9% in 2020.
The number of Indian Permanent Residents decreased from 110,646 in 2010 to 99,414 in 2020.
The sex composition of the Indian population differed from the Total Resident population, with a higher proportion of males to females.
The Indian dependency ratio*, at 37.8, was lower than the National dependency ratio, at 42 3, in 2020
Fertility rates in the Indian population have remained low, decreasing by 0.12 from 2010 (1.13) to 2022 (1.01). This was below the national total fertility rate of 1.04 in 2022 and below the replacement fertility rate of 2.1.
Almost half (48.3%) of the Indian population were aged 40 and above in 2020

3.77 M RESIDENT POPULATION
4.04 M RESIDENT POPULATION
The proportion of Indian residents of the total population decreased slightly from 2010 (9 2%) to 2020 (9%).
TOTAL RESIDENT POPULATION (2020)
TOTAL RESIDENT POPULATION
TOTAL RESIDENT POPULATION
2020
INDIAN RESIDENT POPULATION
INDIAN RESIDENT POPULATION
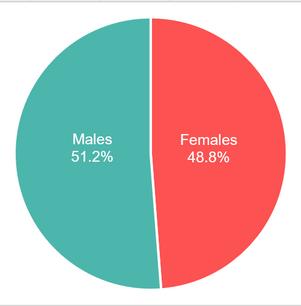
In both 2010 and 2020, there was a larger proportion of male Indian Residents compared to females, which contrasted with the Total Resident population, whereby females formed a larger proportion than males.
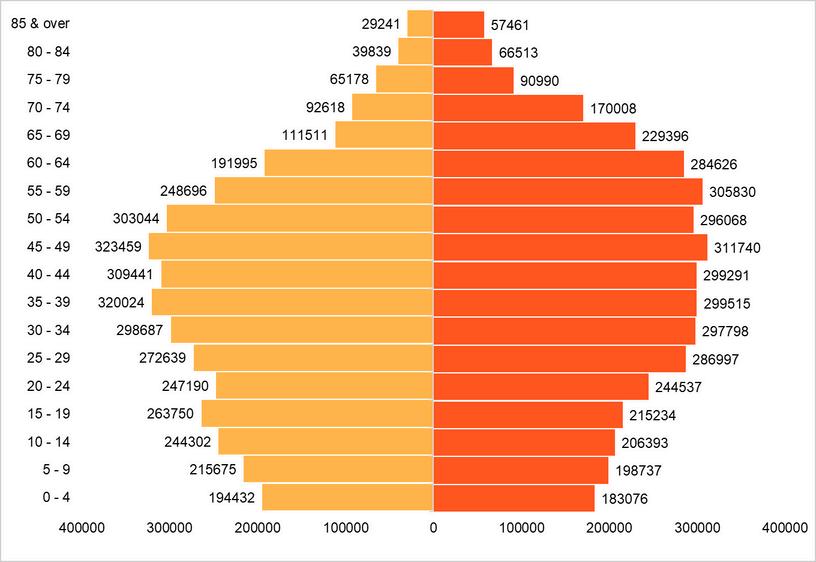
The Total Resident population aged 65 and over increased by 275,981 from 2010 to 2020
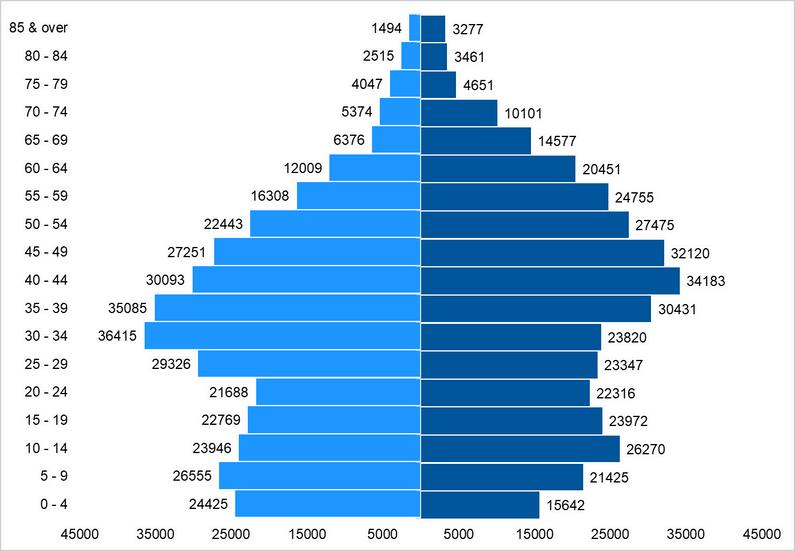
In 2020, 48.3% of the Indian Resident population was aged 40 years and above.
(NUMBER OF DEPENDENT RESIDENTS PER 100 RESIDENTS AGED 15 TO 64)
TOTAL RESIDENT POPULATION INDIAN
The Indian Resident population had a dependency ratio of 37.8 dependent residents (i.e. residents aged below 15 and above 64) per 100 residents aged between 15 and 64 which was lower than the national dependency ratio of 42.3 dependent residents in 2020.
FERTILITY RATES OF TOTAL RESIDENT POPULATION
2010 TO 2022
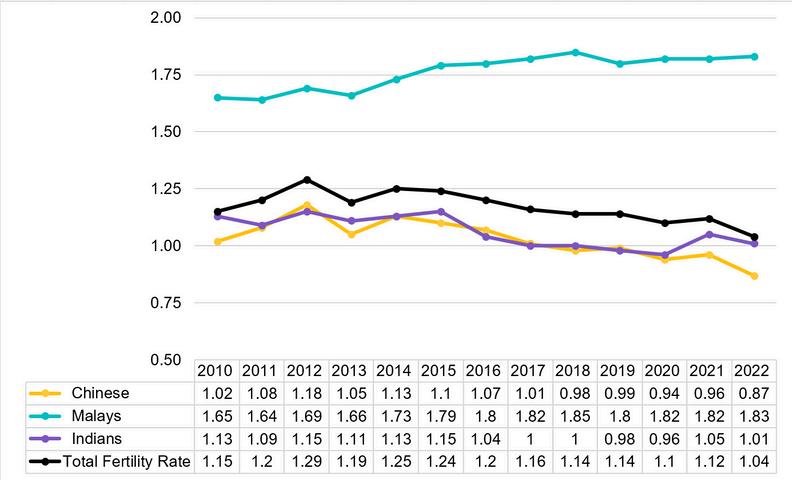
All ethnic groups did not meet the fertility replacement rate of 2 1
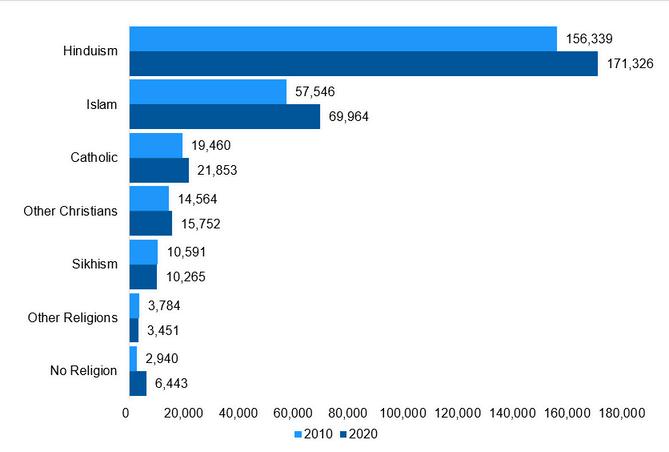
The Indian Resident population was mostly made up of Hindus at 57.3% (171,326), followed by Muslims at 23 4% (69,964) in 2020
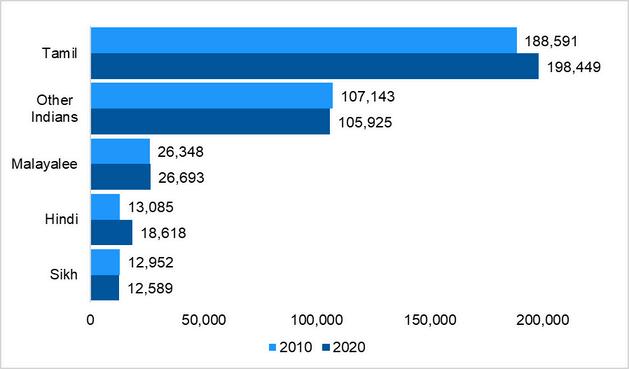
Tamils made up the largest proportion of the Indian Resident population at 198,449 in 2020
Indian Residents include residents of Indian, Pakistani, Bangladeshi or Sri Lankan origin. Besides Tamil, Malayalee, Hindi and Sikh which are shown in the table, the residual category of ‘Other Indians’ would include Punjabi, Hindustani, Urdu, Gujarati, Sindhi, Sinhalese, etc.
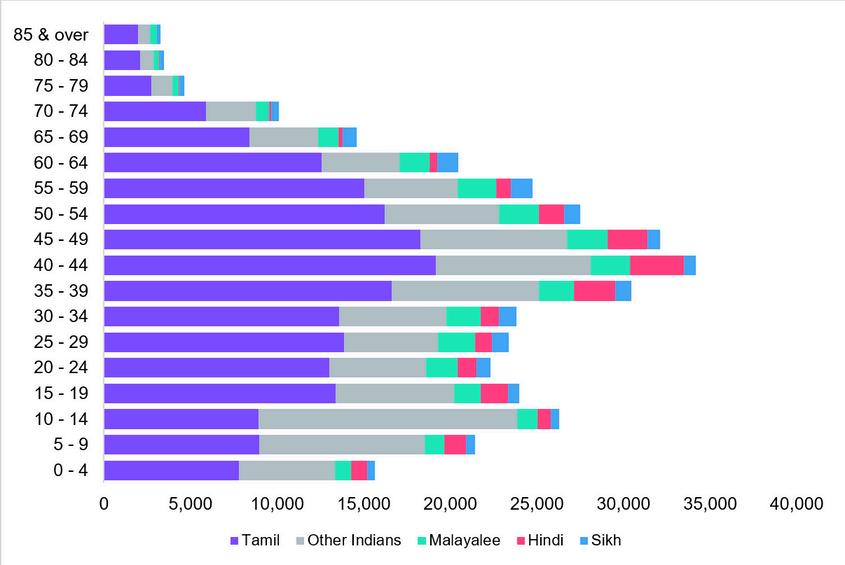
Indian Residents include residents of Indian, Pakistani, Bangladeshi or Sri Lankan origin. Besides Tamil, Malayalee, Hindi and Sikh which are shown in the table, the residual category of ‘Other Indians’ would include Punjabi, Hindustani, Urdu, Gujarati, Sindhi, Sinhalese, etc.
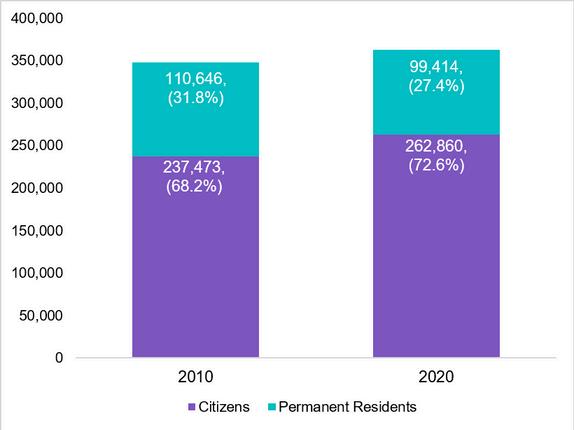
The number of Indian Permanent Residents decreased from 110,646 (31.8%) in 2010 to 99,414 (27.4%) in 2020.
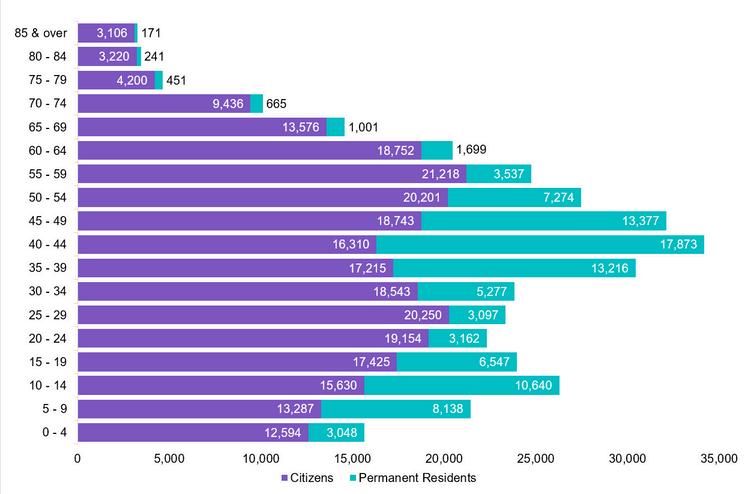
There were more Indian Permanent Residents than Indian Singapore Citizens in the 4044 age group
There was an increase in the Indian Primary 1 cohort that progressed to PostSecondary Education from 92.3% in 2013 to 95.8% in 2022.
Indian students performed better than the national cohort for English and Science PSLE subjects in 2021 and 2022
There was a 10% increase in the percentage of Indian students with 5 O-Level passes from 2013 to 2022 There was also an increase in the percentage of Indian students who passed Mathematics from 79.5% in 2013 to 85.8% in 2022.
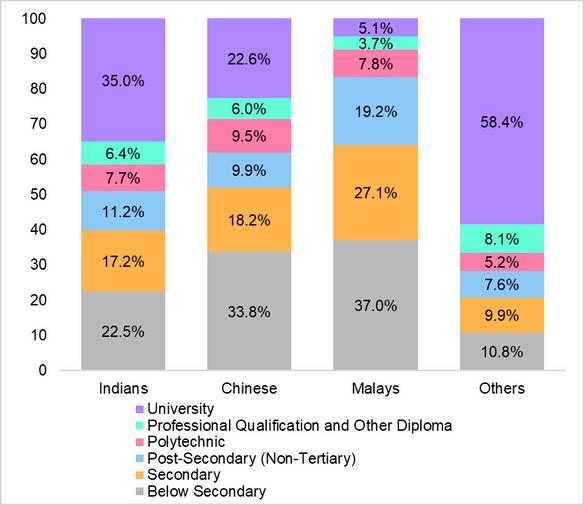
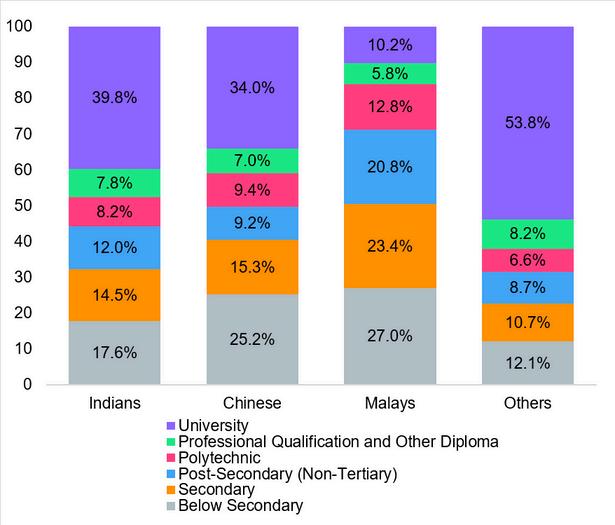
The percentage of the Indian Resident population with university qualifications increased from 35% in 2010 to 39.8% in 2020.
The percentage of Indian Residents with their highest qualification being Secondary and below decreased by 7.6% while those with Polytechnic qualifications and above increased by 6.7% between 2010 and 2020.
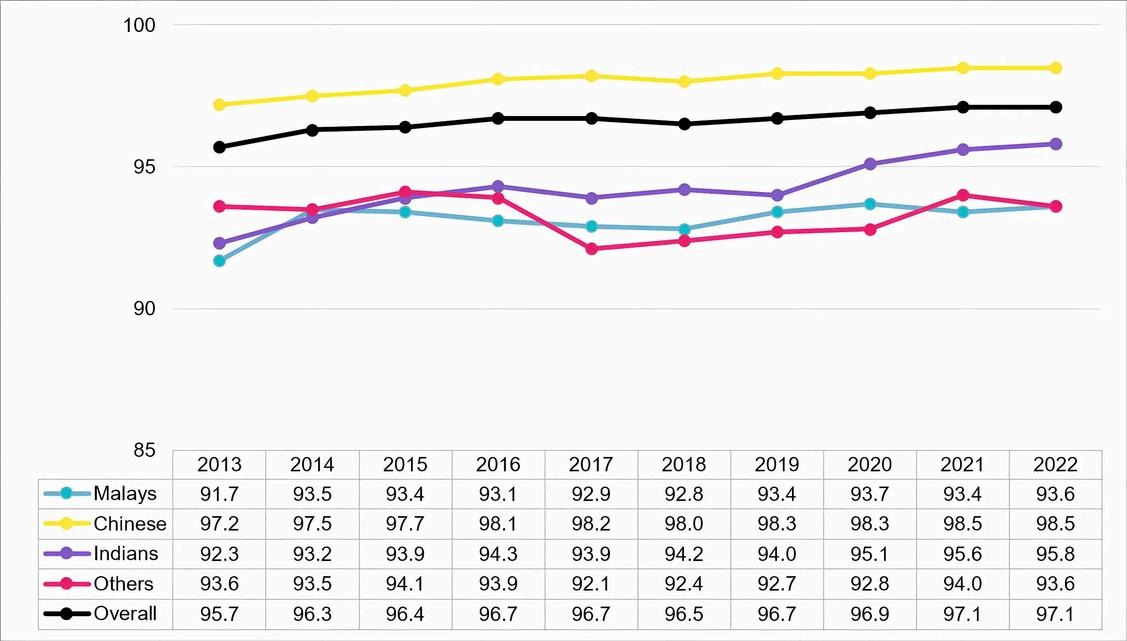
The percentage of the Indian Primary 1 cohort that progressed to Post-Secondary Education steadily increased by a total of 3.5% over the past ten years from 92.3% in 2013 to 95.8% in 2022.
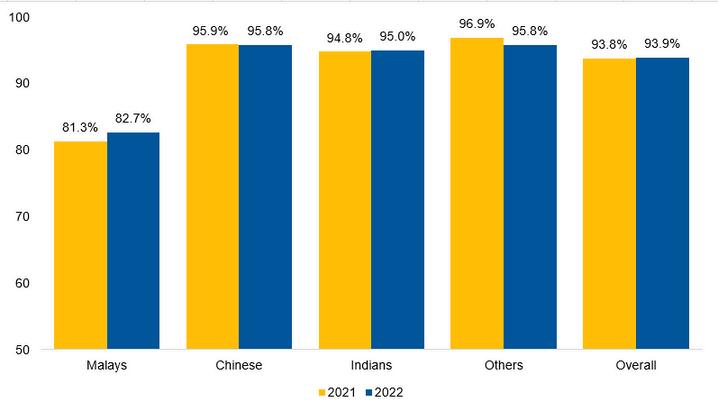
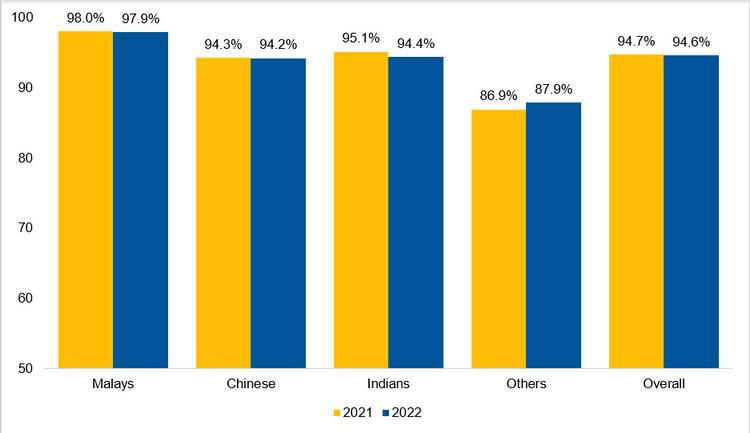
There was a slight increase (0.2%) in the percentage of Indian PSLE students who scored AL 1-6 in Standard English from 94 8% in 2021 to 95 0% in 2022 Compared to the national cohort, Indian PSLE students performed slightly better by 1.1% in 2022.
Indian PSLE students who scored AL 1-6 in Standard Mathematics increased by 1.3% from 2021 to 2022, reducing the gap with the national overall percentage from 1.4% to 0 6%
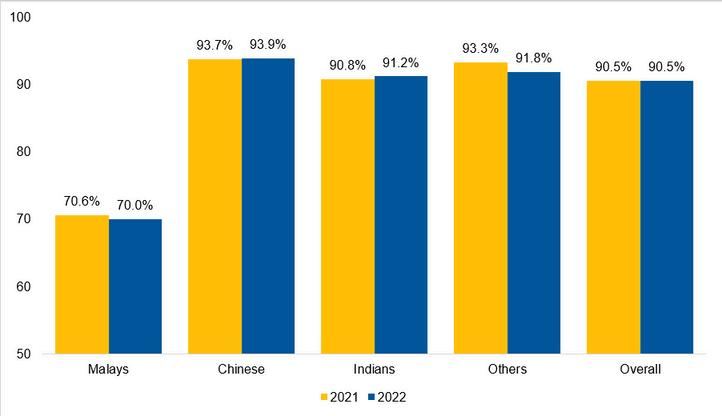
The percentage of Indian PSLE students who scored AL 1-6 in Standard Mother Tongue Language decreased by 0.7% in 2022, compared to 2021. However, the gap between the Indian PSLE students and the national cohort remained at a small percentage of 0.2%.
2021 2022
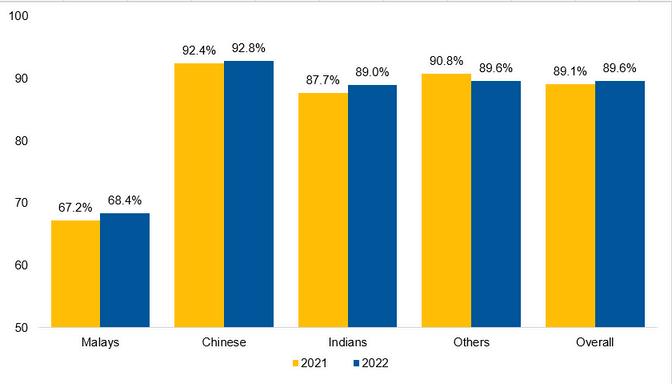
There was a slight improvement of 0 4% in the percentage of Indian PSLE students who scored AL 1-6 in Standard Science from 90.8% in 2021 to 91.2% in 2022. Compared to the national cohort, Indian PSLE students performed slightly better by 0 7% in 2022
2013 - 2022
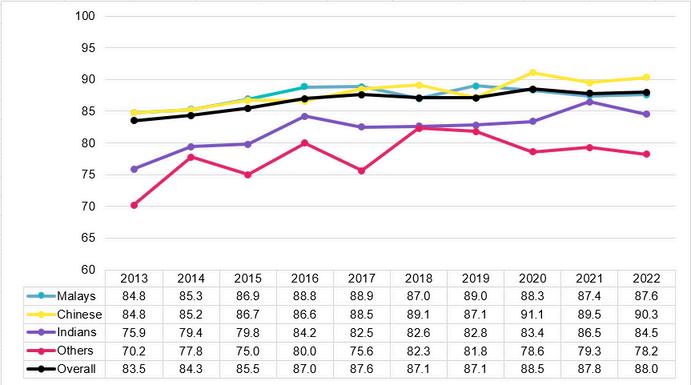
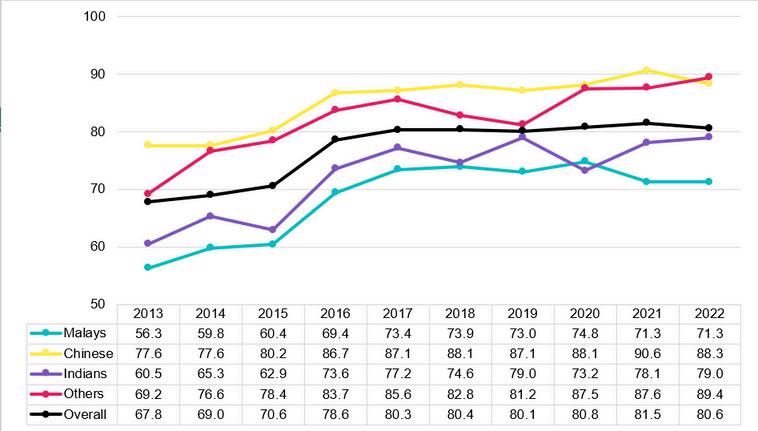
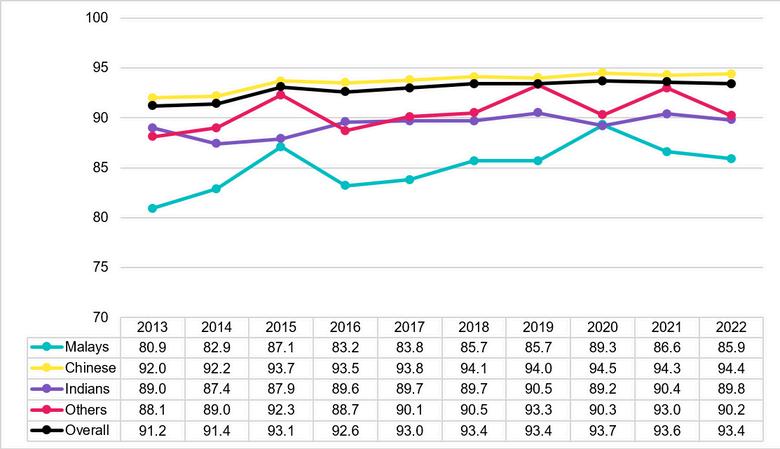
The percentage of Indian N(T)-Level students who progressed to ITE increased significantly since 2013 by 8.6%. The gap between Indian students and the national overall cohort narrowed from 7.6% in 2013 to 3.5%. However, compared to 2021, the percentage of Indian N(T)-Level students who progressed to ITE fell by 2%.
2013 - 2022
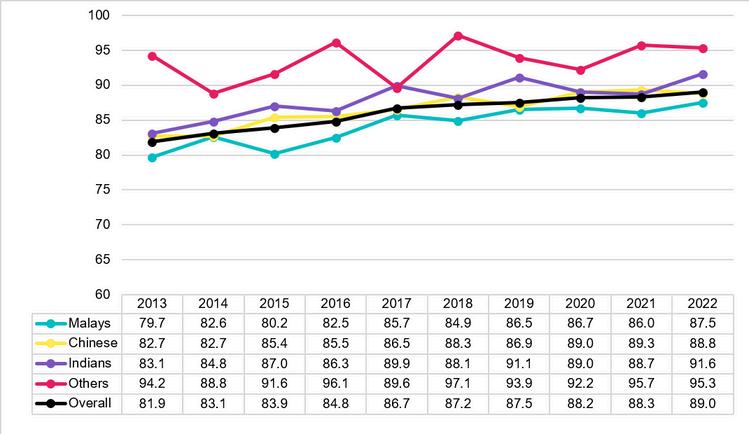
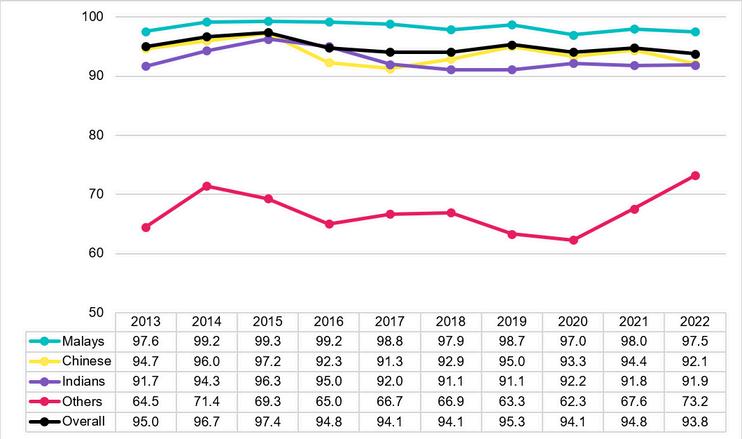
The percentage of N(T)-Level students who passed English Language increased by 8.5% from 2013 to 2022. Indian N(T)-Level students performed better than the national cohort by 2.6% in 2022.
2013 - 2022
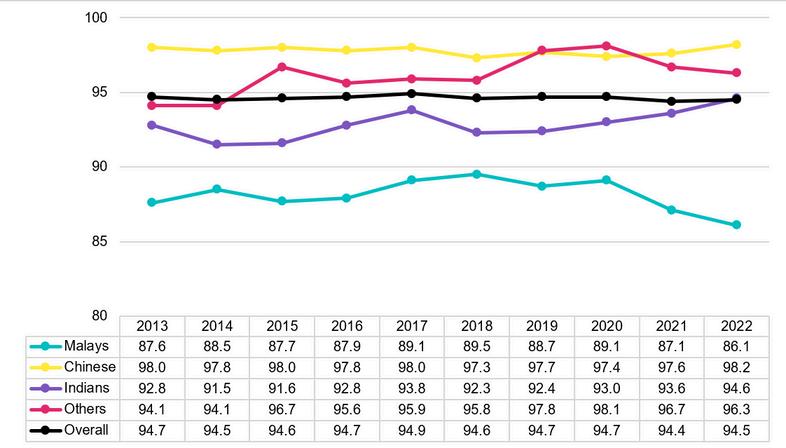
The percentage of Indian N(T)-Level students who passed Mathematics increased by 18.5% from 2013 to 2022. The gap with the national cohort decreased from 7.3% in 2013 to 1.6% in 2022.
2013 - 2022
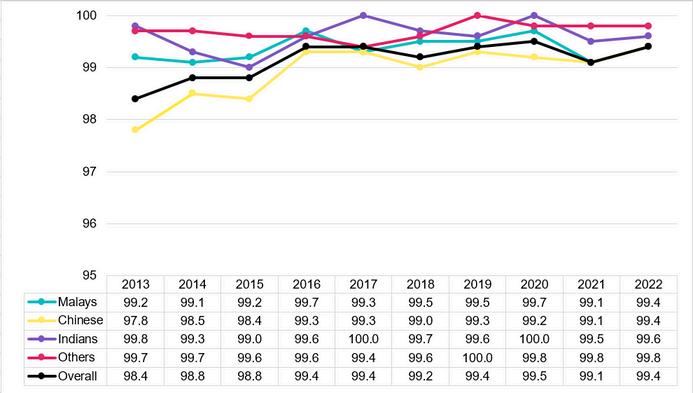
The percentage of Indian N(T)-Level students who passed Mother Tongue increased slightly by 0.1% from 2021 to 2022. Furthermore, the gap with the national overall percentage Indian students decreased from 3% to 1.9%.
2013 - 2022
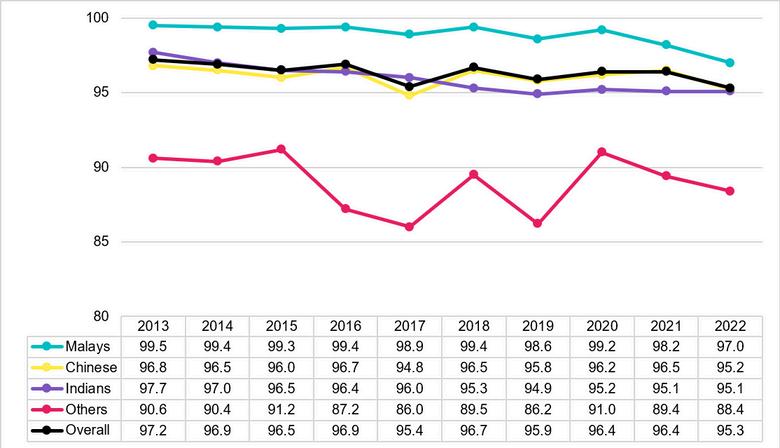
The percentage of Indian N(A)-Level students who passed English Language remained above 99% from 2013 to 2022. In 2022, Indian N(A)-Level students remained slightly ahead of the national cohort by 0.2%.
2013 - 2022
The percentage of Indian N(A)-Level students who passed Mathematics increased over the past 10 years by 1.8% from 2013 to 2022. Moreover, Indian N(A)-Level students overtook the national overall percentage by 0.1% in 2022.
2013 - 2022
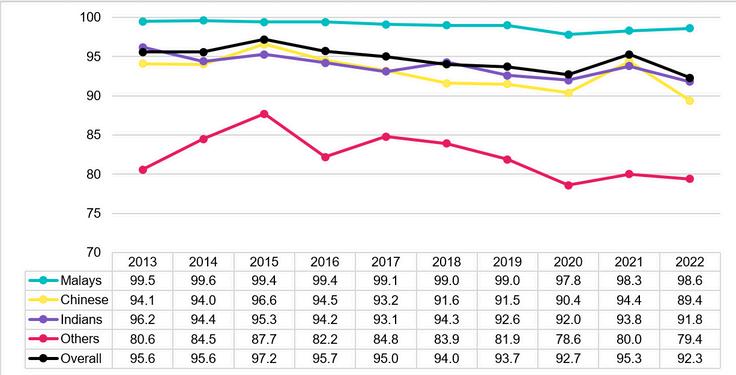
The percentage of Indian N(A)-Level students who passed Mother Tongue Language decreased by 2% from 2021 to 2022. However, the gap between Indian N(A)-Level students and the national cohort reduced from 1.5% in 2021 to 0.5% in 2022.
2013 - 2022
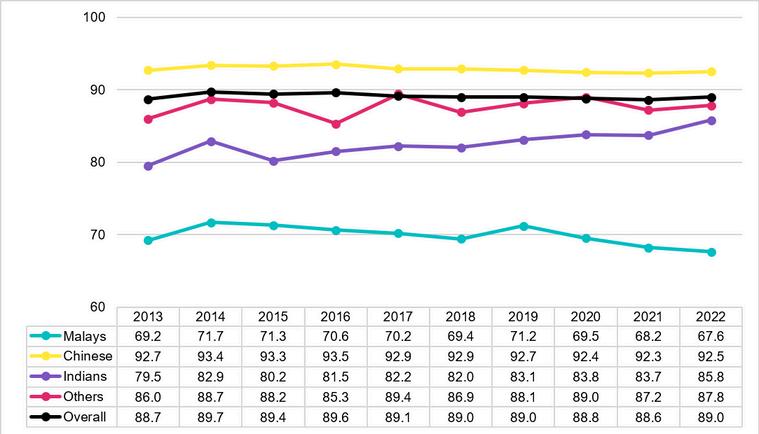
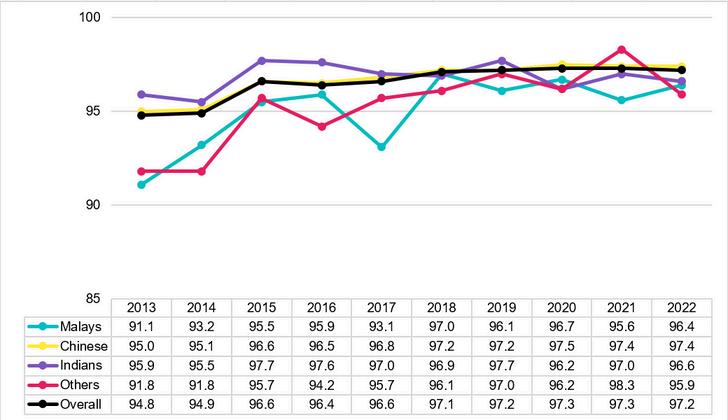
The percentage of Indian O-Level students with at least 5 O-Level passes increased by 10% from 2013 to 2022. However, the national overall percentage was still higher than that of the Indian student percentage by 1.6% in 2022.
2013 - 2022
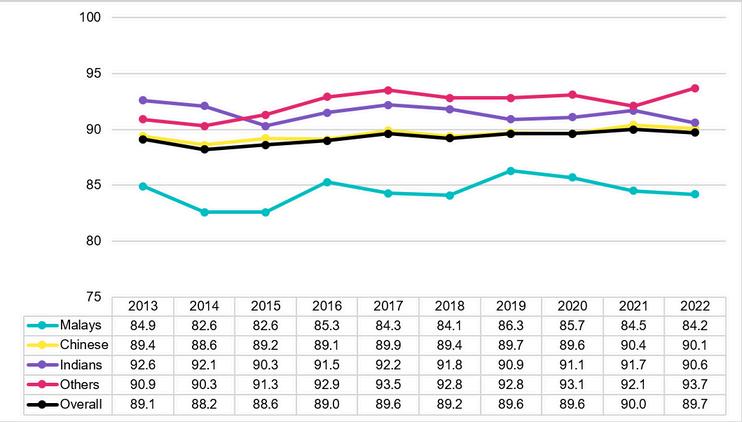
The percentage of Indian O-Level students who passed English Language decreased slightly from 2013 to 2022 by 2%. Nonetheless, this percentage remained higher than the national overall percentage by 0.9% in 2022.
2013 - 2022
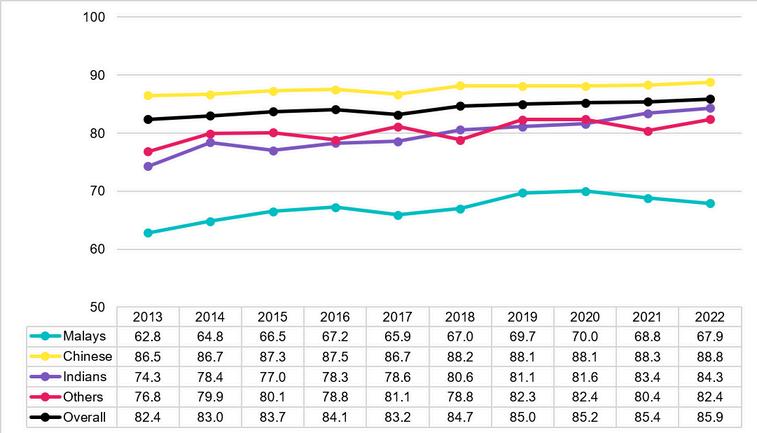
The percentage of the Indian O-Level students who passed Mathematics increased by 6.3% from 2013 to 2022. The gap between the national overall percentage and the Indian student percentage decreased from 9.2% in 2013 to 3.2% in 2022.
2013 - 2022
The percentage of Indian O-Level students who passed Mother Tongue remained the same from 2021 to 2022. However, the gap between the Indian student percentage and the national overall percentage decreased from 1.3% to 0.2%.
2013 - 2022
The percentage of Indian A-Level students with at least 3 H2 passes and a pass in General Paper or Knowledge and Inquiry increased slightly by 0.8% from 2013 to 2022. The gap between the Indian students and the national cohort widened from 2.2% in 2013 to 3.6%.
KNOWLEDGE AND INQUIRY
2013 - 2022
The percentage of Indian A-Level students who passed General Paper or Knowledge and Inquiry increased by 0.7% from 2013 to 2022. However, this percentage decreased from 97% in 2021 to 96.6% in 2022.
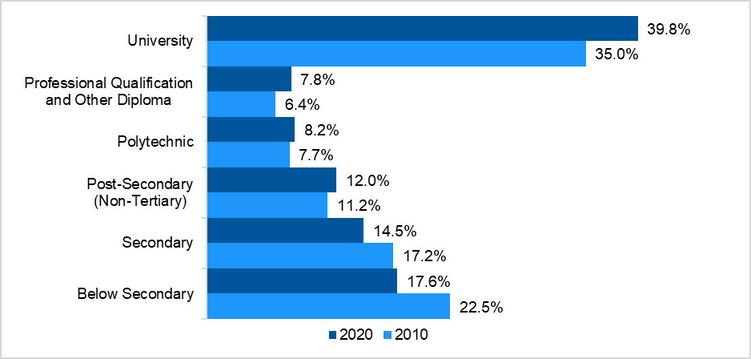
Indian Residents with University being their highest qualification increased by 4.8% from 2010 to 2020. The percentage of those with Polytechnic qualifications and above increased by 6.7% between 2010 and 2020. The percentage of the Indian population with Secondary qualifications and below decreased by 7.6%.
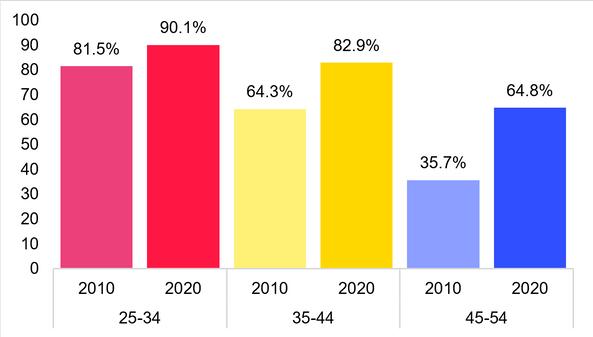
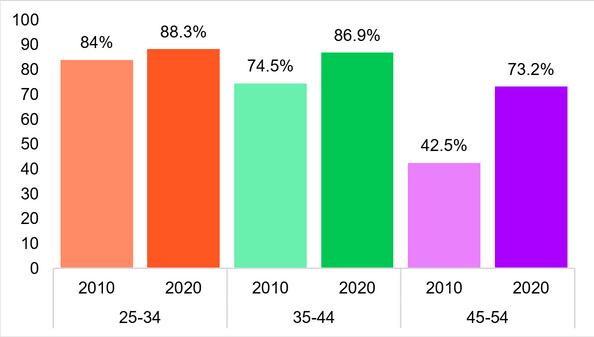
Indian Residents with Post-Secondary Qualifications or higher increased for all age groups, with a particularly significant increase in the 45 to 54 age group from 42.5% in 2010 to 73.2% in 2020.
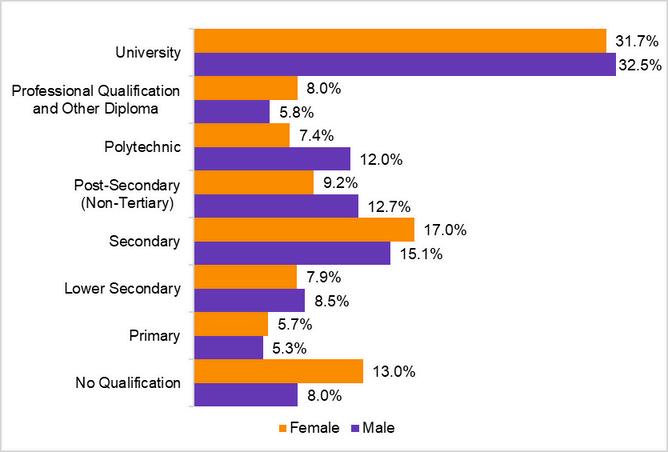
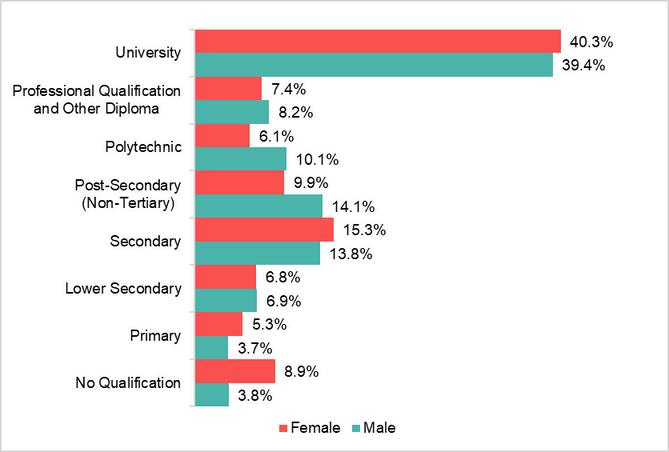
There was a higher proportion of females with No Qualification compared to males in the Indian Resident population, following a similar trend in the Total Resident population.
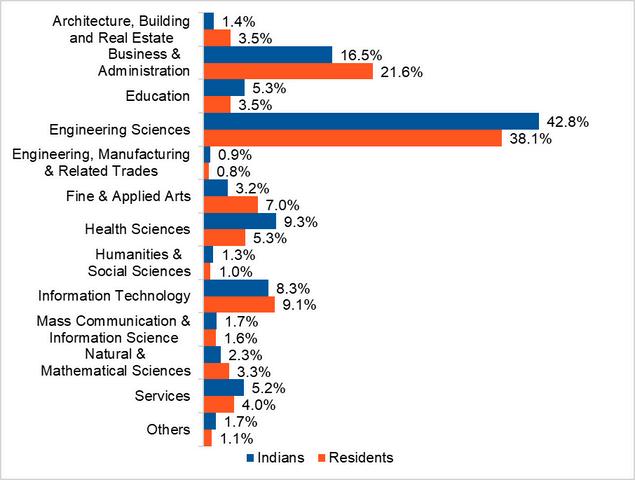
In 2020, the Indian Resident population had a slightly higher representation than the Total Resident Population in Engineering Sciences, Engineering, Manufacturing & Related Trades, Health Sciences, Humanities & Social Sciences, Mass Communication & Information Science, Services, and Others.
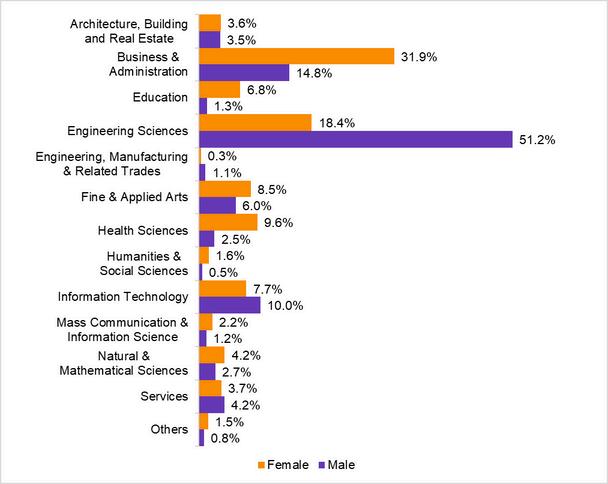
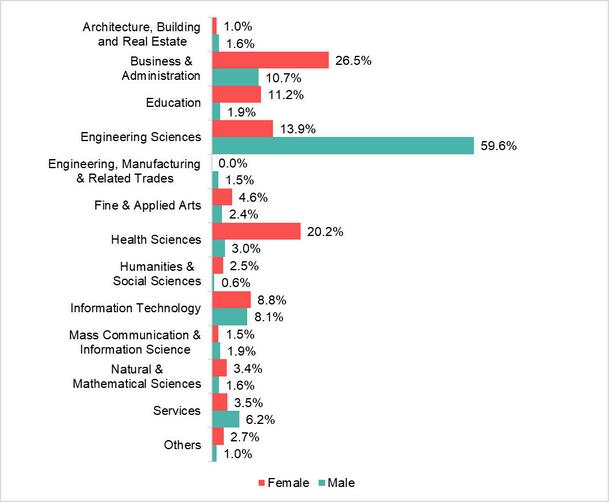
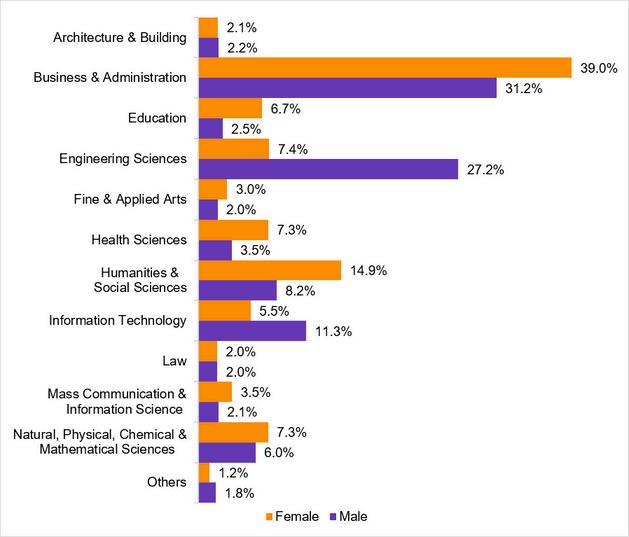
Female Indian polytechnic graduates were underrepresented in the field of Engineering Sciences, following a similar gender distribution in the Total Resident population.
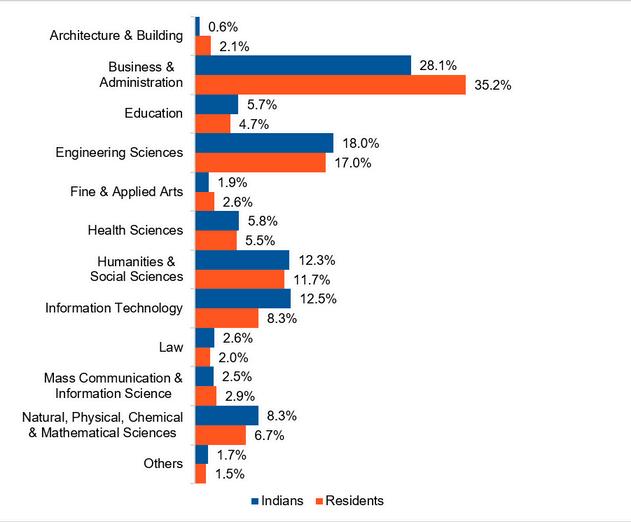
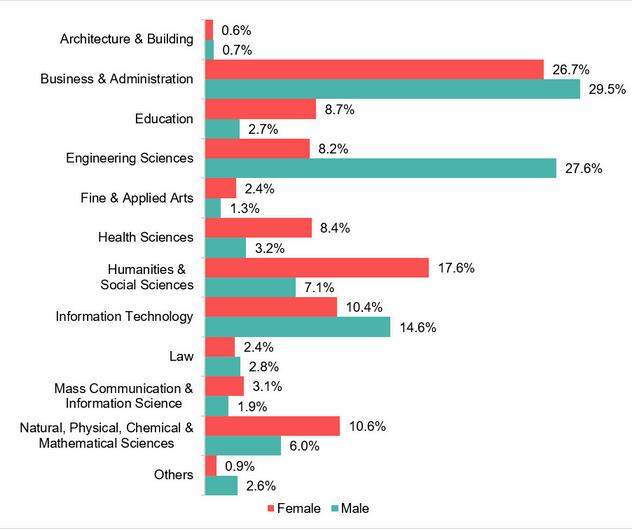
The Indian Resident population had a slightly higher representation than the Total Resident population in Education, Engineering Sciences, Humanities & Social Sciences, Information Technology, Law, and Natural, Physical, Chemical & Mathematical Sciences, and Others in 2020.
The percentage of economically active Indian females increased by 10.5% from 2010 to 2020.
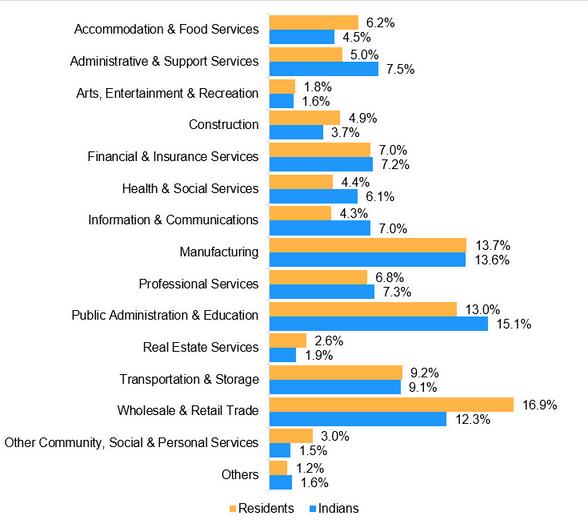
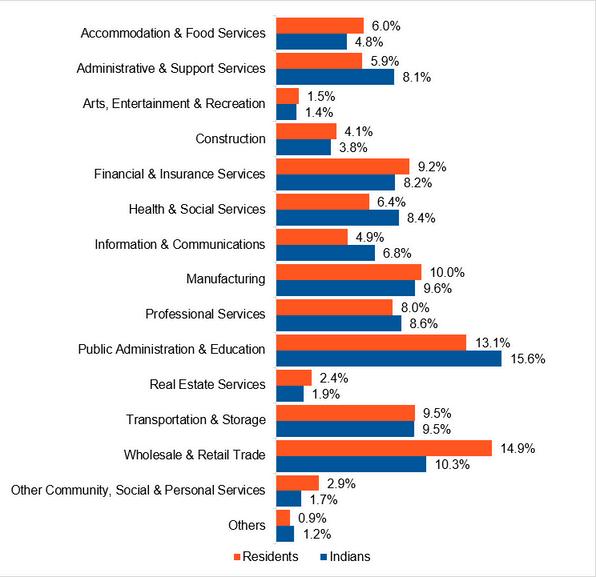
In 2020, a large proportion of Indian Residents worked in Public Administration & Education, Wholesale & Retail Trade and Manufacturing.
The percentage of Indian Residents who were PMETs increased by 5.6% between 2010 and 2020.
There are twice as many economically inactive senior female Indians (55 and above) as senior male Indians (55 and above), at 12,284 and 23,823 respectively.
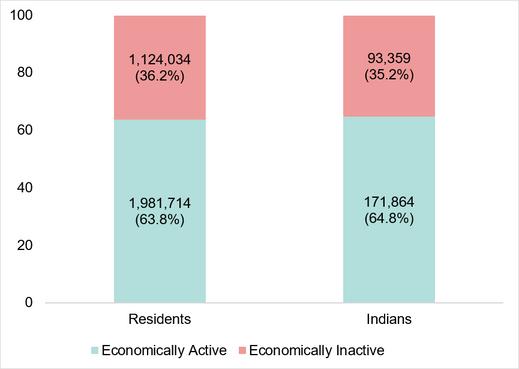
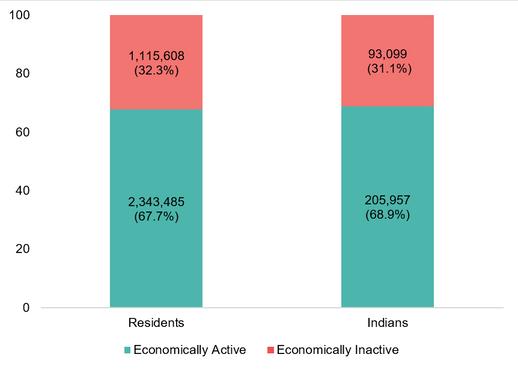
The percentage of economically active Indian Residents increased by 4.1% from 2010 to 2020.
Economically Active refers to individuals who are currently employed or looking for employment. Economically Inactive refers to individuals who are not employed and not looking for employment. These charts only include residents who are 15 years and older and the data excludes National Servicemen.
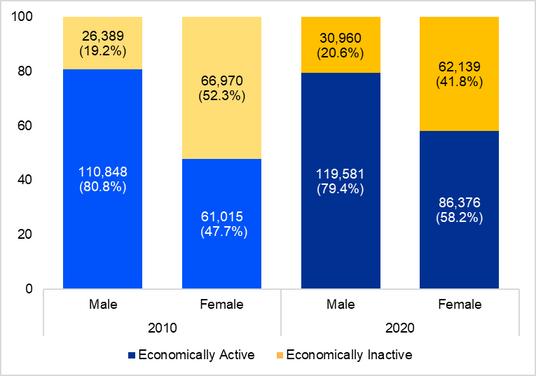
The percentage of economically active Indian male residents stayed relatively the same at 80 8% in 2010 and 79 4% in 2020 In contrast, the percentage of economically active Indian female residents increased by 10.5% from 2010 to 2020.
Economically Active refers to individuals who are currently employed or looking for employment.
Economically Inactive refers to individuals who are not employed and not looking for employment. These charts only include residents who are 15 years and older and the data excludes National Servicemen.
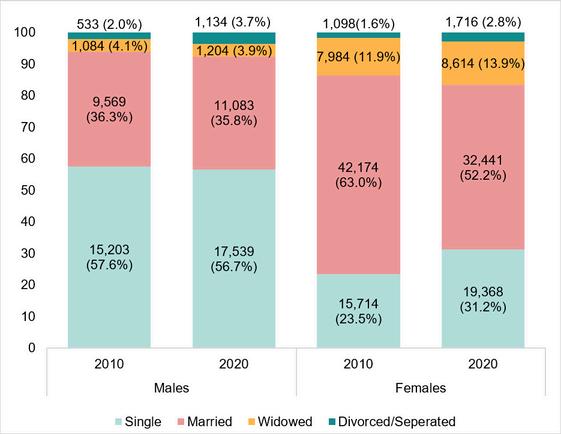
The percentage of economically inactive females who were married decreased from 63% in 2010 to 52 2% in 2020, highlighting an increase in dual income families
Economically Active refers to individuals who are currently employed or looking for employment. Economically Inactive refers to individuals who are not employed and not looking for employment. These charts only include residents who are 15 years and older and the data excludes National Servicemen.
Economically Active refers to individuals who are currently employed or looking for employment. Economically Inactive refers to individuals who are not employed and not looking for employment. These charts only include residents who are 15 years and older and the data excludes National Servicemen.
The number of female Indian Residents who were economically inactive decreased by 4,831 from 2010 to 2020.
Economically Active refers to individuals who are currently employed or looking for employment. Economically Inactive refers to individuals who are not employed and not looking for employment.
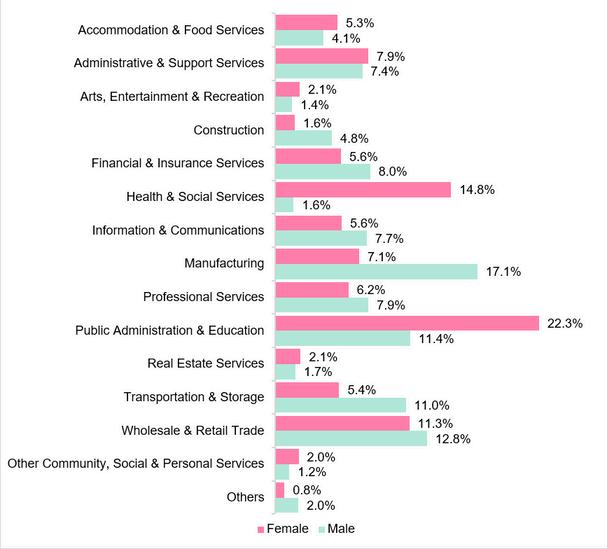
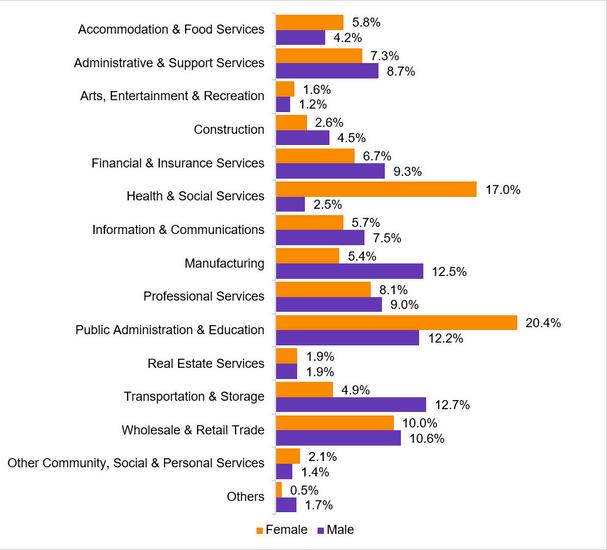
A large proportion of Indian females worked in Public Administration & Education, and Health & Social Services in both 2010 and 2020.
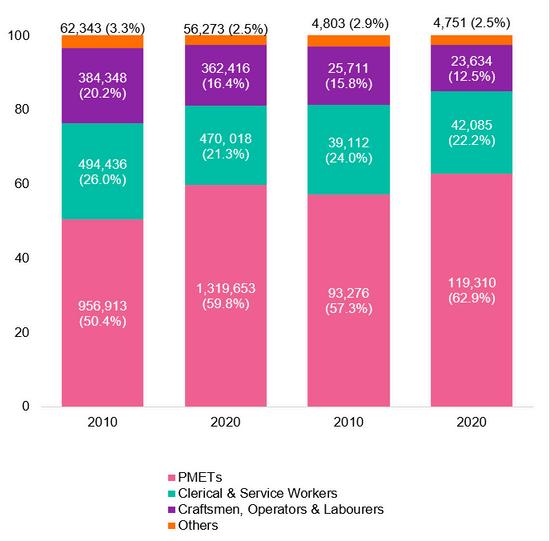
The percentage of Indian Residents who were PMETs increased by 5.6% between 2010 and 2020.
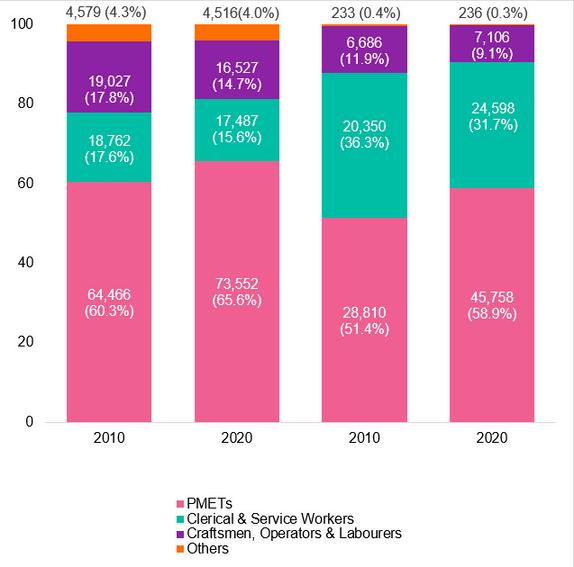
Males Females
The percentage of Indian male PMETs increased by 5 3% between 2010 and 2020 Similarly, the percentage of Indian female PMETs increased by 7.5%.

The number of Indian female residents who were employed increased from 56,068 in 2010 to 77,697 in 2020.
Similar to the national trend, the percentage of Indian households with one or two persons increased from 26.7% in 2010 to 31.7% in 2020.
The median monthly household income of Indian households remained higher than that of Total Resident households at $8,500 compared to $7,744 in 2020.
In both the Total Resident and the Indian Resident population, the percentage of households with a monthly household income of $15,000 and over doubled to 23 5% for residents and 25 6% for Indian households from 2010 to 2020
The percentage of Indian households with no employed person increased from 7.8% to 10.5% from 2010 to 2020.
The percentage of couple-based Indian households with children decreased by 5.9% from 2010 to 2020
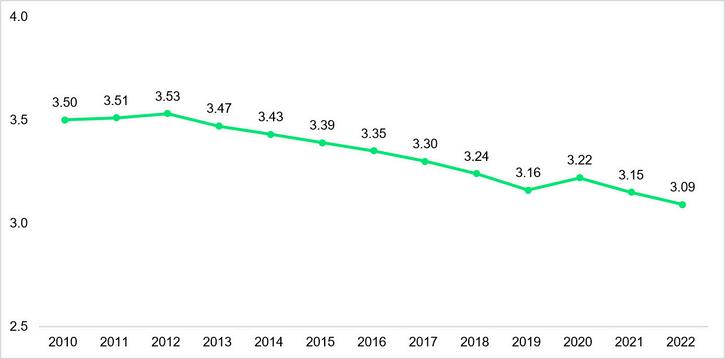
The average household size of the Total Resident population decreased from 3.5 in 2010 to 3.09 in 2022.
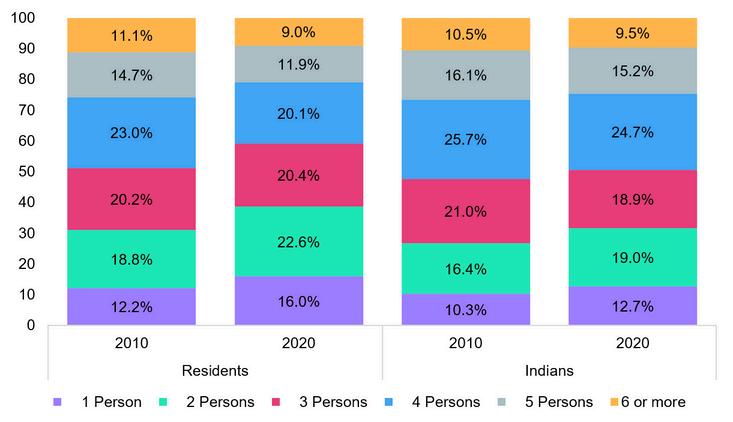
The percentage of Indian households comprising one or two persons increased from 26.7% in 2010 to 31.7% in 2020, similar to the national trend.
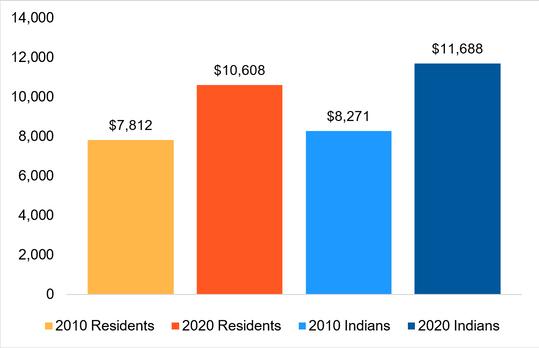
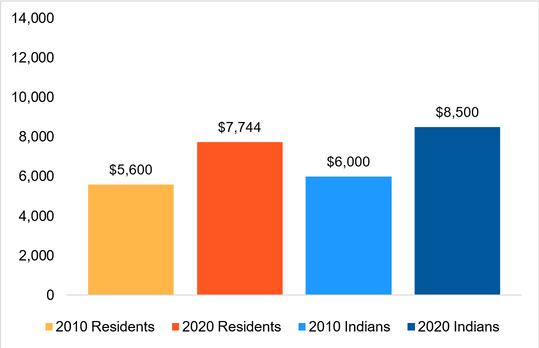
The mean monthly income of Indian households increased by $3,417 from 2010 and 2020, while the median monthly income of Indian households increased by $2,500 .
MONTHLY HOUSEHOLD INCOME FROM WORK PER HOUSEHOLD MEMBER OF TOTAL AND INDIAN RESIDENT POPULATIONS
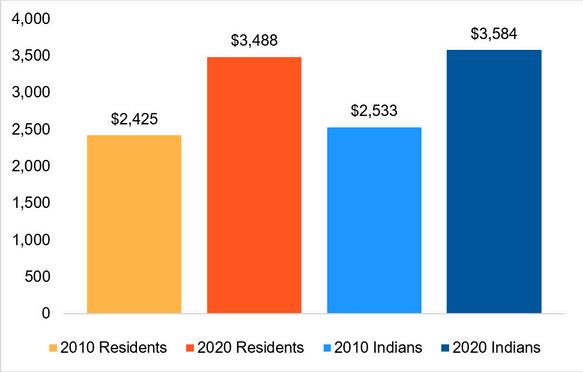
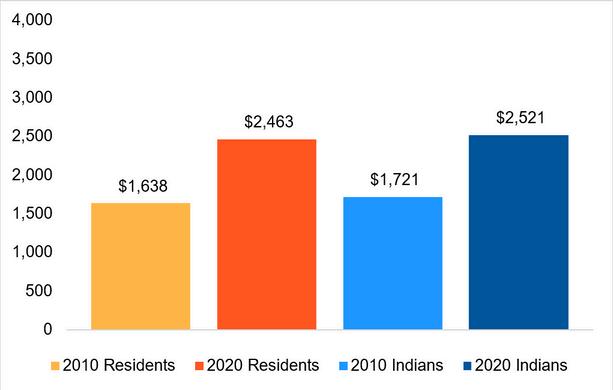
From 2010 to 2020, the mean monthly income of Indian households per household member increased by $1,051, while the median monthly income of Indian households per household member increased by $800.
HOUSEHOLD INCOME OF LOW-INCOME INDIAN RESIDENTS (20TH PERCENTILE)
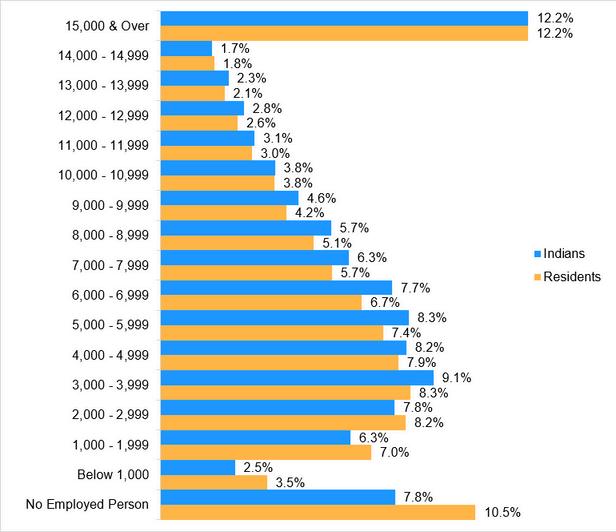
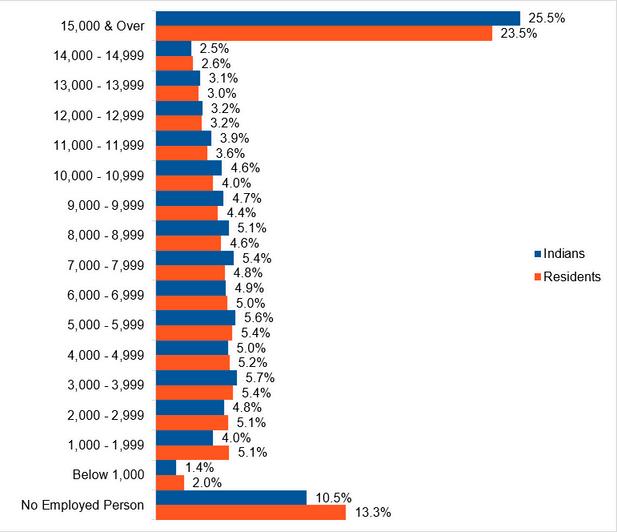
In the Total and Indian Resident populations, the percentage of households with a monthly household income of $15,000 and over doubled to 23.5% and 25.5% respectively from 2010 to 2020.
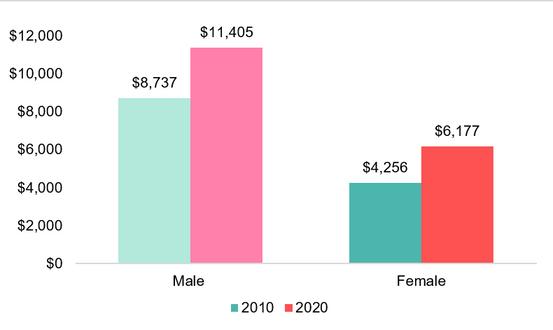
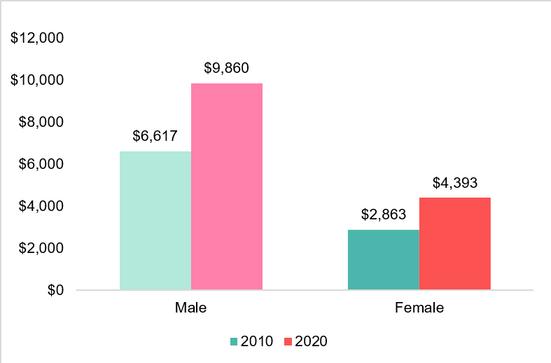
In both 2010 and 2020, the median monthly household income for households with a male head of household was more than double than that of households with a female head of household.
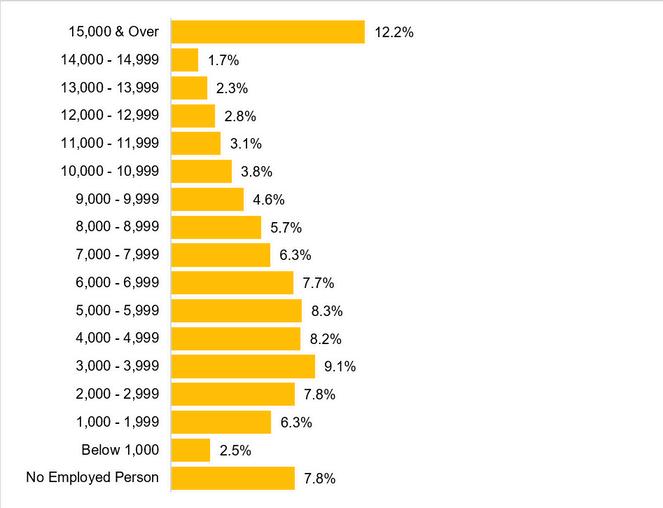
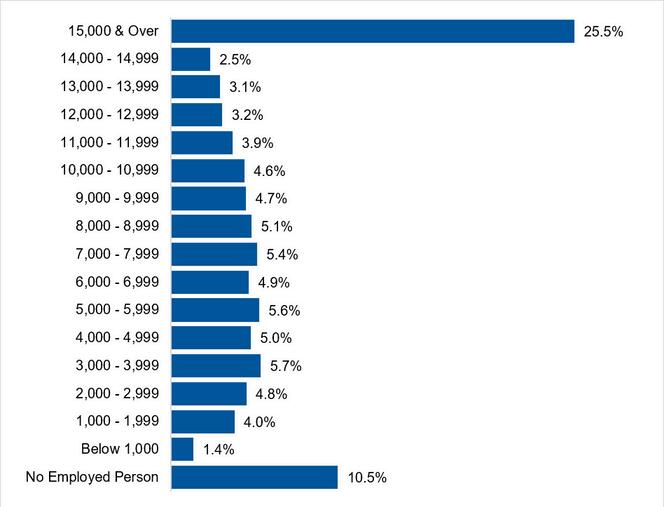
The percentage of Indian households with a monthly household income of $15,000 and over increased by 13.3% from 2010 to 2020. However, the percentage of Indian households with no employed persons increased by 2.7%.
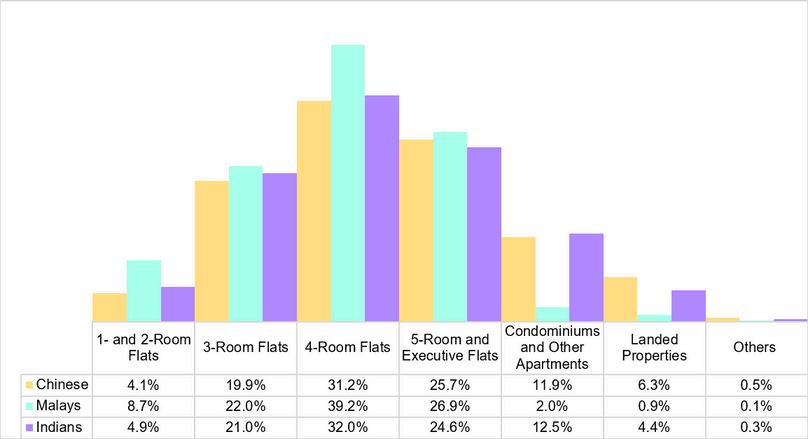
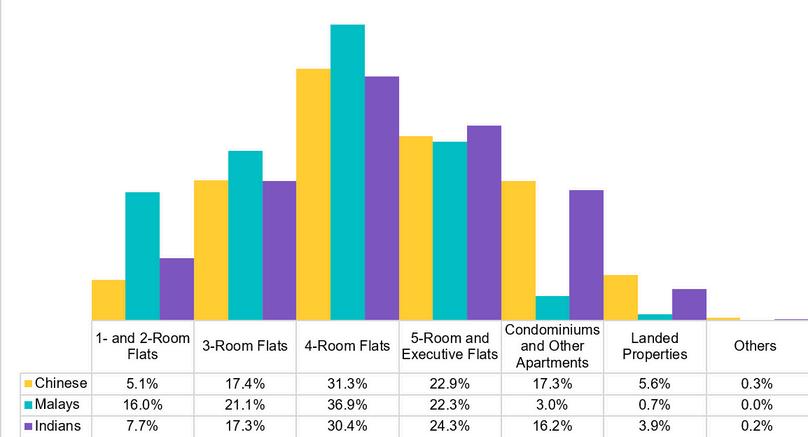
From 2010 to 2020, there was a 2.8% increase in the percentage of Indian households living in one and two-room flats, while there was a 3.7% increase in the percentage of Indian households living in condominiums and other apartments.
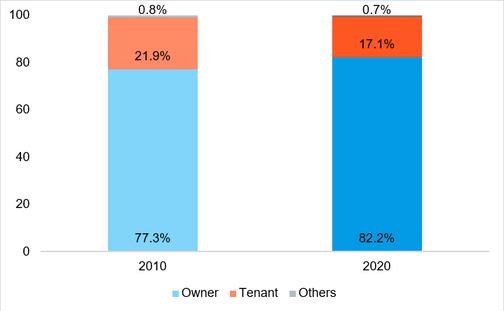
From 2010 to 2020, there was a 4.9% increase in the percentage of home ownership in the Indian Resident population.
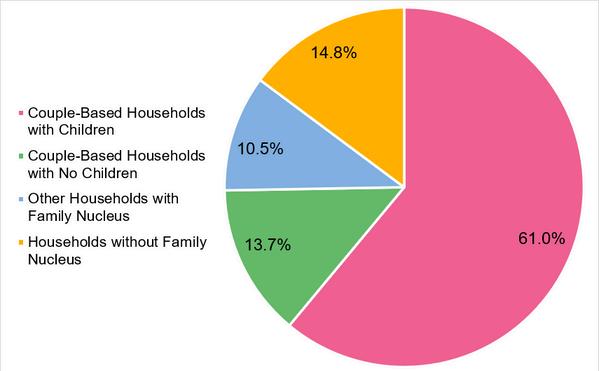
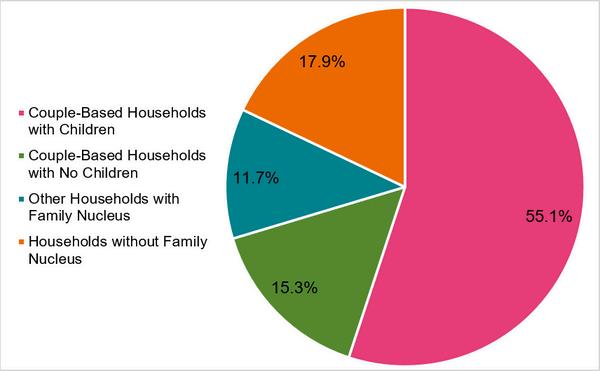
Indian couple-based households with children decreased from 61.0% in 2010 to 55.1% in 2020.
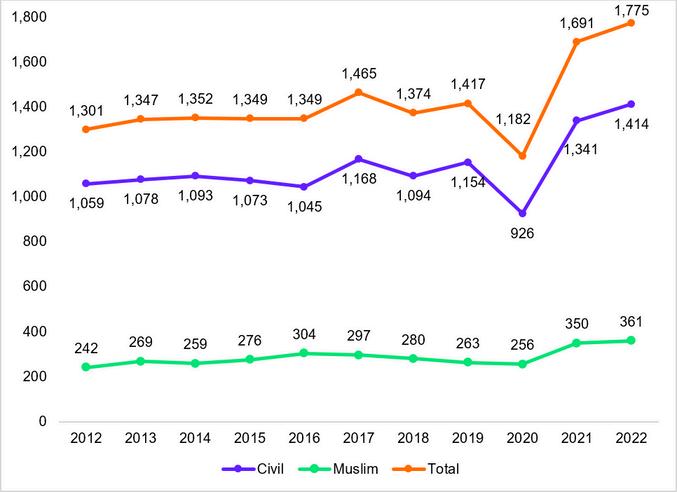
The number of Indian marriages increased by 593 from 2020 to 2022 following the dip from the COVID-19 pandemic in 2020.
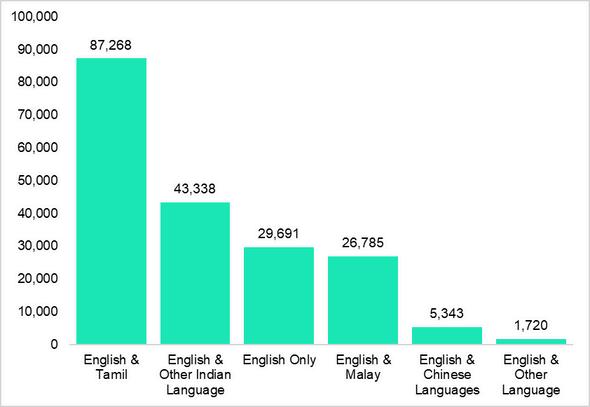
There was an increase of 69,069 (55%) Indian Residents who use English as their most frequently spoken language at home from 2010 to 2020
85% of the Indian Resident population were bilingual or spoke more than two languages in 2020.
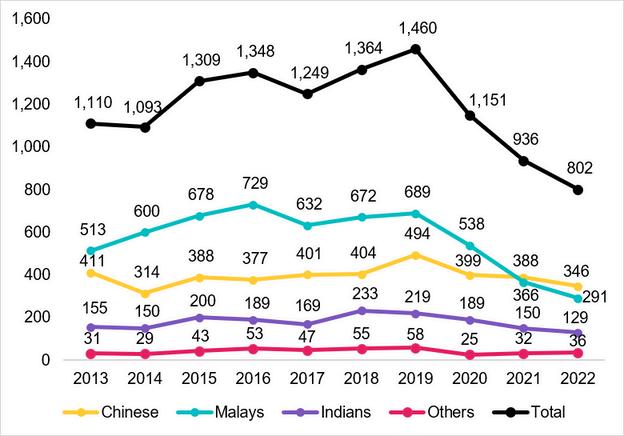
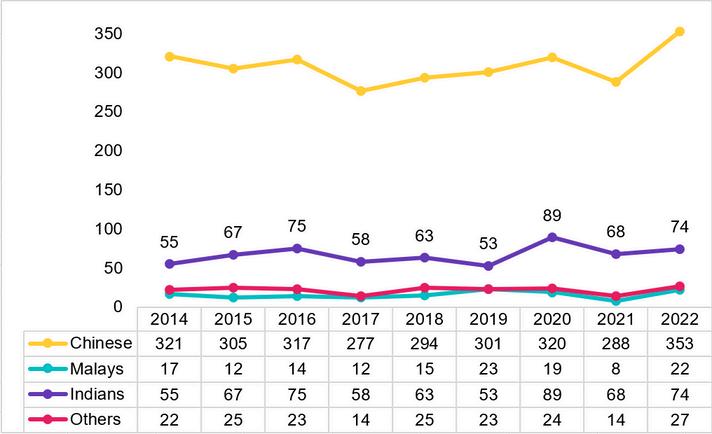
The number of new drug abusers from the Indian Resident population decreased from 150 to 129 from 2021 to 2022

2012 TO 2022
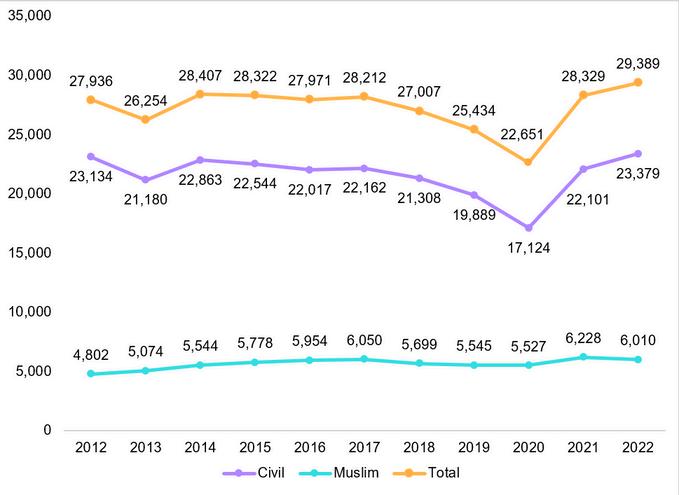
2012 TO 2022
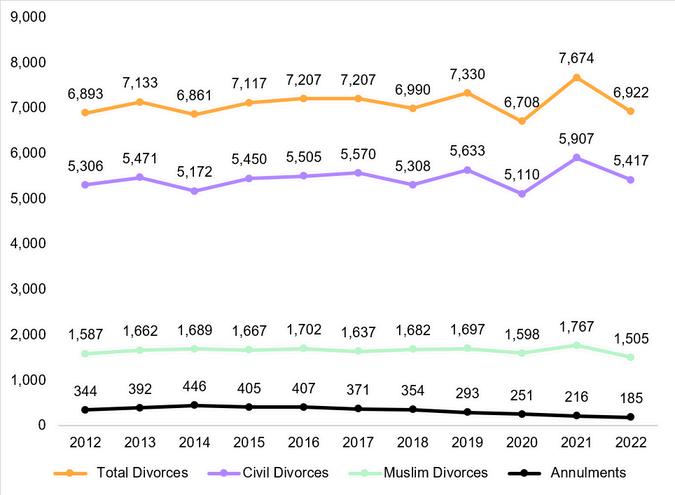
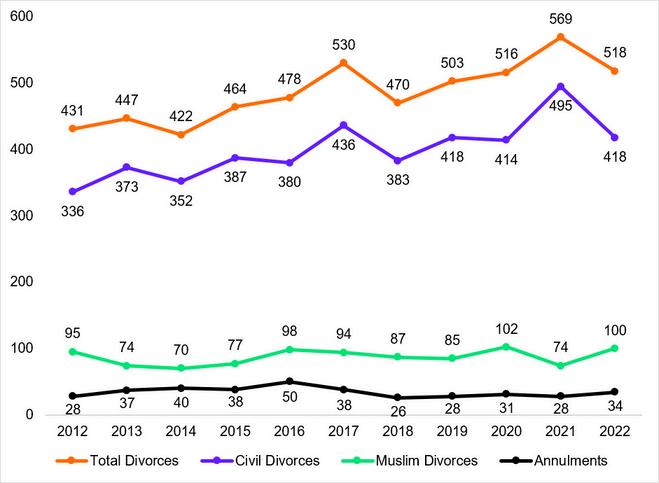
NUMBER OF DIVORCES AND ANNULMENTS IN TOTAL RESIDENT POPULATION
2012 TO 2022
NUMBER OF DIVORCES AND ANNULMENTS IN INDIAN RESIDENT POPULATION The number of divorces of Indian Resident population only includes divorces where both the bride and
2012 TO 2022
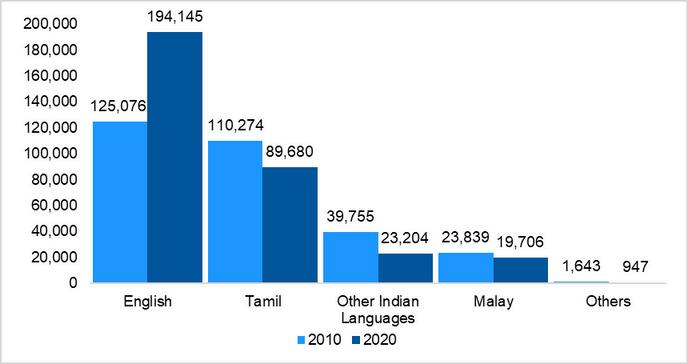
The number of Indian Residents who spoke English most frequently at home increased significantly by 69,069 from 2010 to 2020.
INDIAN RESIDENT POPULATION AGED 5 YEARS AND OVER WITH ENGLISH AS LANGUAGE MOST FREQUENTLY SPOKEN AT HOME BY THEIR SECOND MOST FREQUENTLY SPOKEN LANGUAGE
INDIAN RESIDENT POPULATION AGED 5 YEARS AND OVER WITH TAMIL AS LANGUAGE MOST FREQUENTLY SPOKEN AT HOME BY THEIR SECOND MOST FREQUENTLY SPOKEN LANGUAGE 2020
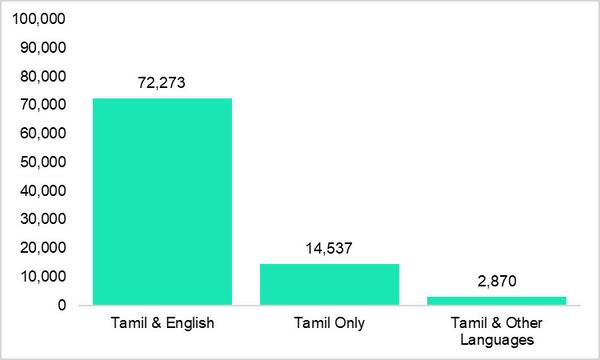
2020
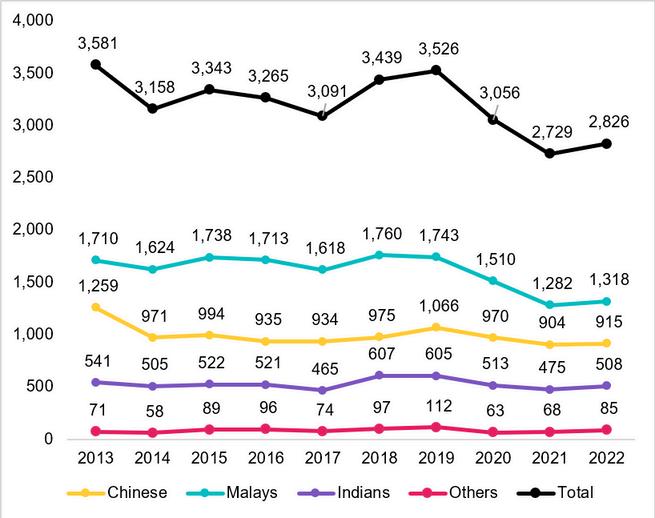
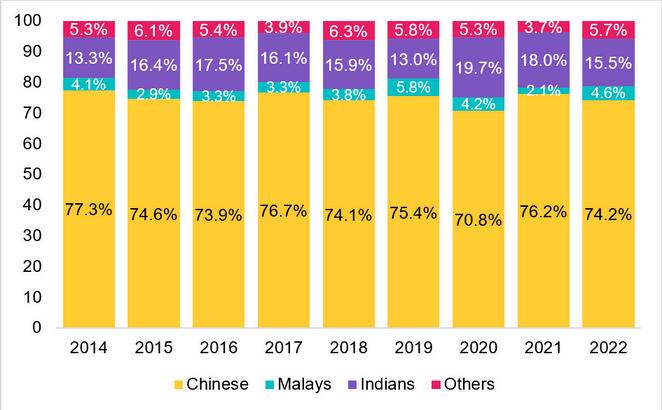
NUMBER OF DRUG ABUSERS IN TOTAL RESIDENT POPULATION BY ETHNICITY
2013 TO 2022
NUMBER OF NEW DRUG ABUSERS IN TOTAL RESIDENT POPULATION BY ETHNICITY
2013 TO 2022
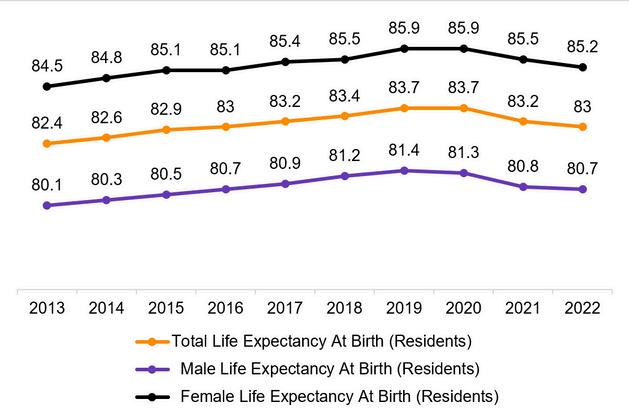
There was a slight decrease in life expectancy for the Total Resident population since the COVID-19 pandemic, falling from 85.9 years old in 2020 to 85 2 years old in 2022
The Indian Resident population had a younger median age of suicides than the Total Resident population at 33.7 compared to 47.4 years old in 2022.
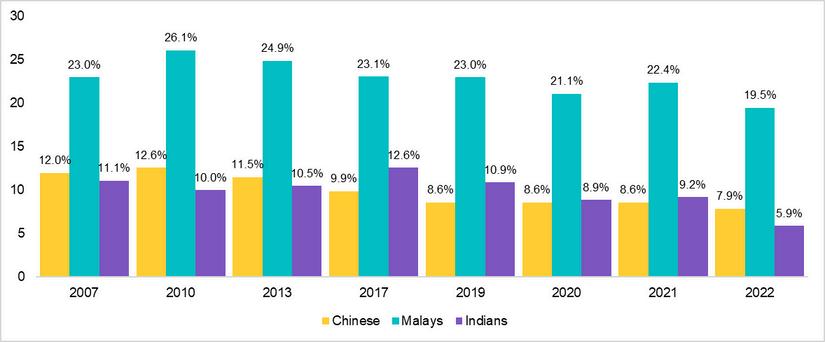
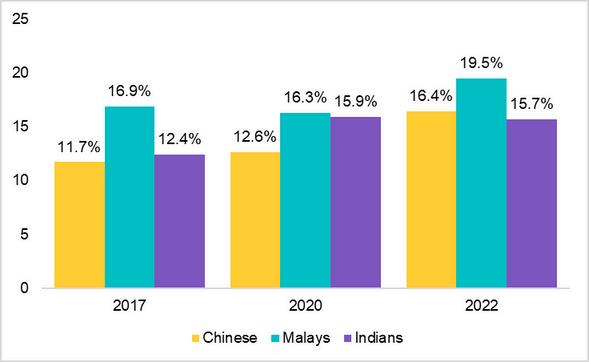
The Indian Resident population had the highest crude prevalence of diabetes mellitus among ethnic groups, at 16 9% in 2022
The crude prevalence of poor mental health for the Indian population was at 15 7% for 2022 which was the lowest among ethnic groups

2013 TO 2022
The life expectancies of the Total Resident population showed a slight decrease beginning in 2020, which was likely due to the COVID-19 pandemic
2010 TO 2022
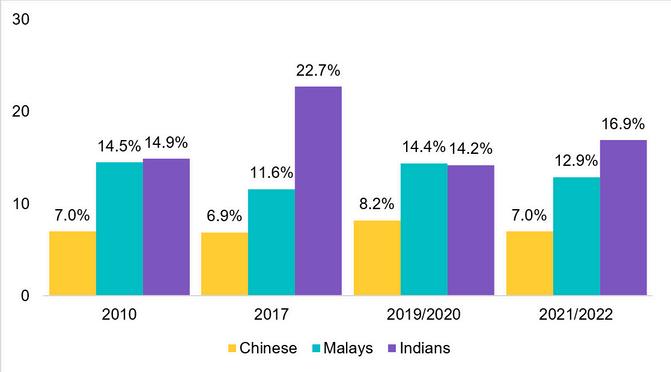
The Indian population had the highest prevalence of diabetes mellitus among the ethnic groups in 2021/2022, at 16 9%
UNDIAGNOSED DIABETES MELLITUS IN TOTAL RESIDENT POPULATION
2021/2022
TOTAL RESIDENTS WITH KNOWN DIABETES MELLITUS WHO DID NOT MEET THE GLYCAEMIC CONTROL TARGET
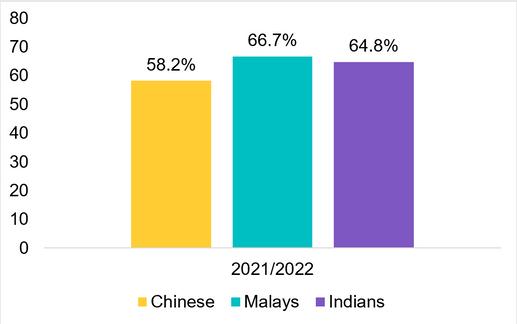
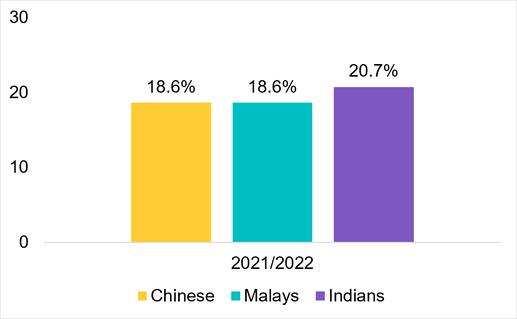
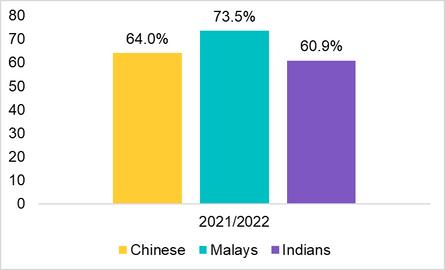
Among ethnic groups in 2021/2022, the Indian Resident population had the largest proportion of undiagnosed diabetes mellitus, at 20.7%, and the second largest proportion of residents with known diabetes mellitus who did not meet the glycaemic control, at 64.8%.
Data only includes residents aged 18 to 74 years of age.
The crude prevalence of cases is the ratio of the number of prevalent cases in a specified population scaled to the size of the population.
The years in the tables are as reflected in the National Population Health Survey report.
Undiagnosed health conditions refers to respondents were not diagnosed with the health condition by a healthcare professional prior to the health screening.
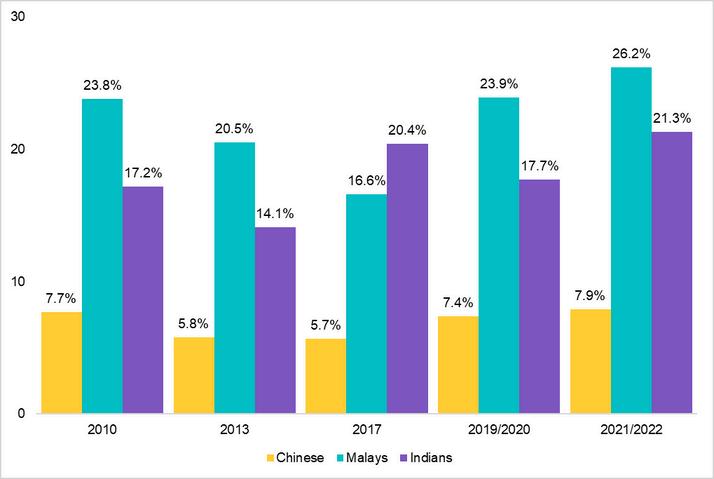
From 2010 to 2021/2022, the prevalence of hypertension in the Indian population increased by 14.5%.
UNDIAGNOSED HYPERTENSION IN TOTAL RESIDENT POPULATION WITH HYPERTENSION
TOTAL RESIDENTS WITH KNOWN HYPERTENSION WHO HAD POOR CONTROL OF BLOOD PRESSURE LEVELS
2021/2022
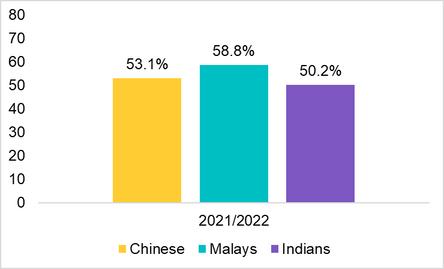
The Indian Resident population had the lowest proportion of undiagnosed hypertension among ethnic groups. The Indian Resident population also had the lowest proportion of residents with known hypertension who had poor control of blood pressure levels.
Data only includes residents aged 18 to 74 years of age.
The crude prevalence of cases is the ratio of the number of prevalent cases in a specified population scaled to the size of the population.
The years in the tables are as reflected in the National Population Health Survey report. Undiagnosed health conditions refers to respondents were not diagnosed with the health condition by a healthcare professional prior to the health screening.
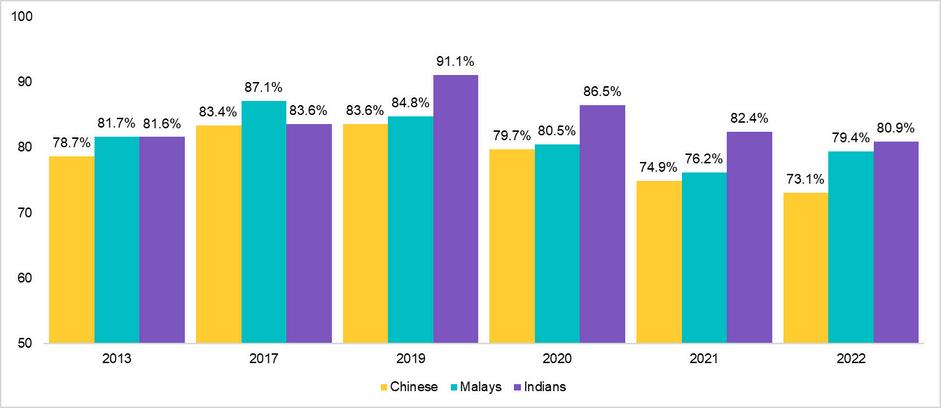
From 2017 to 2021/2022, the prevalence of high cholesterol in the Indian Resident population decreased by 7.5%.
2021/2022
Data only includes residents aged 18 to 74 years of age.
The crude prevalence of cases is the ratio of the number of prevalent cases in a specified population scaled to the size of the population.
The years in the tables are as reflected in the National Population Health Survey report. Undiagnosed health conditions refers to respondents were not diagnosed with the health condition by a healthcare professional prior to the health screening.
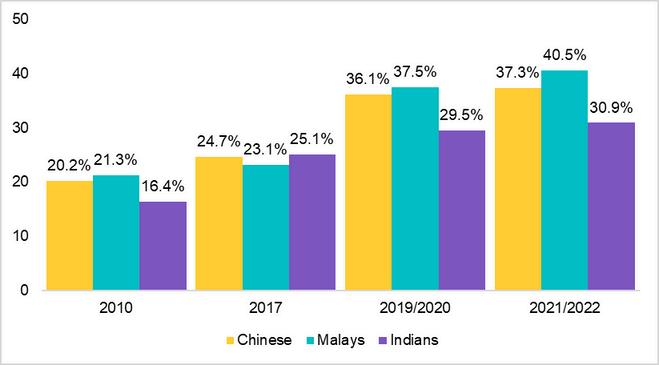
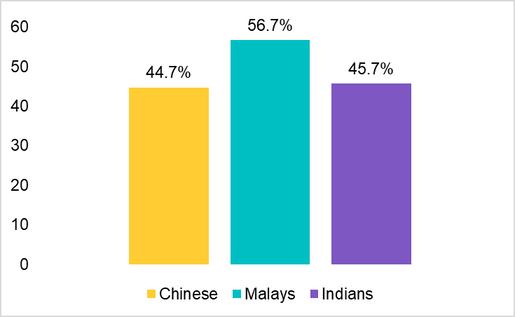
The prevalence of obesity in the Indian Resident population reached its highest point in 2021/2022 at 21.3%.
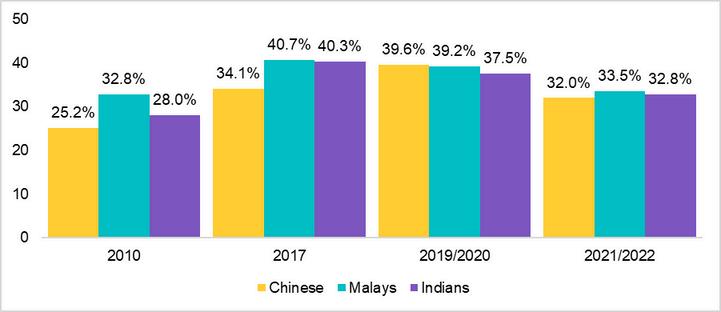
CRUDE PREVALENCE OF SUFFICIENT TOTAL PHYSICAL ACTIVITY IN TOTAL RESIDENT POPULATION BY ETHNICITY
Data only includes residents aged 18 to 74 years of age.
The crude prevalence of cases is the ratio of the number of prevalent cases in a specified population scaled to the size of the population.
The years in the tables are as reflected in the National Population Health Survey report. These numbers are self-reported.
2007 TO 2022
CRUDE PREVALENCE OF BINGE DRINKING IN TOTAL RESIDENT POPULATION BY ETHNICITY
2007 TO 2022
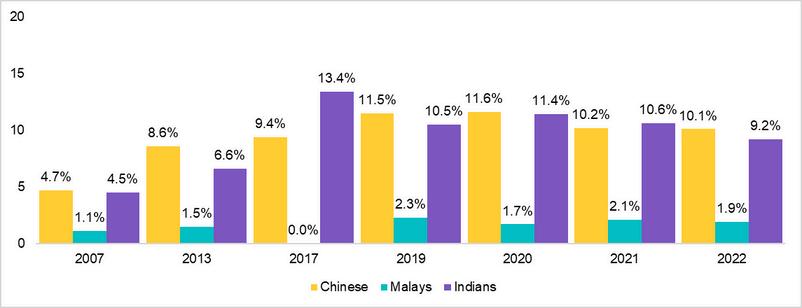
Data only includes residents aged 18 to 74 years of age.
The crude prevalence of cases is the ratio of the number of prevalent cases in a specified population scaled to the size of the population.
The years in the tables are as reflected in the National Population Health Survey report. These numbers are self-reported.
2014 TO 2022
The Indian Resident population was over-represented in deaths by suicides relative to the proportion of Indian Residents to the Total Resident population between 2014 to 2022.
2014 TO 2022
2018 TO 2022
2017 TO 2022
In 2022, the prevalence of poor mental health for the Indian Resident population was at 15.7% which was the lowest among the three ethnic groups.
From 2018 to 2022, the Indian Resident population had a lower median age of suicides than the Total Resident population. Data
CENTRAL NARCOTICS BUREAU. (2013-2022). ANNUAL STATISTICAL PRESS RELEASE. SINGAPORE.
DEPARTMENT OF STATISTICS. (2011). SINGAPORE CENSUS OF POPULATION 2010, STATISTICAL RELEASE 1, 2 & 3. SINGAPORE.
DEPARTMENT OF STATISTICS. (2021). SINGAPORE CENSUS OF POPULATION 2020, STATISTICAL RELEASE 1 & 2. SINGAPORE.
DEPARTMENT OF STATISTICS. (2022). STATISTICS ON MARRIAGE AND DIVORCES 2022. SINGAPORE.
IMMIGRATION & CHECKPOINTS AUTHORITY. (2014-2022) REPORT ON REGISTER OF BIRTHS AND DEATHS. SINGAPORE.
MINISTRY OF EDUCATION. (2022). EDUCATION STATISTICS DIGEST 2022. SINGAPORE.
MINISTRY OF HEALTH. (2019-2022). NATIONAL POPULATION HEALTH SURVEY. SINGAPORE.
SINGAPORE PRISON SERVICE. (2014-2016). ANNUAL STATISTICAL PRESS RELEASE. SINGAPORE.
SINGAPORE PRISON SERVICE. (2017-2022). ANNUAL REPORT. SINGAPORE.