PROPERTY
DETAILS

Property Information
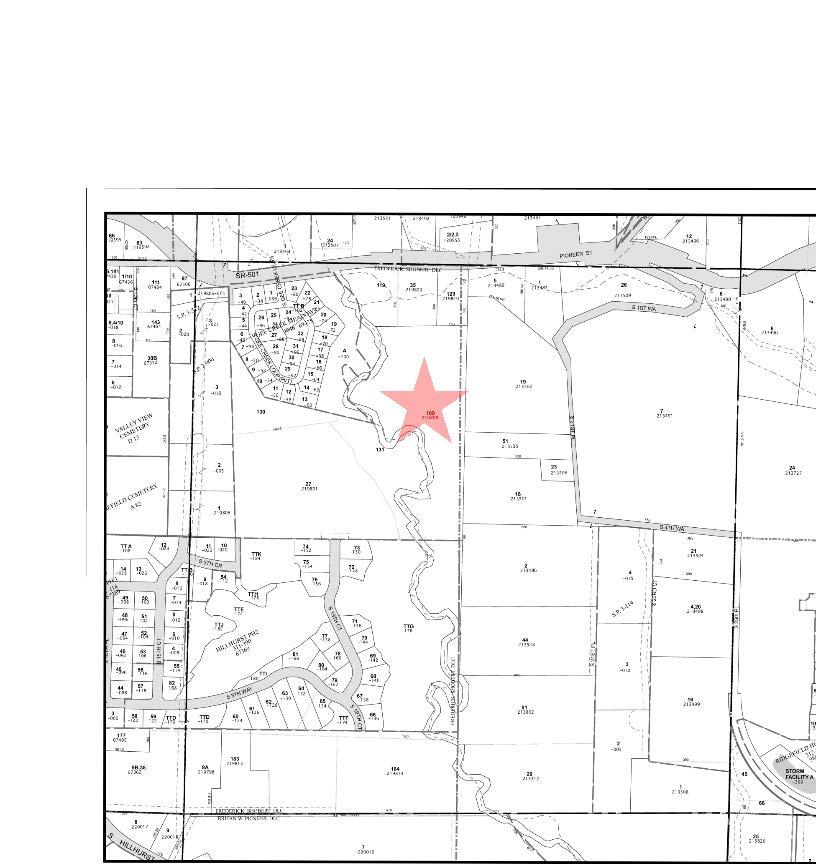
Assessors Tax Map
Vesting Deed
Exhibit A
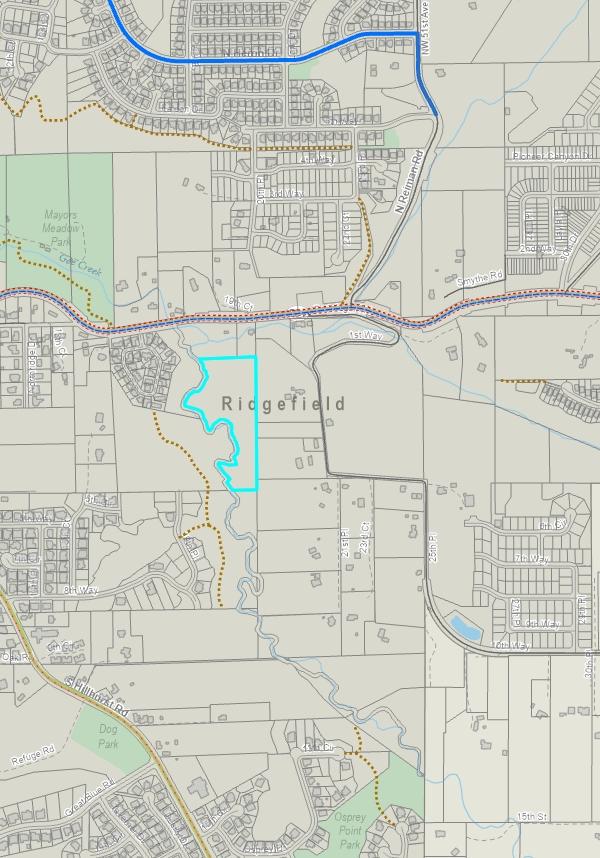
County GIS Details
The information contained is provided by WFG’s Customer Service Department to our customers, and while deemed reliable, is not guaranteed.

ClarkCountyPropertyProfileInformation
Parcel#:219808000
RefParcel#:
Owner:Phuong,StephanieH
CoOwner:Huynh,NghiaV
Site:WA98642
Mail:2329IrvineAve
NewportBeachCA92660-3410
Zoning:RLD-4ResidentialLowDensity-4(Rld4)
SchoolDist:122Ridgefield
Census:3008040303
LandUse:91UndevelopedLand
Legal:#109FREDERICKSHOBERTDLC5A
MarketTotal:$311,770.00
MarketLand:$311,770.00
MarketImpr:
AssessedTotal:$311,770.00
Exemption:
Taxes:$2,735.48
LevyCode:122000
LevyRate:8.6697
SALE&LOANINFORMATION
SaleDate:04/05/2002
SaleAmount:
Document#:3447910
DeedType:Deed
LoanAmount:
Lender:
LoanType:
InterestType:
TitleCo:
ParcelType:RESIDENTIALACREAGE
YearBuilt:
Bedrooms:
Bathrooms:
BuildingTotal:
1stFloor: 2ndFloor:
AC:
BsmtFin/Unfin:/ LotSize:5.00Acres(217,800SqFt)
LotWidth/Depth:569/569
Garage:
HeatSource:
Fireplace:
ImprType:
Plat/Subdiv:
Map:416-B7
Waterfront:
Watershed:SalmonCreek-FrontalColumbiaRiver
Recreation:
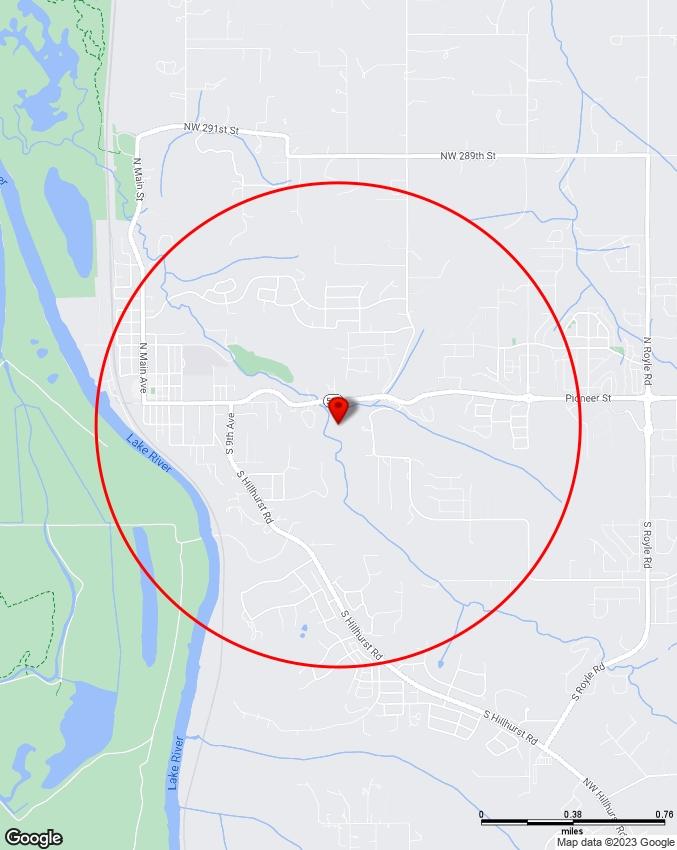
Latitude:45.813548
Longitude:-122.729218
TAXINFORMATION
ASSESSMENT&
PROPERTYCHARACTERISTICS
completenessofinformationcontainedinthisreport.
SentryDynamics,Inc.anditscustomersmakenorepresentations,warrantiesorconditions,expressorimplied,astotheaccuracyor
ParcelID:219808000
SiteAddress:
SentryDynamics,Inc.anditscustomersmakenorepresentations, warrantiesorconditions,expressorimplied,astotheaccuracyor completenessofinformationcontainedinthisreport.
AssessorMap
ParcelID:219808000
SentryDynamics,Inc.anditscustomersmakenorepresentations, warrantiesorconditions,expressorimplied,astotheaccuracyor completenessofinformationcontainedinthisreport.
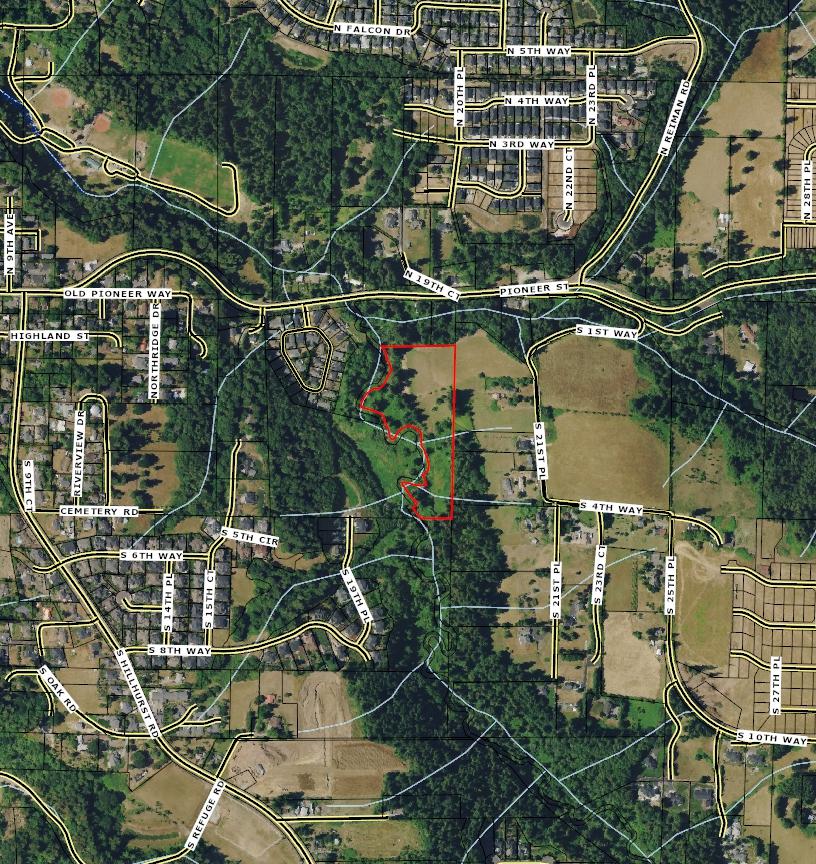
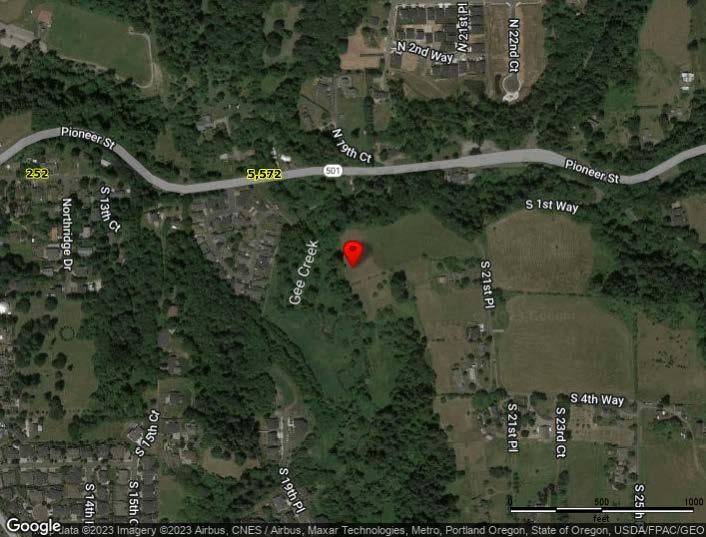
AerialMap
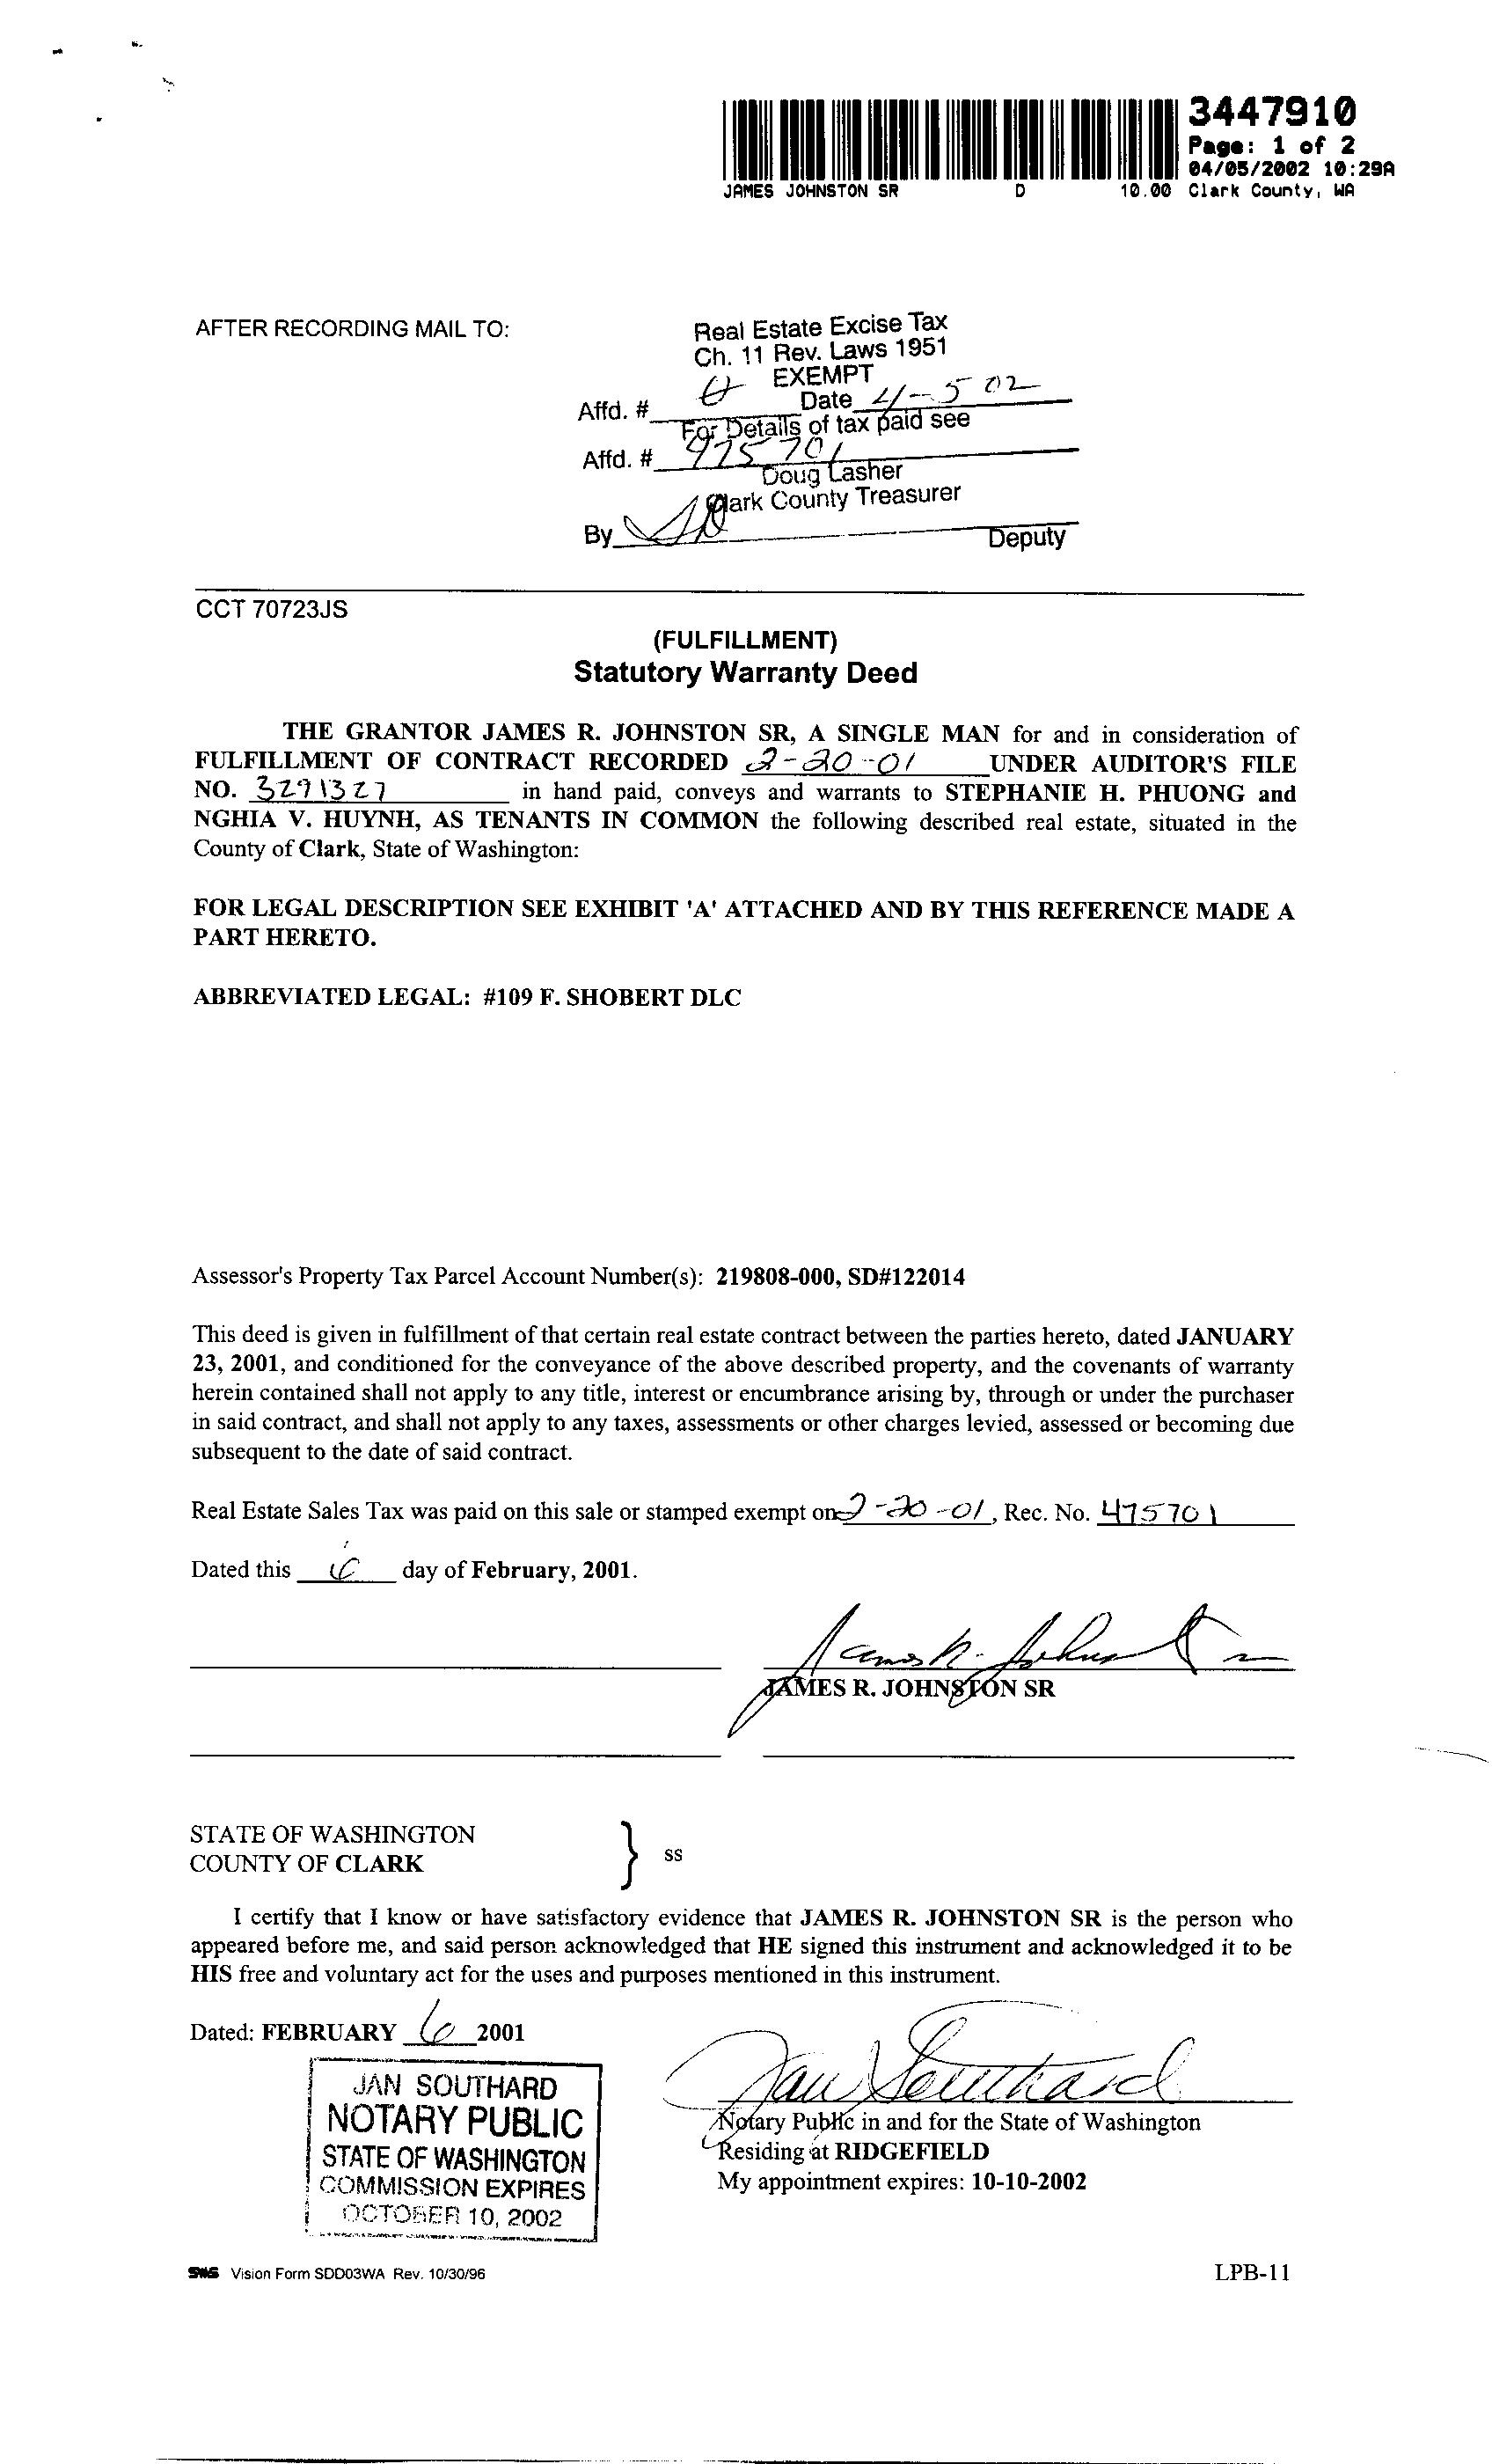
“A”
The real property described above is commonly known as: Clark County Parcel: 219808000
[__________] [__________] ___________ [__________] [__________]
Seller
. Exhibit
Buyer Initials Date
Initials Date
PROPERTY INFORMATION CENTER
Account Summary
Property Identification Number: 219808000 MapsOnline Fact Sheet
Property Type: Real
Property Status: Active
Site Address: (Situs Addresses)
Abbreviated Description: #109 FREDERICK SHOBERT DLC 5A
Tax Status: Regular
Info for Senior/Disabled Property Tax Exemption
Property Owner
PHUONG STEPHANIE H & HUYNH NGHIA V
Park
Owner Mailing Address 2329 IRVINE AVE NEWPORT BEACH CA , 92660 US Property Site Address Google Maps Street View Administrative Data Info... Jurisdiction Ridgefield Land Use Planning Comprehensive Plan Designation UL Comprehensive Plan Overlay(s) none Urban Growth Area Ridgefield Zoning DesignationCodes Residential Low Density - 4 (RLD-4) Zoning Overlay(s) none Miscellaneous Census Tract 403.03 Drainage District n/a Neighborhood Ridgefield Junction
District n/a
Safety Burning Allowed No EMS Response Area AMR Fire District Clark-Cowlitz Fire Rescue Increased Wildfire Danger Area No Police Jurisdiction Ridgefield Police Dept Schools School District Name Ridgefield Elementary School Attendance Area Union Ridge Electoral Data Board of County Councilors District 5 Camas Council Ward n/a CPU Commissioner District 1 Election Precinct 506 Legislative District 20 Library District Fort Vancouver Regional Library Port District Ridgefield Port District 2 School District Board Director District Director District 2 Sewer Board District Ridgefield State Weed Board District 1 Land Data Approximate Area Info... 217,800 sq. ft. 5 acres Clark County Road Atlas Page 34 DOR Land Use Code Info... 91 Section-Township-Range SE 1/4,S19,T4N,R1E PDF Subdivision GEE CREEK MEADOWS A CONDOMINIUM Survey 017154 067071 Sales History Date of Sale 01/23/2001 Document Type D-FF Document Number 3447910 Excise Number 475701 Assessment Data Info... 2023 Values for 2024 Taxes Market Value as of January 1, 2023 Land Value $435,192.00 Building Value $0.00 Total Property $435,192.00 Taxable Value Info... Total $435,192.00 2022 Values for 2023 Taxes Market Value as of January 1, 2022 Land Value $311,770.00 Building Value $0.00 Total Property $311,770.00 Taxable Value Info... Total $311,770.00 General Assessor Neighborhood 45 Re-valuation Cycle 3 Notice of Value 2023 2022 2021 2020 2019 2018 2017 Property assessment value is valid as of the date printed on the linked notice of value. The notice of value will not reflect any updates to property value that occurred after the notice mail date. Please contact the Assessor's office
Public
Middle School
Attendance Area View Ridge
High School
Attendance Area Ridgefield
Transportation
C-TRAN Public
Transportation
Benefit Area Yes
Traffic Impact
Fee (TIF)
District Ridgefield
Transportation
Analysis Zone 467
Utilities
CPU Lighting
Utility District n/a
Last Street
Sweeping n/a
Sewer District Clark Regional
Waste Collection
Provider n/a
Waste Collection
Day No Data
Water District Ridgefield
The water service provider may be different from the indicated water district. Please contact the parcel's jurisdiction if you need to know the water service provider.
Sale
Date
Document
Document
Document
Document
if you have a question about your assessed value.
If you have questions concerning the data on this page, please contact the Clark County Assessor’s Office. Main Phone: (564) 397-2391, Email: assessor@clark.wa.gov
Amount $0.00
of Sale 01/23/2001
Type CONT
Number
Number 475701 Sale Amount $60,000.00 Date of Sale 05/05/1999
Excise
Type D-QCD
Number
Number 447124 Sale Amount $0.00
Excise
PROPERTY INFORMATION CENTER
Land
Property Identification Number: 219808000 MapsOnline Fact Sheet
Property Type: Real
Property Status: Active
Site Address: (Situs Addresses)
Abbreviated Description: #109 FREDERICK SHOBERT DLC 5A
Tax Status: Regular
Photos & Imagery
Property Photo
Building 1
Information
No photo available
Building Sketch
No Image Available.
Scanned Building Card
Disclaimer: Clark County does not warrant the accuracy, reliability or timeliness of any information in this system, and shall not be held liable for losses caused by using this information. Portions of this information may not be current or accurate. Any person or entity who relies on any information obtained from this system, does so at their own risk. RCW 42.56.070(8) prohibits releasing and/or using lists of individuals gathered from this site for commercial purposes. [Full Disclaimer]
& Building Details
Summary
No Image Available. Building Style Details 1 0 sq. ft. Effective Year Built 0 Actual Year Built 0 Building Type no data Construction Quality no data Condition no data
If you have questions concerning the data on this page, please contact the Clark County Assessor’s Office. Main Phone: (564) 397-2391, Email: assessor@clark.wa.gov
PROPERTY INFORMATION CENTER
Environmental Constraints
Property Identification Number: 219808000 MapsOnline Fact Sheet
Property Type: Real
Property Status: Active
Site Address: (Situs Addresses)
Abbreviated Description: #109 FREDERICK SHOBERT DLC 5A
Tax Status: Regular
Cultural Resources
Archaeological Probability: Moderate-High High
Archaeological Site Buffer: Yes
Historic Site: No Mapping Indicators
Development Moratorium Info...
none
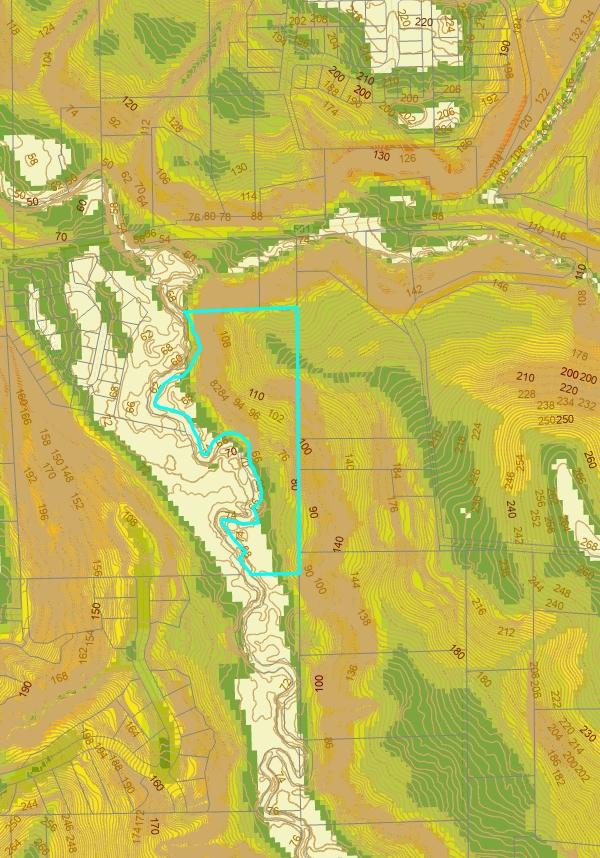
Geological Hazards Info...
Geological Hazard: Slopes > 15%
Liquefaction: Low to Moderate Very Low
NEHRP Class: C
Slope Stability: Severe Erosion Hazard Area
Habitat and Species Resources
Info...
Habitat and Species Impacts: Yes
Habitat Area: Biodiversity
Areas And Corridor
Adjacent to Habitat Area: Biodiversity
Areas And Corridor
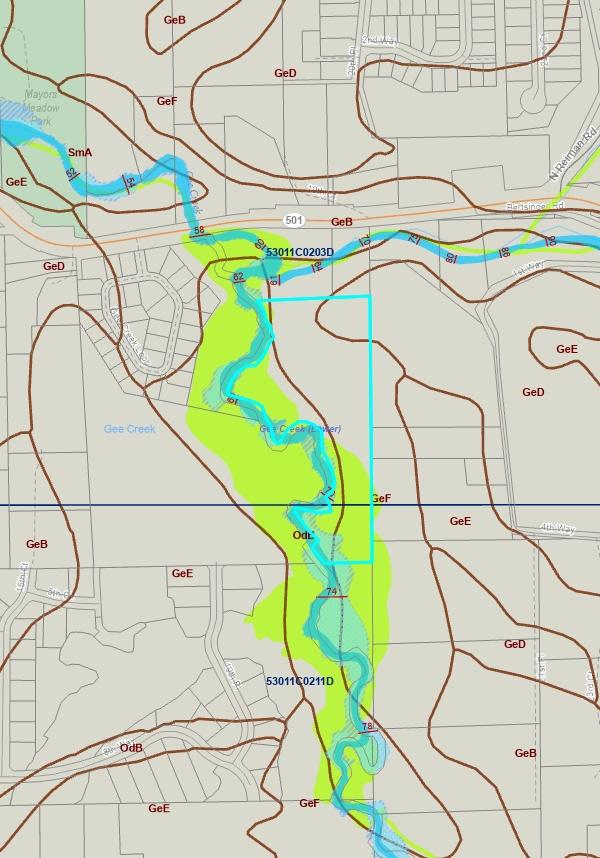
Riparian Habitat Area: Fish Habitat Stream
Floodway
Floodway fringe Shoreline
Wetlands and Soil Types
Critical Aquifer
Recharge Area: Category 2 Recharge Areas
FEMA Map / FIRM
Panel: Info
53011C0203D
53011C0211D
53015C1005G
53015C1015G
FEMA Flood Map Service Center
Flood Hazard Area: Info Floodway Fringe Floodway
500 Year Flood Area
Shoreline
Designation: none
Soil Types / Class: Non-Hydric / GeD Non-Hydric / GeF Hydric / OdB
Water Resource
Inventory Area: Name: LEWIS Sub-Basin: East Fork Lewis
Watershed: Gee Creek
Sub Watershed: Gee Creek (Lower)
Wetland Class: No Mapping Indicators
Wetland Inventory: Info... Potential Presence
Septic
Document
Details
none
Water Well
Details
none
If you have any questions concerning the data on this page, please contact the land use department in your jurisdiction. For properties not within a city limits, contact Clark County Community Development. Main Phone: (564) 397-2375, Email: commdev@clark.wa.gov
Disclaimer: Clark County does not warrant the accuracy, reliability or timeliness of any information in this system, and shall not be held liable for losses caused by using this information. Portions of this information may not be current or accurate. Any person or entity who relies on any information obtained from this system, does so at their own risk. RCW 42.56.070(8) prohibits releasing and/or using lists of individuals gathered from this site for commercial purposes. [Full Disclaimer]
PROPERTY INFORMATION CENTER
Tax Summary
Property Identification Number: 219808000 MapsOnline Fact Sheet
Property Type: Real
Property Status: Active
Site Address: (Situs Addresses)
Abbreviated Description: #109 FREDERICK SHOBERT DLC 5A
Tax Status: Regular
Property Owner
PHUONG STEPHANIE H & HUYNH NGHIA V
2024 Tax Information
Property Location Address
Google Maps Street View
Bing Maps Birds Eye
Pay Online Payment service fees: Free E-Check, 2.39% Credit Card, $3.95 Debit Card Tax
and
02/08/2024
Other Payment Options
Statements
If you have any questions concerning the data on this page, please contact Clark County Treasurer's Office. Main Phone: (564) 397-2252, Email: treasoff@clark.wa.gov
2329 IRVINE AVE
Owner Mailing Address
NEWPORT BEACH CA, 92660
Code Area:
Millage Rate:
Tax
Bill Summary Taxable Value $435,192.00 Tax Amount $3,644.63 Tax Paid $0.00 1st Half Billed - Does not reflect payments Amount Billed $1,822.36 Payment Due Date Apr. 30, 2024 2nd Half Billed - Does not reflect payments Amount Billed $1,822.27 Payment Due Date Oct. 31, 2024 Tax Years Owing *Interest & Penalty calculates on delinquent taxes Tax Year Statement ID Amount Billed Calc Date* Interest Penalty Total Due 2024 139409 $3,644.63 $0.00 $0.00 $3,644.63 Tax History Tax Year Statement ID Billed Paid Interest Paid Penalty Paid 2024 139409 $3,644.63 $0.00 $0.00 $0.00 2023 139492 $2,735.48 $2,735.48 $27.34 $0.00 2022 139622 $2,267.54 $2,267.54 $45.18 $0.72 2021 139785 $2,243.64 $2,243.64 $0.00 $0.00 2020 139954 $2,093.48 $2,093.48 $0.00 $0.00 2019 140171 $1,965.23 $1,965.23 $19.63 $0.00 2018 140332 $2,052.37 $2,052.37 $0.00 $0.00 2017 140471 $1,638.53 $1,638.53 $16.36 $0.00 2016 140571 $1,518.40 $1,518.40 $0.00 $0.00 2015 140918 $1,420.21 $1,420.21 $0.00 $0.00 2014 141058 $1,321.95 $1,321.95 $0.00 $0.00 2013 141166 $1,308.90 $1,308.90 $0.00 $0.00 2012 141300 $1,087.32 $1,087.32 $0.00 $0.00 2011 141415 $1,308.36 $1,308.36 $0.00 $0.00 2010 141526 $1,343.18 $1,343.18 $0.00 $0.00
141746 $1,389.82 $1,389.82 $0.00 $0.00
463782 $1,347.05 $1,347.05 $0.00 $0.00
301243 $1,018.24 $1,018.24 $0.00 $0.00
142530 $871.71 $871.71 $0.00 $0.00
122000
8.2944808719
Assessment Distribution Tax
Tax
2009
2008
2007
2006
Disclaimer: Clark County does not warrant the accuracy, reliability or timeliness of any information in this system, and shall not be held liable for losses caused by using this information. Portions of this information may not be current or accurate. Any person or entity who relies on any information obtained from this system, does so at their own risk. RCW 42.56.070(8) prohibits releasing and/or using lists of individuals gathered from this site for commercial purposes. [Full Disclaimer]
CUSTOM
MAPS
Aerial
Transportation
Environmental Public Health
Slopes & Geologic Hazards
Soils, Wetlands & Natural Resources
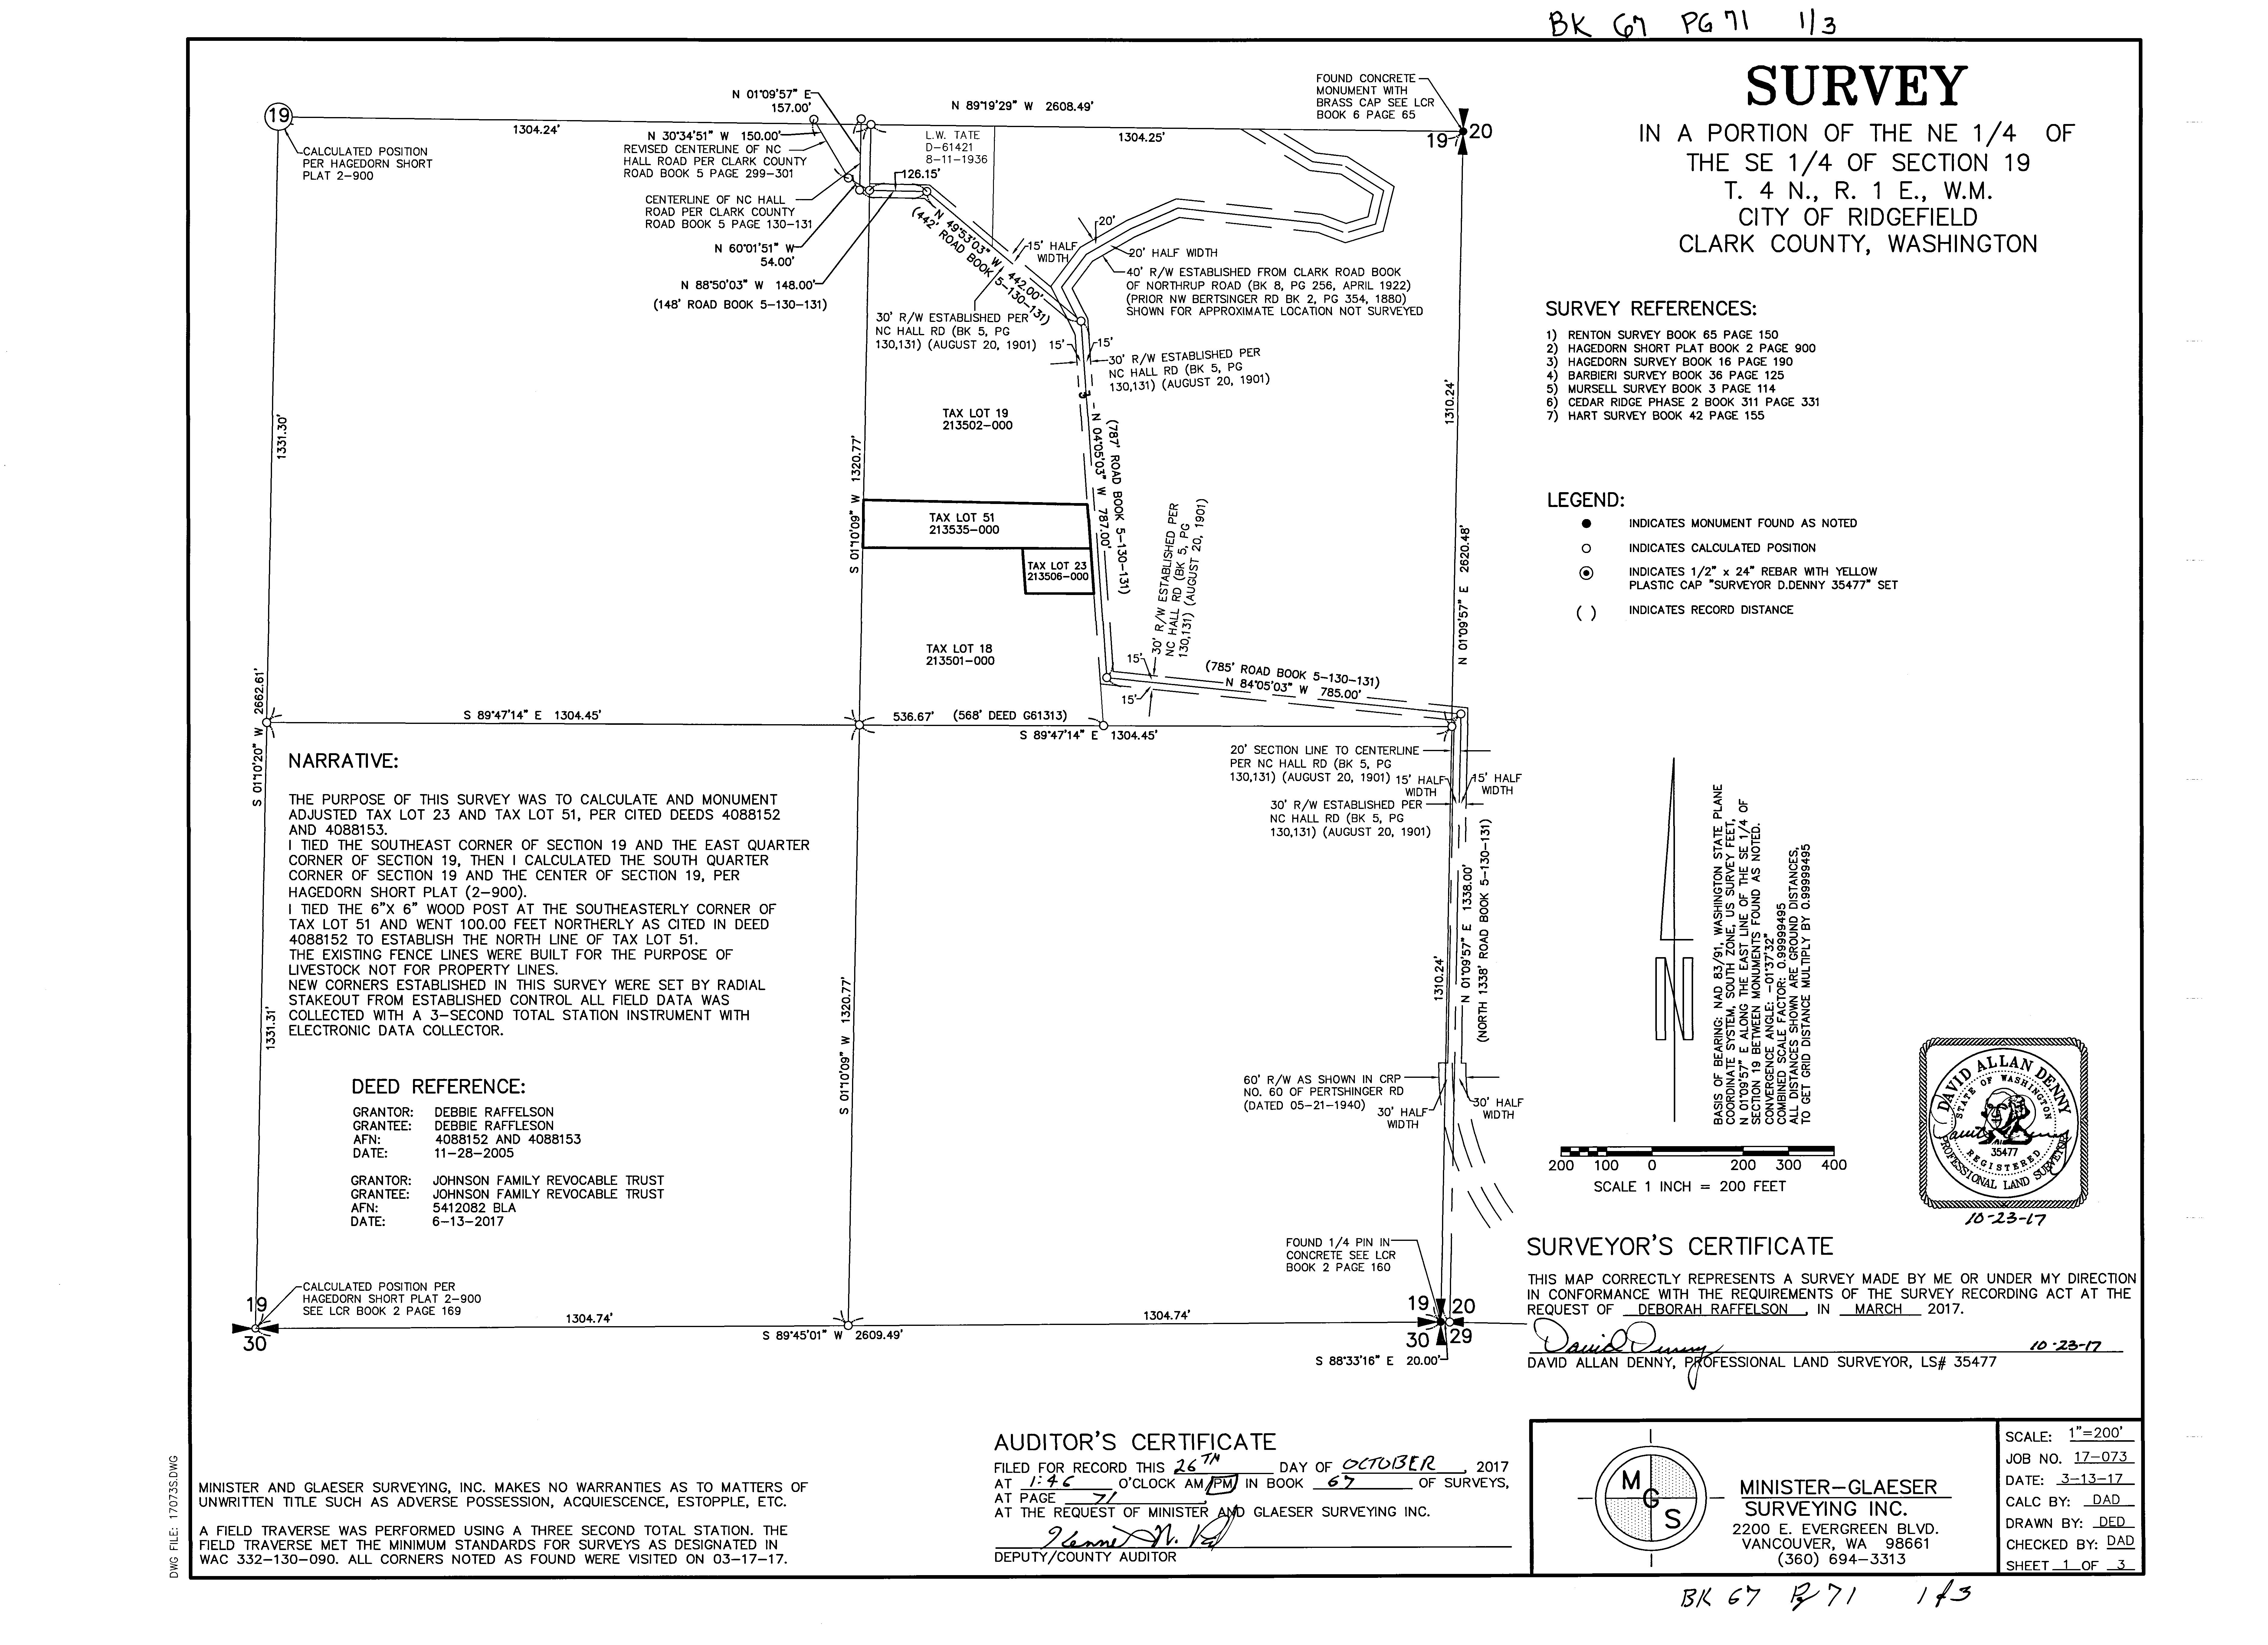
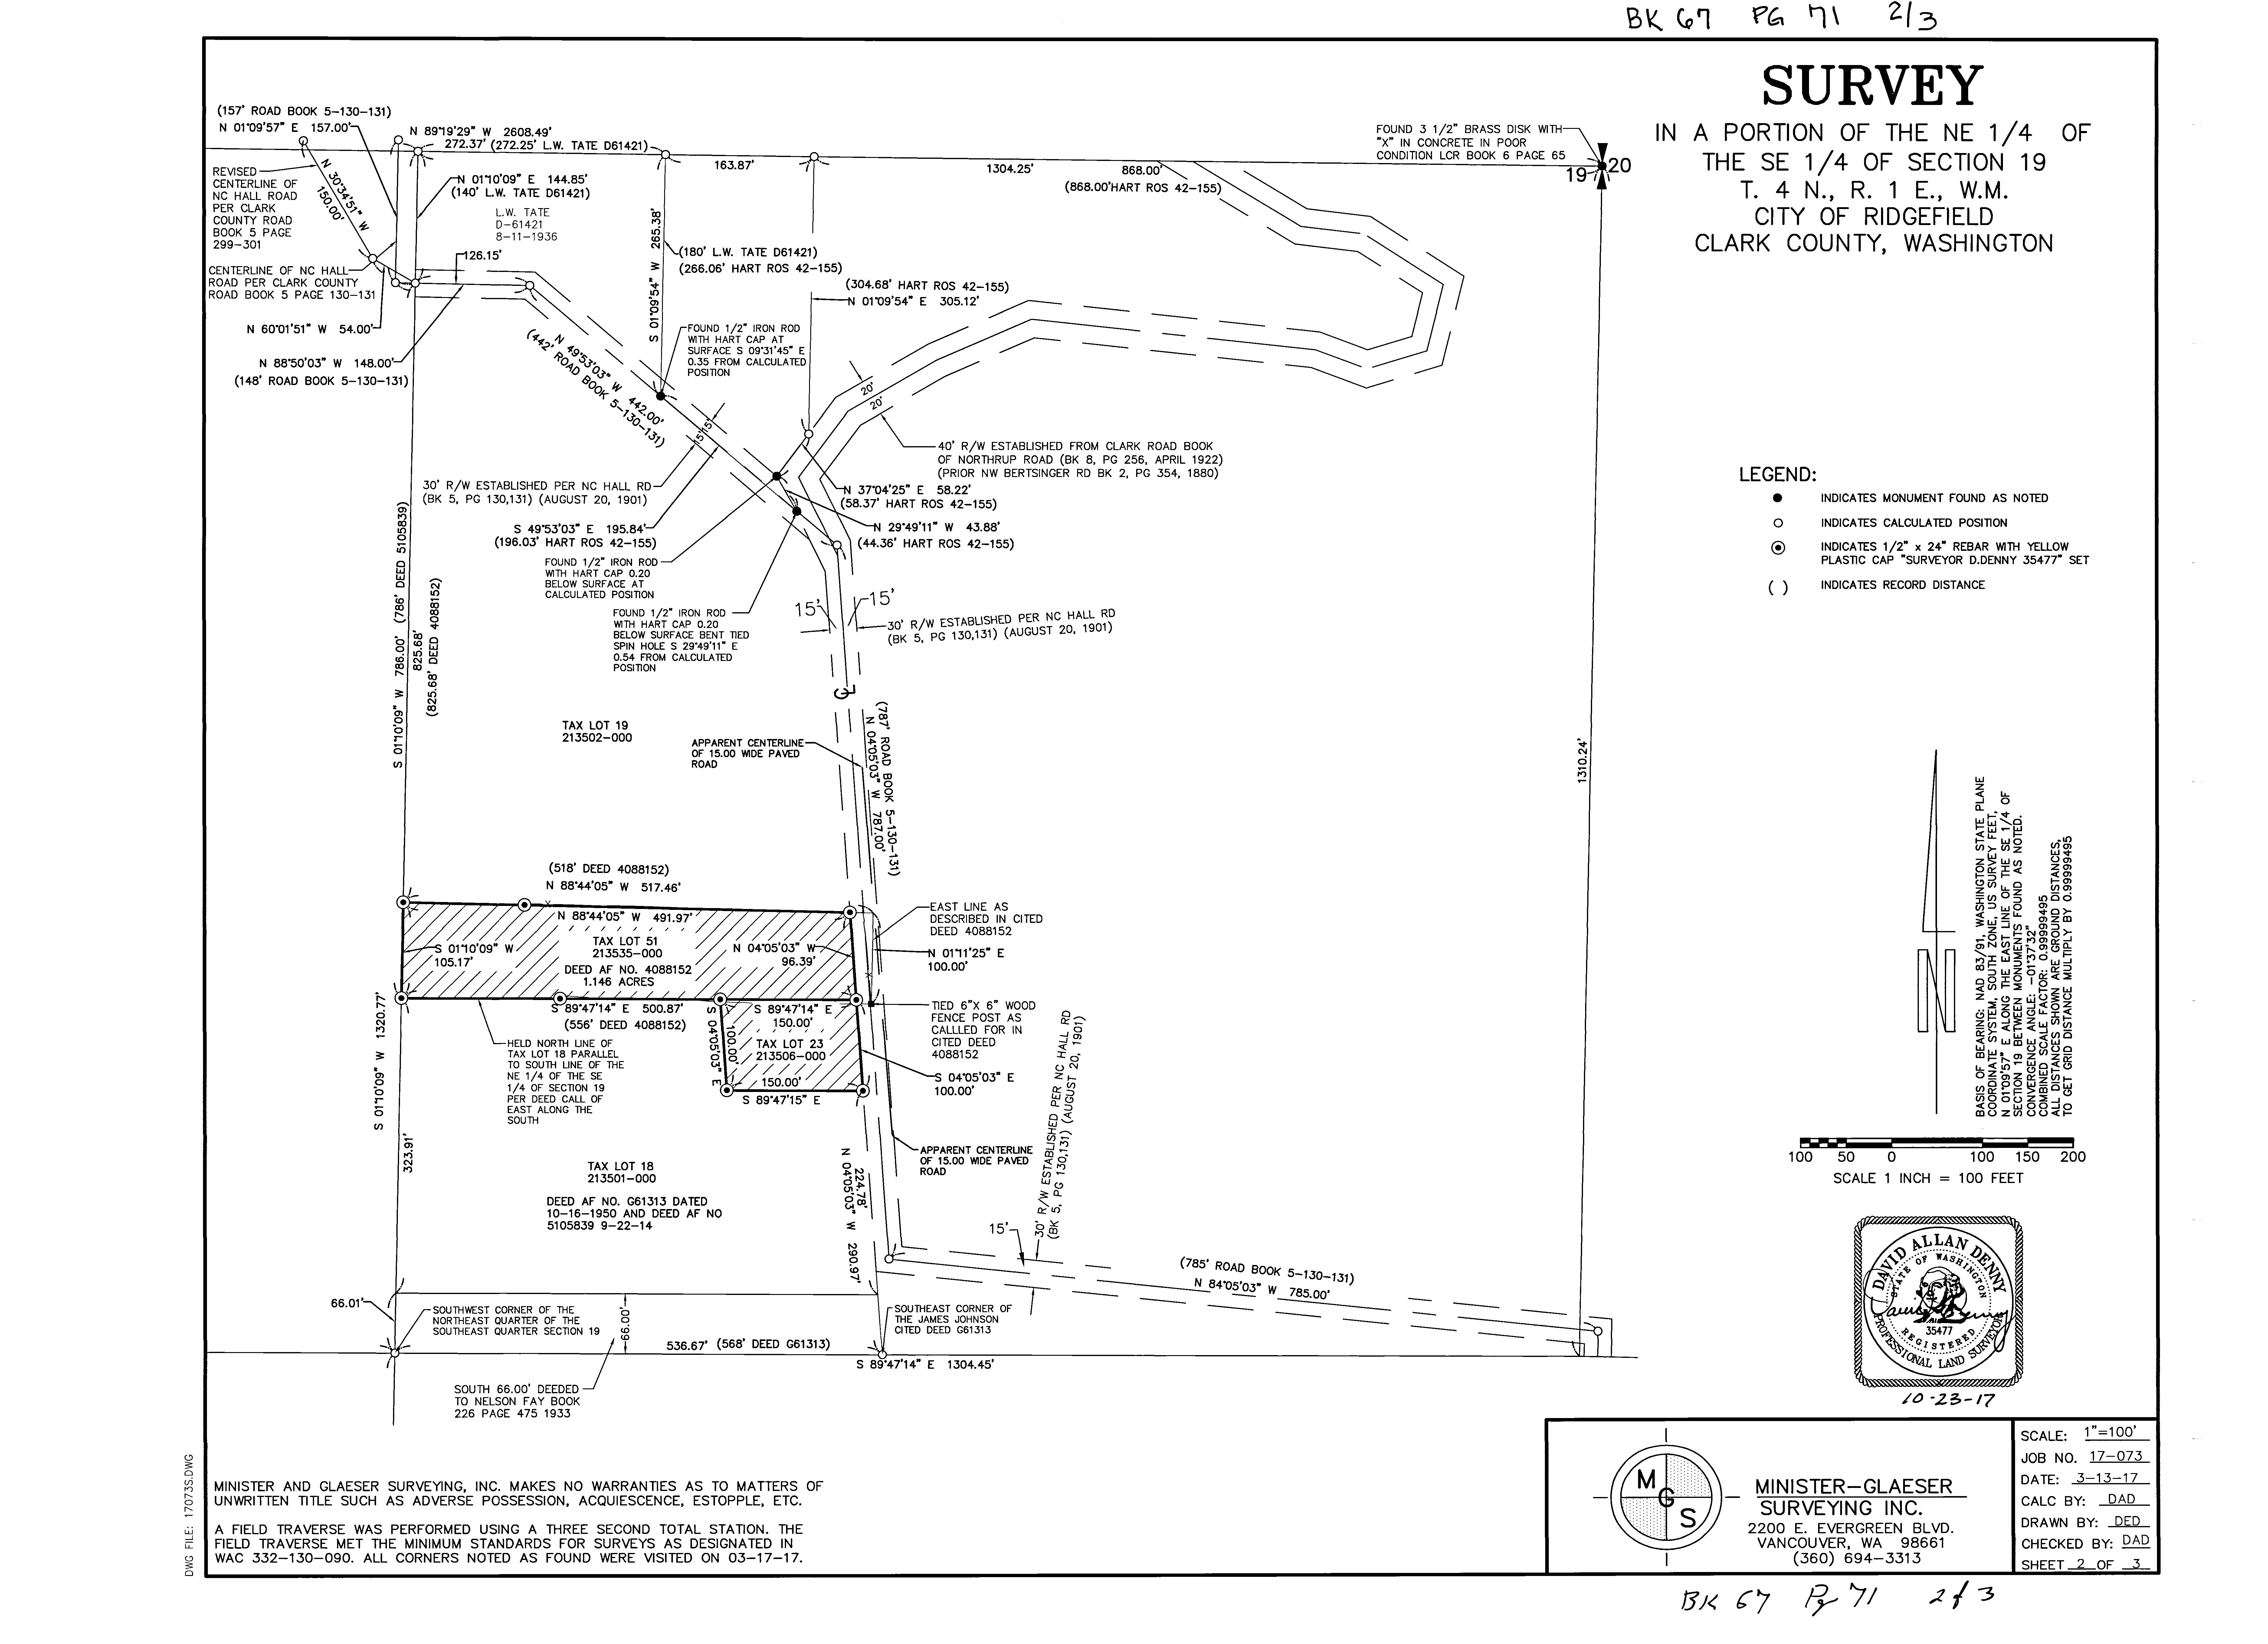
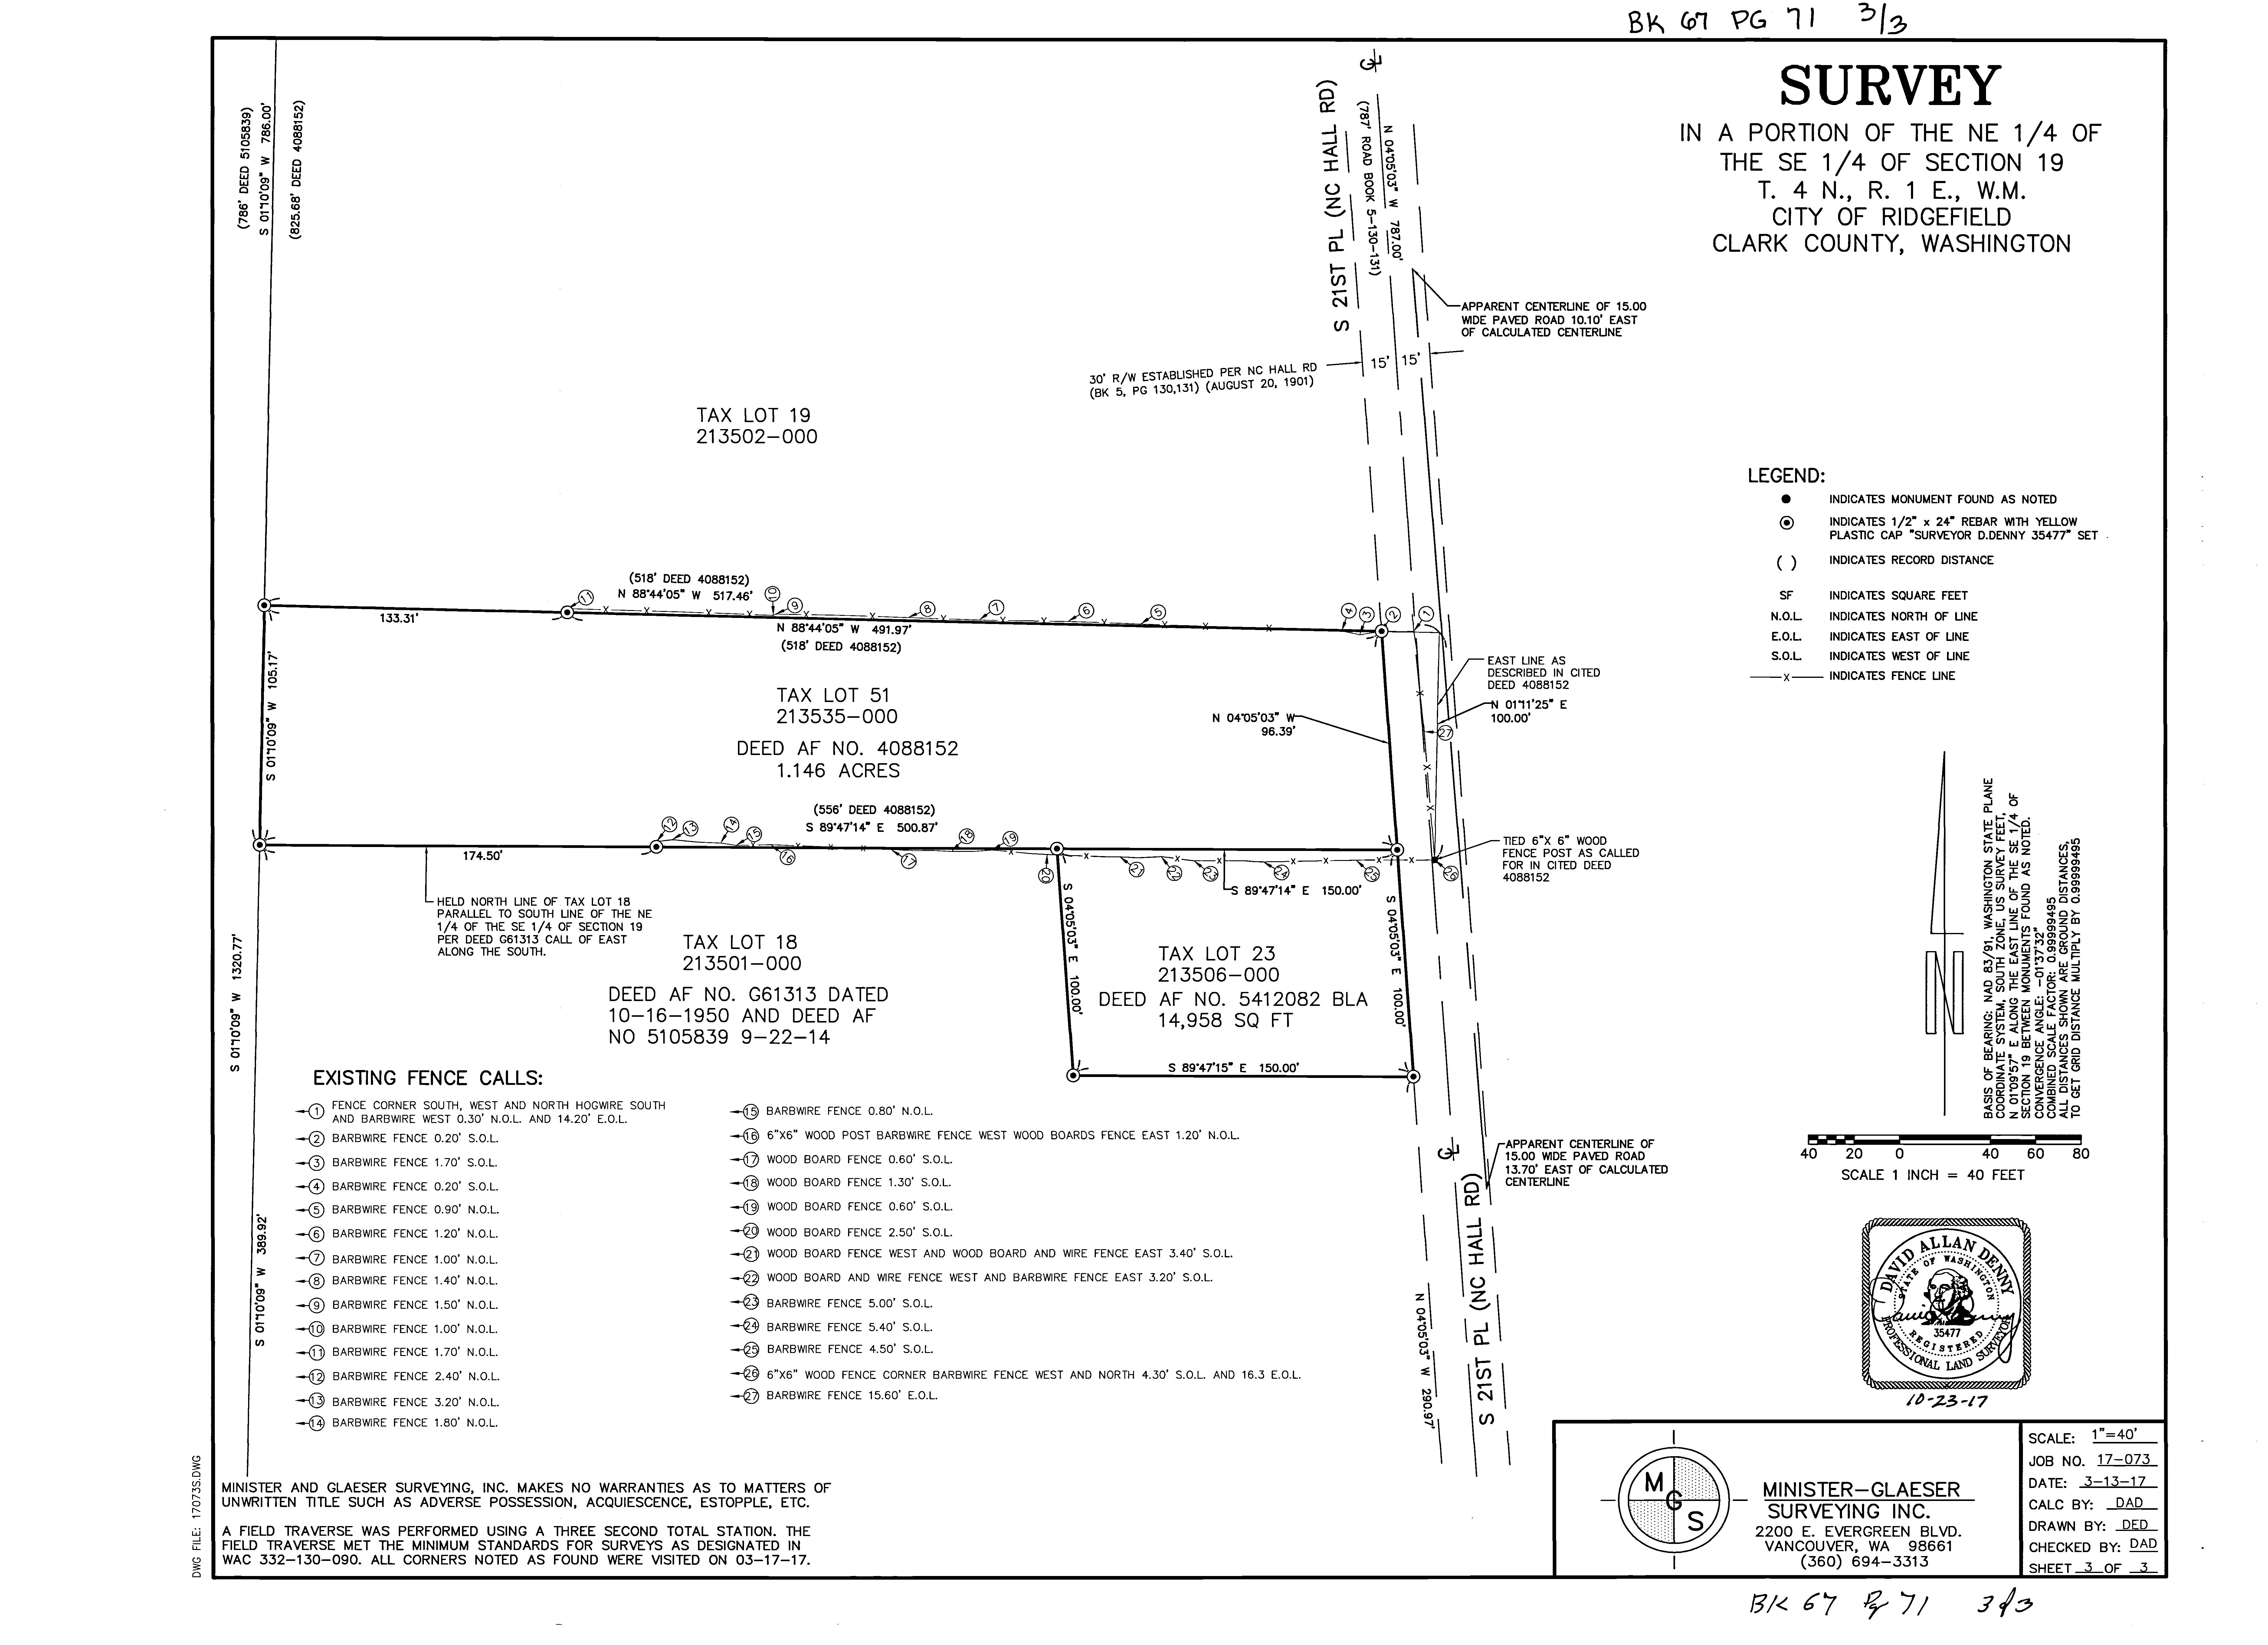
Surveys
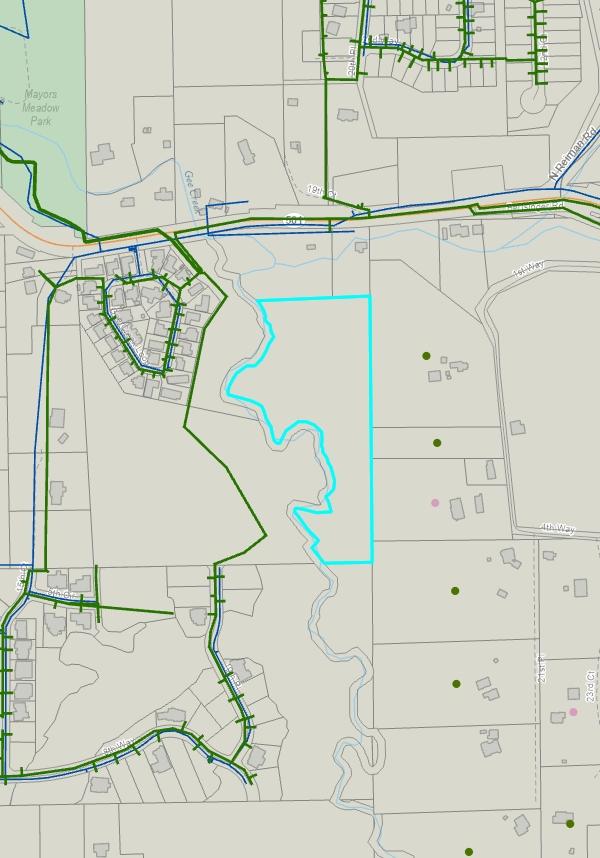
Utilities (Water & Sewer lines)
The information contained is provided by WFG’s Customer Service Department to our customers, and while deemed reliable, is not guaranteed.

Aerial
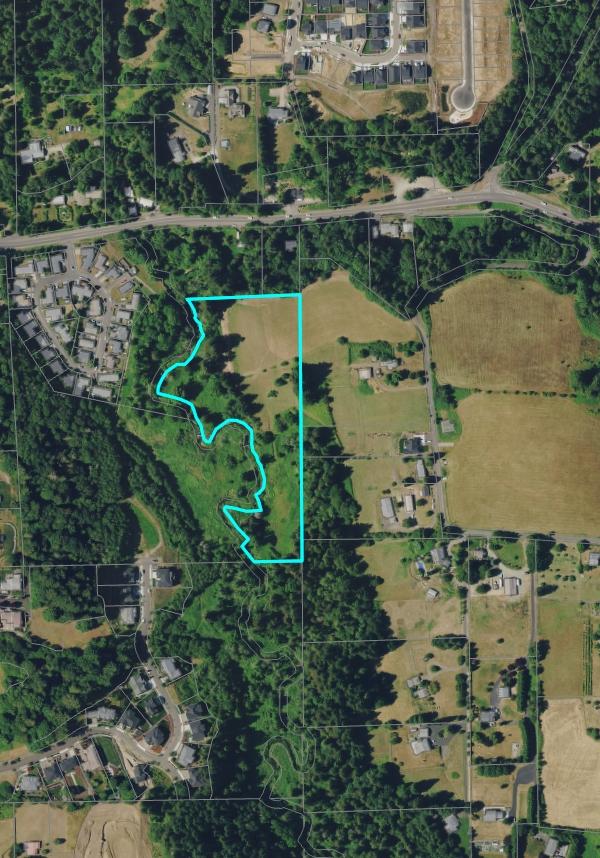
Legend Notes:
Building Footprints
Taxlots

This map was generated by Clark County's "MapsOnline" website. Clark County does not warrant the accuracy, reliability or timeliness of any information on this map, and shall not be held liable for losses caused by using this information. Taxlot (i.e., parcel) boundaries cannot be used to determine the location of property lines on the ground.
Clark County, WA. GIS - http://gis.clark.wa.gov
752.3
WGS_1984_Web_Mercator_Auxiliary_Sphere
Feet 752.3
0 376.17
4,5141:
Zoning

Legend Notes:
Comprehensive Plan Overlay
Urban Reserve
Urban Holding
Railroad Industrial Urban Reserve
Freight Rail Dependent Use
Surface Mining
Columbia River Gorge Scenic Area
Rural Center Mixed Use
Comprehensive Plan - Outline
Comprehensive Plan
Urban Low Density Residential
Urban Medium Density Residential
Urban High Density Residential
Mixed Use
Junction Plan Commercial Industrial
Heavy Industrial
Public Facility
Bonneville Power Administration
Mixed use - Residential
Mixed use - Employment
Downtown
Neighborhood Commercial
Community Commercial
General Commercial
Regional Center Employment
Employment Campus
Light Industrial
Single-Family_Low
Single-Family_Medium
Single-Family_High
Multi-Family_Low
Multi-Family_High
Light industrial/Business park
Office Park/Business Park
Park
Open space/Green space
Town Center
City Center
Clark
Westside Employment
Rural-5
Rural-10
Rural-20
Rural Center Residential
This map was generated by Clark County's "MapsOnline" website. Clark County does not warrant the accuracy, reliability or timeliness of any information on this map, and shall not be held liable for losses caused by using this information. Taxlot (i.e., parcel) boundaries cannot be used to determine the location of property lines on the ground.
Rural Commercial
Rural Industrial
County,
http://gis.clark.wa.gov 752.3
Feet 752.3 0 376.17
WA. GIS -
WGS_1984_Web_Mercator_Auxiliary_Sphere
4,5141:
Footnotes:
--- (3) ---
Editor's note— Ord. No. 1132, § 2(Exh. A), adopted July 11, 2013, amended Ch. 18.210 in its entirety to read as herein set out. Former Ch. 18.210, §§ 18.210.010—18.210.150, pertained to similar subject matter, and derived from Ord. No. 1108, § 2, 7-26-2012; Ord. No. 1072, § 2(Exh. A), 1-13-2011; Ord. No. 881, § 2(Exh. A), 2005; Ord. No 862, § 1, 2004; Ord. No. 802, § 3(part), 2002; Ord. No. 774, §§ 3, 4, 1999; Ord. No. 692, § 1, 1996; Ord. No. 676, § 1(part), 1995.
18.210.010 - Purpose.
The RLD districts are intended to implement the provisions of the RUACP. In addition, these districts are intended to:
Recognize and maintain established low density residential areas, while encouraging appropriate infill and redevelopment;
Establish higher densities close to employment centers and transit corridors;
Create energy-efficient residential areas which provide community services in a more economical manner, and facilitate energy-efficient design;
Provide for additional related uses such as schools, parks and utility uses necessary to serve immediate residential areas;
Encourage traditional pedestrian-oriented neighborhoods, similar in basic design to existing neighborhoods.
(Ord. No. 1132, § 2(Exh. A), 7-11-2013)
18.210.015 - Applicability.
The city shall follow the RUACP comprehensive plan map to designate low density residential zones. The RLD-4, RLD-6, RLD-8 zoning districts shall implement the residential/urban low (UL) comprehensive plan designation.
The city shall place an urban holding (UH) overlay on all lands which are not adequately served by necessary capital facilities. The UH overlay shall limit residential densities to one unit per lot, or one unit per ten acres, whichever is greater, until urban services, consistent with the adopted capital facility plan and RUACP, are available to the UH site or until all financing necessary to construct or bond for the necessary urban services is secured.
(Ord. No. 1132, § 2(Exh. A), 7-11-2013; Ord. No. 1290, § 2(Exh. A), 4-25-2019)
18.210.020 - Uses.
A. B. C.
Chapter 18.210 - RESIDENTIAL LOW DENSITY DISTRICTS (RLD-4,
D. E. A. B.
RLD-6, RLD-8)
All uses shall comply with the provisions of RDC 18.205
Home occupation uses shall comply with the provisions of RDC 18.205.030.
Uses Approved Through the PUD Process.
Additional commercial uses are allowed in the RLD zone that are permitted, limited, or conditional uses in the CNB district through the PUD process provided they directly support a residential development of at least one hundred units.
The maximum ratio of developed commercial acreage to developed residential acreage shall be 1:20; that is, no more than one acre of commercial land may be approved for each twenty acres of developed residential land, exclusive of open space.
The maximum commercial acreage for uses otherwise prohibited in the RLD zone which may be approved through the PUD process, without a plan amendment, is three acres.
All commercial uses otherwise prohibited in this zone will be reviewed as conditional uses as part of the PUD process, and must satisfy the requirements of Chapter 18.340, Conditional Uses.
(Ord. No. 1132, § 2(Exh. A), 7-11-2013)
18.210.030 - Dimensional and density standards.
1. 2. 3. A. B. 1.
Dimensions shall be consistent with Table 18.210.030-1. Adjustments for townhouse developments are in RDC 18.206.060
The maximum lot area does not apply to existing lots, the remaining parent parcel after a land division, and lots created for non-residential uses such as parks and trails, utilities, and critical areas.
C.
For a two-lot short plat with one existing residence, a one-time exemption may be allowed wherein neither the existing lot with the residence nor the remainder lot must meet the maximum lot area permitted in the underlying zone. Any further partitioning of the parent parcel or the oversized lot must comply with the lot size requirements of the underlying zone. Development in the RLD-4 zone may be rounded to a minimum of three and one-half dwelling units per net developable acre and a maximum of four and one-half dwelling units per net developable acre.
See RDC 18.210.060 for special setback and design requirements along major corridors.
Minimum side yard setbacks shall not be reduced through the adjustment or variance process.
Table 18.210.030-1
RLD dimensional and density standards.
A.
B. C.
D. E.
[see subsection (F) of this section for
Standard RLD-4 RLD-6 RLD-8 Min. Lot Width 50 ft 50 ft 50 ft Min. Lot Area 10,890 sq ft 7,200 sq ft 5,000 sq ft Max. Lot Area 16,355 sq ft 10,800 sq ft 7,500 sq ft Min. Density: Dwelling Units/Net Developable Acre 4 du/ac 4 du/ac 6 du/ac Max. Density: Dwelling Units/Net Developable Acre
density
options] 4 du/ac 6 du/ac 8 du/ac Min. Front Yard Setback 15 ft 15 ft 10 ft Min. Rear Yard Setback 10 ft 10 ft 5 ft Min. Side Yard Setback 5 ft 5 ft 5 ft Min. Street Side Yard Setback 15 ft 15 ft 10 ft Max. Height 30 ft (35 ft with pitched roof) 30 ft (35 ft with pitched roof) 35 ft
bonus
Housing Type Diversity Bonus Option.
Density bonus incentives are available for the following "missing middle" housing types:
Small detached single-family dwellings per RDC 18.206.020.C.
Accessory dwelling units per RDC 18.206.030.C.
Cottages per RDC 18.206.040.B.2.
Duplexes and triplexes per RDC 18.206.050.B.
Townhouses per RDC 18.206.060.B.
Limitations. The maximum combined percentage of applicable small detached dwellings, cottages, and duplex, triplex, and townhouse dwelling units in development that qualify for the density bonus option herein are set forth by zone. Figure 18.206.025-F illustrates an example of how this works.
RLD-4: twenty percent.
RLD-6: thirty percent.
RLD-8: forty percent.
Individual cottage developments are exempt from this limitations. However, for larger developments that include cottages and other housing types, such cottages will be included in the calculations and the subject development shall comply with these limitation standards herein.
Any use of a density bonus under this section and the referenced sections of RDC Chapter 18.206 shall be recorded on the face of the plat noting the maximum total number of units, the designated types and number of units for each lot, and if applicable the maximum floor area of units.
F. 1. i. ii. iii. iv. v. 2. i. ii. iii. 3. Max. Impervious Surface 60% 60% 65%
Figure 18.206.025-F
Illustrating an example of a subdivision integrating missing middle housing types to allow for a modest density bonus.
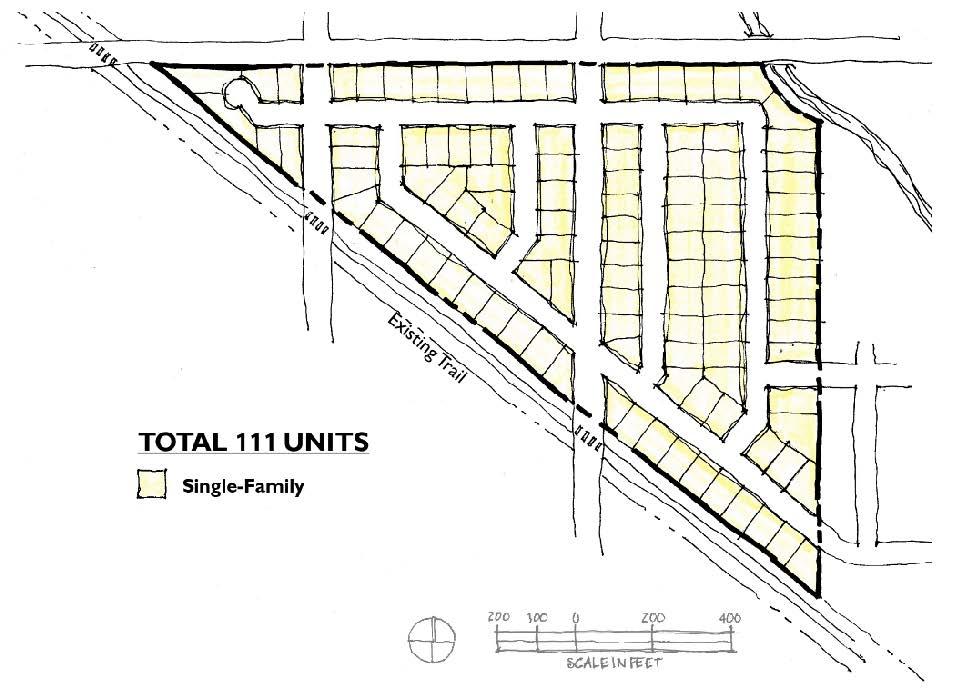
Example standard subdivision example with one hundred percent of lots single family.
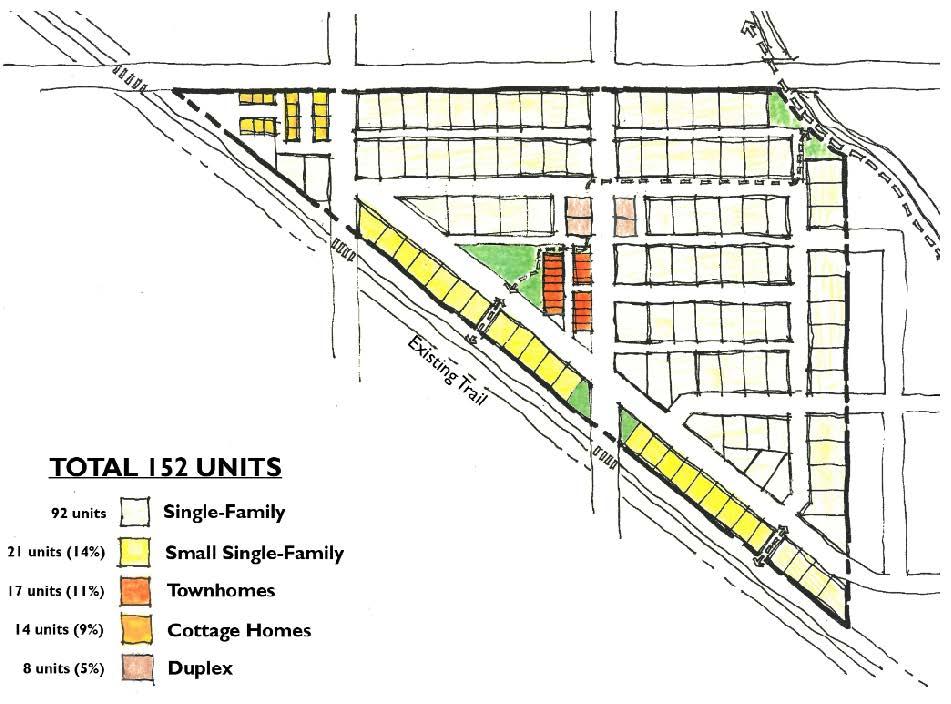
Example subdivision integrating missing middle housing types to achieve a density bonus. Using the calculations for available density bonuses for these housing types, the one hundred fifty-two dwelling units represented here would equate to one hundred twenty-three dwelling units for the purpose of density calculations. Missing middle housing types represent thirty-nine percent of the total dwelling units in this example - a percentage that would be acceptable in the RLD-8 zone.
(Ord. No. 1339, § 2(Exh. A), 5-27-2021; Ord. No. 1352, § 2(Exh. A), 11-4-2021)
Editor's note— Ord. No. 1339, § 2(Exh. A), adopted May 27, 2021, amended § 18.210.030 in its entirety to read as herein set out. Former § 18.210.030 pertained to lot requirements and derived from Ord. No. 1132, § 2(Exh. A), adopted July 11, 2013; and Ord. No. 1207, § 2(Exh. A), adopted May 26, 2016.
18.210.035 - Reserved.
Editor's note— Ord. No. 1339, § 2(Exh. A), adopted May 27, 2021, repealed § 18.210.035, which pertained to green design and derived from Ord. No. 1254, Exh. 3, adopted Dec. 7, 2017.
18.210.040 - Setbacks—Exceptions.
Reserved.
Setbacks from Regional Utility Corridors.
In subdivisions and short subdivisions, areas used as regional utility corridors shall be contained in separate tracts.
In other types of land development permits, easements shall be used to delineate such corridors.
All buildings and structures shall maintain a minimum distance of five feet from property or easement lines delineating the boundary of regional utility corridors, except for utility structures necessary to the operation of the utility corridor.
Projections into Setback.
The following projections may extend into yard setbacks:
Gutters;
Fixtures with a footprint not exceeding three square feet in area (e.g., overflow pipes for sprinkler and hot water tanks, gas and electric meters, alarm systems, and air duct termination; i.e., dryer, bathroom, and kitchens);
On-site drainage systems;
Fireplace structures, bay or garden windows, enclosed stair landings, closets, or similar structures may project into setbacks, that are greater than seven feet, provided such projections are:
Limited to two per facade;
Not wider than ten feet;
Not more than twenty-four inches into a side yard setback which is greater than seven feet; or
Not more than thirty inches into a front and rear yard setback. Eaves shall not project more than:
Eighteen inches into a required side yard setback; and
Thirty-six inches into a front yard and/or rear yard setback.
A. B. 1. 2. 3. C. 1. a. b. c. d. i. ii. iii. iv. e. i. ii. f.
Uncovered porches and decks not exceeding eighteen inches above the finished grade may project up to five feet into the rear yard setbacks in the RLD-4 and RLD-6 zone. For PUD subdivisions, refer to the setback modulation requirements in RDC 18.401.090.J.
Covered but unenclosed porches may project up to three feet into the front yard.
Building stairs associated with entrances and porches less than three feet and six inches in height are allowed to project into the front yard setback.
Arbors are allowed in a yard setback if:
Their footprint is less than forty square feet, including eaves,
They are eight feet or shorter from finished grade, and
Both sides and roof are at least fifty percent open, or, if latticework is used, there shall be a minimum opening of two inches between crosspieces.
Fences are allowed in a yard setback if they meet the requirements of RDC 18.740. Fences may not be placed in the public right-of-way.
Retaining walls are allowed in a yard setback.
No projections are allowed into a regional utility corridor.
No projections or vertical structures are allowed into an access or stormwater easement.
The front yard setback requirements are specified in Section 18.210.025, except as provided for below.
The front yard setback may be reduced to the average front setback of the two adjacent lots; provided the applicant documents and demonstrates that the average setback of adjacent houses is less than fifteen feet. However, the minimum setback is ten feet. If the subject lot is a corner lot, the setback may be reduced to the average setback of the lot abutting the proposed house on the same street and the fifteen feet required setback. This provision shall not be construed as requiring a greater front yard setback than fifteen feet. Additionally, for corner lots the front yard setback along the longer side of the lot may be reduced to seven feet as long as this setback does not interfere with the site-triangle of the intersection.
Alley-loaded lots. If the rear faces on an alley and automobile access is taken exclusively from the alley, the following exceptions apply:
Minimum rear yard setback: zero feet.
Minimum front yard setback: five feet. When the ground level of a dwelling unit is closer than ten feet from the front property line, the ground level shall be elevated a minimum of thirty inches above the average grade of the adjacent sidewalk.
Lots intended for these reduced setbacks shall be noted on the plat.
See related standards in RDC 18.210.090.C.
g. h.
j. k.
D. 1. E. 1. 2. 3. 4. F.
i i. ii. iii.
2. 3.
Setbacks for flag lots shall be determined by the orientation of the house. The front setback shall be met for the side of the lot towards which the main entrance of the house is oriented, and rear and side yard setbacks shall be established in relationship to the front. All setbacks shall be measured from the property lines for the flag portion of the lot, and not from the pole portion of the lot. If the garage door is oriented towards the pole portion of the lot, it shall be set back eighteen feet from the property line of the flag portion of the lot to comply with RDC 18.210.090.B to allow sufficient driveway length to prevent parking in the pole portion of the lot.
(Ord. No. 1339, § 2(Exh. A), 5-27-2021; Ord. No. 1406, § 2(Exh. A), 7-13-2023)
Editor's note— Ord. No. 1339, § 2(Exh. A), adopted May 27, 2021, amended § 18.210.040 in its entirety to read as herein set out. Former § 18.210.040 pertained to dimensional standards and derived from Ord. No. 1132, § 2(Exh. A), adopted July 11, 2013; Ord. No. 1178, § 2(Exh. A), adopted Feb. 12, 2015; Ord. No. 1207, § 2(Exh. A), adopted May 26, 2016; and Ord. No. 1234, § 2(Exh. A), adopted June 22, 2017.
18.210.045 - Reserved.
Editor's note— Ord. No. 1339, § 2(Exh. A), adopted May 27, 2021, repealed § 18.210.045, which pertained to setbacks and exceptions and derived from Ord. No. 1132, § 2(Exh. A), adopted July 11, 2013; Ord. No. 1178, § 2(Exh. A), adopted Feb. 12, 2015; Ord. No. 1207, § 2(Exh A), adopted May 26, 2016; and Ord. No. 1232, § 2(Exh. A), adopted April 27, 2017.
18.210.050 - Green design.
The purpose of this section is to ensure best practices of environmental stewardship within the city of Ridgefield and to protect, to the extent practicable, our natural environment for future residents.
Development of single family residential uses within Ridgefield shall choose at least two practices from the list below during construction:
Landscape with drought-tolerant, native plants
Install water-conserving drip, micro-mist, or sub-surface irrigation systems
Recycle, salvage, or donate excess or unwanted materials
Recycle materials for use in walls, fences, trails, or other amenities that are integral to the development.
Rain gardens to accommodate storm water on-site, particularly roof drains, rather than conveyance to a community system.
Other green design practices that are acceptable to the community development director.
See related standards for green building under RMC Chapter 14.32.
(Ord. No. 1339, § 2(Exh. A), 5-27-2021)
A. B. 1. 2. 3. 4. 5. 6. C.
Editor's note— Ord. No. 1339, § 2(Exh. A), adopted May 27, 2021, amended § 18.210.050 in its entirety to read as herein set out. Former § 18.210.050 pertained to density requirements and derived from Ord. No. 1132, § 2(Exh. A), adopted July 11, 2013; and Ord. No. 1234, § 2(Exh. A), adopted June 22, 2017.
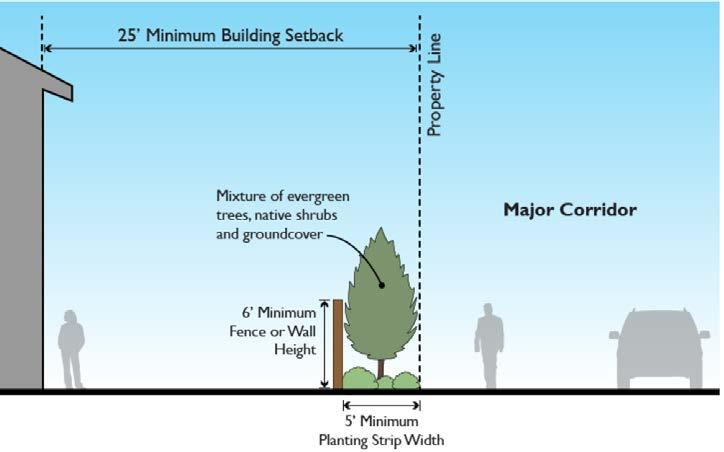
18.210.060 - Design provisions along major corridors.
th
The following standards apply to all lots abutting or adjacent to the public rights-of-way of major corridors, which are defined as Hillhurst Road, Pioneer Street (east of the Gee Creek crossing), 45 Avenue, and South Royle Road. Adjacent, when used in this section, means, separated by a street, tract, open space, or similar intervening element. These standards may not be modified through the PUD process.
Setbacks. All yard setbacks for applicable lots are twenty-five feet from the major corridor rightof-way.
Fencing and Walls. All residential lots shall comply with the following fencing and wall standards in addition to RDC 18.210.110 and Chapter 18.740.
Install a fence or wall continuously along major corridors as listed in subsection (A) of this section, and located directly behind the planting strip required in subsection (D) of this section. The fence or wall must comply with the site clearance provisions of Section 2.15 of the city engineering standards.
The fence or wall must be a minimum of six feet high and be constructed to give the appearance of earth tone stone with columns or physical indentations in the fence or wall at least every fifty lineal feet to reduce the massing effect of the fence material. The fence or wall design shall be compatible with nearby fences and walls along the major corridors and shall match the design of any previous fences or walls in the same subdivision. The design shall be approved by the community development director.
The property owner, developer or homeowners association is responsible for the maintenance of the fence or wall.
The fence or wall shall not be built until the city issues a fence permit consistent with RDC 18.740.050, the city issues a building permit for a wall, or grants approval through the development review process.
Landscaping. The following standards are in addition to the requirements in RDC 18.725. Figure 18.210.065-D is an example of design adhering to these standards.
A minimum five-feet wide planting strip shall be required between the property lines of abutting lots, tracts or parcels and the required fence listed in subsection (C) of this section. Vegetation within this planting strip shall satisfy the following standards:
A. B. C. 1. 2. 3. 4. D.
1. a.
Proposed vegetation shall be detailed in a landscape plan, consistent with the requirements of RDC 18.725.070, that addresses plant location, plant type, quantity, initial and mature planting sizes and method of irrigation.
b.
The planting strip shall be planted with a diverse mixture of evergreen trees, native shrubs and groundcover. Water features (creeks, fountains, etc.) may augment or replace the landscaping feature.
c.
d.
All plantings shall remain fifty percent opaque year round.
An in-ground irrigation system shall be installed to ensure the growth and long-term viability of planted materials.
e.
The perpetual maintenance and operation of the planting strip shall be the responsibility of a homeowner's association and/or the developer.
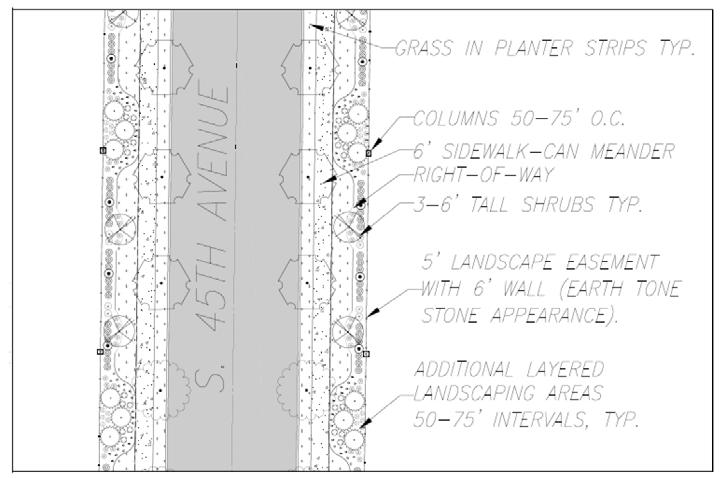 Figure 18.210.060-D
Major corridor plan-view example.
Figure 18.210.060-D
Major corridor plan-view example.
Major
(Ord. No. 1339, § 2(Exh. A), 5-27-2021)
Editor's note— Ord. No. 1339, § 2(Exh. A), adopted May 27, 2021, amended § 18.210.060 in its entirety to read as herein set out. Former § 18.210.060 pertained to neighborhood design standards and derived from Ord. No. 1132, § 2(Exh. A), adopted July 11, 2013; Ord. No. 1232, § 2(Exh. A), adopted April 27, 2017; Ord. No. 1253, § 2(Exh. A), adopted Dec. 7, 2017; and Ord. No. 1325, § 2(Exh. A), adopted Sep. 24, 2020.
18.210.065 - Reserved.
Editor's note— Ord. No. 1339, § 2(Exh. A), adopted May 27, 2021, repealed § 18.210.065, which pertained to additional design provisions along major corridors and derived from Ord. No. 1132, § 2(Exh. A), adopted July 11, 2013; Ord. No. 1178, § 2(Exh. A), adopted Feb. 12, 2015; Ord. No. 1207, § 2(Exh. A), adopted May 26, 2016; Ord. No. 1225, § 2(Exh. A), adopted Dec. 1, 2016; Ord. No. 1232, § 2(Exh. A), adopted April 27, 2017; Ord. No. 1234, § 2(Exh. A), adopted June 22, 2017; and Ord. No. 1253, § 2(Exh. A), adopted Dec. 7, 2017.
18.210.070 - Signs.
The city shall permit signs that comply with the provisions of Chapter 18.710.
(Ord. No. 1132, § 2(Exh. A), 7-11-2013)
18.210.075 - Exterior lighting.
Lighting shall comply with the requirements of Chapter 18.715.
(Ord. No. 1132, § 2(Exh. A), 7-11-2013)
18.210.080 - Vehicles in residential zones.
A. A.
Figure 18.210.060-D.2
corridor cross section example.
Purpose. Parking lots and outdoor storage of vehicles or recreational vehicles shall not be a primary use of any low density residential lot. Violation of this section is a public nuisance. Applicability. These regulations apply to all residential uses in RLD-4, RLD-6, and RLD-8 zones. Restrictions.
1. 2. 3.
Off-street parking is only permitted on approved driveways, parking lots or in garages.
Passenger vehicles, light trucks and trucks under two ton gross weight may park in any approved parking area, including the street, or garage, so long as they do not pose an impediment to pedestrian or other vehicular traffic.
Motor homes, recreational vehicles and utility trailers shall not be parked on street for a period of two weeks or more during any calendar year.
4.
Motor homes, recreational vehicles and utility trailers may be parked in off-street parking areas as follows:
a.
RLD-8 zone, in allowed off-street parking area;
RLD-6 and RLD-4 zones, in allowed off-street areas, including driveways; so long as they are not parked between the front lot line and the primary facade of the dwelling.
Recreational vehicles are further subject to the provisions of RDC 18.205.020 and 18.205.030.
(Ord. No. 1132, § 2(Exh. A), 7-11-2013)
18.210.090 - O�-street parking.
Off-street parking shall comply with this chapter and Chapter 18.720.
For individual garage or carport units facing a street, at least twenty linear feet of driveway shall be provided between any garage or carport entrance and the property line abutting the street , measured along the centerline of the driveway. This standard shall not be modified through the adjustment or variance process per RDC 18.350 or the PUD process per RDC 18.401.
For individual garage or carport units facing an alley, driveways shall not be any linear length between five feet and twenty feet from the garage or carport entrance to the edge of the alley; measured along the centerline of the driveway. The intent of this standard is to prevent parked cars from protruding into alleys. This standard shall not be modified through the adjustment or variance process per RDC 18.350 or the PUD process per RDC 18.401.
(Ord. No. 1132, § 2(Exh. A), 7-11-2013; Ord. No. 1207, § 2(Exh. A), 5-26-2016; Ord. No. 1339, § 2(Exh. A), 5-272021)
18.210.100 - Landscaping.
Landscaping shall meet the requirements of Chapter 18.725
A.
B. C.
b. 5. A. B. C. A.
(Ord. No. 1132, § 2(Exh. A), 7-11-2013)
18.210.110 - Fences and walls.
In addition to the provisions of Chapter 18.740, the following special provisions shall apply. The maximum height of fences located along a property line is six feet, subject to the sight clearance provisions of Section 2.16 of the city engineering standards. The maximum height of fences and walls located between the front yard building setback line and the front property line is three feet, six inches high.
All electric, razor wire, and barbed wire fences are prohibited.
(Ord. No. 1132, § 2(Exh. A), 7-11-2013; Ord. No. 1370, § 2(Exh. A), 9-8-2022)
18.210.120 - Accessory structures and dwellings.
Accessory structures and dwellings must meet the lot requirements and dimensional standards in RDC 18.210.030 with the following exceptions:
Height.
Accessory structures other than recreational vehicle garages shall not exceed the lesser of eighteen feet in height or the height of the primary structure.
Recreational vehicle garages shall not exceed the lesser of twenty-four feet in height or the height of the primary structure.
Setbacks.
One uninhabited freestanding structure up to ten feet high and 120 square feet in footprint area, such as a storage shed or greenhouse, may be located within the required rear or side yard setback, provided:
The structure shall be located a minimum of three feet from property lines with eaves no greater than twelve inches.
The structure shall retain a five-foot fire separation distance from other structures as specified in adopted building codes.
The structures shall be setback at least five feet farther than the front façade of the house if the structure is located in the side yard. For corner lots, the structure shall be set back a minimum of ten feet farther than the front façade of the house on the street side, or outside of the Sight Obstruction area pursuant to Section 2.16 of the Engineering Standards.
Accessory structures greater than one hundred twenty square feet shall be visually compatible with the primary structure.
A. 1.
A. 1. a. b. 2. a. i. ii. iii.
C.
2.
B.
Accessory structures and dwellings are only permitted as accessory uses to a primary use and must be located on the same parcel as the primary use.
Accessory dwelling units are regulated by RDC 18.205.020, RDC 18.205.030 and RDC 18.206.030.
(Ord. No. 1132, § 2(Exh. A), 7-11-2013; Ord. No. 1325, § 2(Exh. A), 9-24-2020; Ord. No. 1339, § 2(Exh. A), 5-272021; Ord. No. 1370, § 2(Exh. A), 9-8-2022)
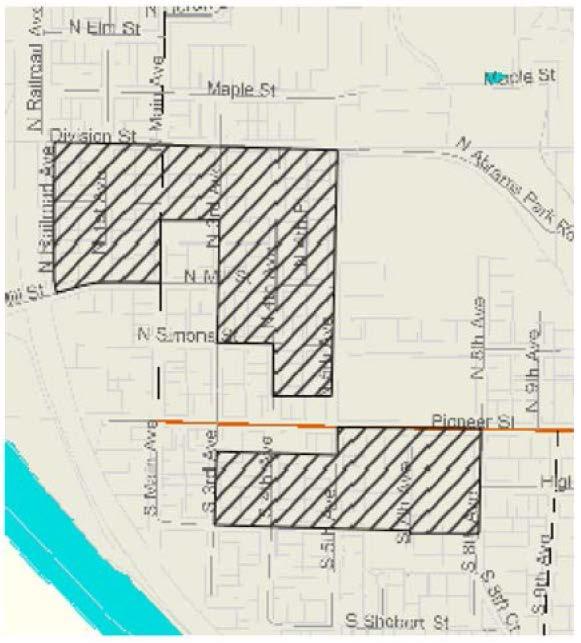
18.210.130 - Downtown transition area.
Purpose. To accommodate potential future expansion of the CMU district, which encompasses the city's traditional commercial and civic core, the downtown transition area allows for limited commercial activity in the residential districts surrounding the CMU district.
District Boundaries. The Downtown Transition Area (DTA) shall be bounded by the centerline of Sargent Street extended to 8 Avenue, 8 Avenue south of Pioneer Street, 5 Avenue north of Pioneer Street, Division Street, and Railroad Avenue, exclusive of properties zoned RMD-16, CMU or P/OS. The district shall also include parcels abutting Division Street on the north side of the street between N Railroad Avenue and N 5 Avenue, and parcels abutting Sargent Street on the south side of the street between S 3 Avenue and S 5 Avenue. The district shall also include all parcels adjacent to the district boundaries. The district boundaries shall be as illustrated in Figure 18.210.130-B.
Residential Uses. Within the downtown transition area, the following modifications to land use, dimensional, and density standards apply:
1.
Single family detached.
D.
A. B. C.
Figure 18.210.130-B
Downtown transition area boundaries.
th
rd
th th th
th
For the purpose of density calculations, single-family detached dwellings one thousand six hundred square feet or less in gross floor area may count as one-half of one unit provided the lot is at least two thousand five hundred square feet and all applicable setback, open space, and design standards are met.
The density bonus available in this subsection shall not be combined with other density bonuses.
Duplexes.
Duplexes are allowed on all corner lots regardless of lot size or density requirements.
Duplexes are allowed on all lots at least four thousand seven hundred square feet in area regardless of density requirements.
Nonresidential Uses. Within the downtown transition area, limited commercial and office activity may be allowed provided:
Use is located on a lot platted ten thousand square feet or less zoned RLD. The building in which the use is located was lawfully established prior to the effective date of this ordinance. Existing buildings may be expanded by no more than twenty percent of the existing total floor area. Non-residential SDCs, impact fees, and building and life safety codes may apply to proposed alterations or expansions.
Use meets the definition of general office, general retail trade/services, eating and drinking establishment use types as defined in RDC 18.100.
Review. The community development director shall review applications for uses in the downtown transition area not allowed by the underlying zoning as well as proposed expansions and alterations consistent with RDC 18.210.130.C through a minor site plan review as described in RDC 18.500.030.B.
Development Standards. The parking, landscaping, lighting, and sign standards for the CMU zone shall apply to proposed nonresidential uses in the DTA.
Adjustment of Dimensional Standards for Building Expansions. The city will attempt to allow flexibility in lot coverage and dimensional standards set forth in RDC 18.210.030 so long as the adjustments to the standards are consistent with the character of the downtown transition area as follows:
The burden of demonstrating that the proposed relaxation of the base zone dimensional standards is consistent with the character of the DTA lies solely on the applicant and shall be supported by substantial evidence, including, but not limited to, demonstrating consistency with the "14 Essential Guidelines for Downtown Ridgefield."
i. ii. 2. i. ii.
E. F. G.
D. 1. 2. 3.
1. 2.
Building setbacks to the street may be reduced if the proposed structure is of the same, or substantially similar, scale, mass, height and composition of materials as fifty percent of like types of buildings within a distance of two blocks of the proposed structure on the same street.
The building height must meet the requirements for the underlying residential zone. The request for flexibility may exceed twenty percent of the numeric base zone standard without application of RDC 18.350.030.G.
(Ord. No. 1339, § 2(Exh. A), 5-27-2021)
Editor's note— Ord. No. 1339, § 2(Exh. A), adopted May 27, 2021, amended § 18.210.130 in its entirety to read as herein set out. Former § 18.210.130 pertained to special provisions for the downtown transition area and derived from Ord. No. 1132, § 2(Exh. A), adopted July 11, 2013; and Ord. No. 1178, § 2(Exh. A), adopted Feb. 12, 2015.
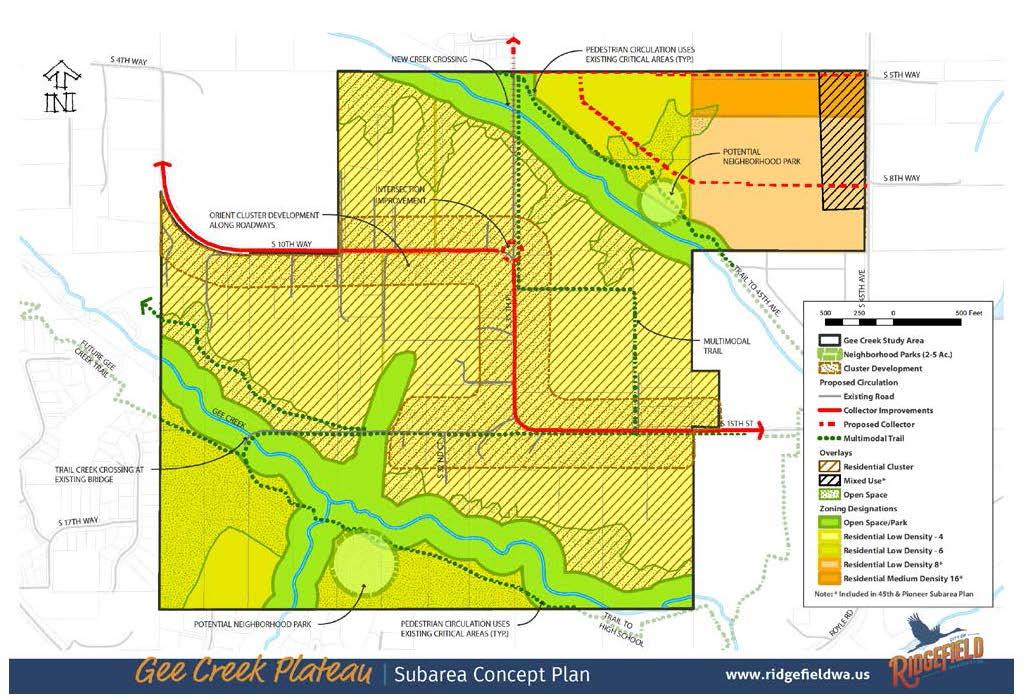
18.210.135 - Special provisions for the Gee Creek Plateau sub-area (Cluster Development).
A. B.
Purpose. The purpose of the Gee Creek Plateau cluster development is to accommodate urban densities of the underlying zoning district while allowing residential development to utilize less land area. These provisions aim to allow greater flexibility in the design of subdivisions to ensure development is in harmony with the natural characteristics onsite and to preserve features such as critical areas, open space, recreation areas, or scenic vistas.
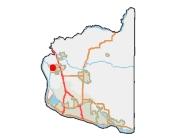
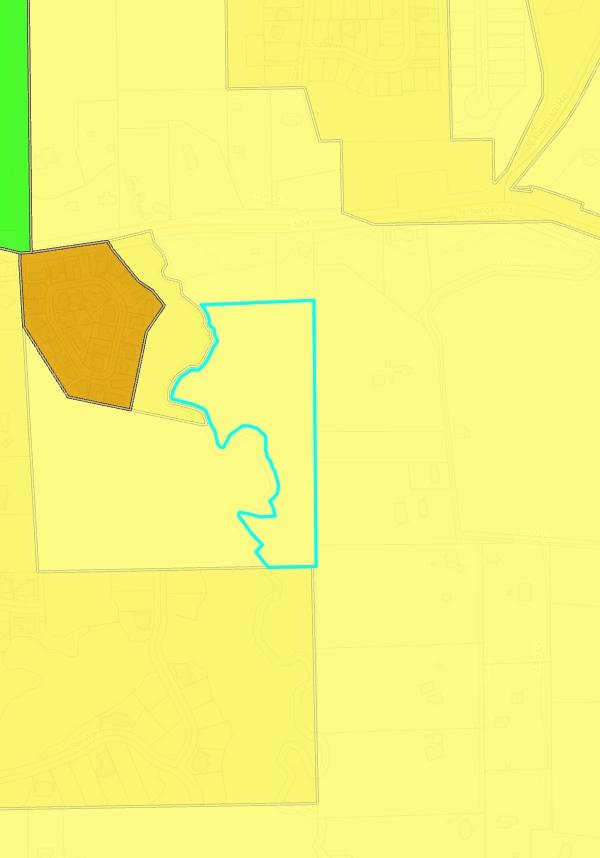
District Boundaries. The Gee Creek Plateau sub-area cluster development area (hatched area in the figure below) is bounded by the S. 5 Way alignment to the north, approximately the S. 32 Place alignment to the west, Gee Creek to the south, and approximately the alignment of S. 40 Street to the east. Cluster development within the district is required.
th nd th
3. 4.
Uses. The underlying base zone for all cluster development is Residential Low Density - 4 (RLD-4). Uses are those permitted in the RLD-4 zone.
Review. The community development director shall review all development proposed under the Gee Creek Plateau cluster provisions as a planned unit development (RDC 18.401) and Procedures (RDC 18.310).
The Gee Creek Plateau cluster development standards shall be required for development within the district boundaries identified by Section 18.210.135.B.
The open space requirements in this section shall apply in lieu of the parks and open space requirements in Chapter 18.401
Critical areas density transfer provisions shall not apply within the required cluster district.
The PUD process shall not be used to create lots exceeding these limits. The minimum lot size is six thousand square feet. The maximum lot size is fifteen thousand square feet. Development Standards. The clustering provisions of this code are required for any proposed development on parcels one acre or larger in size. Subdivisions of land within the cluster overlay of four lots or less shall follow the procedure outlined in RDC 18.610.
Single family home lots shall be no less than six thousand and no more than fifteen thousand square feet with a minimum density of four dwelling units per acre based on net developable acres.
The remainder parcel subject to covenant shall be no less than ten percent of the net developable area. For the purposes of this section a "remainder parcel" means the remainder parcel of the cluster subdivision that contains the majority of the land within the development and is devoted to open space uses.
The remainder parcel shall be subject to a recorded covenant prohibiting any future development other than proposed trail development as identified in the parks and recreation capital facilities plan, or agricultural buildings. The purpose of the remainder parcel is to provide open space amenities to the development and preserve the unique nature of the Gee Creek Plateau.
The remainder parcel shall be contiguous.
The remainder parcel is encouraged to abut any critical area.
The remainder parcel shall be dedicated to, and maintained by, the required home owners association (HOA).
At minimum twenty-five percent of the road frontage of the parent parcel shall remain undeveloped in open space, except split rail fence, road and pedestrian improvements, and associated stormwater facilities.
C. D. 1.
4.
3. a.
2. 3.
E. 1. 2.
1. b. 4. Figure 18.210.135-1
F.
a.
Corner lots may calculate the required twenty-five percent open space frontage by adding the total of both frontages. This requirement shall not be construed to require twenty-five percent of both frontages separately.
This section becomes effective upon annexation.
(Ord. No. 1268, § 2(Exh. A), 10-25-2018; Ord. No. 1406, § 2(Exh. A), 7-13-2023)
18.210.140 - Reserved.
Editor's note— Ord. No. 1339, § 2(Exh. A), adopted May 27, 2021, repealed § 18.210.140, which pertained to special provisions for townhouse developments and derived from Ord. No. 1132, § 2(Exh. A), adopted July 11, 2013.
18.210.150 - Reserved.
Editor's note— Ord. No. 1339, § 2(Exh. A), adopted May 27, 2021, repealed § 18.210.150, which pertained to special provisions for cottage, carriage and two/three unit homes and derived from Ord. No. 1132, § 2(Exh. A), adopted July 11, 2013; and Ord. No. 1207, § 2(Exh. A), adopted May 26, 2016.
COMMUNITY
INFORMATION
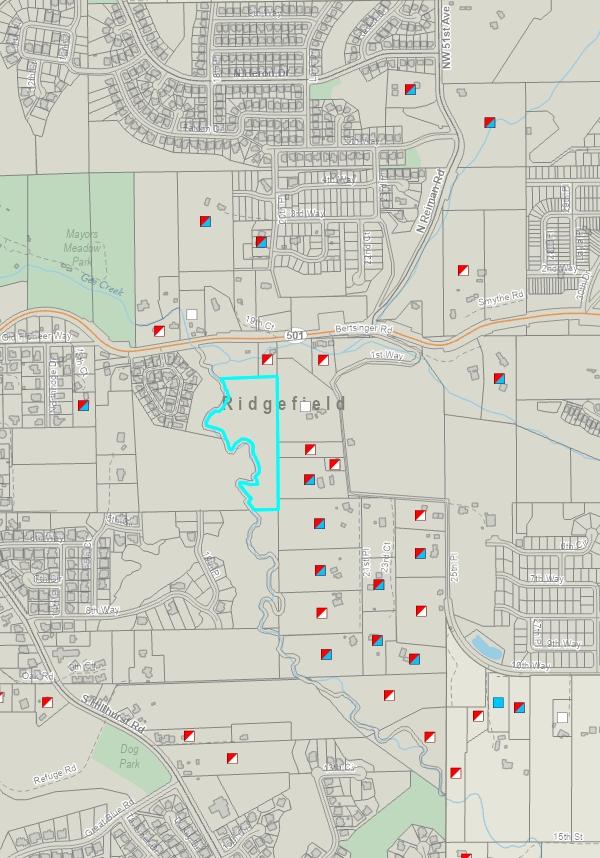
Traffic Counts
The information contained is provided by WFG’s Customer Service Department to our customers, and while deemed reliable, is not guaranteed.
Demographics

21980800 - Ridgefield, WA
21980800 - Ridgefield, WA Sitewise Online Pop-Facts: Population Quick Facts Pop-Facts: Population Quick Facts 21980800 - Ridgefield, WA 0 - 1 mi Population 2027 Projection 6,548 2022 Estimate 6,086 2010 Census 3,849 2000 Census 2,369 Growth 2022-2027 7.60% Growth 2010-2022 58.13% Growth 2000-2010 62.45% 2022 Est. Population by Age 6,086 Age 0 to 4 403 6.63% Age 5 to 9 452 7.43% Age 10 to 14 498 8.18% Age 15 to 17 288 4.73% Age 18 to 20 259 4.25% Age 21 to 24 337 5.54% Age 25 to 34 754 12.38% Age 35 to 44 766 12.59% Age 45 to 54 809 13.29% Age 55 to 64 695 11.42% Age 65 to 74 552 9.07% Age 75 to 84 222 3.65% Age 85 and over 51 0.84% Age 16 and over 4,638 76.21% Age 18 and over 4,445 73.04% Age 21 and over 4,186 68.79% Age 65 and over 826 13.57% 2022 Est. Median Age 35.69 2022 Est. Average Age 36.83
21980800 - Ridgefield, WA Sitewise Online
Pop-Facts: Population Quick Facts
Pop-Facts: Population Quick Facts
Copyright © Claritas, LLC 2022. All rights reserved.
21980800 - Ridgefield, WA 0 - 1 mi
2022 Est. Population by Single-Classification Race 6,086 White Alone 5,433 89.28% Black or African American Alone 81 1.33% American Indian and Alaska Native Alone 38 0.62% Asian Alone 210 3.46% Native Hawaiian and Other Pacific Islander Alone 14 0.24% Some Other Race Alone 103 1.70% Two or More Races 206 3.38% 2022 Est. Population by Ethnicity (Hispanic or Latino) 6,086 Hispanic or Latino 451 7.41% Not Hispanic or Latino 5,635 92.59% 2022 Est. Population by Sex 6,086 Male 3,027 49.74% Female 3,059 50.26%
21980800 - Ridgefield, WA Sitewise Online Pop-Facts: Household Quick Facts Pop-Facts: Household Quick Facts 21980800 - Ridgefield, WA 0 - 1 mi Households 2027 Projection 2,209 2022 Estimate 2,059 2010 Census 1,303 2000 Census 825 Growth 2022-2027 7.31% Growth 2010-2022 58.02% Growth 2000-2010 57.91% 2022 Est. Households by Household Income 2,059 Income Less than $15,000 37 1.77% Income $15,000 to $24,999 31 1.51% Income $25,000 to $34,999 77 3.76% Income $35,000 to $49,999 163 7.93% Income $50,000 to $74,999 231 11.24% Income $75,000 to $99,999 279 13.54% Income $100,000 to $124,999 295 14.34% Income $125,000 to $149,999 269 13.07% Income $150,000 to $199,999 294 14.27% Income $200,000 to $249,999 128 6.21% Income $250,000 to $499,999 176 8.54% Income $500,000 or more 79 3.83% 2022 Est. Average Household Income $147,823 2022 Est. Median Household Income $117,863 2022 Median HH Inc. by Single-Classification Race White Alone $115,582 Black or African American Alone $156,888 American Indian and Alaska Native Alone $127,517 Asian Alone $47,899 Native Hawaiian and Other Pacific Islander Alone $67,941 Some Other Race Alone $231,661 Two or More Races $161,767 Hispanic or Latino $84,757 Not Hispanic or Latino $119,516 2022 Est. Households by Household Type 2,059 Family Households 1,665 80.84% Nonfamily Households 394 19.16% 2022 Est. Group Quarters Population 0
21980800
Pop-Facts: Household Quick Facts
21980800 - Ridgefield, WA
2022 Est. Households by Household Size 2,059 1-person 304 14.75% 2-person 644 31.27% 3-person 367 17.80% 4-person 413 20.04% 5-person 204 9.90% 6-person 82 3.97% 7-or-more-person 47 2.27% 2022 Est. Average Household Size 2.96
- Ridgefield, WA Sitewise Online
Pop-Facts: Household Quick Facts
0 - 1 mi
2022 Est. HHs by Type by Presence of Own Children 1,665 Married-Couple Family, own children 695 41.75% Married-Couple Family, no own children 653 39.21% Male Householder, own children 69 4.13% Male Householder, no own children 33 2.00% Female Householder, own children 144 8.66% Female Householder, no own children 71 4.25%
© Claritas, LLC 2022. All rights reserved. 21980800 - Ridgefield, WA Sitewise Online Pop-Facts: Household Quick Facts Pop-Facts: Household Quick Facts 21980800 - Ridgefield, WA 0 - 1 mi
Copyright
21980800 - Ridgefield, WA Sitewise Online Pop-Facts: Demographic Snapshot (Part 1) Pop-Facts: Demographic Snapshot (Part 1) 21980800Ridgefield, WA 0 - 1 mi Population 2027 Projection 6,548 2022 Estimate 6,086 2010 Census 3,849 2000 Census 2,369 Growth 2022-2027 7.60% Growth 2010-2022 58.13% Growth 2000-2010 62.45% 2022 Est. Population by Single-Classification Race 6,086 White Alone 5,433 89.28% Black or African American Alone 81 1.33% American Indian and Alaska Native Alone 38 0.62% Asian Alone 210 3.46% Native Hawaiian and Other Pacific Islander Alone 14 0.24% Some Other Race Alone 103 1.70% Two or More Races 206 3.38% 2022 Est. Population Hispanic or Latino by Origin 6,086 Not Hispanic or Latino 5,635 92.59% Hispanic or Latino 451 7.41% Hispanic or Latino by Origin 451 Mexican 315 69.75% Puerto Rican 33 7.32% Cuban 11 2.50% All Other Hispanic or Latino 92 20.43% 2022 Est. Hisp. or Latino Pop by Single-Classification Race 451 White Alone 281 62.27% Black or African American Alone 4 0.88% American Indian and Alaska Native Alone 12 2.63% Asian Alone 10 2.31% Native Hawaiian and Other Pacific Islander Alone 0 0.00% Some Other Race Alone 102 22.71% Two or More Races 42 9.20%
21980800 - Ridgefield, WA Sitewise Online
Pop-Facts: Demographic Snapshot (Part 1)
Pop-Facts: Demographic Snapshot (Part 1)
21980800Ridgefield, WA 0 - 1 mi
2022 Est. Pop by Race, Asian Alone, by Category 210 Chinese, except Taiwanese 30 14.03% Filipino 11 5.08% Japanese 0 0.00% Asian Indian 62 29.42% Korean 91 43.45% Vietnamese 0 0.00% Cambodian 16 7.75% Hmong 0 0.00% Laotian 0 0.00% Thai 0 0.00% All other Asian Races, including 2 or more 1 0.26% 2022 Est. Population by Ancestry 6,086 Arab 0 0.00% Czech 85 1.40% Danish 66 1.08% Dutch 165 2.70% English 502 8.24% French (except Basque) 285 4.69% French Canadian 18 0.29% German 719 11.82% Greek 5 0.09% Hungarian 0 0.00% Irish 726 11.93% Italian 221 3.63% Lithuanian 0 0.00% Norwegian 246 4.05% Polish 10 0.17% Portuguese 26 0.43% Russian 20 0.33% Scottish 77 1.26% Scotch-Irish 40 0.66% Slovak 0 0.00% Subsaharan African 23 0.38% Swedish 73 1.20% Swiss 27 0.45% Ukrainian 126 2.08% United States or American 373 6.13% Welsh 18 0.30% West Indian (except Hisp. groups) 0 0.00% Other Ancestries 1,450 23.83% Ancestry Unclassified 782 12.86% 2022 Est. Pop Age 5+ by Language Spoken At Home 5,683 Speak only English 5,146 90.55%
21980800 - Ridgefield, WA
Pop-Facts: Demographic Snapshot (Part 1)
Pop-Facts: Demographic Snapshot (Part 1)
21980800Ridgefield, WA 0 - 1
Speak Asian or Pacific Island Language 150 2.64% Speak IndoEuropean Language 328 5.78% Speak Spanish 59 1.03% Speak Other Language 0 0.00%
Sitewise
Online
mi
21980800 - Ridgefield, WA
Sitewise Online
Pop-Facts: Demographic Snapshot (Part 1)
Pop-Facts:
Demographic Snapshot (Part 1)
21980800Ridgefield, WA 0 - 1 mi
2022 Est. Population by Sex 6,086 Male 3,027 49.74% Female 3,059 50.26% 2022 Est. Population by Age 6,086 Age 0 to 4 403 6.63% Age 5 to 9 452 7.43% Age 10 to 14 498 8.18% Age 15 to 17 288 4.73% Age 18 to 20 259 4.25% Age 21 to 24 337 5.54% Age 25 to 34 754 12.38% Age 35 to 44 766 12.59% Age 45 to 54 809 13.29% Age 55 to 64 695 11.42% Age 65 to 74 552 9.07% Age 75 to 84 222 3.65% Age 85 and over 51 0.84% Age 16 and over 4,638 76.21% Age 18 and over 4,445 73.04% Age 21 and over 4,186 68.79% Age 65 and over 826 13.57% 2022 Est. Median Age 35.69 2022 Est. Average Age 36.83
21980800 - Ridgefield, WA Sitewise Online
Pop-Facts: Demographic Snapshot (Part 1)
Pop-Facts:
Demographic Snapshot (Part 1)
21980800Ridgefield, WA 0 - 1 mi
2022 Est. Male Population by Age 3,027 Age 0 to 4 208 6.86% Age 5 to 9 237 7.81% Age 10 to 14 248 8.19% Age 15 to 17 149 4.92% Age 18 to 20 136 4.49% Age 21 to 24 176 5.80% Age 25 to 34 394 13.02% Age 35 to 44 369 12.20% Age 45 to 54 388 12.82% Age 55 to 64 341 11.25% Age 65 to 74 260 8.59% Age 75 to 84 103 3.40% Age 85 and over 20 0.66% 2022 Est. Median Age, Male 34.16 2022 Est. Average Age, Male 36.00 2022 Est. Female Population by Age 3,059 Age 0 to 4 196 6.39% Age 5 to 9 215 7.04% Age 10 to 14 250 8.17% Age 15 to 17 139 4.54% Age 18 to 20 123 4.02% Age 21 to 24 162 5.28% Age 25 to 34 359 11.75% Age 35 to 44 397 12.97% Age 45 to 54 421 13.75% Age 55 to 64 355 11.60% Age 65 to 74 292 9.55% Age 75 to 84 120 3.91% Age 85 and over 31 1.01% 2022 Est. Median Age, Female 37.16 2022 Est. Average Age, Female 37.67
21980800 - Ridgefield, WA Sitewise Online
Pop-Facts: Demographic Snapshot (Part 1)
Pop-Facts: Demographic Snapshot (Part 1)
Copyright © Claritas, LLC 2022. All rights reserved.
21980800Ridgefield, WA 0 - 1 mi
2022 Est. Pop Age 15+ by Marital Status 4,733 Total, Never Married 1,214 25.65% Males, Never Married 639 13.50% Females, Never Married 575 12.15% Married, Spouse present 2,946 62.25% Married, Spouse absent 80 1.69% Widowed 117 2.47% Males, Widowed 47 0.99% Females, Widowed 70 1.48% Divorced 376 7.94% Males, Divorced 64 1.36% Females, Divorced 311 6.57% 2022 Est. Pop Age 25+ by Edu. Attainment 3,849 Less than 9th grade 3 0.07% Some High School, no diploma 103 2.68% High School Graduate (or GED) 873 22.69% Some College, no degree 1,113 28.91% Associate Degree 498 12.94% Bachelor's Degree 843 21.91% Master's Degree 305 7.91% Professional School Degree 98 2.54% Doctorate Degree 13 0.34% 2022 Est. Pop. Age 25+ by Edu. Attain., Hisp./Lat. 202 No High School Diploma 0 0.00% High School Graduate 63 31.34% Some College or Associate's Degree 83 40.80% Bachelor's Degree or Higher 56 27.86%
21980800 - Ridgefield, WA Sitewise Online Pop-Facts: Demographic Snapshot (Part 2) Pop-Facts: Demographic Snapshot (Part 2) 21980800 - Ridgefield, WA 0 - 1 mi Households 2027 Projection 2,209 2022 Estimate 2,059 2010 Census 1,303 2000 Census 825 Growth 2022-2027 7.31% Growth 2010-2022 58.02% Growth 2000-2010 57.91% 2022 Est. Households by Household Type 2,059 Family Households 1,665 80.84% Nonfamily Households 394 19.16% 2022 Est. Group Quarters Population 0 2022 HHs by Ethnicity: Hispanic/Latino 103 5.01% 2022 Est. Households by HH Income 2,059 Income < $15,000 37 1.77% Income $15,000 to $24,999 31 1.51% Income $25,000 to $34,999 77 3.76% Income $35,000 to $49,999 163 7.93% Income $50,000 to $74,999 231 11.24% Income $75,000 to $99,999 279 13.54% Income $100,000 to $124,999 295 14.34% Income $125,000 to $149,999 269 13.07% Income $150,000 to $199,999 294 14.27% Income $200,000 to $249,999 128 6.21% Income $250,000 to $499,999 176 8.54% Income $500,000+ 79 3.83% 2022 Est. Average Household Income $147,823 2022 Est. Median Household Income $117,863 2022 Median HH Income by Single-Class. Race or Ethn. White Alone $115,582 Black or African American Alone $156,888 American Indian and Alaska Native Alone $127,517 Asian Alone $47,899 Native Hawaiian and Other Pacific Islander Alone $67,941 Some Other Race Alone $231,661 Two or More Races $161,767 Hispanic or Latino $84,757
21980800 - Ridgefield, WA
Sitewise Online
Pop-Facts: Demographic Snapshot (Part 2)
Pop-Facts:
Demographic Snapshot (Part 2)
21980800 - Ridgefield, WA
0 - 1 mi
$119,516
Hispanic or Latino
Not
21980800 - Ridgefield, WA Sitewise Online
Pop-Facts: Demographic Snapshot (Part 2)
Pop-Facts: Demographic Snapshot (Part 2)
21980800 - Ridgefield, WA
2022 Est. Family HH Type by Presence of Own Children 1,665 Married-Couple Family, own children 695 41.75% Married-Couple Family, no own children 653 39.21% Male Householder, own children 69 4.13% Male Householder, no own children 33 2.00% Female Householder, own children 144 8.66% Female Householder, no own children 71 4.25% 2022 Est. Households by Household Size 2,059 1-person 304 14.75% 2-person 644 31.27% 3-person 367 17.80% 4-person 413 20.04% 5-person 204 9.90% 6-person 82 3.97% 7-or-more-person 47 2.27% 2022 Est. Average Household Size 2.96 2022 Est. Households by Presence of People Under 18 2,059 Households with 1 or more People under Age 18 973 47.27% Households with No People under Age 18 1,086 52.73% Households with 1 or more People under Age 18 973 Married-Couple Family 719 73.89% Other Family, Male Householder 83 8.50% Other Family, Female Householder 161 16.59% Nonfamily, Male Householder 8 0.84% Nonfamily, Female Householder 2 0.18% Households with No People under Age 18 1,086 Married-Couple Family 629 57.90% Other Family, Male Householder 18 1.70% Other Family, Female Householder 53 4.92% Nonfamily, Male Householder 185 17.08% Nonfamily, Female Householder 200 18.40%
0 - 1 mi
21980800 - Ridgefield, WA Sitewise Online
Pop-Facts: Demographic Snapshot (Part 2)
Pop-Facts: Demographic Snapshot (Part 2)
21980800 - Ridgefield, WA
- 1 mi
2022 Est. Households by Number of Vehicles 2,059 No Vehicles 17 0.83% 1 Vehicle 354 17.18% 2 Vehicles 881 42.80% 3 Vehicles 509 24.73% 4 Vehicles 221 10.75% 5 or more Vehicles 76 3.71% 2022 Est. Average Number of Vehicles 2.40 Family Households 2027 Projection 1,787 2022 Estimate 1,665 2010 Census 1,052 2000 Census 645 Growth 2022-2027 7.34% Growth 2010-2022 58.25% Growth 2000-2010 63.12% 2022 Est. Families by Poverty Status 1,665 2022 Families at or Above Poverty 1,624 97.55% 2022 Families at or Above Poverty with Children 854 51.32% 2022 Families Below Poverty 41 2.45% 2022 Families Below Poverty with Children 4 0.26% 2022 Est. Pop Age 16+ by Employment Status 4,638 In Armed Forces 18 0.39% Civilian - Employed 2,924 63.05% Civilian - Unemployed 25 0.55% Not in Labor Force 1,670 36.01% 2022 Est. Civ. Employed Pop 16+ by Class of Worker 2,896 For-Profit Private Workers 1,780 61.46% Non-Profit Private Workers 256 8.84% Local Government Workers 284 9.80% State Government Workers 96 3.31% Federal Government Workers 67 2.33% Self-Employed Workers 413 14.25% Unpaid Family Workers 0 0.00%
0
21980800
Pop-Facts:
21980800
2022 Est. Civ. Employed Pop 16+ by Occupation 2,896 Architect/Engineer 116 4.02% Arts/Entertainment/Sports 11 0.40% Building Grounds Maintenance 39 1.36% Business/Financial Operations 167 5.77% Community/Social Services 21 0.72% Computer/Mathematical 73 2.52% Construction/Extraction 125 4.31% Education/Training/Library 175 6.05% Farming/Fishing/Forestry 0 0.00% Food Prep/Serving 88 3.04% Healthcare Practitioner/Technician 319 11.03% Healthcare Support 73 2.54% Maintenance Repair 94 3.25% Legal 36 1.23% Life/Physical/Social Science 24 0.84% Management 403 13.91% Office/Admin. Support 340 11.73% Production 76 2.62% Protective Service 88 3.05% Sales/Related 247 8.53% Personal Care/Service 111 3.82% Transportation/Moving 269 9.28% 2022 Est. Pop 16+ by Occupation Classification 2,896 Blue Collar 563 19.45% White Collar 1,933 66.75% Service & Farm 400 13.80% 2022 Est. Workers Age 16+ by Transp. To Work 2,859 Drove Alone 2,418 84.58% Car Pooled 284 9.94% Public Transportation 12 0.43% Walked 6 0.19% Bicycle 0 0.00% Other Means 4 0.15% Worked at Home 135 4.71% 2022 Est. Workers Age 16+ by Travel Time to Work* Less than 15 minutes 260 15 to 29 Minutes 1,184 30 to 44 Minutes 627 45 to 59 Minutes 340 60 or more Minutes 317
Ridgefield, WA Sitewise Online
-
Pop-Facts: Demographic Snapshot (Part 2)
Demographic Snapshot (Part 2)
- Ridgefield, WA 0 - 1 mi
21980800 - Ridgefield, WA Sitewise Online
Pop-Facts: Demographic Snapshot (Part 2)
Pop-Facts: Demographic Snapshot (Part 2)
21980800 - Ridgefield, WA
2022 Est. Avg. Travel Time to Work in Minutes* 34.63 2022 Est. Occupied Housing Units by Tenure 2,059 Owner-Occupied 1,631 79.21% Renter-Occupied 428 20.79% 2022 Occupied Housing Units: Avg. Length of Residence Owner-Occupied 10 Renter-Occupied 4
0 - 1 mi
21980800
2022 Est. Owner Occupied Housing Units by Value 1,631 Value Less than $20,000 1 0.04% Value $20,000 to $39,999 3 0.18% Value $40,000 to $59,999 10 0.60% Value $60,000 to $79,999 0 0.00% Value $80,000 to $99,999 3 0.19% Value $100,000 to $149,999 3 0.18% Value $150,000 to $199,999 4 0.27% Value $200,000 to $299,999 41 2.48% Value $300,000 to $399,999 263 16.15% Value $400,000 to $499,999 404 24.76% Value $500,000 to $749,999 564 34.61% Value $750,000 to $999,999 270 16.53% Value $1,000,000 to $1,499,999 63 3.87% Value $1,500,000 to $1,999,999 2 0.11% Value $2,000,000 or more 1 0.04% 2022 Est. Median All Owner-Occupied Housing Unit Value $537,208 2022 Est. Housing Units by Units in Structure 2,138 1 Unit Attached 84 3.91% 1 Unit Detached 1,922 89.92% 2 Units 75 3.51% 3 or 4 Units 10 0.49% 5 to 19 Units 0 0.00% 20 to 49 Units 0 0.00% 50 or More Units 0 0.00% Mobile Home or Trailer 47 2.18% Boat, RV, Van, etc. 0 0.00% Dominant structure type 1 Unit Detached 2022 Est. Housing Units by Year Structure Built 2,138 Housing Units Built 2014 or Later 399 18.66% Housing Units Built 2010 to 2013 228 10.68% Housing Units Built 2000 to 2009 776 36.31% Housing Units Built 1990 to 1999 168 7.85% Housing Units Built 1980 to 1989 123 5.78% Housing Units Built 1970 to 1979 148 6.91% Housing Units Built 1960 to 1969 28 1.31% Housing Units Built 1950 to 1959 108 5.06% Housing Units Built 1940 to 1949 76 3.57% Housing Units Built 1939 or Earlier 83 3.89% 2022 Est. Median Year Structure Built** 2004 Dominant Year Structure Built 2000 to 2009
- Ridgefield, WA Sitewise Online Pop-Facts: Demographic Snapshot (Part 2) Pop-Facts: Demographic Snapshot (Part 2) 21980800 - Ridgefield, WA 0 - 1 mi
21980800 - Ridgefield, WA Sitewise Online
Pop-Facts: Demographic Snapshot (Part 2)
Pop-Facts: Demographic Snapshot (Part 2)
Copyright © Claritas, LLC 2022. All rights reserved.
* This row intentionally left blank. No Total Category.
**1939 will appear when at least half of the Housing Units in this reports area were built in 1939 or earlier.
21980800 - Ridgefield, WA
0 - 1 mi
21980800 - Ridgefield, WA Sitewise Online Pop-Facts: Census Demographic Overview (Part 1) Pop-Facts: Census Demographic Overview (Part 1) 21980800 - Ridgefield, WA 0 - 1 mi Population 2027 Projection 6,548 2022 Estimate 6,086 2010 Census 3,849 2000 Census 2,369 Growth 2022-2027 7.60% Growth 2010-2022 58.13% Growth 2000-2010 62.45% 2010 Population by Single-Classification Race 3,849 White Alone 3,560 92.50% Black or African American Alone 33 0.87% American Indian and Alaska Native Alone 29 0.75% Asian Alone 73 1.91% Native Hawaiian and Other Pacific Islander Alone 5 0.13% Some Other Race Alone 37 0.97% Two or More Races 111 2.88% 2010 Population By Ethnicity 3,849 Not Hispanic or Latino 3,677 95.53% Hispanic or Latino 172 4.47% 2010 Hispanic or Latino by Single-Classification Race 172 White Alone 101 58.96% Black or African American Alone 1 0.83% American Indian and Alaska Native Alone 6 3.48% Asian Alone 5 2.80% Native Hawaiian and Other Pacific Islander Alone 0 0.00% Some Other Race Alone 36 21.11% Two or More Races 22 12.81% 2010 Population by Sex 3,849 Male 1,907 49.55% Female 1,942 50.45% Male/Female Ratio 0.98
21980800 - Ridgefield, WA Sitewise Online
Pop-Facts: Census Demographic Overview (Part 1)
Pop-Facts: Census Demographic Overview (Part 1)
21980800 - Ridgefield, WA 0 - 1 mi
2010 Population by Age 3,849 Age 0 to 4 320 8.31% Age 5 to 9 348 9.05% Age 10 to 14 387 10.06% Age 15 to 17 217 5.64% Age 18 to 20 113 2.93% Age 21 to 24 118 3.07% Age 25 to 34 518 13.47% Age 35 to 44 587 15.24% Age 45 to 54 529 13.76% Age 55 to 64 401 10.41% Age 65 to 74 190 4.95% Age 75 to 84 69 1.80% Age 85 and over 51 1.31% Age 16 and over 2,711 70.43% Age 18 and over 2,576 66.94% Age 21 and over 2,464 64.01% Age 65 and over 310 8.06% 2010 Median Age 33.12
21980800 - Ridgefield, WA Sitewise Online
Pop-Facts: Census Demographic Overview (Part 1)
Pop-Facts: Census Demographic Overview (Part 1)
Copyright © Claritas, LLC 2022. All rights reserved.
21980800 - Ridgefield, WA 0 - 1 mi
2010 Male Population by Age 1,907 Age 0 to 4 166 8.72% Age 5 to 9 186 9.78% Age 10 to 14 195 10.22% Age 15 to 17 112 5.86% Age 18 to 20 65 3.42% Age 21 to 24 61 3.22% Age 25 to 34 252 13.22% Age 35 to 44 275 14.42% Age 45 to 54 268 14.03% Age 55 to 64 189 9.90% Age 65 to 74 94 4.95% Age 75 to 84 27 1.40% Age 85 and over 16 0.86% 2010 Median Age, Male 31.65 2010 Female Population by Age 1,942 Age 0 to 4 153 7.90% Age 5 to 9 162 8.35% Age 10 to 14 192 9.90% Age 15 to 17 105 5.43% Age 18 to 20 48 2.45% Age 21 to 24 57 2.92% Age 25 to 34 266 13.71% Age 35 to 44 312 16.04% Age 45 to 54 262 13.49% Age 55 to 64 212 10.90% Age 65 to 74 96 4.95% Age 75 to 84 43 2.19% Age 85 and over 34 1.76% 2010 Median Age, Female 34.52
21980800 - Ridgefield, WA Sitewise Online Pop-Facts: Census Demographic Overview (Part 2) Pop-Facts: Census Demographic Overview (Part 2) 21980800 - Ridgefield, WA 0 - 1 mi Households 2027 Projection 2,209 2022 Estimate 2,059 2010 Census 1,303 2000 Census 825 Growth 2022-2027 7.31% Growth 2010-2022 58.02% Growth 2000-2010 57.91% 2010 Households by Household Type 1,303 Family Households 1,052 80.72% Non-family Households 251 19.28% 2010 Group Quarters Population 0 2010 Hispanic or Latino Households 35 2.71% 2010 Households by Household Size 1,303 1-person 194 14.89% 2-person 407 31.23% 3-person 237 18.23% 4-person 261 20.04% 5-person 130 9.97% 6-person 46 3.57% 7-or-more-person 27 2.08%
21980800 - Ridgefield, WA Sitewise Online
Pop-Facts: Census Demographic Overview (Part 2)
Pop-Facts:
Copyright © Claritas, LLC 2022. All rights reserved.
21980800
2010 Households by Type and Presence of Children 1,303 Married-Couple Family, own children 444 34.05% Male Householder, own children 44 3.37% Female Householder, own children 100 7.66% Married-Couple Family, no own children 396 30.40% Male Householder, no own children 21 1.64% Female Householder, no own children 47 3.61% Non-family Households 251 19.28% 2010 Households by Presence of People Under Age 18 1,303 HH with 1 or More People Under Age 18: 627 48.14% Households with No People Under Age 18: 676 51.86% HH with 1 or More People Under Age 18: 627 Married-Couple Family 461 73.45% Other Family, Male Householder 52 8.29% Other Family, Female Householder 110 17.61% Nonfamily, Male Householder 3 0.56% Nonfamily, Female Householder 1 0.09% Households with No People Under Age 18: 676 Married-Couple Family 379 56.10% Other Family, Male Householder 13 1.96% Other Family, Female Householder 36 5.38% Nonfamily, Male Householder 116 17.22% Nonfamily, Female Householder 131 19.34% 2010 Occupied Housing Units by Tenure 1,303 Owner-Occupied 1,014 77.82% Renter-Occupied 289 22.18%
Census Demographic Overview (Part
2)
0 -
mi
- Ridgefield, WA
1
Powered by Sitewise Data Source: Kalibrate TrafficMetrix Traffic Listing 21980800 - Ridgefield, WA November 21, 2023 Map # Street Cross Street Dir. Volume Type/Year Dist. (mi) 1. Pioneer Street N 19th Ct E 5,572 Current Year 0.1 2. Pioneer Street S 2nd Pl E 3,655 Current Year 0.1 3. Old Pioneer Way Northridge Dr E 252 Published (1990) 0.3 4. S 9th Ave Highland St N 1,990 Current Year 0.4 5. Pioneer St S 9th Ave W 5,120 Current Year 0.4 6. S 9th Ave Pioneer St N 2,482 Current Year 0.5 7. Pioneer St N 9th Ave E 5,500 Published (1997) 0.5 8. Pioneer St S Cedar Ridge Dr W 4,557 Published (1998) 0.7 9. Pioneer St S 4th Ave E 3,799 Published (1992) 0.7 10. N 35th Pl Pioneer St S 3,333 Published (1988) 0.8 11. Pioneer Street S 2nd Pl E 3,129 Current Year 0.8