Neighborhood Profile Report
Customer Info Describe Data Area Profiled: Jones Farm Report Date: 05/21/2020
Number of Parcels: 150
Sales Dates: 10/01/1997 - 01/07/2020
Waterfront Parcels: 0
Parcels with Views: 0
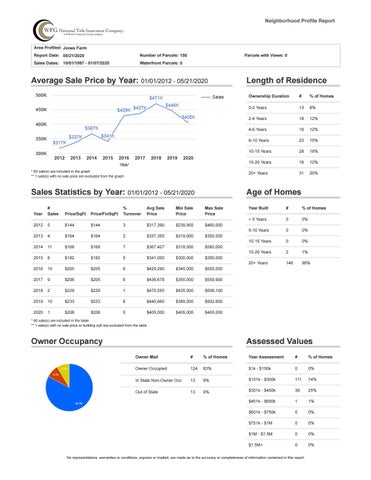
Average Sale Price by Year: 01/01/2012 - 05/21/2020
* 60 sale(s) are included in the graph ** 1 sale(s) with no sale price are excluded from the graph
Sales Statistics by Year: 01/01/2012 - 05/21/2020
Length of Residence Ownership Duration
#
% of Homes
0-2 Years
13
8%
2-4 Years
18
12%
4-6 Years
18
12%
6-10 Years
23
15%
10-15 Years
28
18%
15-20 Years
19
12%
20+ Years
31
20%
Age of Homes
Year
# Sales
Price/SqFt
Price/FinSqFt
% Turnover
Avg Sale Price
Min Sale Price
Max Sale Price
2012
5
$144
$144
3
$317,390
$239,950
$460,000
2013
4
$164
$164
2
$337,350
$319,000
$355,500
2014
11
$168
$168
7
$367,427
$318,000
$580,000
2015
8
$182
$182
5
$341,000
$300,000
$390,000
2016
10
$205
$205
6
$429,290
$345,000
$555,000
2017
9
$206
$205
6
$436,678
$355,000
$559,900
2018
2
$229
$229
1
$470,550
$435,000
$506,100
2019
10
$233
$233
6
$445,660
$389,000
$502,600
2020
1
$208
$208
0
$405,000
$405,000
$405,000
Year Built
#
% of Homes
< 5 Years
0
0%
5-10 Years
0
0%
10-15 Years
0
0%
15-20 Years
2
1%
20+ Years
148
99%
* 60 sale(s) are included in the table ** 1 sale(s) with no sale price or building sqft are excluded from the table
Owner Occupancy
Assessed Values Owner Mail
#
% of Homes
Year Assessment
#
% of Homes
Owner Occupied
124
83%
$1k - $150k
0
0%
In State Non-Owner Occ
13
9%
$151k - $300k
111
74%
Out of State
13
9%
$301k - $450k
38
25%
$451k - $600k
1
1%
$601k - $750k
0
0%
$751k - $1M
0
0%
$1M - $1.5M
0
0%
$1.5M+
0
0%
No representations, warranties or conditions, express or implied, are made as to the accuracy or completeness of information contained in this report.