INFORMATION
• Demographics

•
Traffic Counts


The information contained is provided by WFG’s Customer Service Department to our customers, and while deemed reliable, is not guaranteed.

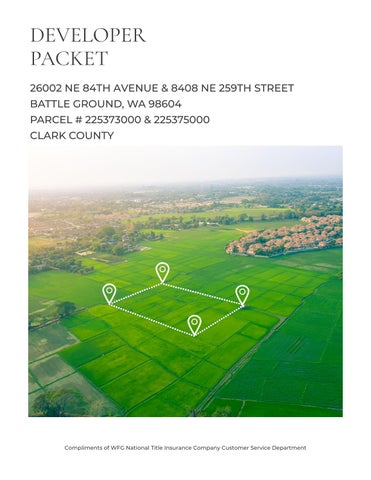
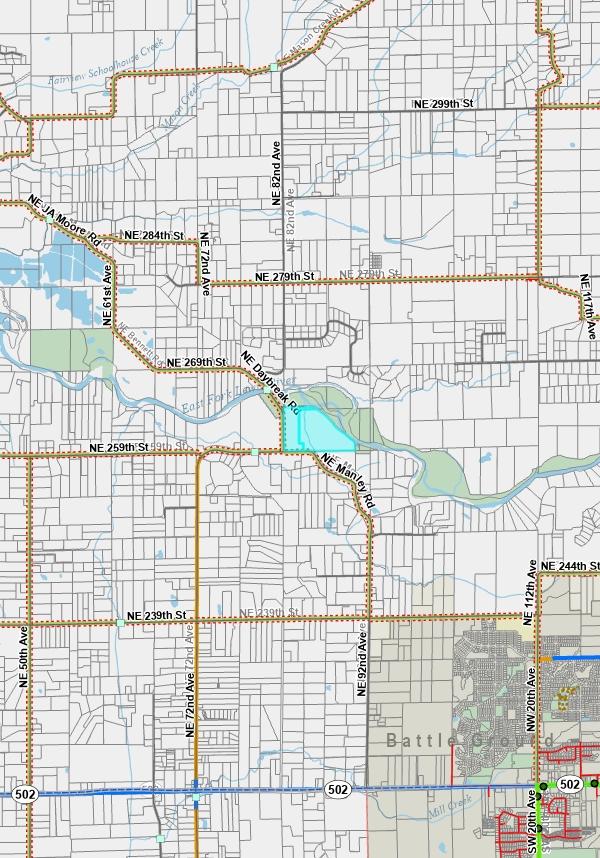
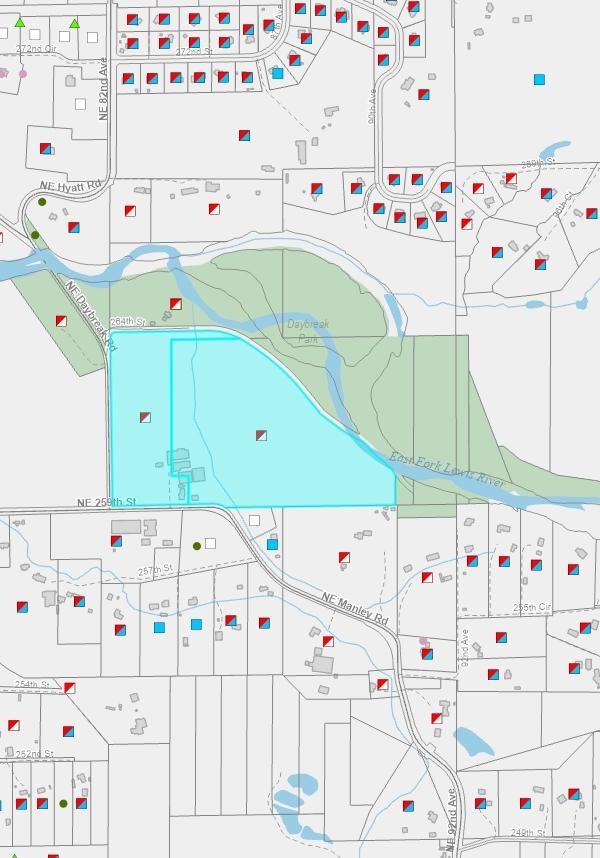
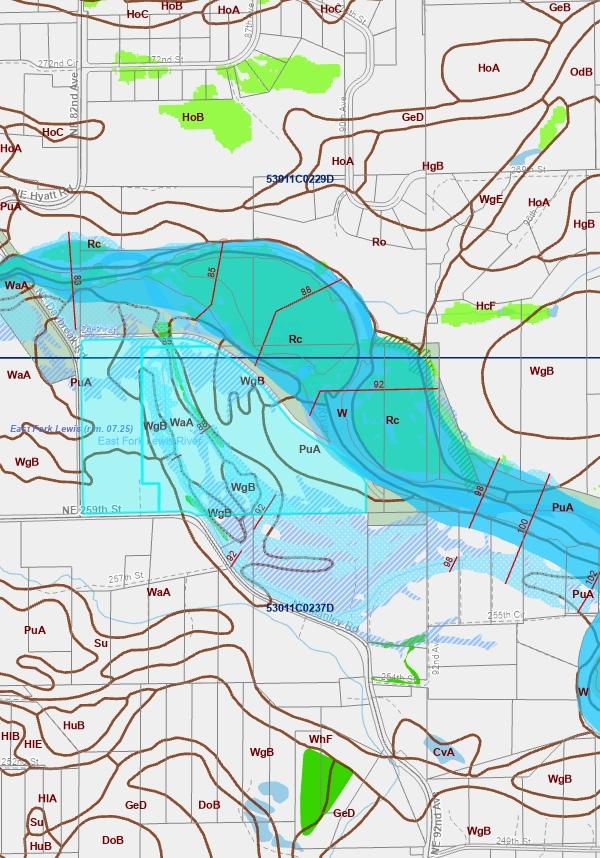
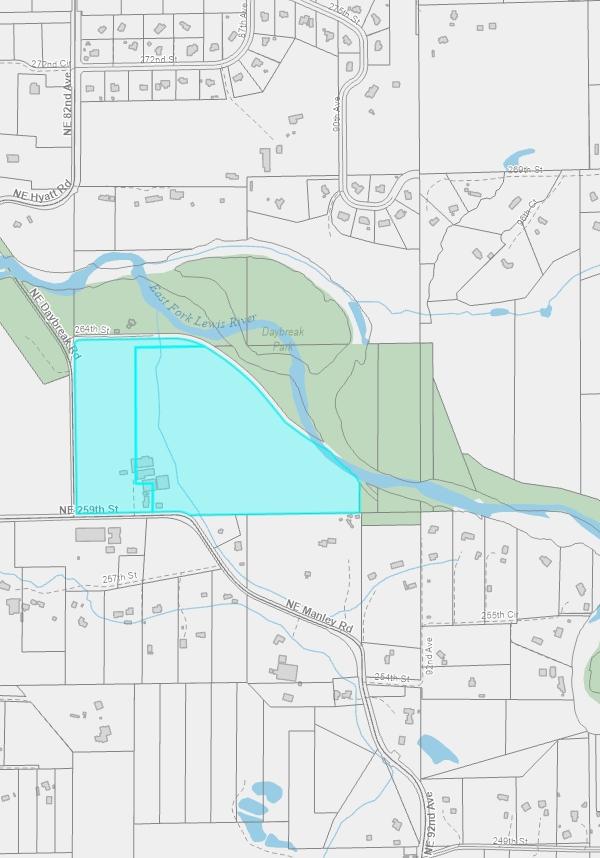
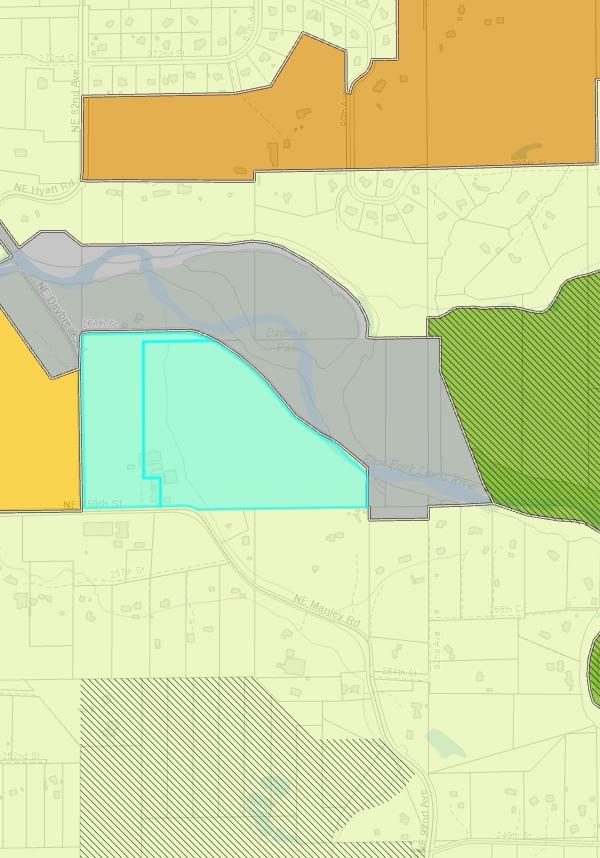
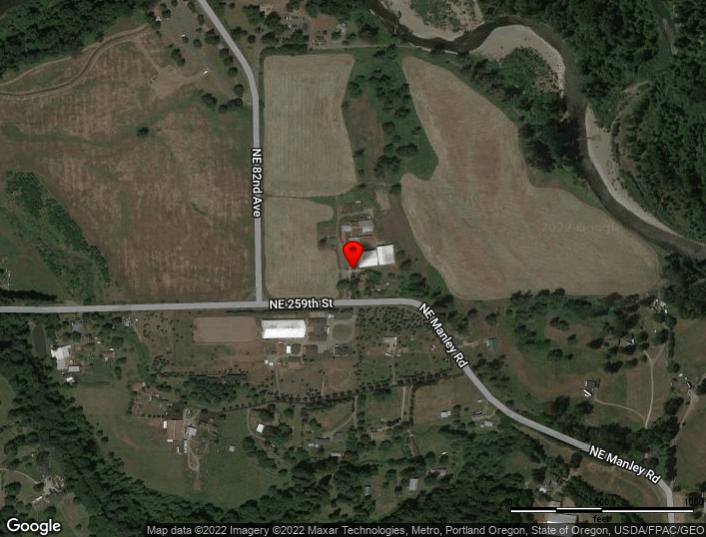
26002 NE 84th Ave, Battle Ground, WA 98604

26002 NE 84th Ave, Battle Ground, WA 98604
Sitewise Online
Pop-Facts: Population Quick Facts
Pop-Facts: Population Quick Facts
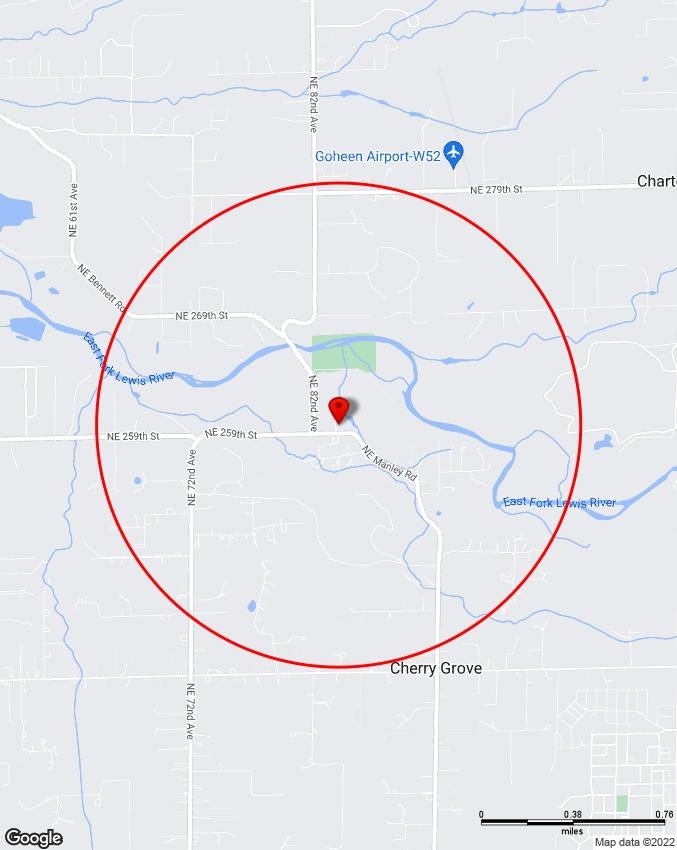
26002 NE 84th Ave, Battle Ground, WA 98604 0 - 1 mi
Population 2027 Projection 901
2022 Estimate 855 2010 Census 772 2000 Census 797
Growth 2022-2027 5.39% Growth 2010-2022 10.76% Growth 2000-2010 -3.17%
2022 Est. Population by Age
855
Age 0 to 4 38 4.43%
Age 5 to 9 42 4.95%
Age 10 to 14 45 5.29%
Age 15 to 17 32 3.80% Age 18 to 20 31 3.60% Age 21 to 24 47 5.45% Age 25 to 34 119 13.97%
Age 35 to 44 81 9.46% Age 45 to 54 97 11.31% Age 55 to 64 141 16.50% Age 65 to 74 121 14.15% Age 75 to 84 49 5.70% Age 85 and over 12 1.39%
Age 16 and over 719 84.07% Age 18 and over 697 81.54% Age 21 and over 666 77.94% Age 65 and over 182 21.24%
2022 Est. Median Age 44.00
2022 Est. Average Age 42.89
26002 NE 84th Ave, Battle Ground, WA 98604 Sitewise Online
Pop-Facts: Population Quick Facts
Pop-Facts: Population Quick Facts 26002 NE 84th Ave, Battle Ground, WA 98604 0 - 1 mi
White Alone 779 91.07%
Black or African American Alone 6 0.69%
American Indian and Alaska Native Alone 7 0.87% Asian Alone 15 1.81%
Native Hawaiian and Other Pacific Islander Alone 0 0.02%
Some Other Race Alone 17 2.02%
Two or More Races 30 3.53% 2022 Est. Population
4.44% Not Hispanic or Latino 817 95.56% 2022 Est. Population
Sex 855 Male 437 51.14% Female 418 48.86%
2022 Est. Population by Single-Classification Race 855
by Ethnicity (Hispanic or Latino) 855 Hispanic or Latino 38
by
Copyright © Claritas, LLC 2022. All rights reserved.
26002 NE 84th Ave, Battle Ground, WA 98604
Sitewise Online
Pop-Facts: Household Quick Facts 26002 NE 84th Ave, Battle Ground, WA 98604 0 - 1 mi
Growth 2022-2027 5.94% Growth 2010-2022 13.50% Growth 2000-2010 1.47% 2022
Income Less than $15,000 8 2.77% Income $15,000 to $24,999 7 2.48% Income $25,000 to $34,999 13 4.47% Income $35,000 to $49,999 27 9.05% Income $50,000 to $74,999 38 12.71% Income $75,000 to $99,999 45 15.08% Income $100,000 to $124,999 42 14.23% Income $125,000 to $149,999 37 12.55% Income $150,000 to $199,999 41 13.66% Income $200,000 to $249,999 18 6.08% Income $250,000 to $499,999 15 5.18% Income $500,000 or more 5 1.72%
51 17.27%
Pop-Facts: Household Quick Facts
Households 2027 Projection 315 2022 Estimate 297 2010 Census 262 2000 Census 258
Est. Households by Household Income
297
Est. Average Household Income $ 125,425 2022 Est. Median Household Income $ 106,026 2022 Median HH Inc. by Single-Classification Race White Alone $ 107,213 Black or African American Alone $ 107,912 American Indian and Alaska Native Alone $ 126,802 Asian Alone $ 22,877 Native Hawaiian and Other Pacific Islander Alone $ 42,500 Some Other Race Alone $ 118,839 Two or More Races $ 73,027 Hispanic or Latino $ 96,004 Not Hispanic or Latino $ 106,393 2022 Est. Households by Household Type 297 Family Households
Nonfamily Households
2022
246 82.73%
26002 NE 84th Ave, Battle Ground, WA 98604 Sitewise Online
Pop-Facts: Household Quick Facts
Pop-Facts: Household Quick Facts
26002 NE 84th Ave, Battle Ground, WA 98604 0 - 1 mi
2022 Est. Group Quarters Population 0
2022 Est. Households by Household Size 297
1-person 41 13.97% 2-person 120 40.51% 3-person 47 15.94% 4-person 46 15.58% 5-person 22 7.46% 6-person 11 3.57% 7-or-more-person 9 2.98%
2022 Est. Average Household Size 2.88
26002 NE 84th Ave, Battle Ground, WA 98604
Sitewise Online
Pop-Facts: Household Quick Facts
Pop-Facts: Household Quick Facts
26002 NE 84th Ave, Battle Ground, WA 98604 0 - 1 mi
2022 Est. HHs by Type by Presence of Own Children 246
Married-Couple Family, own children 83 33.77%
Married-Couple Family, no own children 135 54.75%
Male Householder, own children 4 1.56%
Male Householder, no own children 7 2.91%
Female Householder, own children 8 3.12%
Female Householder, no own children 10 3.88%
Copyright © Claritas, LLC 2022. All rights reserved.
Online
Demographic Snapshot
Demographic Snapshot
0
Projection
2022 Estimate
Census
Census
Growth
2022 Est. Population by Single-Classification Race
or African American Alone
and
Alone
2022 Est. Population Hispanic or Latino by Origin
Hispanic or Latino
or Latino
Hispanic or Latino by Origin
Other Hispanic or Latino
2022 Est. Hisp. or Latino Pop by Single-Classification Race 38
Alone
or African American Alone
Indian and Alaska Native Alone
Alone
and Other Pacific
Alone
Alone
26002 NE 84th Ave, Battle Ground, WA 98604 Sitewise
Pop-Facts:
(Part 1) Pop-Facts:
(Part 1) 26002 NE 84th Ave, Battle Ground, WA 98604
- 1 mi Population 2027
901
855 2010
772 2000
797 Growth 2022-2027 5.39% Growth 2010-2022 10.76%
2000-2010 -3.17%
855 White Alone 779 91.07% Black
6 0.69% American Indian
Alaska Native
7 0.87% Asian Alone 15 1.81% Native Hawaiian and Other Pacific Islander Alone 0 0.02% Some Other Race Alone 17 2.02% Two or More Races 30 3.53%
855 Not
817 95.56% Hispanic
38 4.44%
38 Mexican 28 73.90% Puerto Rican 1 3.46% Cuban 0 0.41% All
8 22.23%
White
21 55.44% Black
0 0.00% American
0 0.00% Asian
0 1.30% Native Hawaiian
Islander
0 0.00% Some Other Race
14 36.70% Two or More Races 2 6.56%
26002 NE 84th Ave, Battle Ground, WA 98604 Sitewise Online
Pop-Facts: Demographic Snapshot (Part 1)
Pop-Facts: Demographic Snapshot (Part 1)
26002 NE 84th Ave, Battle Ground, WA 98604 0 - 1 mi
2022 Est. Pop by Race, Asian Alone, by Category 15
Chinese, except Taiwanese 3 22.44%
Filipino 5 33.62% Japanese 0 0.00% Asian Indian 2 12.22% Korean 0 2.97%
Vietnamese 4 24.18% Cambodian 0 0.00% Hmong 0 0.00% Laotian 0 0.00% Thai 1 4.57%
All other Asian Races, including 2 or more 0 0.00%
2022 Est. Population by Ancestry 855
Arab 0 0.03% Czech 2 0.25% Danish 4 0.49% Dutch 10 1.17% English 71 8.33%
French (except Basque) 26 3.08% French Canadian 3 0.34%
German 146 17.13% Greek 4 0.48% Hungarian 3 0.33%
Irish 70 8.18%
Italian 20 2.39% Lithuanian 0 0.00%
Norwegian 42 4.91%
Polish 22 2.55%
Portuguese 4 0.46%
Russian 11 1.26% Scottish 14 1.68% Scotch-Irish 7 0.85% Slovak 0 0.00%
Subsaharan African 0 0.00% Swedish 30 3.52%
Swiss 7 0.77% Ukrainian 15 1.78%
United States or American 27 3.11%
Welsh 9 1.08%
West Indian (except Hisp. groups) 0 0.03%
Other Ancestries 188 22.00%
Ancestry Unclassified 118 13.79%
2022 Est. Pop Age 5+ by Language Spoken At Home 817
26002 NE 84th Ave, Battle Ground, WA 98604 Sitewise Online
Pop-Facts: Demographic Snapshot (Part 1)
Pop-Facts: Demographic Snapshot (Part 1)
26002 NE 84th Ave, Battle Ground, WA 98604 0 - 1 mi
Speak only English 751 91.86% Speak Asian or Pacific Island Language 6 0.79% Speak IndoEuropean Language 37 4.54% Speak Spanish 23 2.81% Speak Other Language 0 0.00%
2022 Est. Population by Sex
26002 NE 84th Ave, Battle Ground, WA 98604 Sitewise Online
Pop-Facts:
855
Male 437 51.14%
Female 418 48.86%
2022 Est. Population by Age
855
Age 0 to 4 38 4.43%
Age 5 to 9 42 4.95%
Age 10 to 14 45 5.29%
Age 15 to 17 32 3.80%
Age 18 to 20 31 3.60%
Age 21 to 24 47 5.45%
Age 25 to 34 119 13.97% Age 35 to 44 81 9.46% Age 45 to 54 97 11.31%
Age 55 to 64 141 16.50% Age 65 to 74 121 14.15%
Age 75 to 84 49 5.70% Age 85 and over 12 1.39%
Age 16 and over 719 84.07% Age 18 and over 697 81.54% Age 21 and over 666 77.94% Age 65 and over 182 21.24%
2022 Est. Median Age 44.00
2022 Est. Average Age 42.89
Pop-Facts: Demographic Snapshot (Part 1)
Demographic Snapshot (Part 1)
26002 NE 84th Ave, Battle Ground, WA 98604 0 - 1 mi
26002 NE 84th Ave, Battle Ground, WA 98604
Sitewise Online
Pop-Facts: Demographic Snapshot (Part 1)
Pop-Facts: Demographic Snapshot (Part 1)
26002 NE 84th Ave, Battle Ground, WA 98604 0 - 1 mi
2022 Est. Male Population by Age 437
Age 0 to 4 20 4.47%
Age 5 to 9 22 4.95%
Age 10 to 14 22 5.12%
Age 15 to 17 17 4.00%
Age 18 to 20 17 3.86%
Age 21 to 24 25 5.69%
Age 25 to 34 64 14.54%
Age 35 to 44 41 9.43%
Age 45 to 54 49 11.31%
Age 55 to 64 72 16.48%
Age 65 to 74 59 13.54%
Age 75 to 84 24 5.44%
Age 85 and over 5 1.18%
2022 Est. Median Age, Male 42.82
2022 Est. Average Age, Male 42.32
2022 Est. Female Population by Age 418
Age 0 to 4 18 4.39%
Age 5 to 9 21 4.94%
Age 10 to 14 23 5.47%
Age 15 to 17 15 3.59%
Age 18 to 20 14 3.33%
Age 21 to 24 22 5.19%
Age 25 to 34 56 13.38% Age 35 to 44 40 9.49%
Age 45 to 54 47 11.31%
Age 55 to 64 69 16.52%
Age 65 to 74 62 14.80% Age 75 to 84 25 5.98%
Age 85 and over 7 1.61%
2022 Est. Median Age, Female 45.19
2022 Est. Average Age, Female 43.49
26002 NE 84th Ave, Battle Ground, WA 98604 Sitewise Online
Pop-Facts: Demographic Snapshot (Part 1)
Pop-Facts: Demographic Snapshot (Part 1)
26002 NE 84th Ave, Battle Ground, WA 98604 0 - 1 mi
2022 Est. Pop Age 15+ by Marital Status 730
Total, Never Married 159 21.81% Males, Never Married 84 11.49% Females, Never Married 75 10.32%
Married, Spouse present 468 64.21% Married, Spouse absent 15 2.06% Widowed 24 3.34% Males, Widowed 3 0.37% Females, Widowed 22 2.97%
Divorced 63 8.58% Males, Divorced 33 4.46% Females, Divorced 30 4.12%
2022 Est. Pop Age 25+ by Edu. Attainment 620
Less than 9th grade 4 0.57% Some High School, no diploma 35 5.62% High School Graduate (or GED) 173 27.91% Some College, no degree 182 29.33% Associate Degree 74 11.96% Bachelor's Degree 117 18.87% Master's Degree 31 5.06% Professional School Degree 2 0.38% Doctorate Degree 2 0.31%
2022 Est. Pop. Age 25+ by Edu. Attain., Hisp./Lat. 22
No High School Diploma 6 25.61% High School Graduate 2 10.71% Some College or Associate's Degree 8 34.47% Bachelor's Degree or Higher 6 29.20%
Copyright © Claritas, LLC 2022. All rights reserved.
26002 NE 84th Ave, Battle Ground, WA
Sitewise Online Pop-Facts: Demographic Snapshot (Part 2) Pop-Facts: Demographic Snapshot (Part 2) 26002 NE 84th Ave, Battle Ground, WA 98604 0 - 1 mi Households 2027 Projection 315 2022 Estimate 297 2010 Census 262 2000 Census 258 Growth 2022-2027
Growth 2010-2022
Growth 2000-2010
2022 Est. Households by Household Type 297 Family Households 246
Nonfamily Households 51
2022 Est. Group Quarters Population 0 2022 HHs by Ethnicity: Hispanic/Latino 9
2022 Est. Households by HH Income 297 Income <
Income
2022 Est. Average Household Income $ 125,425 2022 Est. Median Household Income $ 106,026 2022 Median HH Income by Single-Class. Race or Ethn. White Alone $ 107,213 Black or African American Alone $ 107,912 American Indian and Alaska Native Alone $ 126,802 Asian Alone $ 22,877 Native Hawaiian and Other Pacific Islander Alone $ 42,500 Some Other Race Alone $ 118,839 Two or More Races $ 73,027
98604
5.94%
13.50%
1.47%
82.73%
17.27%
3.05%
$15,000 8 2.77%
$15,000 to $24,999 7 2.48% Income $25,000 to $34,999 13 4.47% Income $35,000 to $49,999 27 9.05% Income $50,000 to $74,999 38 12.71% Income $75,000 to $99,999 45 15.08% Income $100,000 to $124,999 42 14.23% Income $125,000 to $149,999 37 12.55% Income $150,000 to $199,999 41 13.66% Income $200,000 to $249,999 18 6.08% Income $250,000 to $499,999 15 5.18% Income $500,000+ 5 1.72%
26002 NE 84th Ave, Battle Ground, WA 98604 Sitewise Online
Pop-Facts: Demographic Snapshot (Part 2)
Pop-Facts: Demographic Snapshot (Part 2)
26002 NE 84th Ave, Battle Ground, WA 98604 0 - 1 mi
Hispanic or Latino $ 96,004
Not Hispanic or Latino $ 106,393
33.77%
54.75% Male Householder, own children 4 1.56% Male Householder, no own children 7 2.91% Female Householder, own children 8 3.12% Female Householder, no own children 10 3.88%
297 1-person 41 13.97% 2-person 120 40.51% 3-person 47 15.94% 4-person 46 15.58% 5-person 22 7.46% 6-person 11 3.57% 7-or-more-person 9 2.98%
4 4.21%
9 8.76%
1 0.74%
0 0.16%
7 3.45%
Est. Family HH Type by Presence of Own Children
2022
246
Married-Couple Family, own children 83
Est. Households by Household Size
Est. Average Household Size
2022 Est. Households by Presence of People Under 18
Households with 1 or more People under Age 18
Households with No People under Age 18
Households with 1 or more People under Age 18
Family
Other Family, Male Householder
Other Family, Female Householder
Nonfamily, Male Householder
Nonfamily, Female Householder
Households with No People under Age 18
Family
Other Family, Male Householder
Other Family, Female Householder
Male Householder
Female Householder
Online
Demographic Snapshot (Part 2)
Demographic Snapshot (Part 2)
Married-Couple Family, no own children 135
2022
2022
2.88
297
103 34.75%
194 65.25%
103 Married-Couple
89 86.13%
194 Married-Couple
129 66.33%
8 4.16% Nonfamily,
29 15.01% Nonfamily,
21 11.04% 26002 NE 84th Ave, Battle Ground, WA 98604 Sitewise
Pop-Facts:
Pop-Facts:
26002 NE 84th Ave, Battle Ground, WA 98604 0 - 1 mi
2022 Est. Households by Number of Vehicles 297 No Vehicles 4
1 Vehicle 35
2 Vehicles 93
3 Vehicles 91
4 Vehicles 49
5 or more Vehicles 25
2022 Est. Average Number of Vehicles 2.82 Family Households 2027 Projection 261 2022 Estimate 246 2010 Census 216 2000 Census 219 Growth 2022-2027
Growth 2010-2022
Growth 2000-2010
2022 Est. Families by Poverty Status 246 2022 Families at or Above Poverty 238
2022 Families at or Above Poverty with Children 102
2022 Families Below Poverty 7
2022 Families Below Poverty with Children 6
2022 Est. Pop Age 16+ by Employment Status 719 In Armed Forces 1 0.11% Civilian - Employed 422 58.77% Civilian - Unemployed 26
Not in Labor Force 269 37.49% 2022 Est. Civ. Employed Pop 16+ by Class of Worker 394 For-Profit Private Workers 270
Non-Profit Private Workers 20
Local Government Workers 41
State Government Workers 10
Federal Government Workers 12
Self-Employed Workers 39
Unpaid Family Workers 1
26002 NE 84th Ave, Battle Ground, WA 98604 Sitewise Online Pop-Facts: Demographic Snapshot (Part 2) Pop-Facts: Demographic Snapshot (Part 2) 26002 NE 84th Ave, Battle Ground, WA 98604 0 - 1 mi
1.47%
11.74%
31.45%
30.67%
16.39%
8.29%
6.08%
13.59%
-1.42%
96.98%
41.49%
3.02%
2.39%
3.63%
68.58%
4.96%
10.49%
2.63%
3.16%
10.02%
0.17%
Architect/Engineer 11 2.90%
Arts/Entertainment/Sports 6 1.65%
Building Grounds Maintenance 7 1.67% Business/Financial Operations 19 4.75% Community/Social Services 4 1.12%
Computer/Mathematical 11 2.86% Construction/Extraction 37 9.43% Education/Training/Library 19 4.79% Farming/Fishing/Forestry 5 1.28% Food Prep/Serving 18 4.67% Healthcare Practitioner/Technician 16 4.01% Healthcare Support 14 3.52% Maintenance Repair 17 4.41% Legal 1 0.17% Life/Physical/Social Science 4 0.93% Management 49 12.42% Office/Admin. Support 49 12.39% Production 15 3.93% Protective Service 12 3.12% Sales/Related 44 11.14% Personal Care/Service 7 1.69% Transportation/Moving 28 7.14%
2022 Est. Civ. Employed Pop 16+ by Occupation
394
2022 Est. Pop 16+ by Occupation Classification 394 Blue Collar
White Collar
Service & Farm
2022 Est. Workers Age 16+ by Transp. To Work 390 Drove Alone 309 79.21% Car Pooled 46
Public Transportation
Walked
Bicycle
Other Means
Worked at Home
2022 Est. Workers Age 16+ by Travel Time to Work* Less than 15 minutes 53 15 to 29 Minutes 110 30 to 44 Minutes 119 45 to 59 Minutes 40 60 or more Minutes 39 26002 NE 84th Ave, Battle Ground, WA 98604 Sitewise Online Pop-Facts: Demographic Snapshot (Part 2) Pop-Facts: Demographic Snapshot (Part 2) 26002 NE 84th Ave, Battle Ground, WA 98604
1 mi
98 24.91%
233 59.14%
63 15.96%
11.77%
2 0.48%
3 0.84%
0 0.01%
4 1.13%
26 6.55%
0 -
2022 Est. Avg. Travel Time to Work in Minutes* 34.26 2022 Est. Occupied Housing Units by Tenure 297 Owner-Occupied 256 86.32% Renter-Occupied 41 13.68% 2022 Occupied Housing Units: Avg. Length of Residence Owner-Occupied 14 Renter-Occupied 6 26002 NE 84th Ave, Battle Ground, WA 98604 Sitewise Online Pop-Facts: Demographic Snapshot (Part 2) Pop-Facts: Demographic Snapshot (Part 2) 26002 NE 84th Ave, Battle Ground, WA 98604 0 - 1 mi
Value Less than $20,000 2 0.89% Value $20,000 to $39,999 1 0.23%
Value $40,000 to $59,999 1 0.35% Value $60,000 to $79,999 0 0.19% Value $80,000 to $99,999 0 0.03% Value $100,000 to $149,999 0 0.03% Value $150,000 to $199,999 1 0.35%
Value $200,000 to $299,999 10 3.85% Value $300,000 to $399,999 40 15.63% Value $400,000 to $499,999 53 20.85% Value $500,000 to $749,999 84 32.66% Value $750,000 to $999,999 41 15.99% Value $1,000,000 to $1,499,999 16 6.30% Value $1,500,000 to $1,999,999 6 2.24% Value $2,000,000 or
1 0.39%
2022 Est. Owner Occupied Housing Units by Value 256
2022 Est. Median All Owner-Occupied Housing Unit Value $ 558,063 2022 Est. Housing Units by Units in Structure 314 1 Unit Attached
1 Unit Detached
2 Units
3 or 4 Units
5 to 19 Units
20 to 49 Units
50 or More Units 0 0.00% Mobile Home or Trailer 45 14.32% Boat, RV, Van, etc. 0 0.00% Dominant structure type 1 Unit Detached 2022 Est. Housing Units by Year Structure Built 314 Housing Units Built 2014 or Later 43
Housing Units Built 2010 to 2013
Housing Units Built 2000 to 2009
Housing Units Built 1990 to 1999
Units Built 1980 to 1989
Units Built 1970 to 1979
Units Built 1960 to 1969
Units Built 1950 to 1959
Units Built
to 1949
Housing Units Built 1939 or Earlier
2022 Est. Median Year Structure Built** 1995 26002 NE 84th Ave, Battle Ground, WA 98604 Sitewise Online Pop-Facts: Demographic Snapshot (Part 2) Pop-Facts: Demographic Snapshot (Part 2) 26002 NE 84th Ave, Battle Ground, WA 98604 0 - 1 mi
more
1 0.32%
268 85.36%
0 0.00%
0 0.00%
0 0.00%
0 0.00%
13.76%
12 3.91%
61 19.44%
75 23.73% Housing
35 11.23% Housing
42 13.46% Housing
12 3.73% Housing
14 4.52% Housing
1940
7 2.07%
13 4.14%
26002 NE 84th Ave, Battle Ground, WA 98604 Sitewise Online
Pop-Facts: Demographic Snapshot (Part 2)
Pop-Facts: Demographic Snapshot (Part 2)
26002 NE 84th Ave, Battle Ground, WA 98604 0 - 1 mi
Dominant Year Structure Built 1990 to 1999
Copyright © Claritas, LLC 2022. All rights reserved.
* This row intentionally left blank. No Total Category.
**1939 will appear when at least half of the Housing Units in this reports area were built in 1939 or earlier.
Battle
Online
Census Demographic Overview
Census Demographic Overview (Part 1)
0
2027 Projection
2022 Estimate
2010 Census
Population by Single-Classification Race 772
Alone
2010 Population By Ethnicity
Not Hispanic or Latino
Hispanic or
2010 Hispanic or Latino by Single-Classification Race 27
Black or African American Alone
Indian and Alaska Native Alone
Alone
2010 Population by Sex
Male
Female
Male/Female Ratio
26002 NE 84th Ave,
Ground, WA 98604 Sitewise
Pop-Facts:
(Part 1) Pop-Facts:
26002 NE 84th Ave, Battle Ground, WA 98604
- 1 mi Population
901
855
772 2000 Census 797 Growth 2022-2027 5.39% Growth 2010-2022 10.76% Growth 2000-2010 -3.17% 2010
White Alone 718 92.99% Black or African American
3 0.44% American Indian and Alaska Native Alone 5 0.67% Asian Alone 10 1.30% Native Hawaiian and Other Pacific Islander Alone 0 0.01% Some Other Race Alone 12 1.57% Two or More Races 23 3.02%
772
745 96.52%
Latino 27 3.48%
White Alone 15 54.96%
0 0.00% American
0 0.16% Asian Alone 0 1.84% Native Hawaiian and Other Pacific Islander
0 0.00% Some Other Race Alone 10 35.39% Two or More Races 2 7.64%
772
398 51.58%
374 48.42%
1.07
26002 NE 84th Ave, Battle Ground, WA 98604
Sitewise Online
Pop-Facts: Census Demographic Overview (Part 1)
Pop-Facts: Census Demographic Overview (Part 1)
26002 NE 84th Ave, Battle Ground, WA 98604 0 - 1 mi
2010 Population by Age 772
Age 0 to 4 39 5.09%
Age 5 to 9 51 6.61%
Age 10 to 14 67 8.74%
Age 15 to 17 38 4.96%
Age 18 to 20 31 4.05%
Age 21 to 24 28 3.66%
Age 25 to 34 61 7.96%
Age 35 to 44 97 12.60%
Age 45 to 54 143 18.46%
Age 55 to 64 122 15.81%
Age 65 to 74 61 7.91%
Age 75 to 84 23 3.03% Age 85 and over 9 1.11%
Age 16 and over 603 78.08%
Age 18 and over 576 74.61% Age 21 and over 545 70.56% Age 65 and over 93 12.06%
2010 Median Age 42.09
26002 NE 84th Ave, Battle Ground, WA 98604 Sitewise Online
Pop-Facts: Census Demographic Overview (Part 1)
Pop-Facts: Census Demographic Overview (Part 1)
26002 NE 84th Ave, Battle Ground, WA 98604 0 - 1 mi
2010 Male Population by Age 398
Age 0 to 4 19 4.84%
Age 5 to 9 28 7.02%
Age 10 to 14 36 9.12%
Age 15 to 17 21 5.38%
Age 18 to 20 17 4.16%
Age 21 to 24 15 3.83%
Age 25 to 34 31 7.69%
Age 35 to 44 50 12.51%
Age 45 to 54 73 18.27%
Age 55 to 64 62 15.47%
Age 65 to 74 32 7.99%
Age 75 to 84 12 2.98%
Age 85 and over 3 0.75%
2010 Median Age, Male 41.37
2010 Female Population by Age 374
Age 0 to 4 20 5.36%
Age 5 to 9 23 6.17%
Age 10 to 14 31 8.33%
Age 15 to 17 17 4.51%
Age 18 to 20 15 3.94%
Age 21 to 24 13 3.48%
Age 25 to 34 31 8.25%
Age 35 to 44 47 12.70%
Age 45 to 54 70 18.68%
Age 55 to 64 60 16.16%
Age 65 to 74 29 7.84%
Age 75 to 84 12 3.09%
Age 85 and over 6 1.50%
2010 Median Age, Female 42.84
Copyright
© Claritas, LLC 2022. All rights reserved.
26002 NE 84th Ave, Battle Ground, WA 98604 Sitewise Online
Pop-Facts: Census Demographic Overview (Part 2)
Pop-Facts:
1-person 35 13.40% 2-person 105 40.13% 3-person 41 15.75% 4-person 42 16.06% 5-person 21 7.84% 6-person 9 3.58% 7-or-more-person 8 3.24%
Census Demographic Overview (Part 2) 26002 NE 84th Ave, Battle Ground, WA 98604 0 - 1 mi
Household
Households
Household
Households 2027 Projection 315 2022 Estimate 297 2010 Census 262 2000 Census 258 Growth 2022-2027 5.94% Growth 2010-2022 13.50% Growth 2000-2010 1.47% 2010 Households by
Type 262 Family Households 216 82.67% Non-family Households 45 17.33% 2010 Group Quarters Population 0 2010 Hispanic or Latino
7 2.54% 2010 Households by
Size 262
Sitewise Online
Pop-Facts: Census Demographic Overview (Part 2)
Pop-Facts: Census Demographic Overview (Part 2) 26002 NE 84th Ave, Battle Ground, WA 98604 0 - 1 mi
Married-Couple Family, own children 73 27.88%
Male Householder, own children 3 1.32% Female Householder, own children 7 2.59%
Married-Couple Family, no own children 118 45.23% Male Householder, no own children 6 2.41% Female Householder, no own children 8 3.23%
Non-family Households 45 17.33%
34.87% Households with No People Under Age 18: 170 65.13%
HH with 1 or More People Under Age 18: 91
Married-Couple Family 78 85.96% Other Family, Male Householder 4 4.21% Other Family, Female Householder 8 8.85% Nonfamily, Male Householder 1 0.79% Nonfamily, Female Householder 0 0.18%
Households with No People Under Age 18: 170
Married-Couple Family 113 66.23% Other Family, Male Householder 6 3.48% Other Family, Female Householder 7 4.20% Nonfamily, Male Householder 26 15.06% Nonfamily, Female Householder 19 11.03%
Owner-Occupied 226 86.35% Renter-Occupied 36 13.65%
2010 Households by Type and Presence of Children 262
2010 Households by Presence of People Under Age 18 262
HH with 1 or More People Under Age 18: 91
2010 Occupied Housing Units by Tenure 262
Copyright © Claritas, LLC 2022. All rights reserved. 26002 NE 84th Ave, Battle Ground, WA 98604
26002 NE 84th Ave, Battle Ground, WA 98604
Sitewise Online
Retail Market Power Opportunity Gap Report By Retail Store Types
Retail Market Power Opportunity Gap Report
By Retail Store Types
26002 NE 84th Ave, Battle Ground, WA 98604 0 - 1 mi
2022 Demand 2022 Supply Opportunity Gap/Surplus
Total retail trade including food and drink (NAICS 44, 45 and 722) $ 14,301,482 $ 9,254,486 $ 5,046,995
Total retail trade (NAICS 44 and 45) $ 12,773,068 $ 8,841,027 $ 3,932,041
Motor vehicle and parts dealers (NAICS 441) $ 2,866,184 $ 863,567 $ 2,002,617
Automobile dealers (NAICS 4411) $ 2,376,462 $ 374,500 $ 2,001,962
New car dealers (NAICS 44111) $ 2,112,361 $ 374,500 $ 1,737,861
Used car dealers (NAICS 44112) $ 264,101 $ 0 $ 264,101
Other motor vehicle dealers (NAICS 4412) $ 287,354 $ 339,495 - $ 52,141
Recreational vehicle dealers (NAICS 44121) $ 117,146 $ 144,086 - $ 26,940
Motorcycle, boat, and other motor vehicle dealers (NAICS 44122) $ 170,208 $ 195,409 - $ 25,201
Boat dealers (NAICS 441222) $ 69,408 $ 12,858 $ 56,550 Motorcycle, ATV, and all other motor vehicle dealers (NAICS 441228) $ 100,800 $ 182,551 - $ 81,751
Automotive parts, accessories, and tire stores (NAICS 4413) $ 202,369 $ 149,572 $ 52,797
Automotive parts and accessories stores (NAICS 44131) $ 127,981 $ 68,965 $ 59,016
Tire dealers (NAICS 44132) $ 74,388 $ 80,607 - $ 6,219
Furniture and home furnishings stores (NAICS 442) $ 276,737 $ 0 $ 276,737
Furniture stores (NAICS 4421) $ 150,600 $ 0 $ 150,600
Home furnishings stores (NAICS 4422) $ 126,137 $ 0 $ 126,137
Floor covering stores (NAICS 44221) $ 61,702 $ 0 $ 61,702
Other home furnishings stores (NAICS 44229) $ 64,435 $ 0 $ 64,435
Window treatment stores (NAICS 442291) $ 3,160 $ 0 $ 3,160
All other home furnishings stores (NAICS 442299) $ 61,275 $ 0 $ 61,275
Electronics and appliance stores (NAICS 443) $ 170,317 $ 0 $ 170,317
Household appliance stores (NAICS 443141) $ 41,782 $ 0 $ 41,782
Electronics stores (NAICS 443142) $ 128,535 $ 0 $ 128,535
Building material and garden equipment and supplies dealers (NAICS 444) $ 1,047,797 $ 1,384,688 - $ 336,890
Building material and supplies dealers (NAICS 4441) $ 905,940 $ 1,114,959 - $ 209,020 Home centers (NAICS 44411) $ 500,046 $ 667,151 - $ 167,105
Paint and wallpaper stores (NAICS 44412) $ 30,718 $ 43,829 - $ 13,111
Hardware stores (NAICS 44413) $ 77,728 $ 68,341 $ 9,387
Other building material dealers (NAICS 44419) $ 297,448 $ 335,638 - $ 38,190
Lawn and garden equipment and supplies stores (NAICS 4442) $ 141,858 $ 269,729 - $ 127,871
Outdoor power equipment stores (NAICS 44421) $ 29,366 $ 0 $ 29,366
Nursery, garden center, and farm supply stores (NAICS 44422) $ 112,492 $ 269,729 - $ 157,237
Food and beverage stores (NAICS 445) $ 1,870,031 $ 829,412 $ 1,040,619 Grocery stores (NAICS 4451) $ 1,659,231 $ 789,350 $ 869,881
Supermarkets and other grocery (except convenience) stores (NAICS 44511) $ 1,593,669 $ 721,542 $ 872,126
Convenience stores (NAICS 44512) $ 65,562 $ 67,807 - $ 2,245
Specialty food stores (NAICS 4452) $ 48,146 $ 40,062 $ 8,084
26002 NE 84th Ave, Battle Ground, WA 98604
Sitewise Online
Retail Market Power Opportunity Gap Report By Retail Store Types
Retail Market Power Opportunity Gap Report
By Retail Store Types
26002 NE 84th Ave, Battle Ground, WA 98604 0 - 1 mi
2022 Demand 2022 Supply Opportunity Gap/Surplus
Meat markets (NAICS 44521) $ 14,545 $ 0 $ 14,545
Fish and seafood markets (NAICS 44522) $ 5,724 $ 702 $ 5,022
Fruit and vegetable markets (NAICS 44523) $ 10,014 $ 15,991 - $ 5,977
Other specialty food stores (NAICS 44529) $ 17,864 $ 23,369 - $ 5,505
Baked goods and confectionery and nut stores (NAICS 445291 + 445292) $ 9,480 $ 23,369 - $ 13,889
All other specialty food stores (NAICS 445299) $ 8,383 $ 0 $ 8,383
Beer, wine, and liquor stores (NAICS 4453) $ 162,654 $ 0 $ 162,654
Health and personal care stores (NAICS 446) $ 761,234 $ 0 $ 761,234
Pharmacies and drug stores (NAICS 44611) $ 659,947 $ 0 $ 659,947
Cosmetics, beauty supplies, and perfume stores (NAICS 44612) $ 44,522 $ 0 $ 44,522
Optical goods stores (NAICS 44613) $ 21,406 $ 0 $ 21,406
Other health and personal care stores (NAICS 44619) $ 35,358 $ 0 $ 35,358
Food (health) supplement stores (NAICS 446191) $ 12,515 $ 0 $ 12,515
All other health and personal care stores (NAICS 446199) $ 22,843 $ 0 $ 22,843
Gasoline stations (NAICS 447) $ 940,498 $ 69,176 $ 871,322
Clothing and clothing accessories stores (NAICS 448) $ 500,289 $ 0 $ 500,289
Clothing stores (NAICS 4481) $ 327,231 $ 0 $ 327,231
Men's clothing stores (NAICS 44811) $ 14,579 $ 0 $ 14,579
Women's clothing stores (NAICS 44812) $ 59,005 $ 0 $ 59,005
Children's and infants' clothing stores (NAICS 44813) $ 10,630 $ 0 $ 10,630
Family clothing stores (NAICS 44814) $ 196,138 $ 0 $ 196,138
Clothing accessories stores (NAICS 44815) $ 16,483 $ 0 $ 16,483
Other clothing stores (NAICS 44819) $ 30,397 $ 0 $ 30,397
Shoe stores (NAICS 4482) $ 68,113 $ 0 $ 68,113
Jewelry, luggage, and leather goods stores (NAICS 4483) $ 104,944 $ 0 $ 104,944
Jewelry stores (NAICS 44831) $ 69,897 $ 0 $ 69,897
Luggage and leather goods stores (NAICS 44832) $ 35,047 $ 0 $ 35,047
Sporting goods, hobby, musical instrument, and book stores (NAICS 451) $ 192,136 $ 0 $ 192,136
Sporting goods, hobby, and musical instrument stores (NAICS 4511) $ 173,115 $ 0 $ 173,115
Sporting goods stores (NAICS 45111) $ 124,886 $ 0 $ 124,886
Hobby, toy, and game stores (NAICS 45112) $ 34,659 $ 0 $ 34,659
Sewing, needlework, and piece goods stores (NAICS 45113) $ 6,613 $ 0 $ 6,613
Musical instrument and supplies stores (NAICS 45114) $ 6,956 $ 0 $ 6,956
Book stores and news dealers (NAICS 4512) $ 19,021 $ 0 $ 19,021
Book stores (NAICS 451211) $ 17,682 $ 0 $ 17,682
News dealers and newsstands (NAICS 451212) $ 1,339 $ 0 $ 1,339
General merchandise stores (NAICS 452) $ 1,613,930 $ 941,509 $ 672,420
Department stores (NAICS 4522) $ 202,301 $ 0 $ 202,301
Other general merchandise stores (NAICS 4523) $ 1,411,629 $ 941,509 $ 470,119
Warehouse clubs and supercenters (NAICS 452311) $ 1,273,744 $ 930,720 $ 343,024
All other general merchandise stores (NAICS 452319) $ 137,885 $ 10,789 $ 127,096
26002 NE 84th Ave, Battle Ground, WA 98604 Sitewise Online
Retail Market Power Opportunity Gap Report
Retail Market Power Opportunity Gap Report
By Retail Store Types
By Retail Store Types
26002 NE 84th Ave, Battle Ground, WA 98604 0 - 1 mi
2022 Demand 2022 Supply Opportunity Gap/Surplus
Miscellaneous store retailers (NAICS 453) $ 281,125 $ 51,937 $ 229,188
Florists (NAICS 4531) $ 14,469 $ 0 $ 14,469
Office supplies, stationery, and gift stores (NAICS 4532) $ 61,876 $ 0 $ 61,876
Office supplies and stationery stores (NAICS 45321) $ 26,781 $ 0 $ 26,781
Gift, novelty, and souvenir stores (NAICS 45322) $ 35,095 $ 0 $ 35,095
Used merchandise stores (NAICS 4533) $ 40,602 $ 0 $ 40,602
Other miscellaneous store retailers (NAICS 4539) $ 164,178 $ 51,937 $ 112,241
Pet and pet supplies stores (NAICS 45391) $ 46,866 $ 0 $ 46,866
Art dealers (NAICS 45392) $ 27,684 $ 0 $ 27,684
Manufactured (mobile) home dealers (NAICS 45393) $ 19,849 $ 0 $ 19,849
All other miscellaneous store retailers (NAICS 45399) $ 69,780 $ 51,937 $ 17,843
Tobacco stores (NAICS 453991) $ 16,010 $ 25,824 - $ 9,814
All other miscellaneous store retailers (except tobacco stores) (NAICS 453998) $ 53,769 $ 26,113 $ 27,657
Non-store retailers (NAICS 454) $ 2,252,791 $ 4,700,737 - $ 2,447,947
Electronic shopping and mail-order houses (NAICS 4541) $ 2,135,702 $ 4,700,737 - $ 2,565,035
Vending machine operators (NAICS 4542) $ 15,350 $ 0 $ 15,350
Direct selling establishments (NAICS 4543) $ 101,738 $ 0 $ 101,738
Fuel dealers (NAICS 45431) $ 49,399 $ 0 $ 49,399
Other direct selling establishments (NAICS 45439) $ 52,339 $ 0 $ 52,339
Food services and drinking places (NAICS 722) $ 1,528,414 $ 413,460 $ 1,114,954
Special food services (NAICS 7223) $ 121,984 $ 25,072 $ 96,912
Food service contractors (NAICS 72231) $ 96,536 $ 25,072 $ 71,464
Caterers (NAICS 72232) $ 23,186 $ 0 $ 23,186
Mobile food services (NAICS 72233) $ 2,262 $ 0 $ 2,262
Drinking places (alcoholic beverages) (NAICS 7224) $ 51,041 $ 8,138 $ 42,903
Restaurants and other eating places (NAICS 7225) $ 1,355,389 $ 380,250 $ 975,138
Full-service restaurants (NAICS 722511) $ 680,681 $ 187,031 $ 493,650
Limited-service restaurants (NAICS 722513) $ 572,523 $ 191,145 $ 381,378
Cafeterias, grill buffets, and buffets (NAICS 722514) $ 14,594 $ 2,074 $ 12,521
Snack and nonalcoholic beverage bars (NAICS 722515) $ 87,590 $ 0 $ 87,590
GAFO* $ 2,753,470 $ 941,509 $ 1,811,961
General Merchandise Stores-452 $ 1,613,930 $ 941,509 $ 672,420
Clothing & Clothing Accessories Stores-448 $ 500,289 $ 0 $ 500,289
Furniture & Home Furnishings Stores-442 $ 276,737 $ 0 $ 276,737
Electronics & Appliance Stores-443 $ 170,317 $ 0 $ 170,317
Sporting Goods, Hobby, Book, Music Stores-451 $ 192,136 $ 0 $ 192,136
Office Supplies, Stationery, Gift Stores-4532 $ 61,876 $ 0 $ 61,876
* GAFO (General merchandise, Apparel, Furniture and Other) represents sales at stores that sell merchandise normally sold in department stores. This category is not included in Total Retail Sales Including Eating and Drinking Places.
26002 NE 84th Ave, Battle Ground, WA 98604
Sitewise Online
Retail Market Power Opportunity Gap Report By Retail Store Types
Retail Market Power Opportunity Gap Report By Retail Store Types
Retail Market Power data is derived from two major sources of information. The demand data is derived from the Consumer Expenditure Survey (CE Survey or CEX), which is fielded by the U.S. Bureau of Labor Statistics (BLS). The supply data is derived from the Census of Retail Trade (CRT), which is made available by the U.S. Census. Additional data sources are incorporated to create both supply and demand estimates.
The difference between demand and supply represents the opportunity gap or surplus available for each merchandise line in the specified reporting geography. When this difference is positive (demand is greater than the supply), there is an opportunity gap for that merchandise line; when the difference is negative (supply is greater than demand), there is a surplus.
Copyright © 2022 Environics Analytics. All rights reserved.
26002 NE 84th Ave, Battle Ground, WA 98604 0 - 1 mi 2022 Demand 2022 Supply Opportunity Gap/Surplus
Powered by Sitewise Data Source: Kalibrate TrafficMetrix Traffic Listing 26002 NE 84th Ave, Battle Ground, WA 98604 December 14, 2022 Map # Street Cross Street Dir. Volume Type/Year Dist. (mi) 1. NE 259th St NE 72nd Ave SW 4,202 Current Year 0.5 2. NE 72nd Ave NE 259th St NE 3,881 Current Year 0.6 3. NE 259th St NE Septan Dr E 2,232 Current Year 0.7 4. NE 72nd Ave NE 251st St S 4,526 Current Year 0.7