Developers Packet


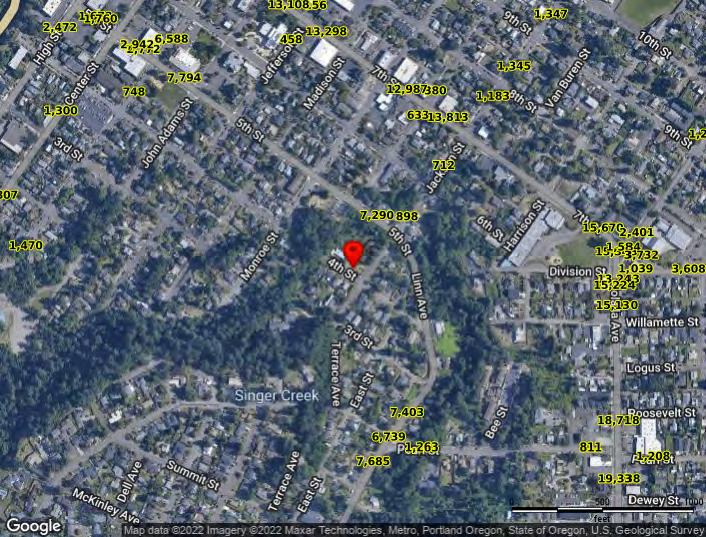
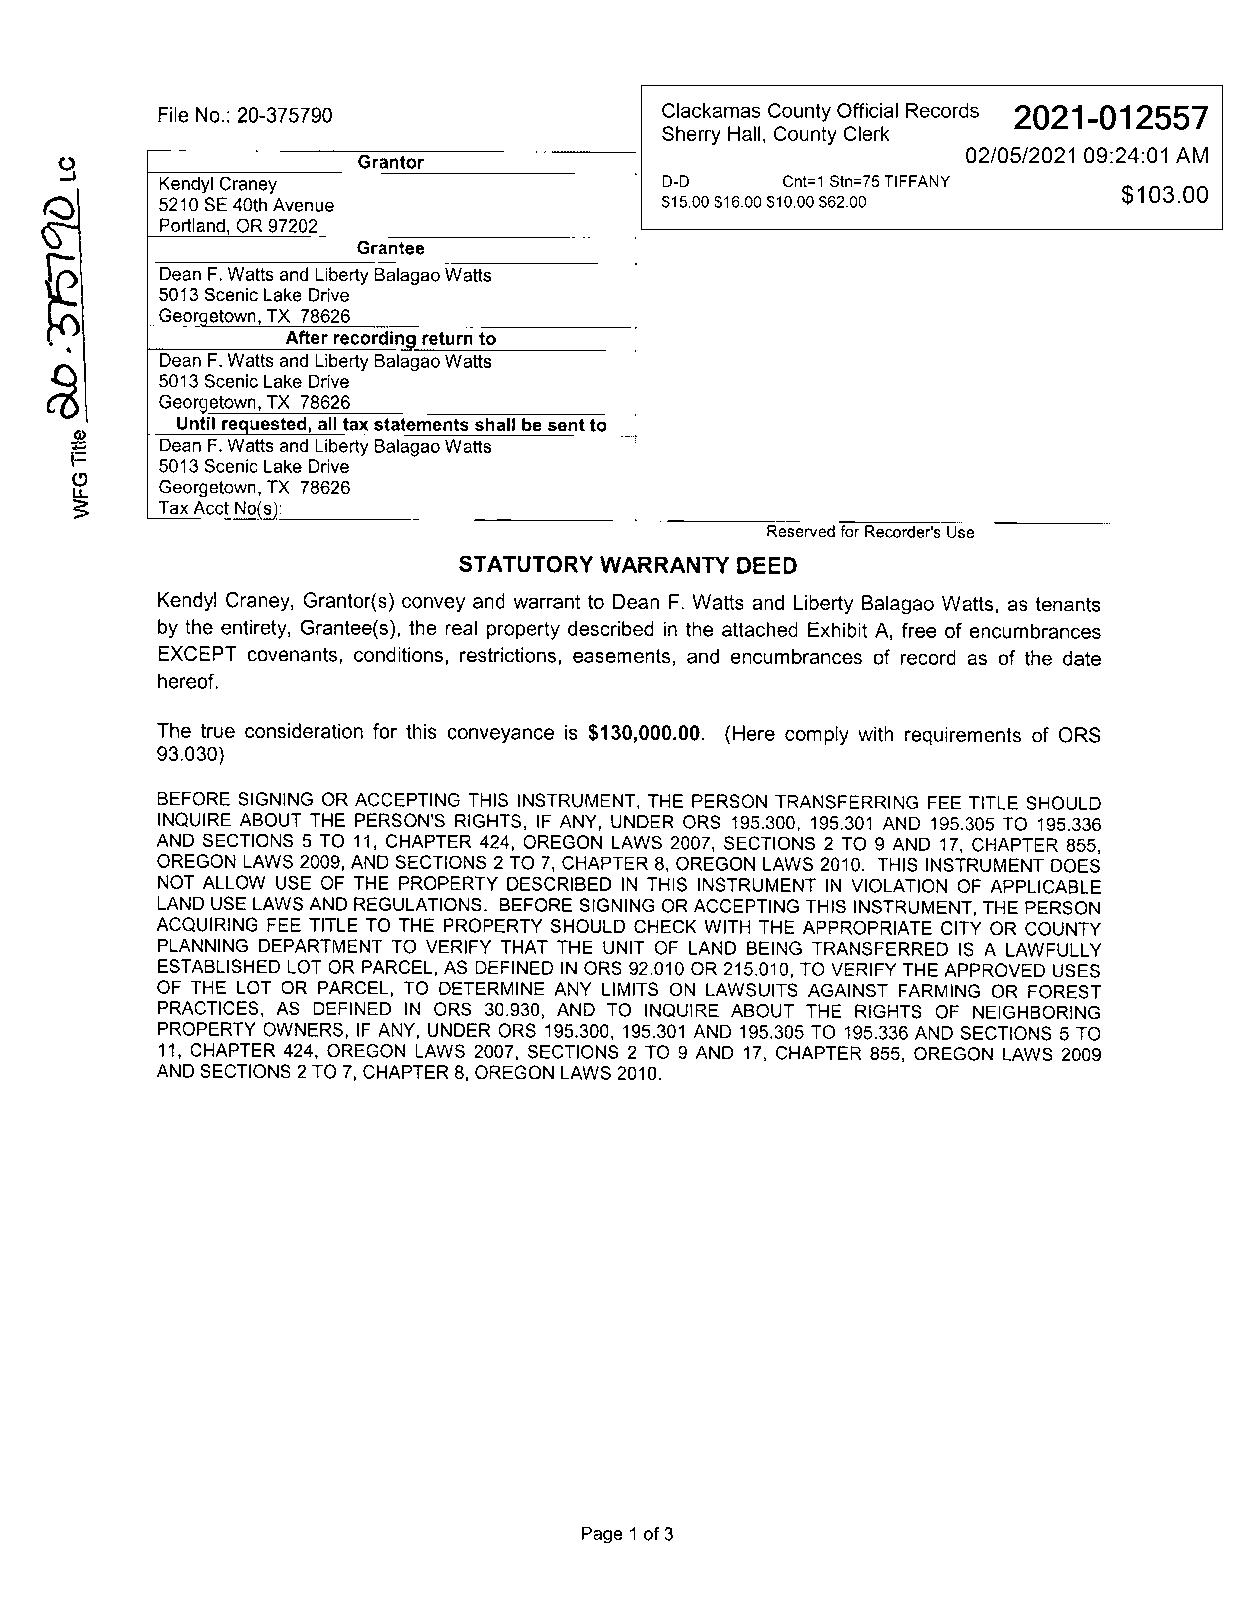
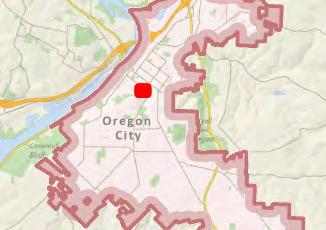
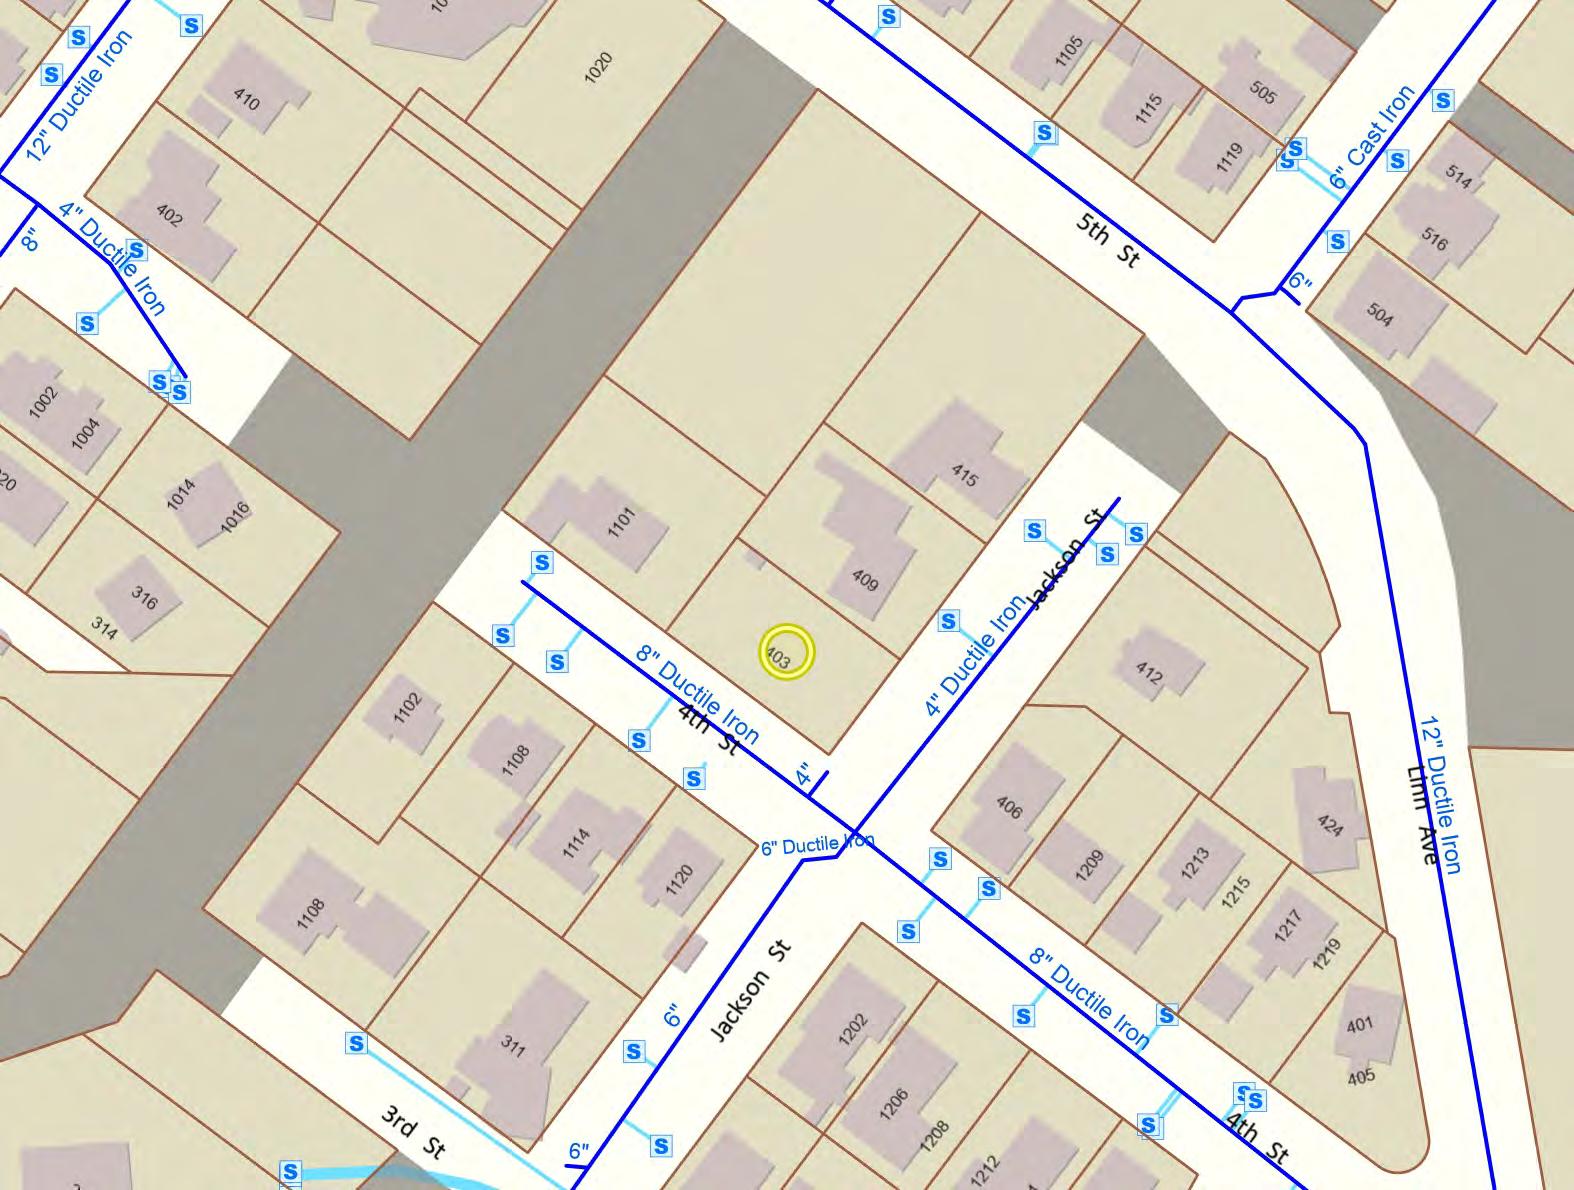
Subject Property 403 Jackson Street, Oregon City, OR 97045 Compliments of WFG Na onal Title Insurance Company Customer Service Department
Owner:DeanWatts&LibertyBalagao Site:403JacksonStOregonCityOR97045 Mail:320HighStOregonCityOR97045

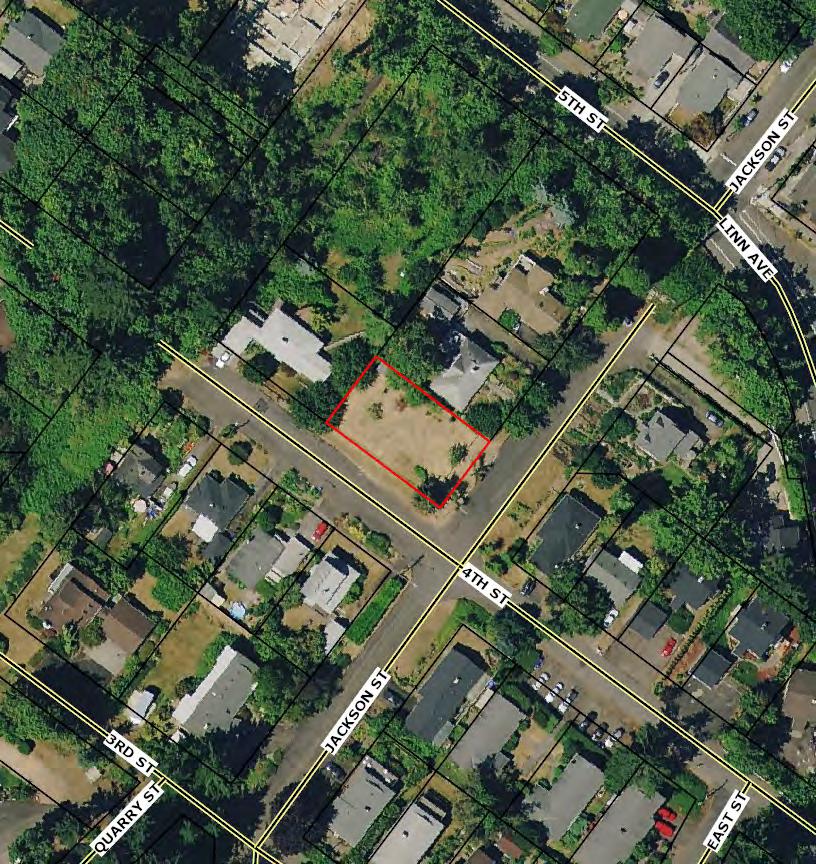
County: Clackamas LotSqFt: 6,604
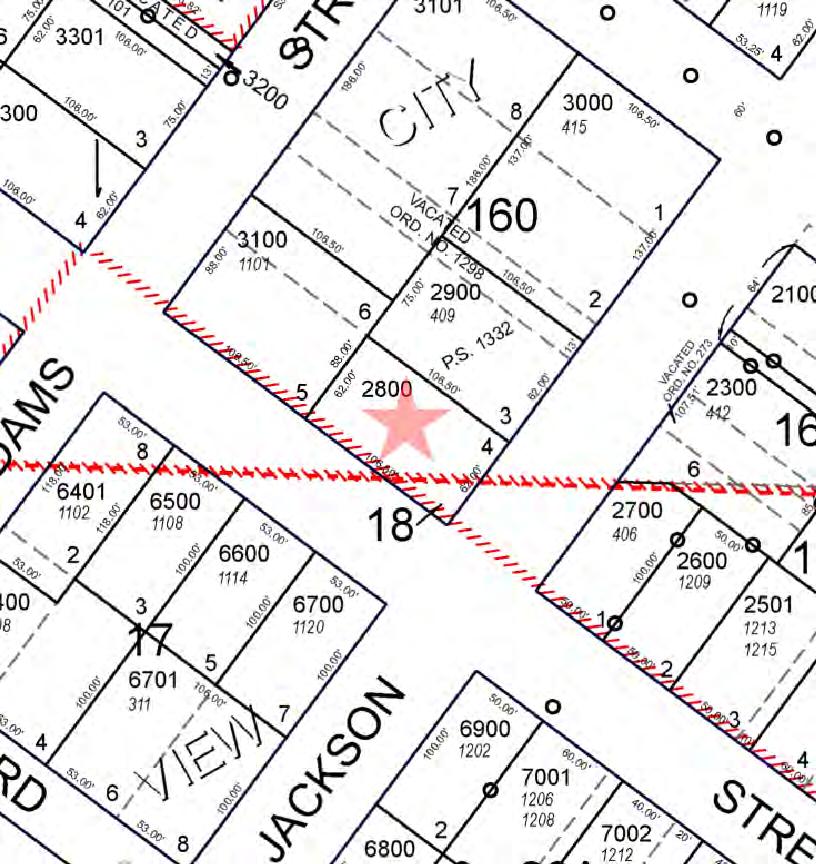
LegalDescription: 2OREGONCITYLT4BLK160LT18 FALLSVIEWADD|Y|185,979 LotAcres: 0.15
APN: 00578976
LandUse: 100-Residentialland,vacant TaxLot: 22E31DA02800 LandUseSTD: SingleFamilyResidence
Twn-Rng-Sec: 02S/02E/31/SE
CountyBldgUse: RSFR Neighborhood: Elyville #Dwellings: Subdivision: OregonCity MapPage/Grid: 717-C1
LegalLot/Block: 4/160
Zoning: OregonCity-R6
CensusTract/Block: 022500/4000 Watershed: AbernethyCreek-WillametteRiver
ElementarySchool: HOLCOMBELEMENTARYSCHOOL HighSchool: OREGONCITYSENIORHIGHSCHOOL
MiddleSchool: GARDINERMIDDLESCHOOL SchoolDistrict: OregonCity PropertyCharacteristics
TotalLivingArea:
Bedrooms:
YearBuilt/Eff:
FirstFloorSqFt: BathroomsTotal: Heating: SecondFloorSqFt: BathroomsFull/Half: Cooling: BasementFin/Unfin: Stories: Fireplace: AtticFin/Unfin: Foundation: Pool: GarageSqFt: RoofMaterial: Kitchen:
MarketTotal: $153,007.00
PropertyTax: $1,069.41 MarketLand: $153,007.00 Exemption: MarketStructure: MarketImproved%: AsssessmentYear: 2021 LevyCode: 062-002 AssessedTotal: $59,206.00 MillRate: 18.0625
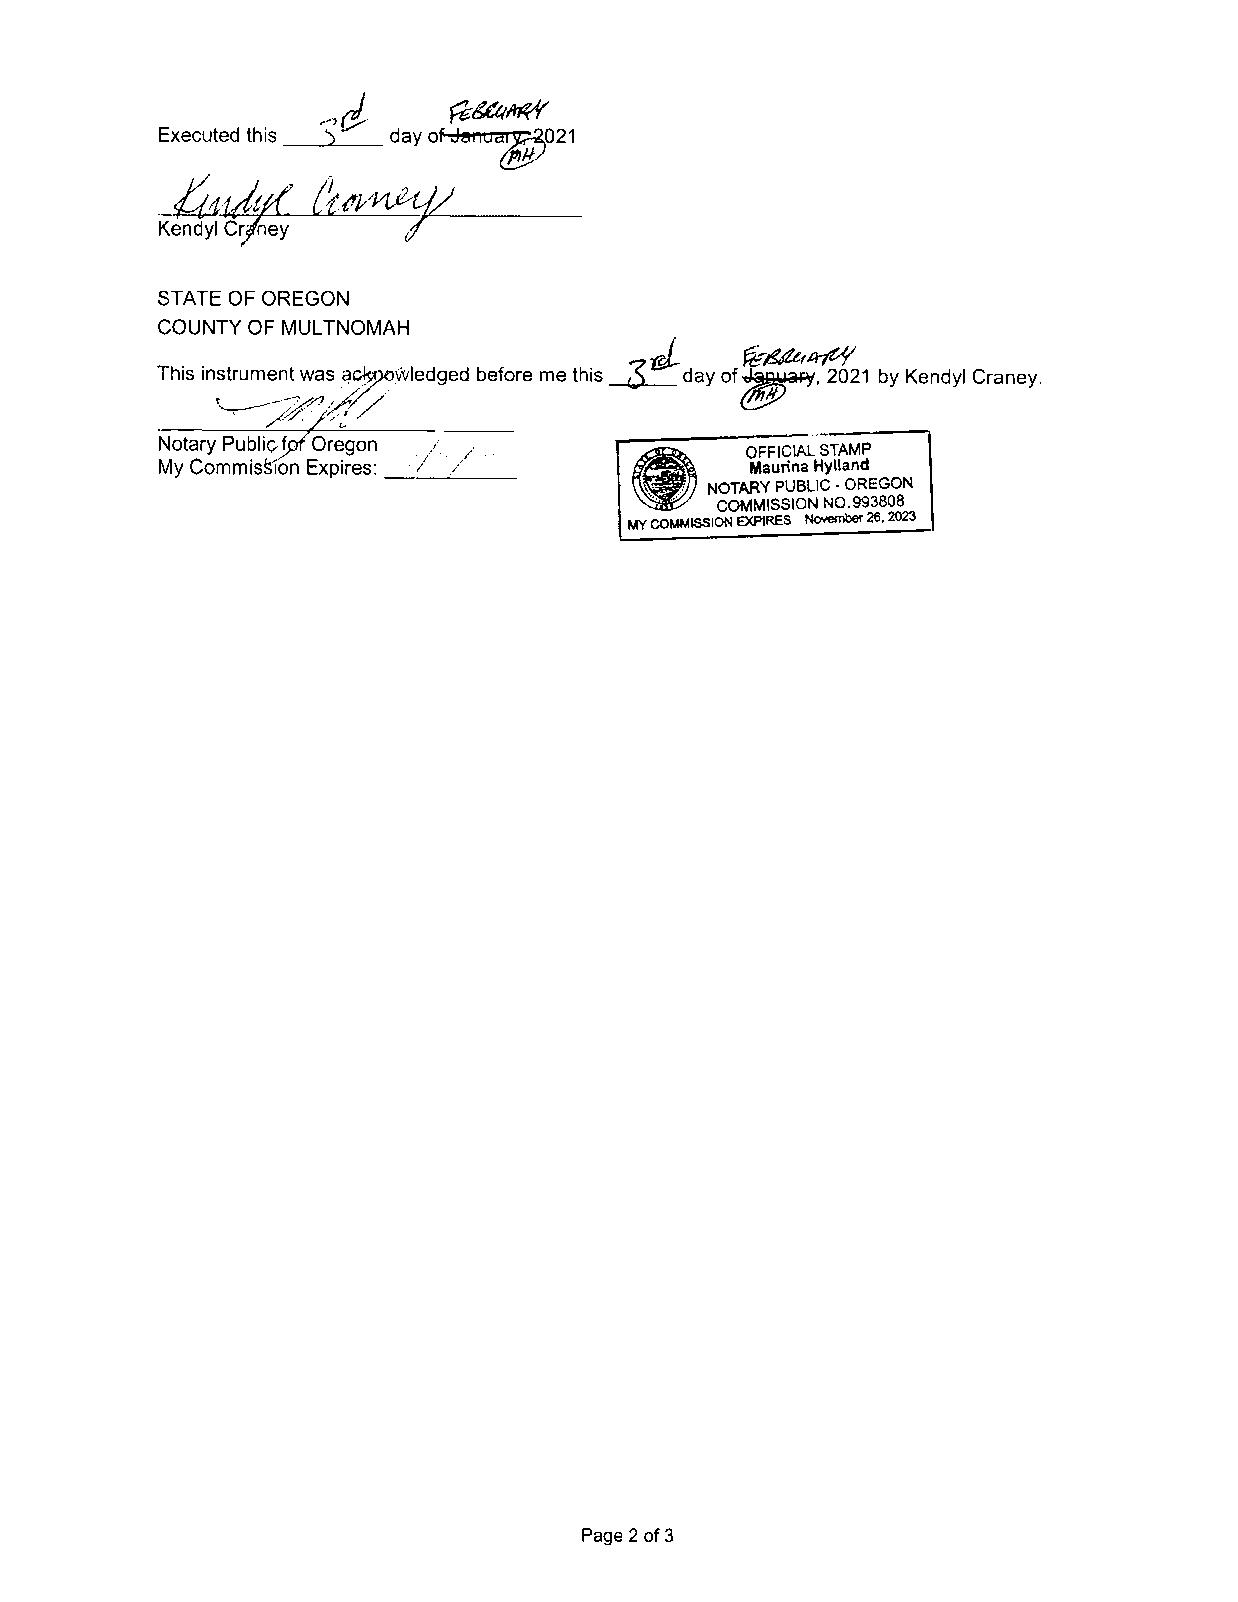
SaleDate: 02/05/2021
Lender: FIRSTTECHNOLOGYFCU SaleAmount: $130,000.00 LoanAmount: $91,000.00 Document#: 2021-012557 LoanType: Conventional DeedType: Deed Price/SqFt: $0.00 TitleCo: WFGTITLE SellerName: CRANEYKENDYL
PreparedBy:WFGNationalTitleCustomerServiceDepartment 12909SW68thPkwy,Suite350,Portland,OR97223 P:5036031700|3608915474E:cs@wfgnationaltitle.com|cccs@wfgtitle.com
SentryDynamics,Inc.anditscustomersmakenorepresentation,warrantiesorconditions,expressorimplied, astotheaccuracyorcompletenessofinformationcontainedinthisreport.


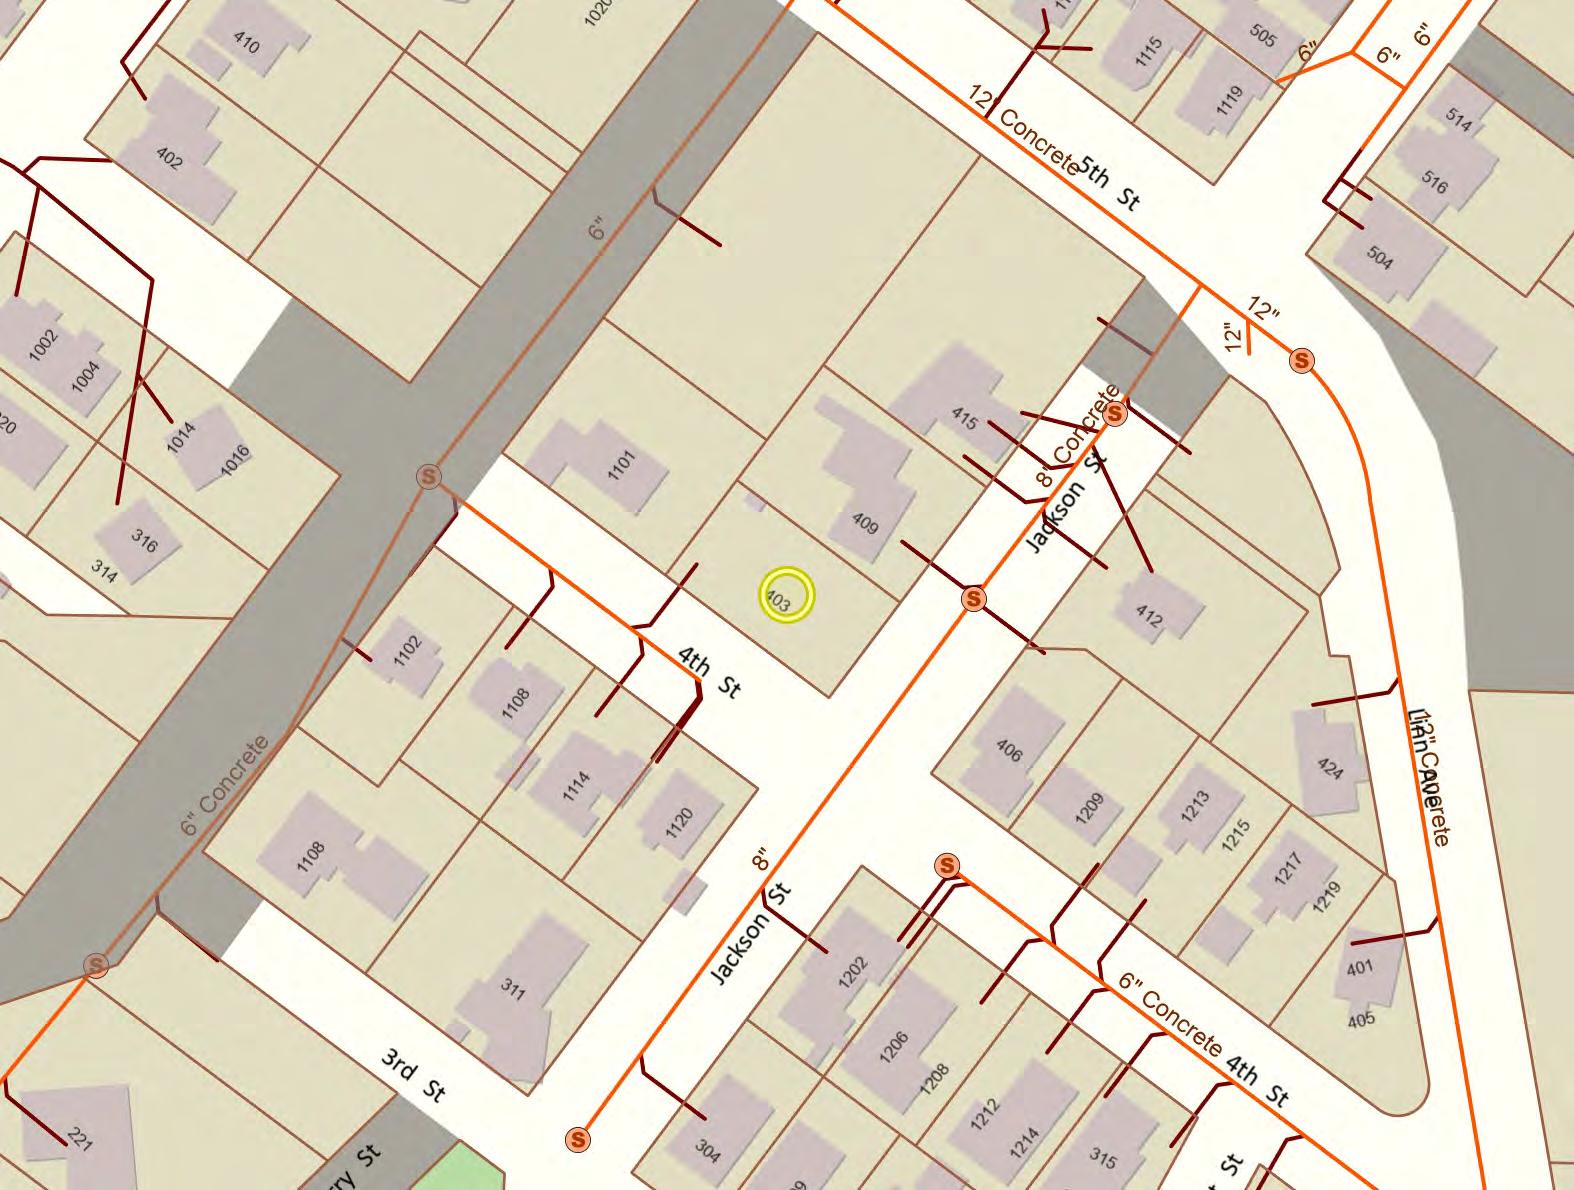
ParcelID:00578976 SiteAddress:403JacksonSt SentryDynamics,Inc.anditscustomersmakenorepresentations, warrantiesorconditions,expressorimplied,astotheaccuracyor completenessofinformationcontainedinthisreport.

City of Oregon City
City of Oregon City
The City of Oregon City makes no representations, express or implied, as to the accuracy, completeness and timeliness of the information displayed. This map is not suitable for legal, engineering, surveying or navigation purposes. Notification of any errors is appreciated.


10/19/2022Map created
The City of Oregon City makes no representations, express or implied, as to the accuracy, completeness and timeliness of the information displayed. This map is not suitable for legal, engineering, surveying or navigation purposes. Notification of any errors is appreciated.

10/19/2022Map created


St. John the Apostle School
Clackamas Academy of Industrial Sciences
West Linn Community Preschool Jackson Programs
Hera Community
Oregon City High Program Oregon City SD 62
SAGE Oregon City Preschool Inc.
Cascade Academics Northwest School of Success, Inc.
Eastham Community School
Crossroads Alternative School
SUNSET
Jackson St, Oregon City, OR
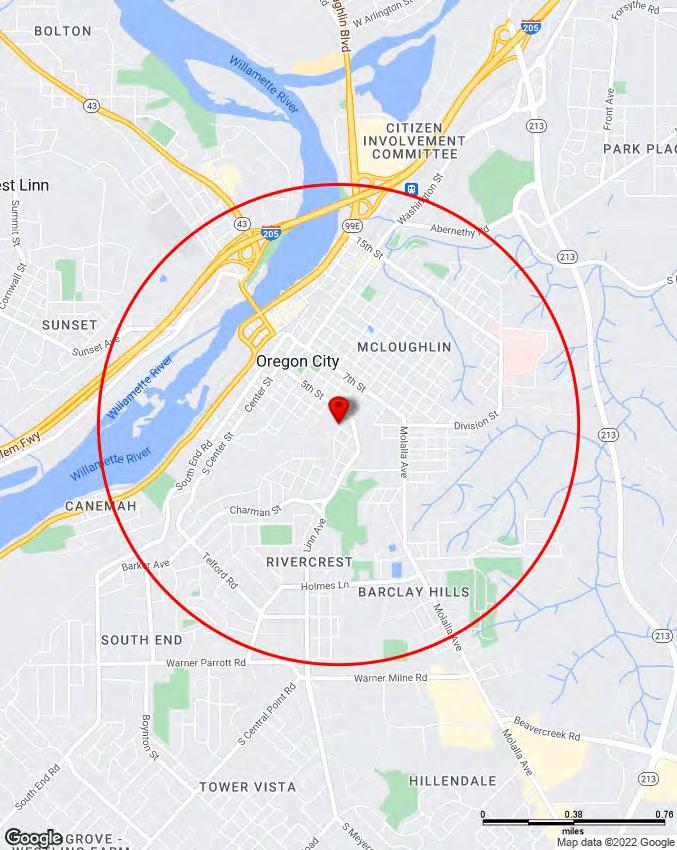

403 Jackson St, Oregon City, OR 97045 Sitewise Online
Pop-Facts: Population Quick Facts
Pop-Facts: Population Quick Facts
Population
403 Jackson St, Oregon City, OR 97045 0 - 1 mi
2027 Projection 10,996
2022 Estimate 10,702
2010 Census 10,157
2000 Census 10,368
Growth 2022-2027 2.75%
Growth 2010-2022 5.36%
Growth 2000-2010 -2.03%
2022 Est. Population by Age 10,702
Age 0 to 4 594 5.55%
Age 5 to 9 651 6.08%
Age 10 to 14 709 6.62%
Age 15 to 17 403 3.77%
Age 18 to 20 350 3.27%
Age 21 to 24 431 4.03%
Age 25 to 34 1,267 11.84%
Age 35 to 44 1,824 17.04%
Age 45 to 54 1,425 13.31% Age 55 to 64 1,214 11.34% Age 65 to 74 1,124 10.50% Age 75 to 84 457 4.27% Age 85 and over 253 2.37%
Age 16 and over 8,618 80.53% Age 18 and over 8,345 77.97% Age 21 and over 7,995 74.70% Age 65 and over 1,834 17.14%
2022 Est. Median Age 40.18
2022 Est. Average Age 40.26
403 Jackson St, Oregon City, OR 97045 Sitewise Online
Pop-Facts: Population Quick Facts
Pop-Facts: Population Quick Facts
2022 Est. Population by Single-Classification Race
403 Jackson St, Oregon City, OR 97045 0 - 1 mi
White Alone 9,583 89.55%
Black or African American Alone 64 0.60% American Indian and Alaska Native Alone 98 0.92%
Asian Alone 144 1.34%
Native Hawaiian and Other Pacific Islander Alone 32 0.30%
Some Other Race Alone 204 1.90% Two or More Races 577 5.39%
2022 Est. Population by Ethnicity (Hispanic or Latino) 10,702
Hispanic or Latino 846 7.91% Not Hispanic or Latino 9,856 92.09%
2022 Est. Population by Sex 10,702
Male 5,295 49.48%
Female 5,407 50.52%
Copyright © Claritas, LLC 2022. All rights reserved.
2022-2027
2010-2022
2000-2010
Income Less than $15,000 366 8.02%
Income $15,000 to $24,999 231 5.07%
Income $25,000 to $34,999 260 5.69%
Income $35,000 to $49,999 624 13.68%
Income $50,000 to $74,999 783 17.17%
Income $75,000 to $99,999 703 15.42%
Income $100,000 to $124,999 556 12.19%
Income $125,000 to $149,999 395 8.67%
Income $150,000 to $199,999 350 7.67%
Income $200,000 to $249,999 159 3.49%
Income $250,000 to $499,999 96 2.10% Income $500,000 or more 38 0.83%
403 Jackson St, Oregon City, OR 97045 Sitewise Online
Pop-Facts: Household Quick Facts
Pop-Facts: Household Quick Facts
403 Jackson St, Oregon City, OR 97045 0 - 1 mi
2022 Est. Households by Household Size 4,561
1-person 1,506 33.02%
2-person 1,481 32.47%
3-person 753 16.52%
4-person 498 10.91%
5-person 213 4.66% 6-person 79 1.73% 7-or-more-person 31 0.68%
2022 Est. Average Household Size 2.30
403 Jackson St, Oregon City, OR 97045
Pop-Facts: Household Quick Facts
Pop-Facts: Household Quick Facts
2022 Est. HHs by Type by Presence of Own Children
Jackson St, Oregon City, OR 97045
Married-Couple Family, own children 799 29.52%
Married-Couple Family, no own children 1,032 38.12%
Male Householder, own children 165 6.11%
Male Householder, no own children 109 4.03%
Female Householder, own children 359 13.28%
Female Householder, no own children 242 8.94%
Copyright © Claritas, LLC 2022. All rights reserved.
Pop-Facts:
(Part
(Part
2027
Growth 2022-2027
2010-2022
2000-2010 -2.03%
2022 Est. Population by Single-Classification Race
White Alone 9,583 89.55%
Black or African American Alone 64 0.60%
American Indian and Alaska Native Alone 98 0.92% Asian Alone 144 1.34%
Native Hawaiian and Other Pacific Islander Alone 32 0.30%
Some Other Race Alone 204 1.90%
Two or More Races 577 5.39%
2022 Est. Population Hispanic
Not Hispanic or Latino 9,856 92.09%
or Latino
or Latino by Origin
7.91%
78.02% Puerto Rican 40 4.70%
Mexican
All Other Hispanic or Latino
White Alone
Black or African American Alone
12 1.40%
15.88%
57.92%
1.59%
American Indian and Alaska Native Alone 29 3.42% Asian Alone 2 0.27%
Native Hawaiian and Other Pacific Islander Alone
0.35%
22.54% Two or More Races 118 13.90%
Some Other Race Alone
Jackson St, Oregon City, OR
Pop-Facts: Demographic Snapshot (Part
Pop-Facts: Demographic Snapshot (Part
Jackson St,
2022 Est. Pop by Race, Asian Alone, by Category 144
Chinese, except Taiwanese 33 23.03%
Filipino 4 2.94% Japanese 2 1.67%
Asian Indian 3 2.12% Korean 0 0.04% Vietnamese 69 47.77% Cambodian 9 6.39% Hmong 22 15.32% Laotian 1 0.70% Thai 0 0.00%
All other Asian Races, including 2 or more 0 0.01%
2022 Est. Population by Ancestry 10,702
Arab 10 0.09% Czech 30 0.28% Danish 53 0.49% Dutch 99 0.93% English 957 8.94% French (except Basque) 398 3.72% French Canadian 124 1.16% German 1,692 15.81% Greek 28 0.26% Hungarian 12 0.11% Irish 1,089 10.18% Italian 254 2.38% Lithuanian 15 0.14% Norwegian 205 1.92% Polish 51 0.48% Portuguese 46 0.43% Russian 55 0.52% Scottish 337 3.15% Scotch-Irish 107 1.00% Slovak 18 0.16% Subsaharan African 5 0.05% Swedish 200 1.87% Swiss 51 0.47% Ukrainian 50 0.47%
United States or American 710 6.64% Welsh 81 0.76%
West Indian (except Hisp. groups) 0 0.00%
Other Ancestries 2,432 22.73% Ancestry Unclassified 1,591 14.86%
2022 Est. Pop Age 5+ by Language Spoken At Home
403 Jackson St, Oregon City, OR 97045
Pop-Facts: Demographic Snapshot (Part 1)
Pop-Facts: Demographic Snapshot (Part 1)
403 Jackson St, Oregon City, OR 97045 0 - 1 mi
Speak only English 9,593 94.91%
Speak Asian or Pacific Island Language 76 0.75%
Speak IndoEuropean Language 133 1.31%
Speak Spanish 261 2.59%
Speak Other Language 44 0.44%
Jackson St,
Demographic
Pop-Facts:
(Part
(Part
2022 Est. Population by Sex
Male 5,295 49.48%
Female 5,407 50.52%
2022 Est. Population by Age
10,702
Age 0 to 4 594 5.55%
Age 5 to 9 651 6.08%
Age 10 to 14 709 6.62%
Age 15 to 17 403 3.77%
Age 18 to 20 350 3.27%
Age 21 to 24 431 4.03%
Age 25 to 34 1,267 11.84%
Age 35 to 44 1,824 17.04%
Age 45 to 54 1,425 13.31%
Age 55 to 64 1,214 11.34%
Age 65 to 74 1,124 10.50%
Age 75 to 84 457 4.27% Age 85 and over 253 2.37%
Age 16 and over 8,618 80.53%
Age 18 and over 8,345 77.97% Age 21 and over 7,995 74.70% Age 65 and over 1,834 17.14%
2022 Est. Median Age 40.18
Est. Average Age
403 Jackson St, Oregon City, OR 97045 Sitewise Online
Pop-Facts: Demographic Snapshot (Part 1)
Pop-Facts: Demographic Snapshot (Part 1)
403 Jackson St, Oregon City, OR 97045
- 1 mi
2022 Est. Male Population by Age 5,295
Age 0 to 4 301 5.68%
Age 5 to 9 332 6.28%
Age 10 to 14 355 6.70%
Age 15 to 17 205 3.87%
Age 18 to 20 183 3.46%
Age 21 to 24 229 4.32%
Age 25 to 34 637 12.03%
Age 35 to 44 928 17.53%
Age 45 to 54 742 14.00%
Age 55 to 64 605 11.43%
Age 65 to 74 503 9.50%
Age 75 to 84 196 3.71% Age 85 and over 79 1.50%
2022 Est. Median Age, Male 39.37
2022 Est. Average Age, Male 39.12
Age 0 to 4 294 5.43%
Age 5 to 9 319 5.90%
Age 10 to 14 354 6.54%
Age 15 to 17 198 3.66%
Age 18 to 20 167 3.08%
Age 21 to 24 202 3.74%
Age 25 to 34 630 11.65%
Age 35 to 44 896 16.57%
Age 45 to 54 683 12.63%
Age 55 to 64 609 11.26%
Age 65 to 74 621 11.48%
Age 75 to 84 261 4.82%
Age 85 and over 174 3.22%
2022 Est. Median Age, Female 41.03
2022 Est. Average Age, Female 41.36
403 Jackson St, Oregon City, OR 97045
Pop-Facts: Demographic Snapshot (Part 1)
Pop-Facts: Demographic Snapshot (Part 1)
Jackson St, Oregon City, OR
Total, Never Married 2,734 31.26%
Males, Never Married 1,622 18.54% Females, Never Married 1,113 12.72%
Married, Spouse present 3,708 42.39%
Married, Spouse absent 388 4.44%
Widowed 410 4.69% Males, Widowed 51 0.58% Females, Widowed 360 4.11%
Divorced 1,507 17.22% Males, Divorced 623 7.12% Females, Divorced 883 10.10%
Less than 9th grade 144 1.90%
Some High School, no diploma 451 5.96% High School Graduate (or GED) 2,180 28.83%
Some College, no degree 1,951 25.79%
Associate Degree 901 11.91%
Bachelor's Degree 1,322 17.48% Master's Degree 418 5.52% Professional School Degree 103 1.37% Doctorate Degree 94 1.24%
No High School Diploma 45 9.87%
High School Graduate 96 21.11%
Some College or Associate's Degree 189 41.60% Bachelor's Degree or Higher 125 27.42%
Copyright
< $15,000
$15,000 to $24,999
$25,000 to $34,999
$35,000 to $49,999
$50,000 to $74,999
$75,000 to $99,999
$100,000 to $124,999
$125,000 to $149,999
$150,000 to $199,999
$200,000 to $249,999
$250,000 to $499,999
$500,000+
8.02%
5.07%
5.69%
13.68%
17.17%
15.42%
12.19%
8.67%
7.67%
3.49%
2.10%
0.83%
403 Jackson St, Oregon City, OR 97045 Sitewise Online
Pop-Facts: Demographic Snapshot (Part 2)
Pop-Facts: Demographic Snapshot (Part 2)
403 Jackson St, Oregon City, OR 97045 0 - 1 mi
Hispanic or Latino $61,458 Not Hispanic or Latino $76,608
Type by
Married-Couple Family,
Married-Couple Family,
of Own
29.52%
1,032 38.12%
Male Householder, own children 165 6.11%
Male Householder, no own children 109 4.03%
Female Householder, own children 359 13.28%
Female Householder, no own children 242 8.94%
1-person 1,506 33.02%
1,481 32.47%
753 16.52%
498 10.91% 5-person 213 4.66% 6-person 79 1.73%
31 0.68%
Other
Other Family,
Nonfamily,
57.66%
12.60%
27.29%
1.87%
0.58%
Married-Couple
Other Family,
Family,
Female
31.86%
3.05%
6.58%
28.09%
30.42%
Architect/Engineer 133 2.33%
Arts/Entertainment/Sports 94 1.64%
Building Grounds Maintenance 207 3.64%
Business/Financial Operations 272 4.77%
Community/Social Services 158 2.78% Computer/Mathematical 176 3.08% Construction/Extraction 320 5.62% Education/Training/Library 286 5.02%
Farming/Fishing/Forestry 4 0.06% Food Prep/Serving 246 4.32% Healthcare Practitioner/Technician 288 5.05% Healthcare Support 220 3.86% Maintenance Repair 136 2.38% Legal 29 0.51% Life/Physical/Social Science 3 0.05% Management 543 9.53% Office/Admin. Support 625 10.96% Production 323 5.67% Protective Service 114 1.99% Sales/Related 674 11.83% Personal Care/Service 114 2.00% Transportation/Moving 736 12.91%
5.61%
3.28%
204 3.63%
8 0.15%
2.08%
7.49%
Value Less than $20,000
1.00%
Value $20,000 to $39,999 8 0.35%
Value $40,000 to $59,999 20 0.82%
Value $60,000 to $79,999 0 0.00% Value $80,000 to $99,999 1 0.05% Value $100,000 to $149,999 41 1.71% Value $150,000 to $199,999 35 1.46% Value $200,000 to $299,999 185 7.70%
Value $300,000 to $399,999 698 29.00% Value $400,000 to $499,999 742 30.82% Value $500,000 to $749,999 494 20.51%
Value $750,000 to $999,999 111 4.59% Value $1,000,000 to $1,499,999 37 1.56% Value $1,500,000 to $1,999,999 9 0.39% Value $2,000,000
2000
1980 to
1970 to
1960 to
1950
1 0.03%
5.95%
16.81%
5.18%
18.69%
8.08%
4.43%
403 Jackson St, Oregon City, OR 97045 Sitewise Online
Pop-Facts: Demographic Snapshot (Part 2)
Pop-Facts: Demographic Snapshot (Part 2)
Copyright © Claritas, LLC 2022. All rights reserved.
* This row intentionally left blank. No Total Category.
**1939 will appear when at least half of the Housing Units in this reports area were built in 1939 or earlier.
403 Jackson St, Oregon City, OR 97045 0 - 1 mi
403 Jackson St, Oregon City, OR
Online
Pop-Facts: Census Demographic Overview (Part 1)
403 Jackson St, Oregon City,
Population
2027 Projection 10,996
2022 Estimate 10,702 2010 Census 10,157 2000 Census 10,368
Growth 2022-2027 2.75%
Growth 2010-2022 5.36% Growth 2000-2010 -2.03%
10,157
White Alone 9,314 91.70%
Black or African American Alone 51 0.50%
American Indian and Alaska Native Alone 108 1.06% Asian Alone 108 1.07%
Native Hawaiian and Other Pacific Islander Alone 25 0.24%
Some Other Race Alone 183 1.80% Two or More Races 368 3.62%
Not Hispanic or Latino 9,472 93.25% Hispanic or Latino 686 6.75%
White Alone 389 56.68%
Black or African American Alone 10 1.52%
American Indian and Alaska Native Alone 27 4.00% Asian Alone 1 0.14%
Native Hawaiian and Other Pacific Islander Alone 2 0.29%
Some Other Race Alone 174 25.33%
Two or More Races 83 12.04%
10,157
Male 4,990 49.13%
Female 5,167 50.87%
Male/Female Ratio 0.97
2010 Population by Age
403 Jackson St, Oregon City, OR 97045 Sitewise Online
Pop-Facts: Census Demographic Overview (Part 1)
403 Jackson St, Oregon City, OR 97045 0 - 1 mi
10,157
Age 0 to 4 666 6.56%
Age 5 to 9 646 6.36%
Age 10 to 14 658 6.48%
Age 15 to 17 385 3.79%
Age 18 to 20 366 3.60%
Age 21 to 24 581 5.72%
Age 25 to 34 1,551 15.27%
Age 35 to 44 1,416 13.94%
Age 45 to 54 1,461 14.39%
Age 55 to 64 1,218 11.99%
Age 65 to 74 570 5.61%
Age 75 to 84 361 3.56% Age 85 and over 277 2.73%
Age 16 and over 8,061 79.37%
Age 18 and over 7,802 76.81%
Age 21 and over 7,436 73.21%
Age 65 and over 1,209 11.90%
2010 Median Age 36.59
403 Jackson St, Oregon City, OR 97045 Sitewise Online
403 Jackson St, Oregon City, OR 97045 0 - 1 mi
Age 0 to 4 334 6.68%
Age 5 to 9 322 6.45%
Age 10 to 14 341 6.84%
Age 15 to 17 187 3.75%
Age 18 to 20 210 4.20%
Age 21 to 24 306 6.14%
Age 25 to 34 788 15.79%
Age 35 to 44 729 14.61%
Age 45 to 54 739 14.81%
Age 55 to 64 568 11.39%
Age 65 to 74 255 5.11%
Age 75 to 84 129 2.58%
Age 85 and over 82 1.64%
2010 Median Age, Male 35.10
Age 0 to 4 332 6.43%
Age 5 to 9 324 6.27%
Age 10 to 14 317 6.13%
Age 15 to 17 198 3.83%
Age 18 to 20 156 3.03%
Age 21 to 24 274 5.31%
Age 25 to 34 763 14.77%
Age 35 to 44 687 13.30%
Age 45 to 54 722 13.98%
Age 55 to 64 649 12.57%
Age 65 to 74 315 6.10%
Age 75 to 84 233 4.51%
Age 85 and over 196 3.78%
2010 Median Age, Female 38.18
Pop-Facts:
St,
Demographic Overview (Part
Pop-Facts:
Overview (Part
Households
2027
4,140
2010-2022 10.16%
2000-2010 3.59%
2,470 59.67%
1,670 40.33%
4.75%
2010
by
Size
1-person 1,244 30.04%
1,369 33.07%
690 16.66%
490 11.83%
226 5.45%
77 1.85%
45 1.09%
Jackson St, Oregon City, OR
Married-Couple Family, own children 729 17.60%
Male Householder, own children 151 3.65%
Female Householder, own children 328 7.93%
Married-Couple Family, no own children 943 22.78%
Male Householder, no own children 100 2.42%
Female Householder, no own children 219 5.29%
Non-family Households 1,670 40.33%
2010 Households by Presence of People Under Age 18 4,140
HH with 1 or More People Under Age 18: 1,329 32.09%
Households with No People Under Age 18: 2,812 67.91%
HH with 1 or More People Under Age 18: 1,329
Married-Couple Family 767 57.75%
Other Family, Male Householder 167 12.55%
Other Family, Female Householder 361 27.18% Nonfamily, Male Householder 25 1.89% Nonfamily, Female Householder 8 0.63%
Households with No People Under Age 18: 2,812
Married-Couple Family 904 32.17%
Other Family, Male Householder 85 3.01%
Other Family, Female Householder 186 6.62%
Nonfamily, Male Householder 785 27.91%
Nonfamily, Female Householder 851 30.29%
2010 Occupied Housing Units by Tenure 4,140
Owner-Occupied 2,198 53.09%
Renter-Occupied 1,942 46.91%
403 Jackson St, Oregon City, OR 97045
Total retail trade including food and drink (NAICS 44, 45 and 722)
403 Jackson St, Oregon City, OR 97045 0 - 1 mi
2022 Demand 2022 Supply Opportunity Gap/Surplus
$218,395,972 $264,771,531 -$46,375,560
Total retail trade (NAICS 44 and 45) $194,495,454 $230,962,691 -$36,467,238
Motor vehicle and parts dealers (NAICS 441)
$44,007,462 $77,499,138 -$33,491,677
Automobile dealers (NAICS 4411) $36,969,805 $56,041,030 -$19,071,224
New car dealers (NAICS 44111) $32,857,345 $53,687,068 -$20,829,722
Used car dealers (NAICS 44112) $4,112,459 $2,353,962 $1,758,498
Other motor vehicle dealers (NAICS 4412) $3,969,289 $12,929,678 -$8,960,389
Recreational vehicle dealers (NAICS 44121) $1,562,388 $6,895,700 -$5,333,312
Motorcycle, boat, and other motor vehicle dealers (NAICS 44122) $2,406,901 $6,033,979 -$3,627,078
Boat dealers (NAICS 441222) $930,519 $663,133 $267,386
Motorcycle, ATV, and all other motor vehicle dealers (NAICS 441228)
$1,476,382 $5,370,846 -$3,894,463
Automotive parts, accessories, and tire stores (NAICS 4413) $3,068,368 $8,528,430 -$5,460,062
Automotive parts and accessories stores (NAICS 44131) $1,939,889 $3,215,736 -$1,275,847
Tire dealers (NAICS 44132) $1,128,479 $5,312,694 -$4,184,215
Furniture and home furnishings stores (NAICS 442) $3,940,723 $10,538,805 -$6,598,083
Furniture stores (NAICS 4421) $2,141,762 $3,616,033 -$1,474,272
Home furnishings stores (NAICS 4422) $1,798,962 $6,922,772 -$5,123,810
Floor covering stores (NAICS 44221) $864,273 $3,195,065 -$2,330,791
Other home furnishings stores (NAICS 44229) $934,688 $3,727,707 -$2,793,019
Window treatment stores (NAICS 442291) $ 47,287 $1,451,037 -$1,403,750
All other home furnishings stores (NAICS 442299) $887,401 $2,276,670 -$1,389,269
Electronics and appliance stores (NAICS 443)
$2,557,198 $3,810,474 -$1,253,275
Household appliance stores (NAICS 443141) $620,131 $ 38,980 $581,151
Electronics stores (NAICS 443142) $1,937,067 $3,771,494 -$1,834,427
Building material and garden equipment and supplies dealers (NAICS 444)
$14,276,048 $9,698,480 $4,577,568
Building material and supplies dealers (NAICS 4441) $12,314,906 $8,197,910 $4,116,996
Home centers (NAICS 44411) $6,816,596 $4,208,678 $2,607,918
Paint and wallpaper stores (NAICS 44412) $418,009 $1,814,322 -$1,396,313
Hardware stores (NAICS 44413) $1,086,256 $106,259 $979,997
Other building material dealers (NAICS 44419) $3,994,045 $2,068,652 $1,925,393
Lawn and garden equipment and supplies stores (NAICS 4442) $1,961,142 $1,500,571 $460,572
Outdoor power equipment stores (NAICS 44421) $399,492 $ 0 $399,492
Nursery, garden center, and farm supply stores (NAICS 44422) $1,561,650 $1,500,571 $ 61,079
Food and beverage stores (NAICS 445)
$29,154,833 $35,493,541 -$6,338,708
Grocery stores (NAICS 4451) $25,914,610 $34,286,551 -$8,371,940
Supermarkets and other grocery (except convenience) stores (NAICS 44511) $24,852,879 $28,775,153 -$3,922,273
Convenience stores (NAICS 44512)
$1,061,731 $5,511,398 -$4,449,667
Specialty food stores (NAICS 4452) $755,350 $ 0 $755,350
St,
City, OR
Meat markets (NAICS 44521) $228,499 $ 0 $228,499
Fish and seafood markets (NAICS 44522) $ 89,927 $ 0 $ 89,927
Fruit and vegetable markets (NAICS 44523) $156,572 $ 0 $156,572
Other specialty food stores (NAICS 44529) $280,352 $ 0 $280,352
Baked goods and confectionery and nut stores (NAICS 445291 + 445292) $148,786 $ 0 $148,786
All other specialty food stores (NAICS 445299) $131,566 $ 0 $131,566
Beer, wine, and liquor stores (NAICS 4453) $2,484,874 $1,206,991 $1,277,883
Health and personal care stores (NAICS 446)
$11,418,867 $10,070,806 $1,348,061
Pharmacies and drug stores (NAICS 44611) $9,922,243 $8,889,972 $1,032,271
Cosmetics, beauty supplies, and perfume stores (NAICS 44612) $663,482 $ 0 $663,482
Optical goods stores (NAICS 44613) $304,719 $ 12,406 $292,313
Other health and personal care stores (NAICS 44619) $528,422 $1,168,427 -$640,005
Food (health) supplement stores (NAICS 446191) $187,867 $727,483 -$539,616
All other health and personal care stores (NAICS 446199) $340,555 $440,944 -$100,389
Gasoline stations (NAICS 447)
Clothing and clothing accessories stores (NAICS 448)
$15,685,914 $38,800,723 -$23,114,807
$7,567,713 $5,360,831 $2,206,882
Clothing stores (NAICS 4481) $4,945,736 $2,994,128 $1,951,608
Men's clothing stores (NAICS 44811) $226,841 $112,987 $113,854
Women's clothing stores (NAICS 44812) $876,513 $1,227,658 -$351,145
Children's and infants' clothing stores (NAICS 44813) $168,010 $ 12,413 $155,596
Family clothing stores (NAICS 44814) $2,974,188 $1,367,070 $1,607,118
Clothing accessories stores (NAICS 44815) $244,813 $ 59,593 $185,219
Other clothing stores (NAICS 44819) $455,373 $214,407 $240,965
Shoe stores (NAICS 4482) $1,084,113 $1,127,212 -$43,099
Jewelry, luggage, and leather goods stores (NAICS 4483) $1,537,864 $1,239,490 $298,374
Jewelry stores (NAICS 44831) $996,618 $1,239,490 -$242,872
Luggage and leather goods stores (NAICS 44832) $541,246 $ 0 $541,246
Sporting goods, hobby, musical instrument, and book stores (NAICS 451) $2,990,175 $8,335,818 -$5,345,643
Sporting goods, hobby, and musical instrument stores (NAICS 4511) $2,696,806 $7,484,470 -$4,787,663
Sporting goods stores (NAICS 45111)
$1,957,989 $5,298,301 -$3,340,312
Hobby, toy, and game stores (NAICS 45112) $532,912 $1,426,311 -$893,399
Sewing, needlework, and piece goods stores (NAICS 45113) $ 92,216 $ 628 $ 91,588
Musical instrument and supplies stores (NAICS 45114)
$113,689 $759,229 -$645,540
Book stores and news dealers (NAICS 4512) $293,369 $851,349 -$557,980
Book stores (NAICS 451211) $272,349 $851,349 -$579,000
News dealers and newsstands (NAICS 451212) $ 21,019 $ 0 $ 21,019
General merchandise stores (NAICS 452)
$24,911,466 $10,517,269 $14,394,198
Department stores (NAICS 4522) $3,062,786 $ 18,866 $3,043,920
Other general merchandise stores (NAICS 4523) $21,848,680 $10,498,402 $11,350,277
Warehouse clubs and supercenters (NAICS 452311) $19,755,410 $10,049,432 $9,705,978
All other general merchandise stores (NAICS 452319) $2,093,269 $448,970 $1,644,299
St,
City,
Miscellaneous store retailers (NAICS 453) $4,253,616 $13,235,938 -$8,982,321
Florists (NAICS 4531) $197,134 $754,736 -$557,602
Office supplies, stationery, and gift stores (NAICS 4532) $922,255 $5,225,722 -$4,303,468
Office supplies and stationery stores (NAICS 45321) $387,296 $2,275,089 -$1,887,794
Gift, novelty, and souvenir stores (NAICS 45322) $534,959 $2,950,633 -$2,415,674
Used merchandise stores (NAICS 4533) $609,163 $3,991,781 -$3,382,618
Other miscellaneous store retailers (NAICS 4539) $2,525,064 $3,263,698 -$738,634
Pet and pet supplies stores (NAICS 45391) $755,424 $296,133 $459,291
Art dealers (NAICS 45392) $397,275 $ 44,713 $352,562
Manufactured (mobile) home dealers (NAICS 45393) $266,984 $1,747,588 -$1,480,603
All other miscellaneous store retailers (NAICS 45399) $1,105,382 $1,175,264 -$69,883
Tobacco stores (NAICS 453991) $323,272 $605,801 -$282,529
All other miscellaneous store retailers (except tobacco stores) (NAICS 453998) $782,109 $569,464 $212,646
Non-store retailers (NAICS 454)
$33,731,437 $7,600,870 $26,130,567
Electronic shopping and mail-order houses (NAICS 4541) $31,937,603 $7,595,896 $24,341,707
Vending machine operators (NAICS 4542) $241,308 $ 0 $241,308
Direct selling establishments (NAICS 4543) $1,552,527 $ 4,973 $1,547,553
Fuel dealers (NAICS 45431) $763,346 $ 1,194 $762,152
Other direct selling establishments (NAICS 45439) $789,181 $ 3,780 $785,401
Food services and drinking places (NAICS 722)
$23,900,518 $33,808,841 -$9,908,322
Special food services (NAICS 7223) $1,910,069 $1,688,408 $221,661
Food service contractors (NAICS 72231) $1,510,833 $299,165 $1,211,668
Caterers (NAICS 72232) $363,749 $1,172,760 -$809,011
Mobile food services (NAICS 72233) $ 35,488 $216,483 -$180,995
Drinking places (alcoholic beverages) (NAICS 7224) $777,179 $5,587,659 -$4,810,480
Restaurants and other eating places (NAICS 7225) $21,213,270 $26,532,774 -$5,319,503
Full-service restaurants (NAICS 722511) $10,618,855 $12,872,580 -$2,253,725
Limited-service restaurants (NAICS 722513) $8,989,657 $10,473,276 -$1,483,618
Cafeterias, grill buffets, and buffets (NAICS 722514) $229,150 $668,312 -$439,162
Snack and nonalcoholic beverage bars (NAICS 722515) $1,375,608 $2,518,606 -$1,142,999
GAFO*
$41,968,198 $38,568,423 $3,399,775
General Merchandise Stores-452 $24,911,466 $10,517,269 $14,394,198
Clothing & Clothing Accessories Stores-448 $7,567,713 $5,360,831 $2,206,882
Furniture & Home Furnishings Stores-442 $3,940,723 $10,538,805 -$6,598,083
Electronics & Appliance Stores-443
$2,557,198 $3,810,474 -$1,253,275
Sporting Goods, Hobby, Book, Music Stores-451 $2,990,175 $8,335,818 -$5,345,643
Office Supplies, Stationery, Gift Stores-4532 $922,255 $5,225,722 -$4,303,468
* GAFO (General merchandise, Apparel, Furniture and Other) represents sales at stores that sell merchandise normally sold in department stores. This category is not included in Total Retail Sales Including Eating and Drinking Places.
Jackson St, Oregon City, OR
Retail Market Power data is derived from two major sources of information. The demand data is derived from the Consumer Expenditure Survey (CE Survey or CEX), which is fielded by the U.S. Bureau of Labor Statistics (BLS). The supply data is derived from the Census of Retail Trade (CRT), which is made available by the U.S. Census. Additional data sources are incorporated to create both supply and demand estimates.
The difference between demand and supply represents the opportunity gap or surplus available for each merchandise line in the specified reporting geography. When this difference is positive (demand is greater than the supply), there is an opportunity gap for that merchandise line; when the difference is negative (supply is greater than demand), there is a surplus.
Copyright © 2022 Environics Analytics. All rights reserved.
Jackson St, Oregon City, OR