INFORMATION
• Demographics

•
Traffic Counts


The information contained is provided by WFG’s Customer Service Department to our customers, and while deemed reliable, is not guaranteed.

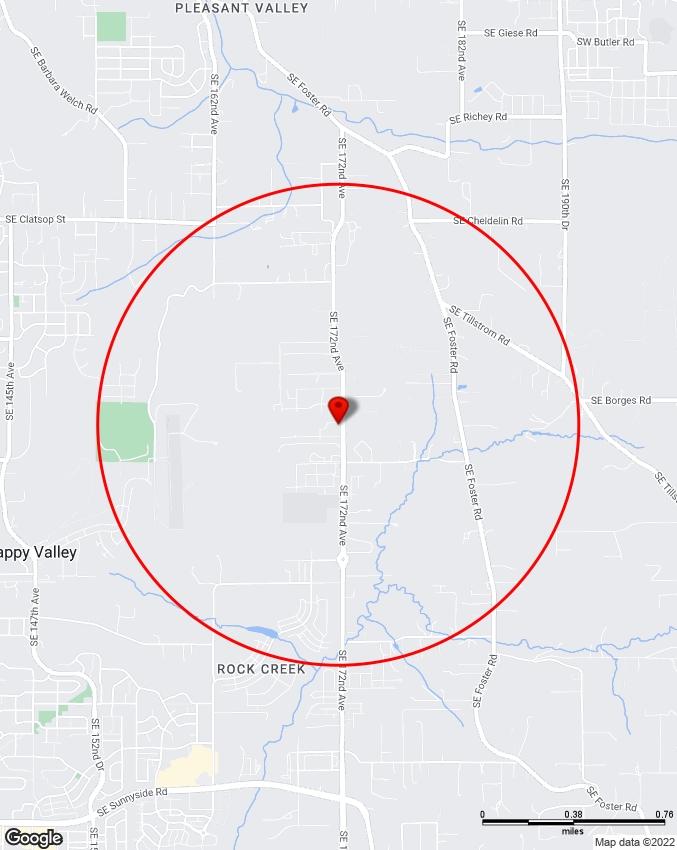
10161 SE 172nd Ave, Happy Valley, OR 97086

10161 SE 172nd Ave, Happy Valley, OR 97086
Sitewise Online
Pop-Facts: Population Quick Facts
Pop-Facts: Population Quick Facts
10161 SE 172nd Ave, Happy Valley, OR 97086 0 - 1 mi
Population 2027 Projection 2,042 2022 Estimate 1,939 2010 Census 1,189 2000 Census 645
Growth 2022-2027 5.31% Growth 2010-2022 63.09% Growth 2000-2010 84.27%
2022 Est. Population by Age
1,939
Age 0 to 4 123 6.32%
Age 5 to 9 137 7.08%
Age 10 to 14 149 7.66%
Age 15 to 17 90 4.66%
Age 18 to 20 79 4.08% Age 21 to 24 100 5.17% Age 25 to 34 228 11.76% Age 35 to 44 227 11.72% Age 45 to 54 283 14.61% Age 55 to 64 244 12.58% Age 65 to 74 187 9.63% Age 75 to 84 72 3.70% Age 85 and over 20 1.05%
Age 16 and over 1,501 77.41% Age 18 and over 1,440 74.28% Age 21 and over 1,361 70.21% Age 65 and over 279 14.38%
2022 Est. Median Age 37.80
2022 Est. Average Age 38.02
1,939 White Alone 1,183 61.01% Black or African American Alone 39 2.00% American Indian and Alaska Native Alone 8 0.44% Asian Alone 579 29.85%
Native Hawaiian and Other Pacific Islander Alone 2 0.10%
Some Other Race Alone 18 0.92% Two or More Races 110 5.68%
92 4.76%
95.24%
Single-Classification
2022 Est. Population by
Race
Est. Population by Ethnicity (Hispanic or Latino)
Hispanic or Latino
Not Hispanic or Latino
Est. Population by Sex
2022
1,939
1,847
2022
1,939 Male 962 49.62% Female 977 50.38% Copyright © Claritas, LLC 2022. All rights reserved. 10161 SE 172nd Ave, Happy Valley, OR 97086 Sitewise Online Pop-Facts: Population Quick Facts Pop-Facts: Population Quick Facts 10161 SE 172nd Ave, Happy Valley, OR 97086 0 - 1 mi
631 Income Less than $15,000 23 3.62% Income $15,000 to $24,999 19 2.95% Income $25,000 to $34,999 17 2.76% Income $35,000 to $49,999 22 3.47% Income $50,000 to $74,999 77 12.27% Income $75,000 to $99,999 88 13.95% Income $100,000 to $124,999 55 8.70% Income $125,000 to $149,999 53 8.34% Income $150,000 to $199,999 96 15.24% Income $200,000 to $249,999 56 8.90% Income $250,000 to $499,999 80 12.72% Income $500,000 or more 45 7.06%
SE
Household
Facts
Household Quick Facts
2022 Est. Households by Household Income
2022 Est. Average Household Income $ 174,556 2022 Est. Median Household Income $ 131,761 2022 Median HH Inc. by Single-Classification Race White Alone $ 123,075 Black or African American Alone $ 221,146 American Indian and Alaska Native Alone $ 67,322 Asian Alone $ 154,318 Native Hawaiian and Other Pacific Islander Alone $ 146,046 Some Other Race Alone $ 84,064 Two or More Races $ 149,531 Hispanic or Latino $ 225,289 Not Hispanic or Latino $ 127,521 2022 Est. Households by Household Type 631 Family Households 537
Nonfamily Households
2022 Est. Group Quarters Population 4
10161
172nd Ave, Happy Valley, OR 97086 Sitewise Online Pop-Facts:
Quick
Pop-Facts:
10161 SE 172nd Ave, Happy Valley, OR 97086 0 - 1 mi Households 2027 Projection 668 2022 Estimate 631 2010 Census 384 2000 Census 224 Growth 2022-2027 5.82% Growth 2010-2022 64.25% Growth 2000-2010 71.78%
85.07%
94 14.93%
10161 SE 172nd Ave, Happy Valley, OR 97086
Sitewise Online
Pop-Facts: Household Quick Facts
Pop-Facts: Household Quick Facts
10161 SE 172nd Ave, Happy Valley, OR 97086 0 - 1 mi
2022 Est. Households by Household Size 631
1-person 69 10.86%
2-person 182 28.89%
3-person 123 19.45% 4-person 142 22.48% 5-person 70 11.14% 6-person 27 4.32% 7-or-more-person 18 2.87%
2022 Est. Average Household Size 3.07
10161 SE 172nd Ave, Happy Valley, OR 97086
Sitewise Online
Pop-Facts: Household Quick Facts
Pop-Facts: Household Quick Facts
10161 SE 172nd Ave, Happy Valley, OR 97086 0 - 1 mi
2022 Est. HHs by Type by Presence of Own Children 537
Married-Couple Family, own children 256 47.74%
Married-Couple Family, no own children 214 39.81%
Male Householder, own children 17 3.16%
Male Householder, no own children 12 2.15%
Female Householder, own children 18 3.39%
Female Householder, no own children 20 3.74%
Copyright © Claritas, LLC 2022. All rights reserved.
SE 172nd Ave, Happy
OR
Sitewise Online Pop-Facts: Demographic Snapshot (Part
Demographic Snapshot (Part 1) 10161 SE
0 -
mi Population 2027 Projection
2022 Estimate
2010 Census
2000 Census
Growth
Growth
2022 Est. Population by Single-Classification Race 1,939
Alone
or African American Alone
and Alaska Native Alone
Races
2022 Est. Population Hispanic or Latino by Origin
Hispanic or Latino
Hispanic or Latino
Hispanic or Latino by Origin
Rican
All Other Hispanic or Latino
2022 Est. Hisp. or Latino Pop by Single-Classification Race 92
Alone
or African American Alone
Indian and Alaska Native Alone
Alone
Hawaiian and Other Pacific Islander Alone
Race Alone
or More Races
10161
Valley,
97086
1) Pop-Facts:
172nd Ave, Happy Valley, OR 97086
1
2,042
1,939
1,189
645 Growth 2022-2027 5.31%
2010-2022 63.09%
2000-2010 84.27%
White
1,183 61.01% Black
39 2.00% American Indian
8 0.44% Asian Alone 579 29.85% Native Hawaiian and Other Pacific Islander Alone 2 0.10% Some Other Race Alone 18 0.92% Two or More
110 5.68%
1,939 Not
1,847 95.24%
92 4.76%
92 Mexican 65 70.14% Puerto
3 3.28% Cuban 2 1.79%
23 24.79%
White
50 54.29% Black
0 0.03% American
0 0.13% Asian
2 1.73% Native
0 0.04% Some Other
16 17.56% Two
24 26.23%
10161 SE 172nd Ave, Happy Valley, OR 97086
Sitewise Online
Pop-Facts: Demographic Snapshot (Part 1)
Pop-Facts: Demographic Snapshot (Part 1)
10161 SE 172nd Ave, Happy Valley, OR 97086 0 - 1 mi
2022 Est. Pop by Race, Asian Alone, by Category 579
Chinese, except Taiwanese 96 16.52%
Filipino 24 4.18% Japanese 10 1.78% Asian Indian 24 4.08% Korean 131 22.62%
Vietnamese 130 22.45% Cambodian 13 2.24%
Hmong 0 0.00% Laotian 2 0.40% Thai 34 5.95%
All other Asian Races, including 2 or more 115 19.78%
2022 Est. Population by Ancestry
1,939
Arab 0 0.00%
Czech 2 0.08% Danish 8 0.39% Dutch 21 1.07% English 150 7.73%
French (except Basque) 30 1.53%
French Canadian 5 0.26%
German 261 13.44% Greek 0 0.01% Hungarian 4 0.21% Irish 107 5.53%
Italian 74 3.82%
Lithuanian 4 0.19%
Norwegian 68 3.52%
Polish 25 1.29%
Portuguese 8 0.44% Russian 31 1.61% Scottish 52 2.70% Scotch-Irish 15 0.77%
Slovak 0 0.00%
Subsaharan African 2 0.11% Swedish 45 2.31% Swiss 9 0.48% Ukrainian 14 0.74%
United States or American 80 4.12%
Welsh 21 1.09%
West Indian (except Hisp. groups) 1 0.03%
Other Ancestries 597 30.78%
Ancestry Unclassified 305 15.73%
2022 Est. Pop Age 5+ by Language Spoken At Home 1,816
10161 SE 172nd Ave, Happy Valley, OR 97086
Sitewise Online
Pop-Facts: Demographic Snapshot (Part 1)
Pop-Facts: Demographic Snapshot (Part 1)
10161 SE 172nd Ave, Happy Valley, OR 97086 0 - 1 mi
Speak only English 1,413 77.79% Speak Asian or Pacific Island Language 232 12.79%
Speak IndoEuropean Language 113 6.25% Speak Spanish 54 3.00% Speak Other Language 3 0.17%
Pop-Facts:
2022 Est. Population by Sex
1,939
Male 962 49.62%
Female 977 50.38%
2022 Est. Population by Age
1,939
Age 0 to 4 123 6.32%
Age 5 to 9 137 7.08%
Age 10 to 14 149 7.66%
Age 15 to 17 90 4.66%
Age 18 to 20 79 4.08%
Age 21 to 24 100 5.17%
Age 25 to 34 228 11.76%
Age 35 to 44 227 11.72%
Age 45 to 54 283 14.61%
Age 55 to 64 244 12.58% Age 65 to 74 187 9.63% Age 75 to 84 72 3.70% Age 85 and over 20 1.05%
Age 16 and over 1,501 77.41% Age 18 and over 1,440 74.28% Age 21 and over 1,361 70.21% Age 65 and over 279 14.38%
2022 Est. Median Age 37.80
2022 Est. Average Age 38.02
10161 SE 172nd Ave, Happy Valley, OR 97086 Sitewise Online
Pop-Facts: Demographic Snapshot (Part 1)
Demographic Snapshot (Part 1)
10161 SE 172nd Ave, Happy Valley, OR 97086 0 - 1 mi
10161 SE 172nd Ave, Happy Valley, OR 97086
Sitewise Online
Pop-Facts: Demographic Snapshot (Part 1)
Pop-Facts: Demographic Snapshot (Part 1)
10161 SE 172nd Ave, Happy Valley, OR 97086 0 - 1 mi
2022 Est. Male Population by Age 962
Age 0 to 4 60 6.26%
Age 5 to 9 70 7.31%
Age 10 to 14 72 7.46%
Age 15 to 17 45 4.73%
Age 18 to 20 40 4.17%
Age 21 to 24 49 5.13%
Age 25 to 34 117 12.18%
Age 35 to 44 106 11.04%
Age 45 to 54 140 14.52%
Age 55 to 64 125 13.02%
Age 65 to 74 92 9.60%
Age 75 to 84 34 3.53%
Age 85 and over 10 1.05%
2022 Est. Median Age, Male 37.50
2022 Est. Average Age, Male 37.93
2022 Est. Female Population by Age 977
Age 0 to 4 62 6.38%
Age 5 to 9 67 6.85%
Age 10 to 14 77 7.86%
Age 15 to 17 45 4.58%
Age 18 to 20 39 3.98%
Age 21 to 24 51 5.20%
Age 25 to 34 111 11.35% Age 35 to 44 121 12.39% Age 45 to 54 143 14.69%
Age 55 to 64 119 12.14%
Age 65 to 74 94 9.66% Age 75 to 84 38 3.87%
Age 85 and over 10 1.06%
2022 Est. Median Age, Female 38.06
2022 Est. Average Age, Female 38.10
10161 SE 172nd Ave, Happy Valley, OR 97086
Sitewise Online
Pop-Facts: Demographic Snapshot (Part 1)
Pop-Facts: Demographic Snapshot (Part 1)
10161 SE 172nd Ave, Happy Valley, OR 97086 0 - 1 mi
2022 Est. Pop Age 15+ by Marital Status 1,531
Total, Never Married 401 26.22% Males, Never Married 229 14.94% Females, Never Married 173 11.28%
Married, Spouse present 912 59.56% Married, Spouse absent 51 3.32% Widowed 24 1.58% Males, Widowed 5 0.31% Females, Widowed 19 1.27%
Divorced 143 9.33% Males, Divorced 55 3.58% Females, Divorced 88 5.75%
2022 Est. Pop Age 25+ by Edu. Attainment 1,261
Less than 9th grade 16 1.25%
Some High School, no diploma 39 3.09% High School Graduate (or GED) 260 20.60%
Some College, no degree 231 18.33% Associate Degree 140 11.13% Bachelor's Degree 354 28.08% Master's Degree 155 12.32% Professional School Degree 28 2.21% Doctorate Degree 38 2.99%
2022 Est. Pop. Age 25+ by Edu. Attain., Hisp./Lat. 45
No High School Diploma 3 6.54% High School Graduate 4 8.09% Some College or Associate's Degree 23 52.00% Bachelor's Degree or Higher 15 33.36%
Copyright © Claritas, LLC 2022. All rights reserved.
10161 SE 172nd Ave, Happy Valley, OR 97086 Sitewise Online Pop-Facts: Demographic Snapshot (Part 2) Pop-Facts: Demographic Snapshot (Part 2) 10161 SE 172nd Ave, Happy Valley, OR 97086 0 - 1 mi Households 2027 Projection 668 2022 Estimate
2010 Census
2000 Census 224 Growth 2022-2027
Growth 2010-2022
Growth 2000-2010
2022 Est. Households by Household Type 631 Family Households 537
Nonfamily Households
2022 Est. Group Quarters Population 4 2022 HHs by Ethnicity: Hispanic/Latino 24
2022 Est. Households by HH Income
Income <
2022 Est. Average Household Income $ 174,556 2022 Est. Median Household Income $ 131,761 2022 Median HH Income by Single-Class. Race or Ethn. White Alone $ 123,075 Black or African American Alone $ 221,146 American Indian and Alaska Native Alone $ 67,322 Asian Alone $ 154,318 Native Hawaiian and Other Pacific Islander Alone $ 146,046 Some Other Race Alone $ 84,064 Two or More Races $ 149,531
631
384
5.82%
64.25%
71.78%
85.07%
94 14.93%
3.82%
631
$15,000 23 3.62% Income $15,000 to $24,999 19 2.95% Income $25,000 to $34,999 17 2.76% Income $35,000 to $49,999 22 3.47% Income $50,000 to $74,999 77 12.27% Income $75,000 to $99,999 88 13.95% Income $100,000 to $124,999 55 8.70% Income $125,000 to $149,999 53 8.34% Income $150,000 to $199,999 96 15.24% Income $200,000 to $249,999 56 8.90% Income $250,000 to $499,999 80 12.72% Income $500,000+ 45 7.06%
10161 SE 172nd Ave, Happy Valley, OR 97086 Sitewise Online
Pop-Facts: Demographic Snapshot (Part 2)
Pop-Facts: Demographic Snapshot (Part 2)
10161 SE 172nd Ave, Happy Valley, OR 97086 0 - 1 mi
Hispanic or Latino $ 225,289
Not Hispanic or Latino $ 127,521
47.74%
39.81%
3.16% Male Householder, no own children 12 2.15% Female Householder, own children 18 3.39% Female Householder, no own children 20 3.74%
631 1-person 69 10.86% 2-person 182 28.89% 3-person 123 19.45% 4-person 142 22.48% 5-person 70 11.14% 6-person 27 4.32% 7-or-more-person 18 2.87%
Est. Family HH Type by Presence of Own Children
2022
537
Married-Couple Family, own children 256
Married-Couple Family, no own children 214
Est. Households by Household Size
Est. Average Household Size
2022 Est. Households by Presence of People Under 18
Households with 1 or more People under Age 18
Households with No People under Age 18
Households with 1 or more People under Age 18
Married-Couple Family
Other Family, Male Householder
Other Family, Female Householder
Nonfamily, Male Householder
Nonfamily, Female Householder
Households with No People under Age 18
Married-Couple Family
Other Family, Male Householder
Other Family, Female Householder
Nonfamily, Male Householder
Nonfamily, Female Householder
SE 172nd Ave, Happy
Online Pop-Facts: Demographic Snapshot (Part 2)
Demographic Snapshot (Part 2)
SE
Male Householder, own children 17
2022
2022
3.07
631
313 49.66%
318 50.34%
313
269 85.73%
19 6.15%
22 7.07%
3 0.90%
0 0.15%
318
202 63.46%
9 2.89%
16 4.91%
52 16.37%
39 12.39% 10161
Valley, OR 97086 Sitewise
Pop-Facts:
10161
172nd Ave, Happy Valley, OR 97086 0 - 1 mi
2022 Est. Households by Number of Vehicles 631 No Vehicles 4
1 Vehicle 95
2 Vehicles 291
3 Vehicles 137
4 Vehicles 61
5 or more Vehicles 43
2022 Est. Average Number of Vehicles 2.52 Family Households 2027 Projection 568 2022 Estimate 537 2010 Census 325 2000 Census 188 Growth 2022-2027 5.80% Growth 2010-2022 65.33% Growth 2000-2010 72.80% 2022 Est. Families by Poverty Status 537 2022 Families at or Above Poverty 524
2022 Families at or Above Poverty with Children 214 39.80% 2022 Families Below Poverty 13 2.34% 2022 Families Below Poverty with Children 7
2022 Est. Pop Age 16+ by Employment Status 1,501 In Armed Forces 0 0.00% Civilian Employed 972 64.78% Civilian Unemployed 22 1.47% Not in Labor Force 507 33.76% 2022 Est. Civ. Employed Pop 16+ by Class of Worker 973 For-Profit Private Workers 651 66.93% Non-Profit Private Workers 78
Local Government Workers 61
State Government Workers 32
Federal Government Workers 9
Self-Employed Workers 137 14.11% Unpaid Family Workers 5
10161 SE 172nd Ave, Happy Valley, OR 97086 Sitewise Online Pop-Facts: Demographic Snapshot (Part 2) Pop-Facts: Demographic Snapshot (Part 2) 10161 SE 172nd Ave, Happy Valley, OR 97086 0 - 1 mi
0.64%
15.13%
46.06%
21.64%
9.64%
6.88%
97.66%
1.32%
7.98%
6.23%
3.29%
0.97%
0.50%
Architect/Engineer 20 2.03%
Arts/Entertainment/Sports 9 0.95%
Building Grounds Maintenance 2 0.23% Business/Financial Operations 76 7.85% Community/Social Services 21 2.14%
Computer/Mathematical 63 6.43%
Construction/Extraction 58 5.93%
Education/Training/Library 51 5.22% Farming/Fishing/Forestry 0 0.00% Food Prep/Serving 25 2.56% Healthcare Practitioner/Technician 81 8.30% Healthcare Support 25 2.56% Maintenance Repair 22 2.23% Legal 5 0.53%
Life/Physical/Social Science 12 1.28% Management 153 15.71% Office/Admin. Support 92 9.41% Production 48 4.88% Protective Service 8 0.83% Sales/Related 115 11.77% Personal Care/Service 20 2.07% Transportation/Moving 69 7.11%
2022 Est. Civ. Employed Pop 16+ by Occupation
973
2022 Est. Pop 16+ by Occupation Classification 973 Blue Collar
White Collar
Service & Farm
2022 Est. Workers Age 16+ by Transp. To Work 946 Drove Alone
Car Pooled
Public Transportation
Walked
Bicycle
Means
Worked at Home
2022 Est. Workers Age 16+ by Travel Time to Work* Less than 15 minutes 92 15 to 29 Minutes 259 30 to 44 Minutes 278 45 to 59 Minutes 101 60 or more Minutes 122 10161 SE 172nd Ave, Happy Valley, OR 97086 Sitewise Online Pop-Facts: Demographic Snapshot (Part 2) Pop-Facts: Demographic Snapshot (Part 2) 10161 SE 172nd Ave, Happy Valley, OR 97086
- 1 mi
196 20.15%
697 71.60%
80 8.25%
717 75.79%
63 6.67%
49 5.23%
6 0.66%
0 0.05% Other
16 1.73%
93 9.88%
0
2022 Est. Avg. Travel Time to Work in Minutes* 36.30 2022 Est. Occupied Housing Units by Tenure 631 Owner-Occupied 555 88.01% Renter-Occupied 76 11.99% 2022 Occupied Housing Units: Avg. Length of Residence Owner-Occupied 9 Renter-Occupied 6 10161 SE 172nd Ave, Happy Valley, OR 97086 Sitewise Online Pop-Facts: Demographic Snapshot (Part 2) Pop-Facts: Demographic Snapshot (Part 2) 10161 SE 172nd Ave, Happy Valley, OR 97086 0 - 1 mi
Value Less than $20,000 0 0.00% Value $20,000 to $39,999 0 0.01%
Value $40,000 to $59,999 2 0.31% Value $60,000 to $79,999 0 0.00% Value $80,000 to $99,999 0 0.00% Value $100,000 to $149,999 0 0.01% Value $150,000 to $199,999 1 0.17% Value $200,000 to $299,999 2 0.32% Value $300,000 to $399,999 39 7.04% Value $400,000 to $499,999 69 12.50% Value $500,000 to $749,999 234 42.14% Value $750,000 to $999,999 147 26.38% Value $1,000,000 to $1,499,999 51 9.25% Value $1,500,000 to $1,999,999 10 1.81% Value $2,000,000 or
0 0.05%
2022 Est. Owner Occupied Housing Units by Value 555
2022 Est. Median All Owner-Occupied Housing Unit Value $ 675,791 2022 Est. Housing Units by Units in Structure 666 1 Unit Attached
1 Unit Detached
2 Units
3 or 4 Units
5 to 19 Units
20 to 49 Units
50 or More Units 21 3.18% Mobile Home or Trailer 8
Boat, RV, Van, etc. 0 0.00% Dominant structure type 1 Unit Detached 2022 Est. Housing Units by Year Structure Built 666 Housing Units Built 2014 or Later 203
Housing Units Built 2010 to 2013 73
Housing Units Built 2000 to 2009
Housing Units Built 1990 to 1999
Housing Units Built 1980 to 1989
Units Built 1970 to 1979
Units Built 1960 to 1969
Housing Units Built 1950 to 1959
Housing Units Built 1940 to 1949
Housing Units Built 1939 or Earlier
2022 Est. Median Year Structure Built** 2006 10161 SE 172nd Ave, Happy Valley, OR 97086 Sitewise Online Pop-Facts: Demographic Snapshot (Part 2) Pop-Facts: Demographic Snapshot (Part 2) 10161 SE 172nd Ave, Happy Valley, OR 97086 0 - 1 mi
more
13 1.98%
550 82.55%
0 0.00%
19 2.90%
23 3.45%
32 4.76%
1.18%
30.47%
10.97%
160 24.05%
50 7.55%
16 2.44% Housing
91 13.67% Housing
37 5.59%
9 1.36%
9 1.39%
17 2.51%
10161 SE 172nd Ave, Happy Valley, OR 97086 Sitewise Online
Pop-Facts: Demographic Snapshot (Part 2)
Pop-Facts: Demographic Snapshot (Part 2)
10161 SE 172nd Ave, Happy Valley, OR 97086 0 - 1 mi
Dominant Year Structure Built 2014 or Later
Copyright © Claritas, LLC 2022. All rights reserved.
* This row intentionally left blank. No Total Category.
**1939 will appear when at least half of the Housing Units in this reports area were built in 1939 or earlier.
10161 SE 172nd Ave, Happy
OR
Sitewise Online Pop-Facts: Census Demographic Overview (Part 1) Pop-Facts: Census Demographic Overview (Part 1) 10161 SE
0
Population 2027 Projection
2022 Estimate
2010 Census
2000 Census
Growth
Growth
Growth
2010 Population by Single-Classification Race 1,189
Black or African American Alone
and Alaska Native Alone
Islander Alone
2010 Population By Ethnicity
Not Hispanic or Latino
Hispanic or Latino
2010 Hispanic or Latino by Single-Classification Race 47 White Alone
Black or African American Alone
American Indian and Alaska Native Alone
Asian Alone
Native
and Other Pacific Islander Alone
or
2010 Population by Sex 1,189 Male 595
Female 594
Male/Female Ratio
Valley,
97086
172nd Ave, Happy Valley, OR 97086
1 mi
2,042
1,939
1,189
645
2022-2027 5.31%
2010-2022 63.09%
2000-2010 84.27%
White Alone 925 77.78%
16 1.37% American Indian
6 0.53% Asian Alone 184 15.52% Native Hawaiian and Other Pacific
2 0.14% Some Other Race Alone 16 1.30% Two or More Races 40 3.37%
1,189
1,142 96.02%
47 3.98%
25 52.67%
0 0.02%
0 0.15%
1 1.50%
Hawaiian
0 0.05% Some Other Race Alone 14 29.46% Two
More Races 8 16.15%
50.06%
49.94%
1.00
10161 SE 172nd Ave, Happy Valley, OR 97086
Sitewise Online
Pop-Facts: Census Demographic Overview (Part 1)
Pop-Facts: Census Demographic Overview (Part 1)
10161 SE 172nd Ave, Happy Valley, OR 97086 0 1 mi
2010 Population by Age 1,189
Age 0 to 4 84 7.11%
Age 5 to 9 97 8.16%
Age 10 to 14 101 8.47%
Age 15 to 17 63 5.26%
Age 18 to 20 38 3.22%
Age 21 to 24 43 3.60%
Age 25 to 34 118 9.89%
Age 35 to 44 189 15.87%
Age 45 to 54 188 15.83%
Age 55 to 64 146 12.32%
Age 65 to 74 72 6.07%
Age 75 to 84 37 3.09%
Age 85 and over 13 1.10%
Age 16 and over 883 74.31%
Age 18 and over 844 70.99% Age 21 and over 806 67.77% Age 65 and over 122 10.26%
2010 Median Age 37.70
10161 SE 172nd Ave, Happy Valley, OR 97086
Sitewise Online
Pop-Facts: Census Demographic Overview (Part 1)
Pop-Facts: Census Demographic Overview (Part 1)
2010 Male Population by Age
10161 SE 172nd Ave, Happy Valley, OR 97086 0 1 mi
595
Age 0 to 4 41 6.86%
Age 5 to 9 50 8.47%
Age 10 to 14 47 7.90%
Age 15 to 17 35 5.90%
Age 18 to 20 20 3.35%
Age 21 to 24 21 3.54%
Age 25 to 34 56 9.49%
Age 35 to 44 91 15.28%
Age 45 to 54 97 16.37%
Age 55 to 64 75 12.60%
Age 65 to 74 36 6.09%
Age 75 to 84 20 3.33%
Age 85 and over 5 0.81%
2010 Median Age, Male 37.94
2010
Female Population by Age
594
Age 0 to 4 44 7.36%
Age 5 to 9 47 7.86%
Age 10 to 14 54 9.05%
Age 15 to 17 27 4.62%
Age 18 to 20 18 3.10%
Age 21 to 24 22 3.66%
Age 25 to 34 61 10.29%
Age 35 to 44 98 16.46% Age 45 to 54 91 15.28%
Age 55 to 64 71 12.03%
Age 65 to 74 36 6.05%
Age 75 to 84 17 2.86%
Age 85 and over 8 1.39%
2010 Median Age, Female 37.48
Copyright
© Claritas, LLC 2022. All rights reserved.
10161 SE 172nd Ave, Happy Valley, OR 97086 Sitewise Online
Pop-Facts:
Pop-Facts:
384 1-person 39 10.22% 2-person 119 31.09% 3-person 71 18.55% 4-person 84 21.90% 5-person 43 11.07% 6-person 15 3.95% 7-or-more-person 12 3.22%
Census Demographic Overview (Part 2)
Census Demographic Overview (Part 2) 10161 SE 172nd Ave, Happy Valley, OR 97086 0 1 mi
Households by Household Type
Households
Households
Group Quarters Population
Hispanic or Latino Households
Households by Household Size
Households 2027 Projection 668 2022 Estimate 631 2010 Census 384 2000 Census 224 Growth 2022-2027 5.82% Growth 2010-2022 64.25% Growth 2000-2010 71.78% 2010
384 Family
325 84.51% Non-family
59 15.49% 2010
4 2010
11 2.96% 2010
Sitewise Online
Pop-Facts: Census Demographic Overview (Part 2)
Pop-Facts: Census Demographic Overview (Part 2)
10161 SE 172nd Ave, Happy Valley, OR 97086 0 1 mi
Married-Couple Family, own children 146 37.96%
Male Householder, own children 10 2.57% Female Householder, own children 11 2.76%
Married-Couple Family, no own children 138 36.01% Male Householder, no own children 7 1.94% Female Householder, no own children 13 3.28%
15.49%
53.27%
Married-Couple Family 153 85.49% Other Family, Male Householder 11 6.15% Other Family, Female Householder 13 7.30% Nonfamily, Male Householder 2 0.92% Nonfamily, Female Householder 0 0.13%
Households with No People Under Age 18: 205
Married-Couple Family 131 63.85% Other Family, Male Householder 6 3.06% Other Family, Female Householder 10 4.95% Nonfamily, Male Householder 33 16.07% Nonfamily, Female Householder 25 12.08%
2010 Households by Type and Presence of Children 384
Non-family Households 59
2010 Households by Presence of People Under Age 18 384
HH with 1 or More People Under Age 18: 180 46.73% Households with No People Under Age 18: 205
HH with 1 or More People Under Age 18: 180
2010 Occupied Housing Units by Tenure 384
Owner-Occupied 337 87.85% Renter-Occupied 47 12.15% Copyright © Claritas, LLC 2022. All rights reserved. 10161 SE 172nd Ave, Happy Valley, OR 97086
10161 SE 172nd Ave, Happy Valley, OR 97086
Sitewise Online
Retail Market Power Opportunity Gap Report By Retail Store Types
Retail Market Power Opportunity Gap Report
By Retail Store Types
10161 SE 172nd Ave, Happy Valley, OR 97086 0 - 1 mi
2022 Demand 2022 Supply Opportunity Gap/Surplus
Total retail trade including food and drink (NAICS 44, 45 and 722) $ 119,227,712 $ 32,445,272 $ 86,782,440
Total retail trade (NAICS 44 and 45) $ 106,087,562 $ 23,672,802 $ 82,414,759
Motor vehicle and parts dealers (NAICS 441) $ 24,051,668 $ 1,177,370 $ 22,874,297
Automobile dealers (NAICS 4411) $ 20,164,063 $ 453,358 $ 19,710,705
New car dealers (NAICS 44111) $ 17,915,562 $ 453,358 $ 17,462,204
Used car dealers (NAICS 44112) $ 2,248,501 $ 0 $ 2,248,501
Other motor vehicle dealers (NAICS 4412) $ 2,293,348 $ 653,193 $ 1,640,155
Recreational vehicle dealers (NAICS 44121) $ 915,525 $ 151,121 $ 764,404 Motorcycle, boat, and other motor vehicle dealers (NAICS 44122) $ 1,377,823 $ 502,072 $ 875,751
Boat dealers (NAICS 441222) $ 545,903 $ 0 $ 545,903
Motorcycle, ATV, and all other motor vehicle dealers (NAICS 441228) $ 831,919 $ 502,072 $ 329,848
Automotive parts, accessories, and tire stores (NAICS 4413) $ 1,594,256 $ 70,819 $ 1,523,437
Automotive parts and accessories stores (NAICS 44131) $ 1,008,319 $ 66,170 $ 942,149
Tire dealers (NAICS 44132) $ 585,938 $ 4,649 $ 581,289
Furniture and home furnishings stores (NAICS 442) $ 2,436,674 $ 1,657,860 $ 778,814
Furniture stores (NAICS 4421) $ 1,339,669 $ 1,155,134 $ 184,535
Home furnishings stores (NAICS 4422) $ 1,097,005 $ 502,726 $ 594,278
Floor covering stores (NAICS 44221) $ 534,566 $ 375,965 $ 158,601
Other home furnishings stores (NAICS 44229) $ 562,438 $ 126,761 $ 435,677
Window treatment stores (NAICS 442291) $ 26,806 $ 0 $ 26,806
All other home furnishings stores (NAICS 442299) $ 535,632 $ 126,761 $ 408,871
Electronics and appliance stores (NAICS 443) $ 1,420,295 $ 357,070 $ 1,063,225
Household appliance stores (NAICS 443141) $ 339,132 $ 27,451 $ 311,681
Electronics stores (NAICS 443142) $ 1,081,163 $ 329,619 $ 751,544
Building material and garden equipment and supplies dealers (NAICS 444) $ 8,030,622 $ 2,498,791 $ 5,531,831
Building material and supplies dealers (NAICS 4441) $ 6,914,153 $ 1,705,069 $ 5,209,085
Home centers (NAICS 44411) $ 3,846,232 $ 912,294 $ 2,933,937
Paint and wallpaper stores (NAICS 44412) $ 236,020 $ 130,494 $ 105,526
Hardware stores (NAICS 44413) $ 611,007 $ 44,520 $ 566,487
Other building material dealers (NAICS 44419) $ 2,220,894 $ 617,760 $ 1,603,134
Lawn and garden equipment and supplies stores (NAICS 4442) $ 1,116,468 $ 793,722 $ 322,746
Outdoor power equipment stores (NAICS 44421) $ 229,453 $ 0 $ 229,453
Nursery, garden center, and farm supply stores (NAICS 44422) $ 887,015 $ 793,722 $ 93,293
Food and beverage stores (NAICS 445) $ 15,505,671 $ 8,994,370 $ 6,511,302 Grocery stores (NAICS 4451) $ 13,789,091 $ 8,106,965 $ 5,682,125
Supermarkets and other grocery (except convenience) stores (NAICS 44511) $ 13,249,597 $ 8,092,477 $ 5,157,121
Convenience stores (NAICS 44512) $ 539,493 $ 14,489 $ 525,005
Specialty food stores (NAICS 4452) $ 404,889 $ 681,646 - $ 276,756
10161 SE 172nd Ave, Happy Valley, OR 97086
Sitewise Online
Retail Market Power Opportunity Gap Report By Retail Store Types
Retail Market Power Opportunity Gap Report
By Retail Store Types
10161 SE 172nd Ave, Happy Valley, OR 97086 0 - 1 mi
2022 Demand 2022 Supply Opportunity Gap/Surplus
Meat markets (NAICS 44521) $ 122,280 $ 0 $ 122,280
Fish and seafood markets (NAICS 44522) $ 48,152 $ 0 $ 48,152
Fruit and vegetable markets (NAICS 44523) $ 83,987 $ 0 $ 83,987
Other specialty food stores (NAICS 44529) $ 150,470 $ 681,646 $ 531,176
Baked goods and confectionery and nut stores (NAICS 445291 + 445292) $ 79,882 $ 0 $ 79,882
All other specialty food stores (NAICS 445299) $ 70,588 $ 681,646 $ 611,058
Beer, wine, and liquor stores (NAICS 4453) $ 1,311,691 $ 205,758 $ 1,105,933
Health and personal care stores (NAICS 446) $ 5,858,437 $ 2,552,349 $ 3,306,088
Pharmacies and drug stores (NAICS 44611) $ 5,079,666 $ 2,125,037 $ 2,954,629
Cosmetics, beauty supplies, and perfume stores (NAICS 44612) $ 340,374 $ 0 $ 340,374
Optical goods stores (NAICS 44613) $ 166,683 $ 0 $ 166,683
Other health and personal care stores (NAICS 44619) $ 271,713 $ 427,312 $ 155,599
Food (health) supplement stores (NAICS 446191) $ 97,096 $ 427,312 $ 330,216
All other health and personal care stores (NAICS 446199) $ 174,617 $ 0 $ 174,617
Gasoline stations (NAICS 447) $ 7,802,079 $ 668,560 $ 7,133,518
Clothing and clothing accessories stores (NAICS 448) $ 4,495,914 $ 1,278,591 $ 3,217,323
Clothing stores (NAICS 4481) $ 2,952,790 $ 654,595 $ 2,298,195
Men's clothing stores (NAICS 44811) $ 134,130 $ 44,833 $ 89,297
Women's clothing stores (NAICS 44812) $ 513,314 $ 34,689 $ 478,625
Children's and infants' clothing stores (NAICS 44813) $ 115,857 $ 3,965 $ 111,892
Family clothing stores (NAICS 44814) $ 1,776,636 $ 404,003 $ 1,372,633
Clothing accessories stores (NAICS 44815) $ 144,546 $ 21,276 $ 123,271
Other clothing stores (NAICS 44819) $ 268,307 $ 145,830 $ 122,477
Shoe stores (NAICS 4482) $ 629,113 $ 0 $ 629,113
Jewelry, luggage, and leather goods stores (NAICS 4483) $ 914,010 $ 623,996 $ 290,015
Jewelry stores (NAICS 44831) $ 597,360 $ 542,218 $ 55,143
Luggage and leather goods stores (NAICS 44832) $ 316,650 $ 81,778 $ 234,872
Sporting goods, hobby, musical instrument, and book stores (NAICS 451) $ 1,794,798 $ 692,001 $ 1,102,797
Sporting goods, hobby, and musical instrument stores (NAICS 4511) $ 1,616,471 $ 692,001 $ 924,470
Sporting goods stores (NAICS 45111) $ 1,195,512 $ 525,818 $ 669,694
Hobby, toy, and game stores (NAICS 45112) $ 318,632 $ 19,343 $ 299,289
Sewing, needlework, and piece goods stores (NAICS 45113) $ 49,129 $ 146,840 $ 97,711
Musical instrument and supplies stores (NAICS 45114) $ 53,197 $ 0 $ 53,197
Book stores and news dealers (NAICS 4512) $ 178,327 $ 0 $ 178,327
Book stores (NAICS 451211) $ 166,758 $ 0 $ 166,758
News dealers and newsstands (NAICS 451212) $ 11,569 $ 0 $ 11,569
General merchandise stores (NAICS 452) $ 13,543,580 $ 397,846 $ 13,145,735
Department stores (NAICS 4522) $ 1,761,309 $ 0 $ 1,761,309
Other general merchandise stores (NAICS 4523) $ 11,782,272 $ 397,846 $ 11,384,426
Warehouse clubs and supercenters (NAICS 452311) $ 10,623,114 $ 397,846 $ 10,225,268
All other general merchandise stores (NAICS 452319) $ 1,159,158 $ 0 $ 1,159,158
10161 SE 172nd Ave, Happy Valley, OR 97086
Sitewise Online
Retail Market Power Opportunity Gap Report By Retail Store Types
Retail Market Power Opportunity Gap Report
By Retail Store Types
10161 SE 172nd Ave, Happy Valley, OR 97086 0 - 1 mi
2022 Demand 2022 Supply Opportunity Gap/Surplus
Miscellaneous store retailers (NAICS 453) $ 2,373,930 $ 737,176 $ 1,636,754
Florists (NAICS 4531) $ 113,562 $ 0 $ 113,562
Office supplies, stationery, and gift stores (NAICS 4532) $ 551,483 $ 151,630 $ 399,854
Office supplies and stationery stores (NAICS 45321) $ 232,181 $ 81,031 $ 151,150
Gift, novelty, and souvenir stores (NAICS 45322) $ 319,302 $ 70,599 $ 248,703
Used merchandise stores (NAICS 4533) $ 358,174 $ 274,690 $ 83,484
Other miscellaneous store retailers (NAICS 4539) $ 1,350,711 $ 310,856 $ 1,039,855
Pet and pet supplies stores (NAICS 45391) $ 374,328 $ 67,050 $ 307,278
Art dealers (NAICS 45392) $ 242,102 $ 0 $ 242,102
Manufactured (mobile) home dealers (NAICS 45393) $ 155,286 $ 129,102 $ 26,184
All other miscellaneous store retailers (NAICS 45399) $ 578,995 $ 114,704 $ 464,291
Tobacco stores (NAICS 453991) $ 119,902 $ 11,434 $ 108,468
All other miscellaneous store retailers (except tobacco stores) (NAICS 453998) $ 459,093 $ 103,270 $ 355,823
Non-store retailers (NAICS 454)
$ 18,773,895 $ 2,660,820 $ 16,113,075
Electronic shopping and mail-order houses (NAICS 4541) $ 17,809,422 $ 2,660,820 $ 15,148,602
Vending machine operators (NAICS 4542) $ 129,848 $ 0 $ 129,848
Direct selling establishments (NAICS 4543) $ 834,624 $ 0 $ 834,624
Fuel dealers (NAICS 45431) $ 396,277 $ 0 $ 396,277
Other direct selling establishments (NAICS 45439) $ 438,347 $ 0 $ 438,347
Food services and drinking places (NAICS 722) $ 13,140,151 $ 8,772,470 $ 4,367,681
Special food services (NAICS 7223) $ 1,050,724 $ 64,495 $ 986,230
Food service contractors (NAICS 72231) $ 830,884 $ 47,004 $ 783,880
Caterers (NAICS 72232) $ 200,318 $ 17,491 $ 182,827
Mobile food services (NAICS 72233) $ 19,522 $ 0 $ 19,522
Drinking places (alcoholic beverages) (NAICS 7224) $ 420,819 $ 7,039 $ 413,780
Restaurants and other eating places (NAICS 7225) $ 11,668,608 $ 8,700,936 $ 2,967,671
Full-service restaurants (NAICS 722511) $ 5,831,928 $ 4,075,140 $ 1,756,788
Limited-service restaurants (NAICS 722513) $ 4,953,079 $ 3,316,245 $ 1,636,834
Cafeterias, grill buffets, and buffets (NAICS 722514) $ 126,264 $ 79,394 $ 46,869 Snack and nonalcoholic beverage bars (NAICS 722515) $ 757,337 $ 1,230,157 $ 472,820
GAFO* $ 23,691,813 $ 4,383,519 $ 19,308,294
General Merchandise Stores-452 $ 13,543,580 $ 397,846 $ 13,145,735
Clothing & Clothing Accessories Stores-448 $ 4,495,914 $ 1,278,591 $ 3,217,323
Furniture & Home Furnishings Stores-442 $ 2,436,674 $ 1,657,860 $ 778,814
Electronics & Appliance Stores-443 $ 1,420,295 $ 357,070 $ 1,063,225
Sporting Goods, Hobby, Book, Music Stores-451 $ 1,794,798 $ 692,001 $ 1,102,797
Office Supplies, Stationery, Gift Stores-4532 $ 551,483 $ 151,630 $ 399,854
* GAFO (General merchandise, Apparel, Furniture and Other) represents sales at stores that sell merchandise normally sold in department stores. This category is not included in Total Retail Sales Including Eating and Drinking Places.
10161 SE 172nd Ave, Happy Valley, OR 97086
Sitewise Online
Retail Market Power Opportunity Gap Report By Retail Store Types
Retail Market Power Opportunity Gap Report By Retail Store Types
Retail Market Power data is derived from two major sources of information. The demand data is derived from the Consumer Expenditure Survey (CE Survey or CEX), which is fielded by the U.S. Bureau of Labor Statistics (BLS). The supply data is derived from the Census of Retail Trade (CRT), which is made available by the U.S. Census. Additional data sources are incorporated to create both supply and demand estimates.
The difference between demand and supply represents the opportunity gap or surplus available for each merchandise line in the specified reporting geography. When this difference is positive (demand is greater than the supply), there is an opportunity gap for that merchandise line; when the difference is negative (supply is greater than demand), there is a surplus.
Copyright © 2022 Environics Analytics. All rights reserved.
10161 SE 172nd Ave, Happy Valley, OR 97086 0 - 1 mi 2022 Demand 2022 Supply Opportunity Gap/Surplus
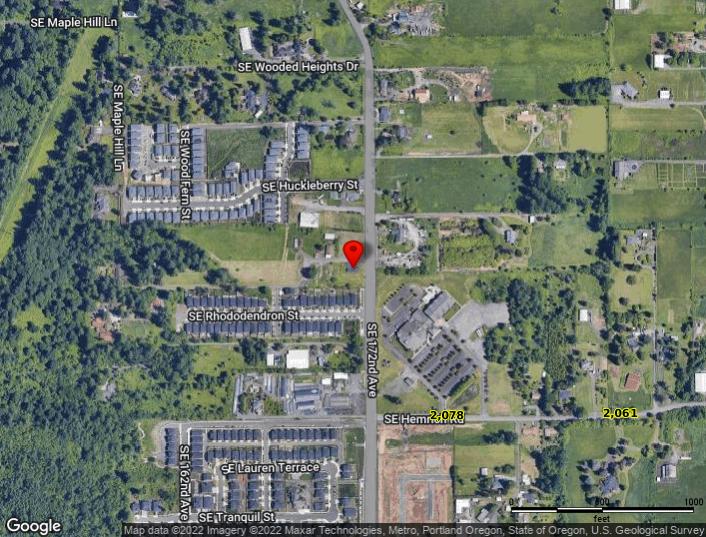
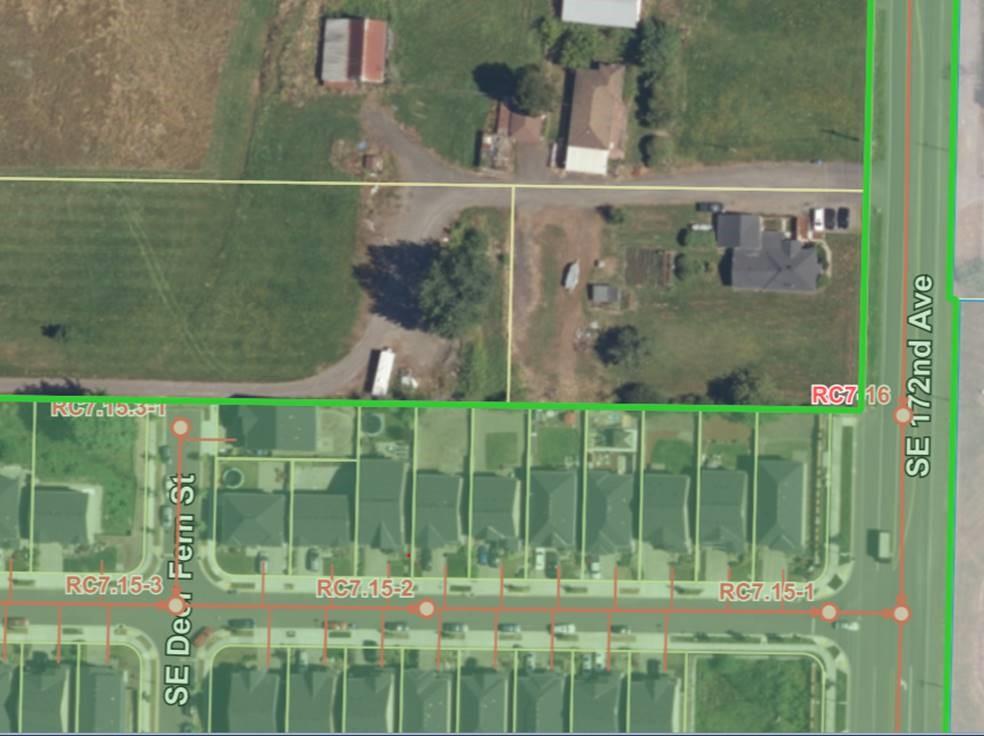
Powered by Sitewise Data Source: Kalibrate TrafficMetrix Traffic Listing 10161 SE 172nd Ave, Happy Valley, OR 97086 November 30, 2022 Map # Street Cross Street Dir. Volume Type/Year Dist. (mi) 1. SE Hemrick Rd SE 172nd Ave W 2,078 Current Year 0.2 2. SE Hemrich Road SE Foster Rd E 2,061 Current Year 0.3 3. Southeast 172nd Avenue SE Maple Hill Ln N 6,417 Current Year 0.3 4. SE Foster Road SE Tillstrom Rd N 5,630 Current Year 0.5 5. Southeast Foster Road SE Tillstrom Rd N 5,924 Current Year 0.5 6. SE Sager Rd SE 172nd Ave E 830 Published (2002) 0.6 7. SE 172nd Ave SE Sager Rd S 6,748 Current Year 0.7 8. SE Hagen Rd 1,116 Current Year 0.7 9. SE Sager Rd SE 162nd Ave W 4,681 Published (2002) 0.7 10. SE Foster Rd SE Tillstrom Rd S 7,163 Current Year 0.7 11. SE Tillstrom Road SE Caleb Ln NW 3,098 Current Year 0.8 12. SE Tillstrom Rd SE 190th Dr SE 3,106 Current Year 0.8 13. SE Foster Road SE Cheldelin Rd NW 6,428 Current Year 0.8 14. SE Cheldelin Rd SE Foster Rd W 1,232 Published (2002) 0.9 15. SE Troge Rd SE 172nd Ave W 409 Current Year 0.9 16. Southeast 162nd Avenue SE Monner Rd S 3,747 Current Year 1.0