Developers Packet Subject Property 10140 NW Cornell Road, Portland, OR 97229 Compliments of WFG Na onal Title Insurance Company Customer Service Department


Table of Contents Property Details U li es (Water & Sewer) Zoning Custom Maps Miscellaneous Items ‐TraDemographics ffic Counts The informa on contained is provided by WFG’s Customer Service Department as a courtesy to our customers, and while deemed reliable, is not guaranteed.
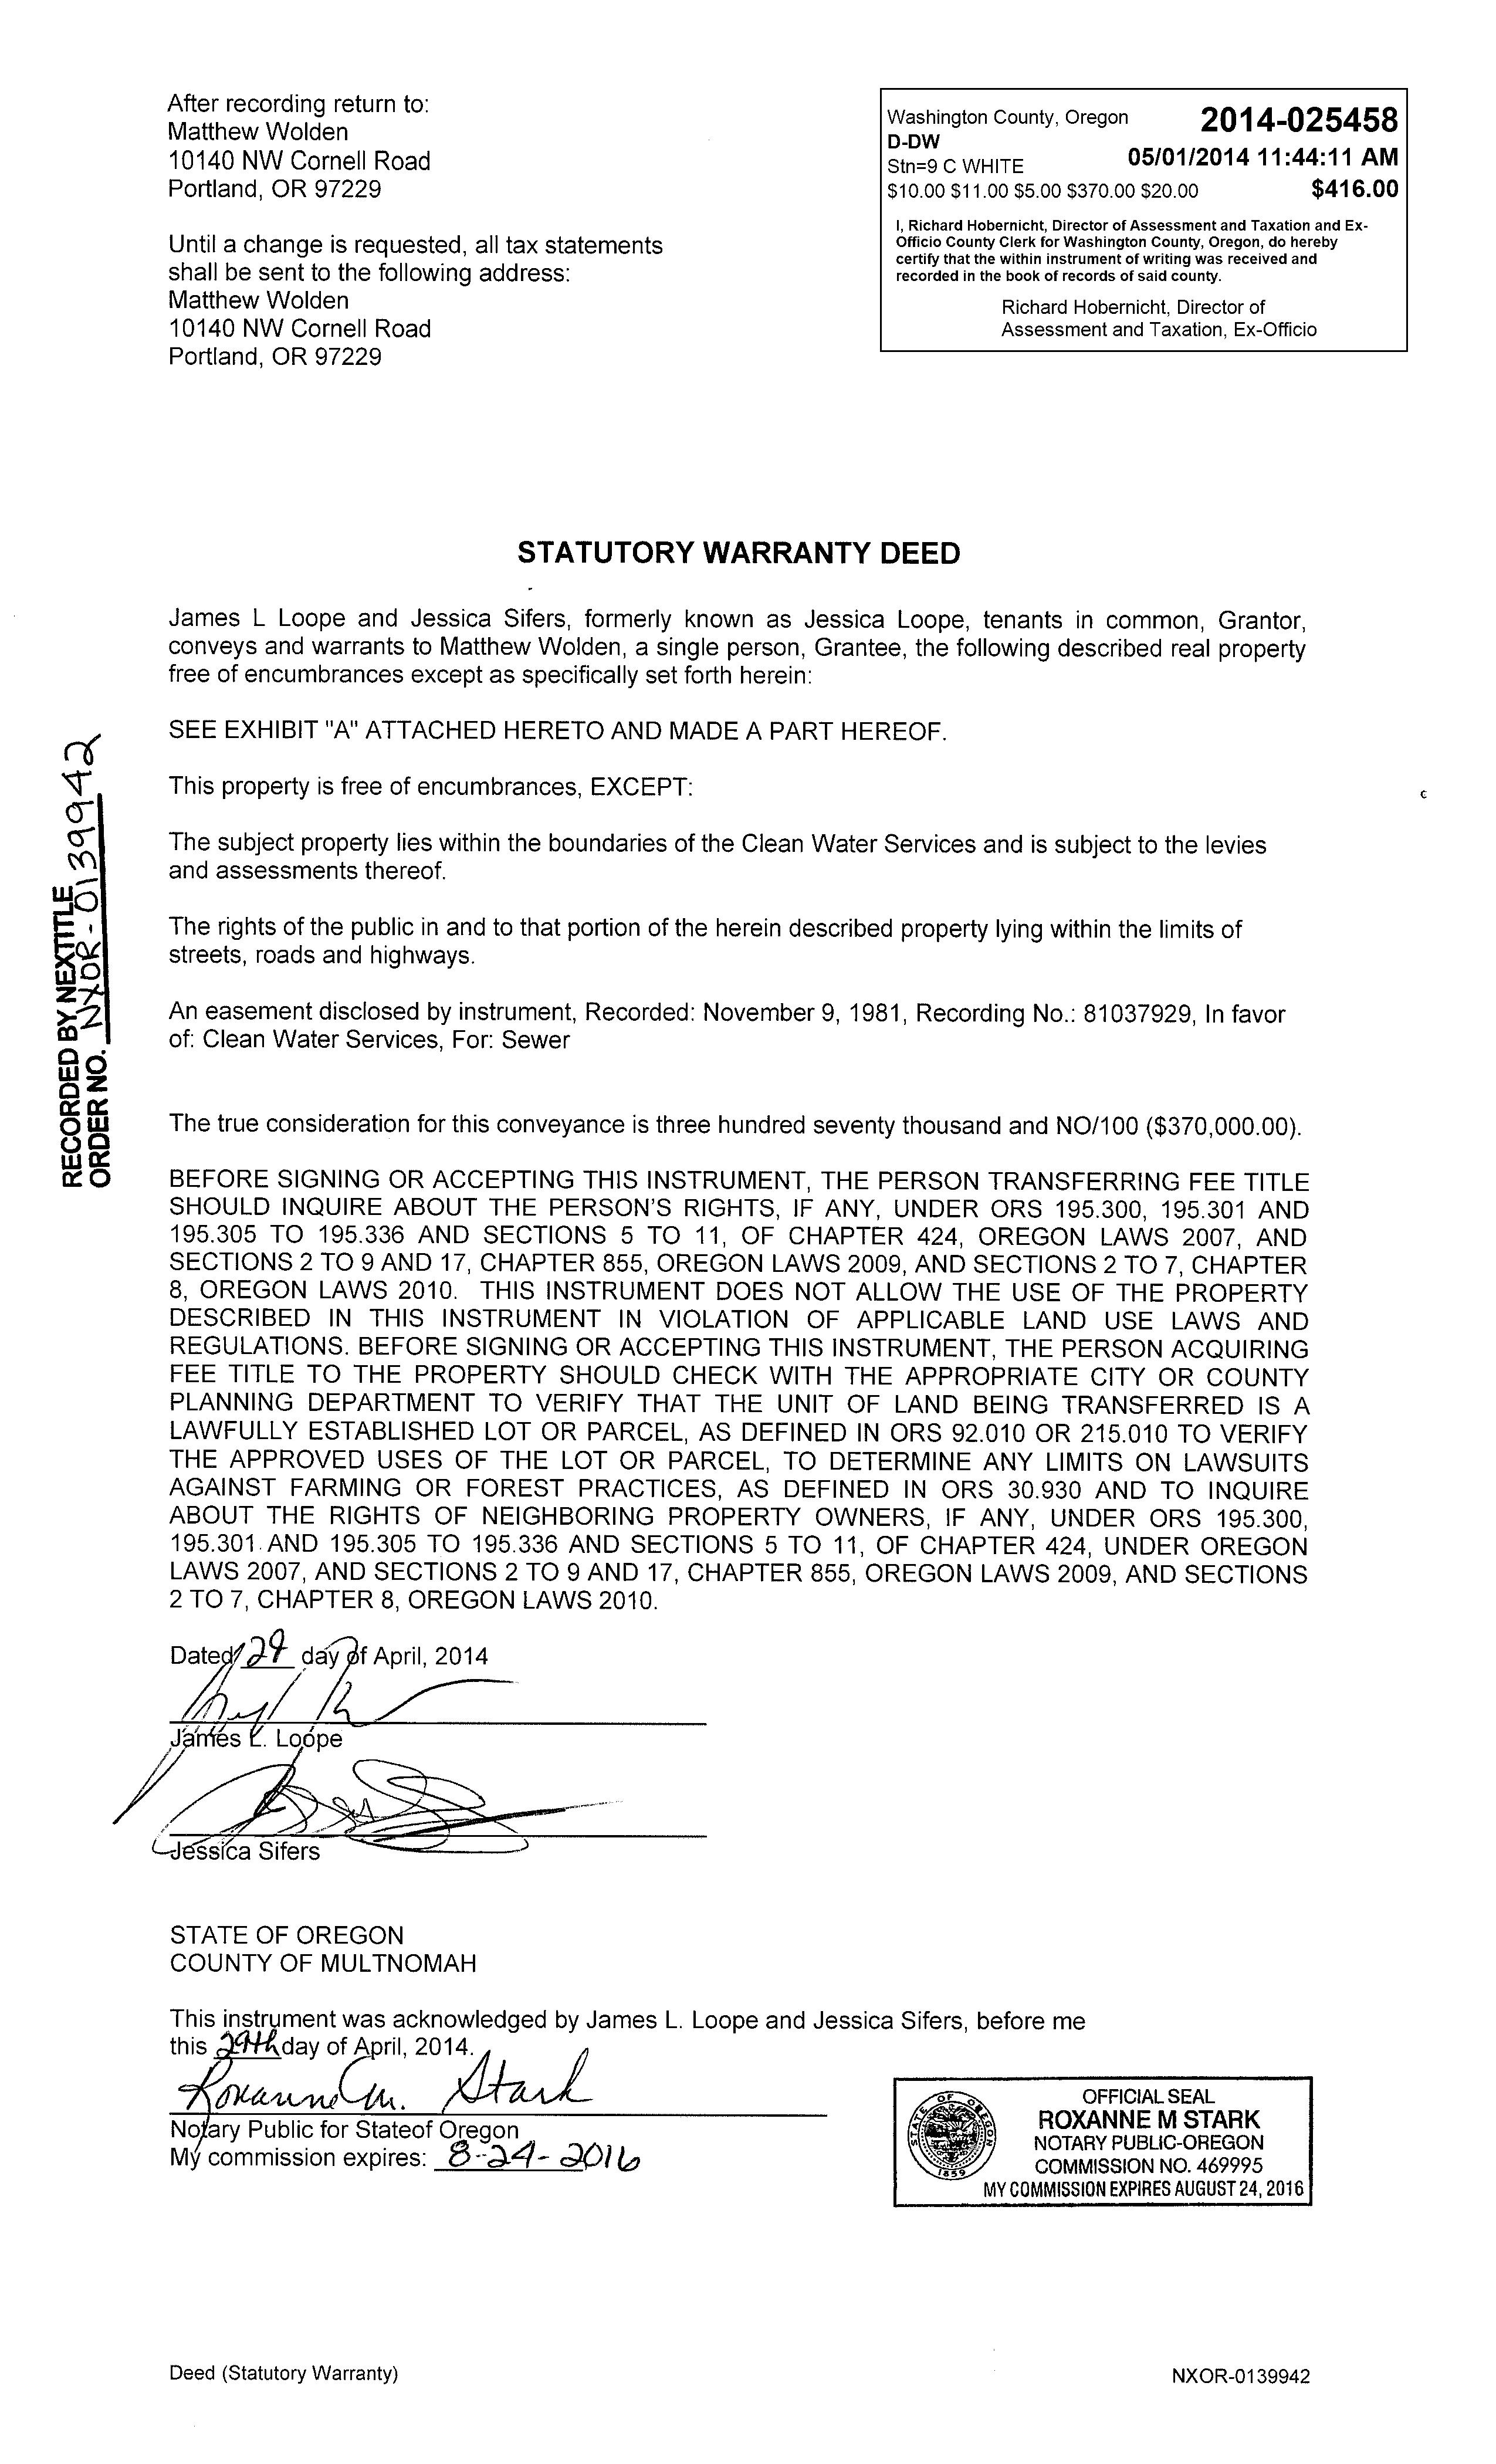
Property Details Property Tax Informa on Assessors Tax Map Ves ng Deed
PropertyDetailReport Owner:MatthewWolden Site:10140NWCornellRdPortlandOR97229 Mail:10140NWCornellRdPortlandOR97229 LocationandSiteInformation County: Washington LotSqFt: 20,038 LegalDescription: ACRES0.46 LotAcres: 0.46 APN: R647161 LandUse: 1010-ResidentialImproved TaxLot: 1N135CB01400 LandUseSTD: SingleFamilyResidence TwnRngSec: 01N/01W/35/SW CountyBldgUse: RSFR-ResidenceSingleFamily Neighborhood: Cpo1CedarHillsCedarMillS #Dwellings: 1 Subdivision: MapPage/Grid: 595E5 LegalLot/Block: 9 Zoning: WashingtonCo.R5 CensusTract/Block: 030102/2021 Watershed: RockCreek-TualatinRiver ElementarySchool: CEDARMILLELEMENTARYSCHOOL HighSchool: SUNSETHIGHSCHOOL MiddleSchool: NEWMIDDLESCHOOL(NAMETBD) SchoolDistrict: Beaverton PropertyCharacteristics TotalLivingArea: 2,263 Bedrooms: 4 YearBuilt/Eff: 1956(1981) FirstFloorSqFt: 1,104 BathroomsTotal: 2 Heating: SecondFloorSqFt: BathroomsFull/Half: Cooling: Yes BasementFin/Unfin: 1,159/0 Stories: Fireplace: AtticFin/Unfin: Foundation: 01 Pool: GarageSqFt: 378 RoofMaterial: Composition Kitchen: AssessmentandTaxInformation MarketTotal: $527,15000 PropertyTax: $5,14551 MarketLand: $314,120.00 Exemption: MarketStructure: $213,030.00 MarketImproved%: 40.00% AsssessmentYear: 2021 LevyCode: 51.50 AssessedTotal: $288,240.00 MillRate: 17.8515 SaleandLoanInformation SaleDate: 03/09/2020 Lender: SaleAmount: $200,00000 LoanAmount: $000 Document#: 19900 LoanType: DeedType: Deed Price/SqFt: $8838 TitleCo: FIDELITYNATIONALTITLE SellerName: ARMOURMICHAELJ PreparedBy:WFGNationalTitleCustomerServiceDepartment 12909SW68thPkwy,Suite350,Portland,OR97223 P:5036031700|3608915474E:cs@wfgnationaltitlecom|cccs@wfgtitlecom SentryDynamics,Inc anditscustomersmakenorepresentation,warrantiesorconditions,expressorimplied, astotheaccuracyorcompletenessofinformationcontainedinthisreport

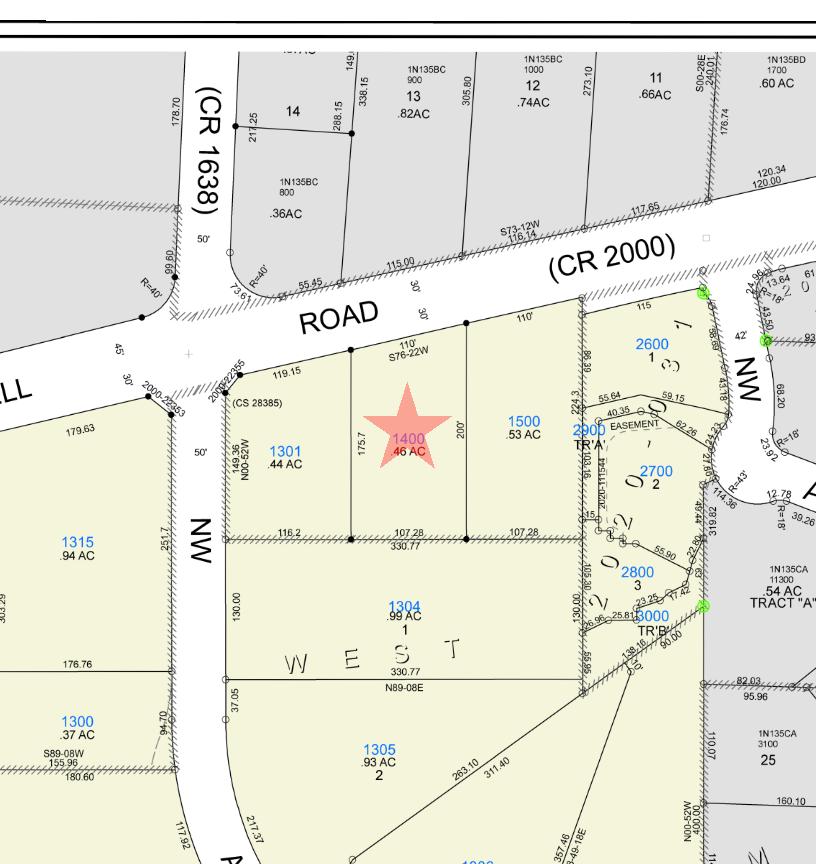
AssessorMap ParcelID:R647161 SiteAddress:10140NWCornellRd SentryDynamics,Inc anditscustomersmakenorepresentations, warrantiesorconditions,expressorimplied,astotheaccuracyor completenessofinformationcontainedinthisreport
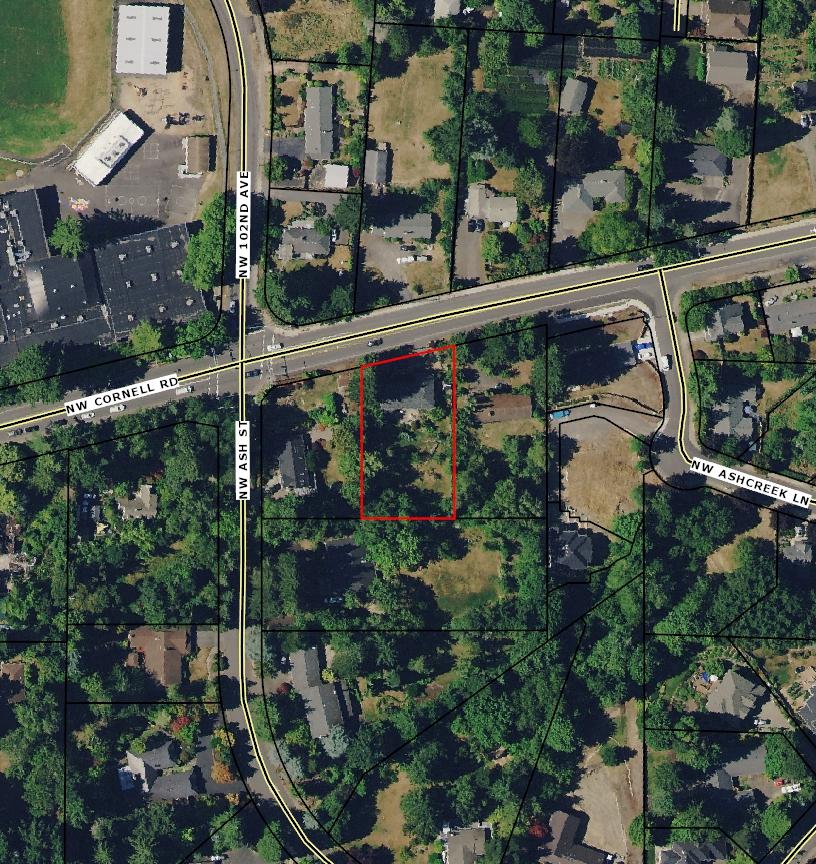
AerialMap ParcelID:R647161 SentryDynamics,Inc anditscustomersmakenorepresentations, warrantiesorconditions,expressorimplied,astotheaccuracyor completenessofinformationcontainedinthisreport
U lity As‐Builts Water As‐Built Maps Tuala n Valley Water District Sewer As‐Built Maps Clean Water Services District
6DI CI6 6CI 10140 10065 1015 1023 10075 10021 10170 1080 10145 10015 10185 10080 10265 1007 0 10195 N W 1 0 2 N D A V E N W A S H S T NWCORNELLRD 10140 NW Cornell Rd7/25/2022 0 30 60 Feet ¯ Legend Water Main Requested Area TUALATIN VALLEY WATER DISTRICT CANNOT GUARANTEE AND MAKES NO REPRESENTATION OF THE ACCURACY OF THE MEASUREMENTS OR LOCATIONS ON MAPS OR INFORMATION PROVIDED. DESIGN ENGINEER OR CONTRACTOR MUST VERIFY IN FIELD. THIS MAP DOES NOT CONTAIN METERS AND SERVICES THAT MAY EXIST IN FIELD. ASSETS THAT EXIST OUTSIDE OF REQUESTED AREA MAY HAVE BEEN REMOVED FROM MAP.

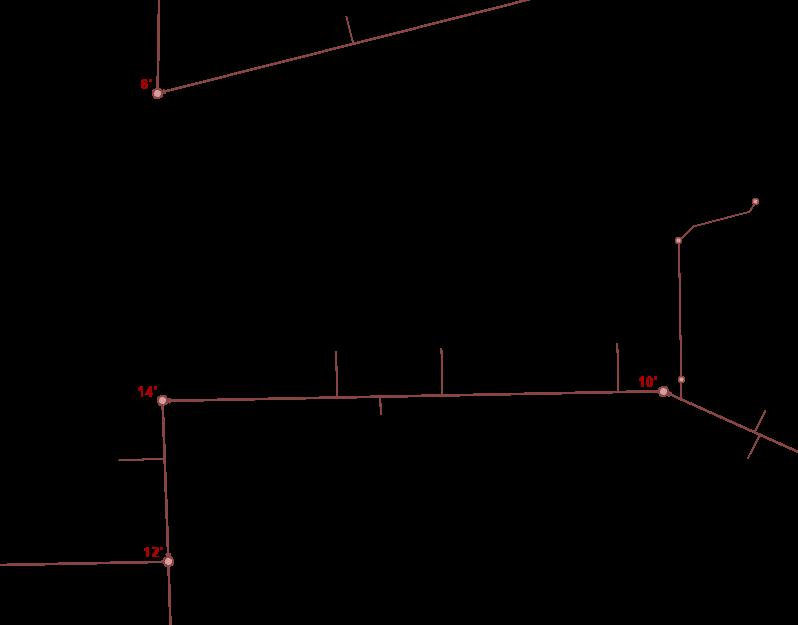
±Disclaimer: This product and its associated data is for informational purposes only and was derived from several databases. It was not prepared for, and is not suitable for legal, engineering or surveying purposes. Users of this information should review or consult the primary data and information sources to ensure accuracy. Clean Water Services cannot accept any responsibility for errors, omissions or positional accuracy. There are no warranties for this product. Mainline and service lateral locations are depicted using best available information but must be field verified and located before digging. Service laterals are marked in the field as “Unlocatable underground facilities” as defined in OAR 952-001-0010 (20). Easement data is not currently completed District-wide and should be used for general reference only. All sanitary or storm sewer data, with the exception of sanitary lines 24” and larger located within the city limits of Beaverton, Cornelius, Forest Grove, Hillsboro, Lake Oswego, Portland, Sherwood, Tigard or Tualatin, need to be verified by contacting the individual city. Notification of any errors would be appreciated. Clean Water Services, Development Services, 2550 SW Hillsboro Highway, Hillsboro OR 97123, (503) 681-5100. 0 0.01 0.010.02 mi AbandonedX PrintServiceTemplate


Zoning Detailed Zoning Informa on R‐5 (Residen al 5 Units Per Acre) Zoning Map Community Jurisdic on
If your requested information is not visible, please click here. Navigation: Washington County » GIS » Reports: GeoSearch District Overlay 1N135CB01400 | General Information interactive maps map frequentlyothercontactsgallerygislinksasked questions Property Search property / taxlot tax maps Survey Search Land Services Building Services Overlay Information 1N135CB01400 Jurisdiction: Urban Unincorporated Washington Co Plan Designation: (Zoning) R-5 (click to open CDC) - Land Use District Summary General Setbacks for the Land Use District (May differ depending upon location): Front: 15 / Side: 5 / Rear: 15 / Street Side: 10 Within Urban Growth Boundary: Yes Within Metro's Urban Service Area (*Updated July 31st each calendar year): Yes In Urban Road Maintenance District (*Updated July 31st each calendar year): Yes In ESPD (*Updated July 31st each calendar year): Yes Ground Water Resouce Area: Not located within a Ground Water Resource Area Service District for Lighting Assessment Area/zone: Not in an Assessment Area. Sanitation District (*Updated July 31st each calendar year): CWS Water District (*Updated July 31st each calendar year): TVW Fire District (*Updated July 31st each calendar year): TVFR Fire Management Zone: 5389 Park District: Collect THPRD SDC North Bethany Plan Area: Not in North Bethany Sub Area School District (*Updated July 31st each calendar year): BEAVERTON Election Precinct: 365 Commissioner District: 2- Pam Treece Assessor Area: 6 Citizen Participation Org: CPO1 Community Plan Map: Cedar Hills - Cedar Mill Historic & Cultural Resource Inventory: Not located within a Historic and Cultural Resource Inventory Area Airport Overlay: Not located within an Airport Overlay POD Date Zoned: POD:1-9/9/59 ODOT District: 2B Plat: Property is not part of a subdivision Census Tract: 030102 Census Blockgroup: 410670301022 Census Block: Block 2021 Zipcode: 97229 Garbage Hauler: Walker Garbage Service Garbage Dropbox: Washington County Dropbox * The data layers used to derive items in the report are assembled from multiple sources. Report items flagged with an asterisk (*) are derived from the taxcode layer


maintained by Washington County s Department of Assessment and Taxation Cartography Division. The taxcode layer is updated once a year on July 31st and may not reflect final/proposed annexations or boundary adjustments. All information should be verified with individual service districts.
© 2000 - 2022 Washington County. All rights reserved. Links to external sites do not constitute endorsements by Washington County. By visiting this and other Washington County web pages, you expressly agree to be bound by the terms and conditions of the site. For questions regarding information privacy, liability, accessibility, and public records policies, please review the statements document. This page maintained by Washington County Technology Services. Need assistance with this page? email us
302 1 302 2 302 2 1 302 2 2 302 2 3 302 2 4 A B. 302 2.5 A. B C 302 2 6 302 2.7 302 2.8 302 2.9 302 2.10 302 2 11 302 2.12 302 2 13 302 R 5 DISTRICT (RESIDENTIAL 5 UNITS PER ACRE) Intent and Purpose The R 5 District is intended to implement the policies of the Comprehensive Plan for areas designated for residential development at no more than five units per acre and no less than four units per acre, except as specified otherwise by Section 300 2, Section 300 5, or Section 302 6 The primary purpose is to protect existing neighborhoods developed at five units per acre or less. Infill development on all parcels 2 acres or less may occur only through application of the infill policy (Section 430 72) Uses Permitted Through a Type I Procedure The following uses are permitted subject to the specific standards for the use set forth below and in applicable Special Use Sections of Section 430, as well as the general standards for the district, the Development Standards of Article IV and all other applicable standards of the Code. Accessory Uses and Structures Section 430 1 Bus Shelter Section 430 23 Attached Dwelling Units (duplex on an approved duplex lot only) Section 430 13 3 Detached Dwelling Unit New dwelling on an existing lot or parcel that does not exceed 16,500 square feet in buildable area (buildable area is exclusive of unbuildable land categories listed in Section 300 3.1) Section 430 37.1 A. Expansion or replacement of an existing dwelling Section 430 37.1 A. Expansion of any Type II or III use which meets the following: Is exempt from application of public facility standards of Section 501 2 or meets the standards for a Type I review pursuant to Section 501 3 2; Is not in an Area of Special Concern as designated on the applicable Community Plan map; and Is not a telecommunication facility Home Occupation Section 430 63 1 Parks Section 430 97. Recycle Drop Box Section 430 113. Temporary Use Section 430 135.1, excluding C.(9) and J. Manufactured Home on an existing lot or parcel that does not exceed 16,500 square feet in buildable area (buildable area is exclusive of unbuildable land categories listed in Section 300 3 1) Section 430 76 Co location of antennas, excluding those antennas exempt pursuant to Sections 430 109 3 and 201 2 Section 430 109. New Telecommunication Facilities with Towers using Stealth Design to a maximum height of 100 feet and new Small Wireless Facilities, excluding those facilities exempt pursuant to Sections 430 109 3 and 201 2 Section 430 109 Accessory Dwelling Unit(s) Section 430 2 1 ( Ord. No. 826A, § 2.A.(Exh. 1, § 3), 10 24 17 , eff. 11 24 17; Ord. No. 831A , § 2.A.(Exh. 1, § 3), 7 17 18, eff. 8 16 18; Ord. No. 855 , § 2.A.(Exh. 1, § 3), 8 6 19, eff. 11 28 19; Ord. No. 856A , § 2.A.(Exh. 1, § 2), 10 22 19, eff. 11 28 19; Ord. No. 859 , § 2.A. (Exh 1, § 2), 9 17 19, eff 11 28 19)
302 3 302 3.1 302 3.2 302 3 3 302 3 4 302 3 5 302 3 6 302 3.7 302 3.8 302 3.9 A. B C D E F 302 3 10 302 3.11 302 3 12 302 3 13 302 4 Uses Permitted Through a Type II Procedure The following uses are permitted subject to the specific standards for the use set forth below and in applicable Special Use Sections of Section 430, as well as the general standards for the district, the Development Standards of Article IV and all other applicable standards of the Code Approval may be further conditioned by the Review Authority pursuant to Section 207 5 Ambulance Service Section 430 9.1. Flag lot Section 430 46. Home Occupation Section 430 63 2 Infill Section 430 72 Parks Section 430 97 Construction of a local street not in conjunction with a development application or within existing right of way. Temporary Use Section 430 135.2 A. and B. Expansion of Existing Telecommunication Facilities, including co located antennas, not otherwise allowed through a Type I Procedure pursuant to Section 430 109 5 or exempt pursuant to Sections 430 109 3 and 201 2 Section 430 109 Uses Accessory and Incidental to a Residential Development Provided for the Service and Convenience of the Residents: Clubhouse. Meeting hall Day care facility Section 430 53 2 Recreation center Gymnasium Indoor swimming pool Tree removal in areas identified in the applicable Community Plan as Significant Natural Resources, subject to Section 407 3. Detached Dwelling Unit on an existing lot or parcel with a buildable area greater than 16,500 square feet (buildable area is exclusive of unbuildable land categories listed in Section 300 3 1) Section 430 37 1 B Manufactured Home on an existing lot or parcel with a buildable area greater than 16,500 square feet (buildable area is exclusive of unbuildable land categories listed in Section 300 3.1) Section 430 76 and Section 430 37 1 B (1 3) Guest House Section 430 55 ( Ord No 826A, § 2 A (Exh 1, § 3), 10 24 17 , eff 11 24 17; Ord No 832A , § 2 A (Exh 1, § 3), 9 18 18, eff 10 18 18; Ord No 864 , § 2.A.(Exh. 1, § 1), 7 21 20, eff. 8 20 20) Uses Which May Be Permitted Through a Type III Procedure The following uses may be permitted subject to the specific standards for the use set forth below and in applicable Special Use Sections of Section 430, as well as the general standards for the District, the Development Standards of Article IV and all other applicable standards of the Code. Approval may be further conditioned by the Review
Keeping of fowl for sale, keeping swine (except for up to three purebred potbelly pigs as household pets and not for breeding purposes) operating a feed lot
approach zones.
in
shall
Mounting a communication tower or antenna, that is not a permitted accessory use, on a detached dwelling an antenna, that is not a permitted accessory use, on a communication tower that is accessory to a detached dwelling.
302 4.1 302 4.2 302 4.3 302 4 4 302 4 5 302 4 6 302 4 7 302 4 8 302 4 9 302 4 10 302 4 11 302 4.12 302 4.13 302 4 14 302 4 15 302 4 16 302 5 302 5.1 302 5.2 302 5.3 302 5 4 302 5 5 302 5 6 302 5 7 302 5 8 302 5.9 Authority pursuant to Section 207 5 Attached Dwelling Units Section 430 13. Boarding House, includes Bed & Breakfast Section 430 19. Campground Section 430 25. Cemetery Section 430 27 Golf Course (may include Country Club) Section 430 51 Group Care Section 430 53 1 through 430 53 3 Heliport (Personal use only) Section 430 59 Hospital Section 430 65 Kennel Section 430 73 Public Building Section 430 103 Public Utility Section 430 105 New Telecommunication Facilities with towers not using Stealth Design, to a maximum height of 100 feet Section 430 109. School Section 430 121. Special Recreation Use Section 430 131 Storage Area for Recreation Vehicles Section 430 133 Religious Institution Section 430 116 ( Ord No 826A, § 2 A (Exh 1, § 3), 10 24 17 , eff 11 24 17; Ord No 832A , § 2 A (Exh 1, § 3), 9 18 18, eff 10 18 18) Prohibited Uses Structures or uses not specifically authorized by Section 302. The use of a manufactured dwelling or recreational vehicle as a residence except where specifically authorized as a temporary use in Section 302 2 8, 302 2 9, 302 3 7, 302 3 12 or as allowed under 201 2 (Exclusions from Permit Requirement). Any parking or storage of tractor trailers, semi trucks, or heavy equipment, not including farm equipment or logging trucks used in conjunction with a farm or forest use
The
The location of service facilities such as high schools, hospitals, assembly high density residential development airport Location of these facilities be avoided within any
existing June, 1983 airport year 2000 LDN 55 contour
outdoor parking or storage of any five or more operable vehicles on a single lot or parcel for more than 48 hours, except as approved in conjunction with a development or as allowed under 201 2 (Exclusions from Permit Requirement).
Mounting
or
nursing homes, public
Auto wrecking yards.
and
The size, configuration and location of proposed lots or parcels to be created through an application, and the location of dwellings and structures on the proposed lots or parcels, shall not preclude: Future development of the subject property to the minimum density as shown in the future development plan; and
The Review Authority finds that building to the minimum density would result in, or be in jeopardy of, landslide or soil liquification hazards, or other geologic hazards
Development to the required minimum density may be phased over time through future land divisions when the following standards are met:
In the R 5 District:
The Review Authority may exclude slopes between 15% and 20% from the acreage used to calculate the minimum density when the following standards are met:
The location of unbuildable categories of land listed in Section 300 3.1;
A future development plan shall be submitted which demonstrates how the entire site can be ultimately developed consistent with the minimum density and other applicable standards of the Code The plan shall include: Complete parcelization of the subject property, including the size and configuration of all lots or parcels; Vehicular and pedestrian access and circulation necessary to serve the ultimate development on the subject property and adjacent properties;
Future development or redevelopment of adjacent properties to the permitted density; No future street, easement, or public facility shall be located on the subject property in a manner that
The permitted residential density shall be no more than five units per acre and no less than four units per acre, except as permitted by Section 300 2 or by 302 6.2 below; and A lot shall be at least 14,000 square feet in area in order to be divided
302 5.10 302 6 302 6.1 A. B 302 6 2 A. B. 302 6 3 A. (1) (2) (3) (4) B. (1) (2) C. Marijuana production that requires a license from the Oregon Liquor Control Commission. Marijuana production includes the manufacture, planting, cultivation, growing, or harvesting of marijuana. ( Ord No 810, § 2 A (Exh 1, § 1), 10 25 16 ; Ord No 866 , § 2 C (Exh 3, § 3), 9 1 20, eff 10 1 20) Density
Public facilities and services necessary to serve the ultimate development, including location and required easements and tracts. Public facilities and services shall include, but are not limited to, water, sewer, fire protection, and drainage, including storm water and water quality facilities and any necessary buffers; and
The applicant submits an engineering geology report that demonstrates the subject area should not be built to the minimum density due to landslide or soil liquification hazards, or other geologic hazards. The engineering geology report shall be prepared by a registered civil engineer experienced in geotechnical engineering and/or a certified engineering geologist or a registered professional geologist. The report shall be accepted as complete by the Building Engineer prior to submission of an application The Building Engineer may require an outside peer review to assist in the review of the engineering geology report. The applicant shall be responsible for the costs of such a review; and
The minimum yard requirements shall be: Fifteen foot front yard to the front building wall and 12 feet to a porch or other covered or enclosed entryway; Twenty foot front or street side yard to garage vehicle entrance, or 4 foot rear yard to vehicle entrance from an alley Portions of a structure located directly above a rear alley loaded garage are also subject to a minimum 4 foot rear yard and shall not be closer to the rear lot line than the garage vehicle entrance; Ten foot street side yard; Five foot side yard; Fifteen foot rear yard, except as provided in B. above; Required yards shall be horizontally unobstructed except as provided in Section 418; and Additional setbacks may be required as specified in Sections 411 and 418.
Lot Dimensions:
The minimum dimensions for any new lot or parcel shall be: Lot width 40 feet; Lot depth 60 feet; Lot width at the street or access point 40 feet except as allowed through Section 430 45 (flag lots); and
For subdivisions, each phase of a subdivision shall comply with the minimum density requirement.
The average lot area of lots within a proposed development (land divisions and property line adjustments) shall be no less than 6,000 square feet (does not include tracts); and The minimum lot area of a lot shall be 5,500 square feet
Yard (Setback) Requirements Yards shall be measured from the property line, sidewalk, or easement for public travel, whichever is closest to the building line.
The maximum height for structures shall be 35 feet except as modified by other Sections of this Code.
The maximum height for accessory structures shall be 15 feet except as modified by other Sections of this Code
Normal building appurtenances and projections such as spires, belfries, cupolas, chimneys, ventilators, elevator housings or other structures placed on or extending above roof level may exceed the 35 foot building height limit to a maximum height of 60 feet
Dimensional Requirements Lot Area:
Height:
D. 302 7 302 7.1 A. B 302 7 2 A B. C. D. E. F. G. 302 7.3 A. B. C D E. 302 7.4 A B C would preclude future development to the minimum density as shown on the future development plan or preclude development of adjacent properties to the permitted density; and
The height of telecommunication facilities are regulated by the Permitted Use sections of this Land Use District, Sections 201, 430 1, 430 109 and other applicable provisions of this Code.
For any detached dwelling or manufactured dwelling (except manufactured dwellings in a manufactured dwelling park or a manufactured dwelling approved as a temporary use), and their accessory structures, the maximum building height shall comply with the Solar Balance Point Standard in Section 427 4
D 302 8 302 9 Lot width at street on a cul de sac, eyebrow corner, hammerhead terminus, or other street terminus 20 fee ( Ord No 855 , § 2 A (Exh 1, § 3), 8 6 19, eff 11 28 19) Parking Requirements Required off street and on street parking shall be provided in accordance with the provisions of Section 413. Article IV Development Standards In addition to the requirements of this District, the standards of Article IV Development Standards, including Section 422 (Significant Natural Resources), are applicable as required by Subsection 403 3.
INST NC R-5 RR-5R-5R-5 -5 RR-5 -5 RR-5 -5 R-5 R-5 R-5 R-5 R-6 R-6 R-6 R-6 R-6 R-6 R-6 R-6 R-6 RR-6 -6 R-6 R-6 R-9 R-9 R-9 R-9 R-9 R-9 R10 NW 94TH AVE N W 9 8 T H P L NW JORDAN LN N W 1 0 7 TH A V E N W 9 6 T H A V E N W 1 0 2 N D A V E NW BERMAR LN N W 9 7 T H A V E NW WAYNE LN N W 1 0 0 T H TER NW ARBORVIEW DR N W 9 5 T H A V E NW A SHCRE E K LN NW LEAHY RD NW ASH ST N W 97 T H A VE DNW O UGLAS PL NW CROSSING DR N W 9 5 T H A V E NW EMBER LN N W 1 0 6 T H T E R N W 9 7 T H A V E NW MARING DR NW CORNELL RD N W 1 0 1 S T A V NE W A L P E N G L O W W A Y N W 9 8 TH AV E NW RANDALL LN NW BERMAR LN N W A L P E N G L O W W A Y NW NOTTAGE DR NW 9 9 T H A V E NW COPELAND ST N W 94THTER NW JORDAN LN NW BRIE CT NW REEVES ST NW REX CT NW ROYAL ROSE CT NWSHADYWOOD LN NW HARVEST HILL DR NW PRISCILLA CT NW GREEN VIEW LN NW BRADY LN NW W ALTERSLN Th s map is a copy of pub ic record and s provided sole y for nformation purposes W FG Nat ona Title assumes no liab lity for variations, f any, n dimensions, area or ocation of the premises or the locat on of mprovements Customer Service Department 12909 SW 68th Parkway, Suite 350 Portland, OR 97223 (503) 603 1700 cs@wfgnationaltitle.com 0 190 9380 5 Fee t Zoning Subject Propert y Tax Lots Commercial Mixed Use Residential Single Family ²

10140 NW CORNELL RD, PORTLAND, OR, 97229 Washington County T1N R1W S35 Latitude: 45.526445, Longitude: 122.7 TAXLOT INFORMATION Tax Lot ID: 1N135CB014 R Number: R647161 Tax Lot Size: 0.46 acres Building Area 2263 Market Total Value $527,150.00 Land Use SFR Year Built 1956 Sale Date 201404 Sale Price 370000 Market Land Value 314120 00000 Market Building Value 213030.00000 State General Property Class 101 County Tax Code 051 50 Site Address 10140 NW CORNELL RD POLITICAL BOUNDARIES Jurisdiction Unincorporated Washington County Neighborhood CPO1 cedar hills cedar mill s Voting Precinct 365.00000000 Metro Council District 5 Metro Councilor Mary Nolan Metro Councilor Email mary.nolan@oregonmetro.gov US Congressional District 1 Oregon House District 33 +20 m 50 ft Lea�et (http://lea�etjs com) | Tiles: © Metro RLIS

Oregon Senate District 17 LAND USE AND PLANNING Local Zoning R 5 Generalized Zoning SFR Classi�ed Zoning SFR5 Watershed Rock Creek Tualatin River Sub Watershed Beaverton Creek Basin Willamette Sub Basin Tualatin Flood Plain Outside Wetland Not in a wetland Urban Growth Boundary Inside Urban/Rural Reserve Reserve Name USGS Quad Name Linnton SERVICE DISTRICTS Garbage Hauler Walker Garbage Service Commercial Hauler Walker Garbage Service Dropbox Provider Washington County Dropbox School District BEAVERTON School District Number 48J Oregon Dept. of Ed. Dist. ID 2243 Natl. Center for Ed. Statistics Dist. ID 4101920 Water District Tualatin Valley Water District Park District Tualatin Hills Park and Recreation District Sewer District Clean Water Services District Fire District Tualatin Valley Fire and Rescue District Fire Management Zone 4885 CENSUS INFORMATION Census Tract 301 02000000 Census Block Group 2
Census Block Population (2010) 3246 Data Resource Center 600 Northeast Grand Avenue, Portland, OR 97232 503 797 1742 drc@oregonmetro.gov © Oregon Metro www.oregonmetro.gov/rlis This Web site is offered as a public service, integrating various government records into a region wide mapping system The property assessment records are a multi county integration of Clackamas, Multnomah and Washington County records MetroMap blends each county's records into a common database on a quarterly basis Therefore, to view each county's of�cial records, go to their respective web sites or of�ces The other MetroMap data are derived from city, county, state, federal and Metro sources
The metadata (data about the data) are included on this site, including the sources be consulted for veri�cation of the information contained herein. It describes some cases where Metro blends city and county records by generalizing the disparities Metro assumes no legal responsibility for the compilation of multi source government information displayed by Metro Map Users of this information are cautioned to verify all information
to

Custom Maps Topography Water Features Aerial Aerial Environmental Community Transit Vacant Land
NW WAYNE LN N W 1 0 0 T H T E R N W 9 9 T H A V E NWASHST NW CORNELL RD N W 1 0 2 N D A V E NW ASHCREEK LN N W A S H S T 475 460 470 485 445 450 455 425 4480 40 490 465 475 510 485 5 0 0 4 4 5 490 505 430 475 500 450 4495 90 455 495 485 435 480 410 430 500 4 9 0 440 4 7 0 420 430 480 490 470 480 470 440 460 450 Th s map is a copy of pub ic record and s provided sole y for nformation purposes W FG Nat ona Title assumes no liab lity for variations, f any, n dimensions, area or ocation of the premises or the locat on of mprovements Customer Service Department 12909 SW 68th Parkway, Suite 350 Portland, OR 97223 (503) 603 1700 cs@wfgnationaltitle.com 0 60 3120 0 Fee t Contours Tax Lots Subject Propert y 5' Contours ²
NW 94TH AVE N W 9 8 T H P L NW JORDAN LN N W 1 0 7 TH A V E N W 9 6 T H A V E N W 1 0 2 N D A V E NW BERMAR LN N W 9 7 T H A V E NW WAYNE LN N W 1 0 0 T H TER NW ARBORVIEW DR N W 9 5 T H A V E NW A SHCRE E K LN NW LEAHY RD NW ASH ST N W 97 T H A VE DNW O UGLAS PL NW CROSSING DR N W 9 5 T H A V E NW EMBER LN N W 1 0 6 T H T E R N W 9 7 T H A V E NW MARING DR NW CORNELL RD N W 1 0 1 S T A V NE W A L P E N G L O W W A Y N W 9 8 TH AV E NW RANDALL LN NW BERMAR LN N W A L P E N G L O W W A Y NW NOTTAGE DR NW 9 9 T H A V E NW COPELAND ST N W 94THTER NW JORDAN LN NW BRIE CT NW REEVES ST NW REX CT NW ROYAL ROSE CT NWSHADYWOOD LN NW HARVEST HILL DR NW PRISCILLA CT NW GREEN VIEW LN NW BRADY LN NW W ALTERSLN Th s map is a copy of pub ic record and s provided sole y for nformation purposes W FG Nat ona Title assumes no liab lity for variations, f any, n dimensions, area or ocation of the premises or the locat on of mprovements Customer Service Department 12909 SW 68th Parkway, Suite 350 Portland, OR 97223 (503) 603 1700 cs@wfgnationaltitle.com 0 190 9380 5 Fee t Flood Plain Tax Lots Subject Propert y St reams Flood Plain Wetlands Riv ers ²
NW WAYNE LN N W 1 0 0 T H T E R N W 9 9 T H A V E NW CORNELL RD N W 1 0 2 N D A V E NW ASHCREEK LN N W A S H S T Th s map is a copy of pub ic record and s provided sole y for nformation purposes W FG Nat ona Title assumes no liab lity for variations, f any, n dimensions, area or ocation of the premises or the locat on of mprovements Customer Service Department 12909 SW 68th Parkway, Suite 350 Portland, OR 97223 (503) 603 1700 cs@wfgnationaltitle.com 0 60 3120 0 Fee t Aerial Subject Propert y Tax Lots ²
NW WAYNE LN N W 1 0 0 T H T E R N W 9 9 T H A V E NWASHST NW CORNELL RD N W 1 0 2 N D A V E NW ASHCREEK LN N W A S H S T 475 460 470 485 445 450 455 425 4480 40 490 465 475 510 485 5 0 0 4 4 5 490 505 430 475 500 450 4495 90 455 495 485 435 480 Th s map is a copy of pub ic record and s provided sole y for nformation purposes W FG Nat ona Title assumes no liab lity for variations, f any, n dimensions, area or ocation of the premises or the locat on of mprovements Customer Service Department 12909 SW 68th Parkway, Suite 350 Portland, OR 97223 (503) 603 1700 cs@wfgnationaltitle.com 0 60 3120 0 Fee t Aerial Topo Tax Lots Subject Propert y 5' Contours ²
Cedar M ll Ele mentary K n derCare Cedar H ls Edup lin Sp anish Chr stian School CENTRAL BEAVERTON NORTHWEST HEIGHTS CPO 1 CEDAR HILLS CEDAR MILL S CPO 1 CEDAR HILLS CEDAR MILL S Th s map is a copy of pub ic record and s provided sole y for nformation purposes W FG Nat ona Title assumes no liab lity for variations, f any, n dimensions, area or ocation of the premises or the locat on of mprovements Customer Service Department 12909 SW 68th Parkway, Suite 350 Portland, OR 97223 (503) 603 1700 cs@wfgnationaltitle.com 0 420 2840 10 Fee t Community Tax Lots Subj ect Prop erty 8 9 : s Fire Stations n o Hosp ital s n School s n Libraries Neighborhood s Rivers Park ²
N W 9 8 T H P L NW JORDAN LN NW FLE I S C H N E R S T N W 9 3 R D A V E NW LMORGAN N N W 1 0 7 T H A V E NW CAXTON LN N W 9 6 T H A V E NW 1 0 2 N D A V E NW B E RMA R LN NW LEAHY RD NW LOST PARK DR N W 9 7 T H A V E S W 1 0 4 T H A V E NW FLOTOMA DR NW FULLNER CT NW WAYNE LN N W 1 1 2 T H A V E NW CORNELL RD N W C E D A R H I L L S B L V D NW ASH ST N W 1 00THTER NWARBORVIE W D R N W M U R L E A L N NWMARV N LN N W 1 1 3 T H A V E NW LEAHY TER NW JENNIFER PL N W 1 1 0 T H A V E NW REEVE S ST NW RIESLING CT NW BURNTKNOLL CT NW KEARNEY ST NW FLOTOMA DR N W 9 5 T H A V E NW ASHCREEKLN NW LEE ST N W A N D R E W P L NW KENZIE LN NWA95TH VE NW QUINN LN N W 9 1 S T A V E NW 9 2 N D A V E NW HOYT ST NW 95TH AVE NW BENFIELD DR NW ASH ST NWELF I SCHNERST NW 9 5 T H EVA HNWFOX OLLOWCT N W 9 4 T H A V E NW VALROS LN NW CINDER CT N W 9 7 T H A V E NW MA GNOLIA LN NW LUCERNE CT NW OAK ST NW MURLEA LN NW BARNHART LN NW93RDPL N W L E E C T NW DOUGLASPL NW CROSSING DR N W 1 0 1 S T A V E NW LUSANNE CT NW ZERMATTCT NW SUNDOWNWAY NW J O L I E P L N W 1 0 6 T H T E R NW MARING DR NW LEAHY RD NW ASH ST NW EGGERS CT N W 98T H A V E NW EMBER LN NW RANDALL LN N W F U L L N E R P L N W 9 0 T H A V E NW BERMAR LN NW BROOK STONE CT N W 9 7 T H A V E NW 95TH AVE N W S L O C UM W A Y NW NOTTAGE DR N W H A TR W E L L P L NW JERICHO CT N W L A M O N D E T E R NW 9 9 T H A V E NW HARVEST HILL DR LNW AURINDA CT N W 9 3 R D A V E NW ARCAD AN LN NW MURLEA DR N W 94THTER NW JORDAN LN NW 91S PT L NW BRIE CT NW MONTREUX LN N W 9 3 R D P L N W 9 0 T H P L NW SHERRY CT N W MAYFIELD RD NW REX CT NW ROYAL ROSE CT N W 1 1 0 T H A V E NWSHADYW OOD LN N W 1 0 9 T H A V E NW COPELAND ST NW PRISCILLA CT NW FLEETWOOD DR NW LEAHY RD NWSUNDO W N W A Y NW GREEN VIEW LN NW KEARNEY S T NW LOVEJOY ST N W 9 2 N D P L WN ROF E WSTVIEW AY NW BRADY LN NW W ALTERS LN N W 9 9 T H A V E N W O R CHARD DR N WALPENGLOW W AY NW REEVE S ST N W 9 5 T H A V E Cedar Mill Park Cedar Mill Wo ods Natu ral Area Cedar Mill Wo ods Natu ral Area Foeg e Par k Foeg e Park Foege Park Foeg e Par k Jackie Husen Park Jord an Wo ods Natu ral Area Jord an Wo ods Natu ral Area Mit ch ell Park Roger Tilbu ry Memo rial Par k Th s map is a copy of pub ic record and s provided sole y for nformation purposes W FG Nat ona Title assumes no liab lity for variations, f any, n dimensions, area or ocation of the premises or the locat on of mprovements Customer Service Department 12909 SW 68th Parkway, Suite 350 Portland, OR 97223 (503) 603 1700 cs@wfgnationaltitle.com 0 320 1640 60 Fee t Tr ansit Tax Lots Subject Propert y X Bus Stops X Light Rail Stops Æ Park & Ride n Transit Centers Bike Routes Bus Lines Light Rail OHSU Tram Park ²
NW 94TH AVE N W 9 8 T H P L NW JORDAN LN N W 1 0 7 TH A V E N W 9 6 T H A V E N W 1 0 2 N D A V E NW BERMAR LN N W 9 7 T H A V E NW WAYNE LN N W 1 0 0 T H TER NW ARBORVIEW DR N W 9 5 T H A V E NW A SHCRE E K LN NW LEAHY RD NW ASH ST N W 97 T H A VE DNW O UGLAS PL NW CROSSING DR N W 9 5 T H A V E NW EMBER LN N W 1 0 6 T H T E R N W 9 7 T H A V E NW MARING DR NW CORNELL RD N W 1 0 1 S T A V NE W A L P E N G L O W W A Y N W 9 8 TH AV E NW RANDALL LN NW BERMAR LN N W A L P E N G L O W W A Y NW NOTTAGE DR NW 9 9 T H A V E NW COPELAND ST N W 94THTER NW JORDAN LN NW BRIE CT NW REEVES ST NW REX CT NW ROYAL ROSE CT NWSHADYWOOD LN NW HARVEST HILL DR NW PRISCILLA CT NW GREEN VIEW LN NW BRADY LN NW W ALTERSLN Cedar Mill Park Cedar Mill Wo ods Natu ral Area Cedar Mill Woods Natural Area Jackie Husen Par k Jord an Wo ods Natu ral Area Roger Tilbu ry Memo rial Par k Th s map is a copy of pub ic record and s provided sole y for nformation purposes W FG Nat ona Title assumes no liab lity for variations, f any, n dimensions, area or ocation of the premises or the locat on of mprovements Customer Service Department 12909 SW 68th Parkway, Suite 350 Portland, OR 97223 (503) 603 1700 cs@wfgnationaltitle.com 0 190 9380 5 Fee t Vacant Tax Lots Subject Propert y Vacant Lots Park ²
Miscellaneous Demographics Traffic Counts
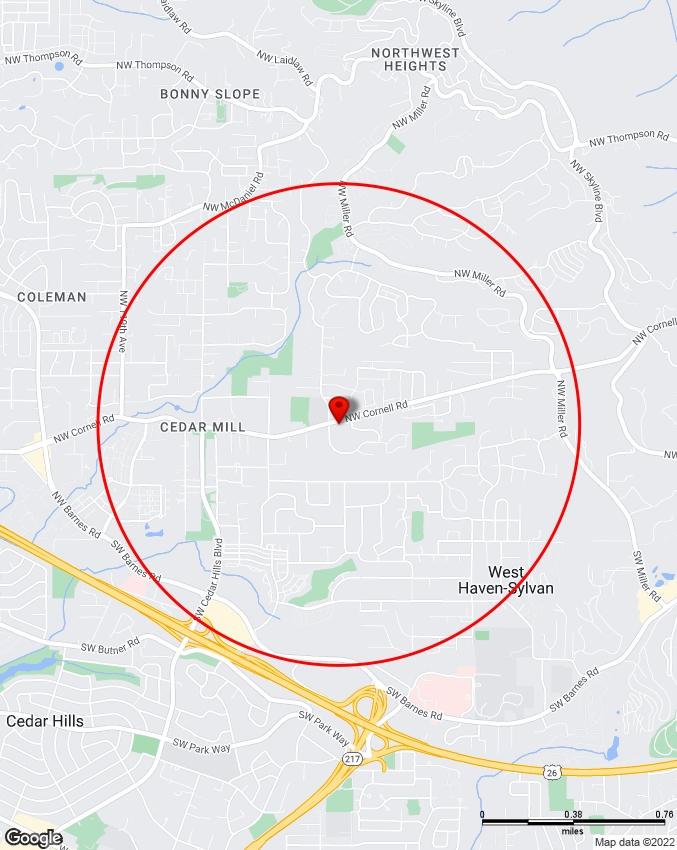
10140 NW Cornell Rd, Portland, OR 97229

10140 NW Cornell Rd, Portland, OR 97229 Sitewise Online Pop-Facts: Population Quick Facts Pop-Facts: Population Quick Facts 10140 NW Cornell Rd, Portland, OR 97229 0 - 1 mi Population 2027 Projection 13,950 2022 Estimate 13,112 2010 Census 10,559 2000 Census 7,424 Growth 2022-2027 6.39% Growth 2010-2022 24.17% Growth 2000-2010 42.23% 2022 Est. Population by Age 13,112 Age 0 to 4 655 4.99% Age 5 to 9 678 5.17% Age 10 to 14 738 5.63% Age 15 to 17 509 3.88% Age 18 to 20 469 3.58% Age 21 to 24 645 4.92% Age 25 to 34 1,903 14.51% Age 35 to 44 1,510 11.52% Age 45 to 54 1,860 14.19% Age 55 to 64 1,782 13.59% Age 65 to 74 1,497 11.42% Age 75 to 84 659 5.02% Age 85 and over 206 1.57% Age 16 and over 10,874 82.93% Age 18 and over 10,532 80.32% Age 21 and over 10,062 76.74% Age 65 and over 2,363 18.02% 2022 Est. Median Age 41.35 2022 Est. Average Age 41.24
2022 Est. Population by Single-Classification Race 13,112 White Alone 9,872 75.29% Black or African American Alone 238 1.81% American Indian and Alaska Native Alone 24 0.19% Asian Alone 2,046 15.60% Native Hawaiian and Other Pacific Islander Alone 26 0.20% Some Other Race Alone 212 1.62% Two or More Races 693 5.29% 2022 Est. Population by Ethnicity (Hispanic or Latino) 13,112 Hispanic or Latino 642 4.90% Not Hispanic or Latino 12,470 95.10% 2022 Est. Population by Sex 13,112 Male 6,493 49.52% Female 6,619 50.48% Copyright © Claritas, LLC 2022. All rights reserved. 10140 NW Cornell Rd, Portland, OR 97229 Sitewise Online Pop-Facts: Population Quick Facts Pop-Facts: Population Quick Facts 10140 NW Cornell Rd, Portland, OR 97229 0 - 1 mi
10140 NW Cornell Rd, Portland, OR 97229 Sitewise Online Pop-Facts: Household Quick Facts Pop-Facts: Household Quick Facts 10140 NW Cornell Rd, Portland, OR 97229 0 - 1 mi Households 2027 Projection 5,610 2022 Estimate 5,271 2010 Census 4,226 2000 Census 3,040 Growth 2022-2027 6.43% Growth 2010-2022 24.73% Growth 2000-2010 39.01% 2022 Est. Households by Household Income 5,271 Income Less than $15,000 136 2.58% Income $15,000 to $24,999 92 1.75% Income $25,000 to $34,999 139 2.65% Income $35,000 to $49,999 290 5.50% Income $50,000 to $74,999 499 9.46% Income $75,000 to $99,999 547 10.39% Income $100,000 to $124,999 511 9.69% Income $125,000 to $149,999 436 8.27% Income $150,000 to $199,999 768 14.58% Income $200,000 to $249,999 500 9.49% Income $250,000 to $499,999 700 13.27% Income $500,000 or more 652 12.37% 2022 Est. Average Household Income $ 203,089 2022 Est. Median Household Income $ 149,128 2022 Median HH Inc. by Single-Classification Race White Alone $ 145,707 Black or African American Alone $ 117,863 American Indian and Alaska Native Alone $ 76,088 Asian Alone $ 181,438 Native Hawaiian and Other Pacific Islander Alone $ 70,118 Some Other Race Alone $ 164,810 Two or More Races $ 67,065 Hispanic or Latino $ 118,362 Not Hispanic or Latino $ 151,230 2022 Est. Households by Household Type 5,271 Family Households 3,556 67.46% Nonfamily Households 1,715 32.54% 2022 Est. Group Quarters Population 100
2022 Est. Households by Household Size 5,271 1-person 1,260 23.90% 2-person 1,953 37.06% 3-person 903 17.13% 4-person 774 14.69% 5-person 292 5.53% 6-person 64 1.21% 7-or-more-person 26 0.49% 2022 Est. Average Household Size 2.47 10140 NW Cornell Rd, Portland, OR 97229 Sitewise Online Pop-Facts: Household Quick Facts Pop-Facts: Household Quick Facts 10140 NW Cornell Rd, Portland, OR 97229 0 - 1 mi
2022 Est. HHs by Type by Presence of Own Children 3,556 Married-Couple Family, own children 1,416 39.81% Married-Couple Family, no own children 1,662 46.73% Male Householder, own children 83 2.35% Male Householder, no own children 69 1.94% Female Householder, own children 195 5.48% Female Householder, no own children 131 3.69% Copyright © Claritas, LLC 2022. All rights reserved. 10140 NW Cornell Rd, Portland, OR 97229 Sitewise Online Pop-Facts: Household Quick Facts Pop-Facts: Household Quick Facts 10140 NW Cornell Rd, Portland, OR 97229 0 - 1 mi
10140 NW Cornell Rd, Portland, OR 97229 Sitewise Online Pop-Facts: Demographic Snapshot (Part 1) Pop-Facts: Demographic Snapshot (Part 1) 10140 NW Cornell Rd, Portland, OR 97229 0 - 1 mi Population 2027 Projection 13,950 2022 Estimate 13,112 2010 Census 10,559 2000 Census 7,424 Growth 2022-2027 6.39% Growth 2010-2022 24.17% Growth 2000-2010 42.23% 2022 Est. Population by Single-Classification Race 13,112 White Alone 9,872 75.29% Black or African American Alone 238 1.81% American Indian and Alaska Native Alone 24 0.19% Asian Alone 2,046 15.60% Native Hawaiian and Other Pacific Islander Alone 26 0.20% Some Other Race Alone 212 1.62% Two or More Races 693 5.29% 2022 Est. Population Hispanic or Latino by Origin 13,112 Not Hispanic or Latino 12,470 95.10% Hispanic or Latino 642 4.90% Hispanic or Latino by Origin 642 Mexican 356 55.44% Puerto Rican 33 5.14% Cuban 30 4.69% All Other Hispanic or Latino 223 34.74% 2022 Est. Hisp. or Latino Pop by Single-Classification Race 642 White Alone 407 63.42% Black or African American Alone 6 0.93% American Indian and Alaska Native Alone 10 1.48% Asian Alone 3 0.43% Native Hawaiian and Other Pacific Islander Alone 0 0.07% Some Other Race Alone 179 27.85% Two or More Races 37 5.81%
2022 Est. Pop by Race, Asian Alone, by Category 2,046 Chinese, except Taiwanese 475 23.24% Filipino 100 4.91% Japanese 134 6.53% Asian Indian 574 28.04% Korean 274 13.40% Vietnamese 173 8.45% Cambodian 13 0.65% Hmong 4 0.17% Laotian 42 2.05% Thai 95 4.66% All other Asian Races, including 2 or more 162 7.90% 2022 Est. Population by Ancestry 13,112 Arab 5 0.04% Czech 29 0.22% Danish 115 0.88% Dutch 161 1.23% English 1,024 7.81% French (except Basque) 259 1.98% French Canadian 37 0.28% German 1,651 12.59% Greek 46 0.35% Hungarian 87 0.66% Irish 1,021 7.79% Italian 431 3.29% Lithuanian 28 0.21% Norwegian 449 3.42% Polish 230 1.76% Portuguese 27 0.21% Russian 66 0.50% Scottish 187 1.43% Scotch-Irish 134 1.03% Slovak 11 0.08% Subsaharan African 62 0.47% Swedish 306 2.33% Swiss 75 0.57% Ukrainian 8 0.06% United States or American 447 3.41% Welsh 60 0.46% West Indian (except Hisp. groups) 38 0.29% Other Ancestries 5,006 38.18% Ancestry Unclassified 1,111 8.48% 2022 Est. Pop Age 5+ by Language Spoken At Home 12,457 10140 NW Cornell Rd, Portland, OR 97229 Sitewise Online Pop-Facts: Demographic Snapshot (Part 1) Pop-Facts: Demographic Snapshot (Part 1) 10140 NW Cornell Rd, Portland, OR 97229 0 - 1 mi
Speak only English 10,282 82.54% Speak Asian or Pacific Island Language 942 7.56% Speak IndoEuropean Language 738 5.93% Speak Spanish 433 3.48% Speak Other Language 61 0.49% 10140 NW Cornell Rd, Portland, OR 97229 Sitewise Online Pop-Facts: Demographic Snapshot (Part 1) Pop-Facts: Demographic Snapshot (Part 1) 10140 NW Cornell Rd, Portland, OR 97229 0 - 1 mi
2022 Est. Population by Sex 13,112 Male 6,493 49.52% Female 6,619 50.48% 2022 Est. Population by Age 13,112 Age 0 to 4 655 4.99% Age 5 to 9 678 5.17% Age 10 to 14 738 5.63% Age 15 to 17 509 3.88% Age 18 to 20 469 3.58% Age 21 to 24 645 4.92% Age 25 to 34 1,903 14.51% Age 35 to 44 1,510 11.52% Age 45 to 54 1,860 14.19% Age 55 to 64 1,782 13.59% Age 65 to 74 1,497 11.42% Age 75 to 84 659 5.02% Age 85 and over 206 1.57% Age 16 and over 10,874 82.93% Age 18 and over 10,532 80.32% Age 21 and over 10,062 76.74% Age 65 and over 2,363 18.02% 2022 Est. Median Age 41.35 2022 Est. Average Age 41.24 10140 NW Cornell Rd, Portland, OR 97229 Sitewise Online Pop-Facts: Demographic Snapshot (Part 1) Pop-Facts: Demographic Snapshot (Part 1) 10140 NW Cornell Rd, Portland, OR 97229 0 - 1 mi
2022 Est. Male Population by Age 6,493 Age 0 to 4 358 5.52% Age 5 to 9 347 5.34% Age 10 to 14 386 5.95% Age 15 to 17 265 4.08% Age 18 to 20 243 3.74% Age 21 to 24 324 4.99% Age 25 to 34 972 14.97% Age 35 to 44 739 11.38% Age 45 to 54 896 13.80% Age 55 to 64 895 13.78% Age 65 to 74 686 10.56% Age 75 to 84 302 4.65% Age 85 and over 81 1.24% 2022 Est. Median Age, Male 39.75 2022 Est. Average Age, Male 40.17 2022 Est. Female Population by Age 6,619 Age 0 to 4 297 4.48% Age 5 to 9 332 5.01% Age 10 to 14 351 5.31% Age 15 to 17 244 3.69% Age 18 to 20 226 3.42% Age 21 to 24 321 4.85% Age 25 to 34 931 14.06% Age 35 to 44 772 11.66% Age 45 to 54 964 14.57% Age 55 to 64 887 13.40% Age 65 to 74 812 12.27% Age 75 to 84 357 5.39% Age 85 and over 126 1.90% 2022 Est. Median Age, Female 42.87 2022 Est. Average Age, Female 42.26 10140 NW Cornell Rd, Portland, OR 97229 Sitewise Online Pop-Facts: Demographic Snapshot (Part 1) Pop-Facts: Demographic Snapshot (Part 1) 10140 NW Cornell Rd, Portland, OR 97229 0 - 1 mi
2022 Est. Pop Age 15+ by Marital Status 11,041 Total, Never Married 2,812 25.46% Males, Never Married 1,387 12.56% Females, Never Married 1,425 12.90% Married, Spouse present 6,490 58.78% Married, Spouse absent 231 2.09% Widowed 369 3.34% Males, Widowed 108 0.98% Females, Widowed 261 2.37% Divorced 1,139 10.32% Males, Divorced 405 3.66% Females, Divorced 734 6.65% 2022 Est. Pop Age 25+ by Edu. Attainment 9,417 Less than 9th grade 81 0.86% Some High School, no diploma 56 0.59% High School Graduate (or GED) 625 6.64% Some College, no degree 1,186 12.60% Associate Degree 541 5.74% Bachelor's Degree 3,672 38.99% Master's Degree 1,974 20.96% Professional School Degree 549 5.83% Doctorate Degree 734 7.79% 2022 Est. Pop. Age 25+ by Edu. Attain., Hisp./Lat. 397 No High School Diploma 38 9.58% High School Graduate 62 15.64% Some College or Associate's Degree 151 38.07% Bachelor's Degree or Higher 146 36.71% Copyright © Claritas, LLC 2022. All rights reserved. 10140 NW Cornell Rd, Portland, OR 97229 Sitewise Online Pop-Facts: Demographic Snapshot (Part 1) Pop-Facts: Demographic Snapshot (Part 1) 10140 NW Cornell Rd, Portland, OR 97229 0 - 1 mi
10140 NW Cornell Rd, Portland, OR 97229 Sitewise Online Pop-Facts: Demographic Snapshot (Part 2) Pop-Facts: Demographic Snapshot (Part 2) 10140 NW Cornell Rd, Portland, OR 97229 0 - 1 mi Households 2027 Projection 5,610 2022 Estimate 5,271 2010 Census 4,226 2000 Census 3,040 Growth 2022-2027 6.43% Growth 2010-2022 24.73% Growth 2000-2010 39.01% 2022 Est. Households by Household Type 5,271 Family Households 3,556 67.46% Nonfamily Households 1,715 32.54% 2022 Est. Group Quarters Population 100 2022 HHs by Ethnicity: Hispanic/Latino 214 4.06% 2022 Est. Households by HH Income 5,271 Income < $15,000 136 2.58% Income $15,000 to $24,999 92 1.75% Income $25,000 to $34,999 139 2.65% Income $35,000 to $49,999 290 5.50% Income $50,000 to $74,999 499 9.46% Income $75,000 to $99,999 547 10.39% Income $100,000 to $124,999 511 9.69% Income $125,000 to $149,999 436 8.27% Income $150,000 to $199,999 768 14.58% Income $200,000 to $249,999 500 9.49% Income $250,000 to $499,999 700 13.27% Income $500,000+ 652 12.37% 2022 Est. Average Household Income $ 203,089 2022 Est. Median Household Income $ 149,128 2022 Median HH Income by Single-Class. Race or Ethn. White Alone $ 145,707 Black or African American Alone $ 117,863 American Indian and Alaska Native Alone $ 76,088 Asian Alone $ 181,438 Native Hawaiian and Other Pacific Islander Alone $ 70,118 Some Other Race Alone $ 164,810 Two or More Races $ 67,065 Hispanic or Latino $ 118,362
Not Hispanic or Latino $ 151,230 10140 NW Cornell Rd, Portland, OR 97229 Sitewise Online Pop-Facts: Demographic Snapshot (Part 2) Pop-Facts: Demographic Snapshot (Part 2) 10140 NW Cornell Rd, Portland, OR 97229 0 - 1 mi
2022 Est. Family HH Type by Presence of Own Children 3,556 Married-Couple Family, own children 1,416 39.81% Married-Couple Family, no own children 1,662 46.73% Male Householder, own children 83 2.35% Male Householder, no own children 69 1.94% Female Householder, own children 195 5.48% Female Householder, no own children 131 3.69% 2022 Est. Households by Household Size 5,271 1-person 1,260 23.90% 2-person 1,953 37.06% 3-person 903 17.13% 4-person 774 14.69% 5-person 292 5.53% 6-person 64 1.21% 7-or-more-person 26 0.49% 2022 Est. Average Household Size 2.47 2022 Est. Households by Presence of People Under 18 5,271 Households with 1 or more People under Age 18 1,755 33.30% Households with No People under Age 18 3,516 66.70% Households with 1 or more People under Age 18 1,755 Married-Couple Family 1,443 82.20% Other Family, Male Householder 88 5.00% Other Family, Female Householder 213 12.15% Nonfamily, Male Householder 9 0.51% Nonfamily, Female Householder 3 0.15% Households with No People under Age 18 3,516 Married-Couple Family 1,635 46.50% Other Family, Male Householder 62 1.78% Other Family, Female Householder 115 3.27% Nonfamily, Male Householder 764 21.73% Nonfamily, Female Householder 940 26.72% 10140 NW Cornell Rd, Portland, OR 97229 Sitewise Online Pop-Facts: Demographic Snapshot (Part 2) Pop-Facts: Demographic Snapshot (Part 2) 10140 NW Cornell Rd, Portland, OR 97229 0 - 1 mi
2022 Est. Households by Number of Vehicles 5,271 No Vehicles 150 2.84% 1 Vehicle 1,583 30.04% 2 Vehicles 2,430 46.11% 3 Vehicles 861 16.33% 4 Vehicles 163 3.10% 5 or more Vehicles 84 1.59% 2022 Est. Average Number of Vehicles 1.93 Family Households 2027 Projection 3,783 2022 Estimate 3,556 2010 Census 2,882 2000 Census 2,017 Growth 2022-2027 6.39% Growth 2010-2022 23.36% Growth 2000-2010 42.90% 2022 Est. Families by Poverty Status 3,556 2022 Families at or Above Poverty 3,469 97.57% 2022 Families at or Above Poverty with Children 1,566 44.05% 2022 Families Below Poverty 86 2.43% 2022 Families Below Poverty with Children 62 1.75% 2022 Est. Pop Age 16+ by Employment Status 10,874 In Armed Forces 0 0.00% Civilian Employed 7,444 68.45% Civilian Unemployed 219 2.02% Not in Labor Force 3,211 29.53% 2022 Est. Civ. Employed Pop 16+ by Class of Worker 7,397 For-Profit Private Workers 4,954 66.97% Non-Profit Private Workers 814 11.00% Local Government Workers 275 3.71% State Government Workers 95 1.28% Federal Government Workers 255 3.45% Self-Employed Workers 995 13.46% Unpaid Family Workers 9 0.13% 10140 NW Cornell Rd, Portland, OR 97229 Sitewise Online Pop-Facts: Demographic Snapshot (Part 2) Pop-Facts: Demographic Snapshot (Part 2) 10140 NW Cornell Rd, Portland, OR 97229 0 - 1 mi
2022 Est. Civ. Employed Pop 16+ by Occupation 7,397 Architect/Engineer 594 8.03% Arts/Entertainment/Sports 368 4.98% Building Grounds Maintenance 47 0.63% Business/Financial Operations 846 11.44% Community/Social Services 66 0.90% Computer/Mathematical 375 5.07% Construction/Extraction 125 1.70% Education/Training/Library 447 6.05% Farming/Fishing/Forestry 2 0.02% Food Prep/Serving 204 2.75% Healthcare Practitioner/Technician 730 9.87% Healthcare Support 112 1.51% Maintenance Repair 51 0.69% Legal 118 1.59% Life/Physical/Social Science 93 1.26% Management 1,582 21.39% Office/Admin. Support 492 6.66% Production 185 2.50% Protective Service 40 0.54% Sales/Related 641 8.67% Personal Care/Service 131 1.77% Transportation/Moving 147 1.99% 2022 Est. Pop 16+ by Occupation Classification 7,397 Blue Collar 509 6.88% White Collar 6,353 85.89% Service & Farm 535 7.23% 2022 Est. Workers Age 16+ by Transp. To Work 7,278 Drove Alone 5,404 74.25% Car Pooled 396 5.44% Public Transportation 417 5.73% Walked 40 0.55% Bicycle 70 0.96% Other Means 54 0.75% Worked at Home 897 12.33% 2022 Est. Workers Age 16+ by Travel Time to Work* Less than 15 minutes 793 15 to 29 Minutes 3,272 30 to 44 Minutes 1,721 45 to 59 Minutes 443 60 or more Minutes 226 10140 NW Cornell Rd, Portland, OR 97229 Sitewise Online Pop-Facts: Demographic Snapshot (Part 2) Pop-Facts: Demographic Snapshot (Part 2) 10140 NW Cornell Rd, Portland, OR 97229 0 - 1 mi
2022 Est. Avg. Travel Time to Work in Minutes* 27.69 2022 Est. Occupied Housing Units by Tenure 5,271 Owner-Occupied 3,858 73.19% Renter-Occupied 1,413 26.81% 2022 Occupied Housing Units: Avg. Length of Residence Owner-Occupied 10 Renter-Occupied 5 10140 NW Cornell Rd, Portland, OR 97229 Sitewise Online Pop-Facts: Demographic Snapshot (Part 2) Pop-Facts: Demographic Snapshot (Part 2) 10140 NW Cornell Rd, Portland, OR 97229 0 - 1 mi
2022 Est. Owner Occupied Housing Units by Value 3,858 Value Less than $20,000 4 0.11% Value $20,000 to $39,999 4 0.10% Value $40,000 to $59,999 0 0.00% Value $60,000 to $79,999 1 0.01% Value $80,000 to $99,999 0 0.01% Value $100,000 to $149,999 5 0.13% Value $150,000 to $199,999 2 0.05% Value $200,000 to $299,999 38 0.97% Value $300,000 to $399,999 218 5.65% Value $400,000 to $499,999 401 10.38% Value $500,000 to $749,999 1,429 37.05% Value $750,000 to $999,999 1,151 29.82% Value $1,000,000 to $1,499,999 483 12.52% Value $1,500,000 to $1,999,999 79 2.04% Value $2,000,000 or more 45 1.15% 2022 Est. Median All Owner-Occupied Housing Unit Value $ 719,874 2022 Est. Housing Units by Units in Structure 5,614 1 Unit Attached 643 11.45% 1 Unit Detached 3,556 63.35% 2 Units 31 0.55% 3 or 4 Units 196 3.50% 5 to 19 Units 719 12.81% 20 to 49 Units 183 3.27% 50 or More Units 278 4.96% Mobile Home or Trailer 7 0.12% Boat, RV, Van, etc. 0 0.00% Dominant structure type 1 Unit Detached 2022 Est. Housing Units by Year Structure Built 5,614 Housing Units Built 2014 or Later 832 14.81% Housing Units Built 2010 to 2013 335 5.96% Housing Units Built 2000 to 2009 1,726 30.74% Housing Units Built 1990 to 1999 1,140 20.32% Housing Units Built 1980 to 1989 369 6.57% Housing Units Built 1970 to 1979 650 11.57% Housing Units Built 1960 to 1969 281 5.01% Housing Units Built 1950 to 1959 184 3.28% Housing Units Built 1940 to 1949 63 1.12% Housing Units Built 1939 or Earlier 35 0.62% 2022 Est. Median Year Structure Built** 2000 Dominant Year Structure Built 2000 to 2009 10140 NW Cornell Rd, Portland, OR 97229 Sitewise Online Pop-Facts: Demographic Snapshot (Part 2) Pop-Facts: Demographic Snapshot (Part 2) 10140 NW Cornell Rd, Portland, OR 97229 0 - 1 mi
Copyright © Claritas, LLC 2022. All rights reserved. * This row intentionally left blank. No Total Category. **1939 will appear when at least half of the Housing Units in this reports area were built in 1939 or earlier. 10140 NW Cornell Rd, Portland, OR 97229 Sitewise Online Pop-Facts: Demographic Snapshot (Part 2) Pop-Facts: Demographic Snapshot (Part 2) 10140 NW Cornell Rd, Portland, OR 97229 0 - 1 mi
10140 NW Cornell Rd, Portland, OR 97229 Sitewise Online Pop-Facts: Census Demographic Overview (Part 1) Pop-Facts: Census Demographic Overview (Part 1) 10140 NW Cornell Rd, Portland, OR 97229 0 1 mi Population 2027 Projection 13,950 2022 Estimate 13,112 2010 Census 10,559 2000 Census 7,424 Growth 2022-2027 6.39% Growth 2010-2022 24.17% Growth 2000-2010 42.23% 2010 Population by Single-Classification Race 10,559 White Alone 8,771 83.07% Black or African American Alone 141 1.34% American Indian and Alaska Native Alone 27 0.26% Asian Alone 1,035 9.81% Native Hawaiian and Other Pacific Islander Alone 19 0.18% Some Other Race Alone 161 1.52% Two or More Races 404 3.83% 2010 Population By Ethnicity 10,559 Not Hispanic or Latino 10,090 95.56% Hispanic or Latino 469 4.44% 2010 Hispanic or Latino by Single-Classification Race 469 White Alone 295 62.85% Black or African American Alone 4 0.95% American Indian and Alaska Native Alone 7 1.54% Asian Alone 3 0.57% Native Hawaiian and Other Pacific Islander Alone 0 0.10% Some Other Race Alone 128 27.21% Two or More Races 32 6.77% 2010 Population by Sex 10,559 Male 5,208 49.32% Female 5,351 50.68% Male/Female Ratio 0.97
2010 Population by Age 10,559 Age 0 to 4 661 6.26% Age 5 to 9 759 7.18% Age 10 to 14 698 6.61% Age 15 to 17 389 3.68% Age 18 to 20 234 2.21% Age 21 to 24 435 4.12% Age 25 to 34 1,365 12.92% Age 35 to 44 1,696 16.06% Age 45 to 54 1,685 15.96% Age 55 to 64 1,475 13.96% Age 65 to 74 664 6.29% Age 75 to 84 336 3.18% Age 85 and over 164 1.55% Age 16 and over 8,305 78.65% Age 18 and over 8,053 76.26% Age 21 and over 7,820 74.05% Age 65 and over 1,164 11.02% 2010 Median Age 39.37 10140 NW Cornell Rd, Portland, OR 97229 Sitewise Online Pop-Facts: Census Demographic Overview (Part 1) Pop-Facts: Census Demographic Overview (Part 1) 10140 NW Cornell Rd, Portland, OR 97229 0 1 mi
2010 Male Population by Age 5,208 Age 0 to 4 354 6.80% Age 5 to 9 401 7.69% Age 10 to 14 365 7.01% Age 15 to 17 192 3.68% Age 18 to 20 125 2.40% Age 21 to 24 211 4.06% Age 25 to 34 645 12.39% Age 35 to 44 835 16.04% Age 45 to 54 844 16.20% Age 55 to 64 705 13.54% Age 65 to 74 325 6.23% Age 75 to 84 149 2.86% Age 85 and over 57 1.09% 2010 Median Age, Male 38.72 2010 Female Population by Age 5,351 Age 0 to 4 307 5.73% Age 5 to 9 358 6.69% Age 10 to 14 333 6.22% Age 15 to 17 197 3.68% Age 18 to 20 109 2.03% Age 21 to 24 223 4.17% Age 25 to 34 719 13.44% Age 35 to 44 861 16.08% Age 45 to 54 842 15.73% Age 55 to 64 769 14.38% Age 65 to 74 340 6.35% Age 75 to 84 187 3.49% Age 85 and over 107 2.00% 2010 Median Age, Female 39.99 Copyright © Claritas, LLC 2022. All rights reserved. 10140 NW Cornell Rd, Portland, OR 97229 Sitewise Online Pop-Facts: Census Demographic Overview (Part 1) Pop-Facts: Census Demographic Overview (Part 1) 10140 NW Cornell Rd, Portland, OR 97229 0 1 mi
10140 NW Cornell Rd, Portland, OR 97229 Sitewise Online Pop-Facts: Census Demographic Overview (Part 2) Pop-Facts: Census Demographic Overview (Part 2) 10140 NW Cornell Rd, Portland, OR 97229 0 1 mi Households 2027 Projection 5,610 2022 Estimate 5,271 2010 Census 4,226 2000 Census 3,040 Growth 2022-2027 6.43% Growth 2010-2022 24.73% Growth 2000-2010 39.01% 2010 Households by Household Type 4,226 Family Households 2,882 68.21% Non-family Households 1,344 31.79% 2010 Group Quarters Population 88 2010 Hispanic or Latino Households 147 3.47% 2010 Households by Household Size 4,226 1-person 959 22.70% 2-person 1,610 38.10% 3-person 709 16.77% 4-person 664 15.71% 5-person 224 5.30% 6-person 40 0.94% 7-or-more-person 20 0.48%
2010 Households by Type and Presence of Children 4,226 Married-Couple Family, own children 1,158 27.40% Male Householder, own children 66 1.57% Female Householder, own children 155 3.66% Married-Couple Family, no own children 1,348 31.89% Male Householder, no own children 52 1.24% Female Householder, no own children 103 2.44% Non-family Households 1,344 31.79% 2010 Households by Presence of People Under Age 18 4,226 HH with 1 or More People Under Age 18: 1,430 33.83% Households with No People Under Age 18: 2,796 66.17% HH with 1 or More People Under Age 18: 1,430 Married-Couple Family 1,180 82.55% Other Family, Male Householder 70 4.92% Other Family, Female Householder 169 11.83% Nonfamily, Male Householder 8 0.55% Nonfamily, Female Householder 2 0.14% Households with No People Under Age 18: 2,796 Married-Couple Family 1,325 47.40% Other Family, Male Householder 48 1.73% Other Family, Female Householder 89 3.17% Nonfamily, Male Householder 597 21.34% Nonfamily, Female Householder 737 26.36% 2010 Occupied Housing Units by Tenure 4,226 Owner-Occupied 3,123 73.89% Renter-Occupied 1,103 26.11% Copyright © Claritas, LLC 2022. All rights reserved. 10140 NW Cornell Rd, Portland, OR 97229 Sitewise Online Pop-Facts: Census Demographic Overview (Part 2) Pop-Facts: Census Demographic Overview (Part 2) 10140 NW Cornell Rd, Portland, OR 97229 0 1 mi
10140 NW Cornell Rd, Portland, OR 97229 Sitewise Online Retail Market Power Opportunity Gap Report By Retail Store Types Retail Market Power Opportunity Gap Report By Retail Store Types 10140 NW Cornell Rd, Portland, OR 97229 0 - 1 mi 2022 Demand 2022 Supply Opportunity Gap/Surplus Total retail trade including food and drink (NAICS 44, 45 and 722) $ 415,847,460 $ 72,223,391 $ 343,624,070 Total retail trade (NAICS 44 and 45) $ 368,957,096 $ 65,759,293 $ 303,197,802 Motor vehicle and parts dealers (NAICS 441) $ 82,843,235 $ 13,684,606 $ 69,158,630 Automobile dealers (NAICS 4411) $ 69,102,111 $ 13,684,606 $ 55,417,506 New car dealers (NAICS 44111) $ 61,401,916 $ 10,504,386 $ 50,897,530 Used car dealers (NAICS 44112) $ 7,700,195 $ 3,180,220 $ 4,519,976 Other motor vehicle dealers (NAICS 4412) $ 8,180,409 $ 0 $ 8,180,409 Recreational vehicle dealers (NAICS 44121) $ 3,304,757 $ 0 $ 3,304,757 Motorcycle, boat, and other motor vehicle dealers (NAICS 44122) $ 4,875,652 $ 0 $ 4,875,652 Boat dealers (NAICS 441222) $ 1,965,858 $ 0 $ 1,965,858 Motorcycle, ATV, and all other motor vehicle dealers (NAICS 441228) $ 2,909,794 $ 0 $ 2,909,794 Automotive parts, accessories, and tire stores (NAICS 4413) $ 5,560,715 $ 0 $ 5,560,715 Automotive parts and accessories stores (NAICS 44131) $ 3,517,877 $ 0 $ 3,517,877 Tire dealers (NAICS 44132) $ 2,042,838 $ 0 $ 2,042,838 Furniture and home furnishings stores (NAICS 442) $ 8,850,068 $ 862,867 $ 7,987,200 Furniture stores (NAICS 4421) $ 4,863,813 $ 0 $ 4,863,813 Home furnishings stores (NAICS 4422) $ 3,986,255 $ 862,867 $ 3,123,387 Floor covering stores (NAICS 44221) $ 1,976,106 $ 0 $ 1,976,106 Other home furnishings stores (NAICS 44229) $ 2,010,149 $ 862,867 $ 1,147,282 Window treatment stores (NAICS 442291) $ 93,378 $ 0 $ 93,378 All other home furnishings stores (NAICS 442299) $ 1,916,771 $ 862,867 $ 1,053,903 Electronics and appliance stores (NAICS 443) $ 4,961,148 $ 2,608,351 $ 2,352,796 Household appliance stores (NAICS 443141) $ 1,182,379 $ 0 $ 1,182,379 Electronics stores (NAICS 443142) $ 3,778,769 $ 2,608,351 $ 1,170,417 Building material and garden equipment and supplies dealers (NAICS 444) $ 30,019,667 $ 1,415,708 $ 28,603,959 Building material and supplies dealers (NAICS 4441) $ 25,931,807 $ 1,415,708 $ 24,516,099 Home centers (NAICS 44411) $ 14,382,240 $ 262,219 $ 14,120,021 Paint and wallpaper stores (NAICS 44412) $ 883,402 $ 11,848 $ 871,554 Hardware stores (NAICS 44413) $ 2,257,075 $ 126,973 $ 2,130,103 Other building material dealers (NAICS 44419) $ 8,409,090 $ 1,014,669 $ 7,394,420 Lawn and garden equipment and supplies stores (NAICS 4442) $ 4,087,860 $ 0 $ 4,087,860 Outdoor power equipment stores (NAICS 44421) $ 845,624 $ 0 $ 845,624 Nursery, garden center, and farm supply stores (NAICS 44422) $ 3,242,237 $ 0 $ 3,242,237 Food and beverage stores (NAICS 445) $ 53,003,576 $ 10,353,512 $ 42,650,065 Grocery stores (NAICS 4451) $ 46,802,911 $ 10,353,512 $ 36,449,399 Supermarkets and other grocery (except convenience) stores (NAICS 44511) $ 44,969,589 $ 10,251,848 $ 34,717,741 Convenience stores (NAICS 44512) $ 1,833,321 $ 101,663 $ 1,731,658 Specialty food stores (NAICS 4452) $ 1,357,676 $ 0 $ 1,357,676
Meat markets (NAICS 44521) $ 409,710 $ 0 $ 409,710 Fish and seafood markets (NAICS 44522) $ 161,371 $ 0 $ 161,371 Fruit and vegetable markets (NAICS 44523) $ 282,310 $ 0 $ 282,310 Other specialty food stores (NAICS 44529) $ 504,285 $ 0 $ 504,285 Baked goods and confectionery and nut stores (NAICS 445291 + 445292) $ 267,410 $ 0 $ 267,410 All other specialty food stores (NAICS 445299) $ 236,874 $ 0 $ 236,874 Beer, wine, and liquor stores (NAICS 4453) $ 4,842,990 $ 0 $ 4,842,990 Health and personal care stores (NAICS 446) $ 20,906,978 $ 377,235 $ 20,529,742 Pharmacies and drug stores (NAICS 44611) $ 18,100,742 $ 377,235 $ 17,723,507 Cosmetics, beauty supplies, and perfume stores (NAICS 44612) $ 1,220,227 $ 0 $ 1,220,227 Optical goods stores (NAICS 44613) $ 615,615 $ 0 $ 615,615 Other health and personal care stores (NAICS 44619) $ 970,393 $ 0 $ 970,393 Food (health) supplement stores (NAICS 446191) $ 344,664 $ 0 $ 344,664 All other health and personal care stores (NAICS 446199) $ 625,729 $ 0 $ 625,729 Gasoline stations (NAICS 447) $ 25,691,076 $ 39,106 $ 25,651,969 Clothing and clothing accessories stores (NAICS 448) $ 15,637,505 $ 2,332,869 $ 13,304,636 Clothing stores (NAICS 4481) $ 10,256,321 $ 2,332,725 $ 7,923,595 Men's clothing stores (NAICS 44811) $ 474,170 $ 63,214 $ 410,956 Women's clothing stores (NAICS 44812) $ 1,827,541 $ 1,161,645 $ 665,896 Children's and infants' clothing stores (NAICS 44813) $ 333,345 $ 120,262 $ 213,082 Family clothing stores (NAICS 44814) $ 6,150,157 $ 589,433 $ 5,560,724 Clothing accessories stores (NAICS 44815) $ 521,197 $ 146,418 $ 374,779 Other clothing stores (NAICS 44819) $ 949,911 $ 251,753 $ 698,158 Shoe stores (NAICS 4482) $ 2,050,711 $ 0 $ 2,050,711 Jewelry, luggage, and leather goods stores (NAICS 4483) $ 3,330,474 $ 143 $ 3,330,330 Jewelry stores (NAICS 44831) $ 2,236,167 $ 0 $ 2,236,167 Luggage and leather goods stores (NAICS 44832) $ 1,094,307 $ 143 $ 1,094,163 Sporting goods, hobby, musical instrument, and book stores (NAICS 451) $ 6,092,288 $ 4,473 $ 6,087,815 Sporting goods, hobby, and musical instrument stores (NAICS 4511) $ 5,488,950 $ 4,473 $ 5,484,477 Sporting goods stores (NAICS 45111) $ 4,095,155 $ 1,957 $ 4,093,198 Hobby, toy, and game stores (NAICS 45112) $ 1,038,173 $ 17 $ 1,038,157 Sewing, needlework, and piece goods stores (NAICS 45113) $ 175,507 $ 0 $ 175,507 Musical instrument and supplies stores (NAICS 45114) $ 180,115 $ 2,500 $ 177,616 Book stores and news dealers (NAICS 4512) $ 603,338 $ 0 $ 603,338 Book stores (NAICS 451211) $ 564,254 $ 0 $ 564,254 News dealers and newsstands (NAICS 451212) $ 39,085 $ 0 $ 39,085 General merchandise stores (NAICS 452) $ 46,435,147 $ 2,835 $ 46,432,312 Department stores (NAICS 4522) $ 6,087,406 $ 0 $ 6,087,406 Other general merchandise stores (NAICS 4523) $ 40,347,742 $ 2,835 $ 40,344,907 Warehouse clubs and supercenters (NAICS 452311) $ 36,336,056 $ 2,835 $ 36,333,220 All other general merchandise stores (NAICS 452319) $ 4,011,686 $ 0 $ 4,011,686 10140 NW Cornell Rd, Portland, OR 97229 Sitewise Online Retail Market Power Opportunity Gap Report By Retail Store Types Retail Market Power Opportunity Gap Report By Retail Store Types 10140 NW Cornell Rd, Portland, OR 97229 0 - 1 mi 2022 Demand 2022 Supply Opportunity Gap/Surplus
Miscellaneous store retailers (NAICS 453) $ 8,366,033 $ 526,104 $ 7,839,929 Florists (NAICS 4531) $ 418,347 $ 0 $ 418,347 Office supplies, stationery, and gift stores (NAICS 4532) $ 1,915,855 $ 21,567 $ 1,894,288 Office supplies and stationery stores (NAICS 45321) $ 829,913 $ 0 $ 829,913 Gift, novelty, and souvenir stores (NAICS 45322) $ 1,085,942 $ 21,567 $ 1,064,375 Used merchandise stores (NAICS 4533) $ 1,253,482 $ 31,883 $ 1,221,598 Other miscellaneous store retailers (NAICS 4539) $ 4,778,349 $ 472,653 $ 4,305,696 Pet and pet supplies stores (NAICS 45391) $ 1,320,054 $ 276,537 $ 1,043,516 Art dealers (NAICS 45392) $ 888,264 $ 1,322 $ 886,943 Manufactured (mobile) home dealers (NAICS 45393) $ 560,216 $ 1,235 $ 558,982 All other miscellaneous store retailers (NAICS 45399) $ 2,009,815 $ 193,560 $ 1,816,255 Tobacco stores (NAICS 453991) $ 371,198 $ 27,583 $ 343,615 All other miscellaneous store retailers (except tobacco stores) (NAICS 453998) $ 1,638,616 $ 165,977 $ 1,472,639 Non-store retailers (NAICS 454) $ 66,150,375 $ 33,551,627 $ 32,598,749 Electronic shopping and mail-order houses (NAICS 4541) $ 62,818,388 $ 33,551,627 $ 29,266,762 Vending machine operators (NAICS 4542) $ 438,860 $ 0 $ 438,860 Direct selling establishments (NAICS 4543) $ 2,893,127 $ 0 $ 2,893,127 Fuel dealers (NAICS 45431) $ 1,359,996 $ 0 $ 1,359,996 Other direct selling establishments (NAICS 45439) $ 1,533,132 $ 0 $ 1,533,132 Food services and drinking places (NAICS 722) $ 46,890,364 $ 6,464,097 $ 40,426,266 Special food services (NAICS 7223) $ 3,732,311 $ 215,358 $ 3,516,953 Food service contractors (NAICS 72231) $ 2,956,733 $ 190,989 $ 2,765,744 Caterers (NAICS 72232) $ 706,848 $ 19,565 $ 687,283 Mobile food services (NAICS 72233) $ 68,730 $ 4,803 $ 63,927 Drinking places (alcoholic beverages) (NAICS 7224) $ 1,646,338 $ 8,046 $ 1,638,292 Restaurants and other eating places (NAICS 7225) $ 41,511,715 $ 6,240,693 $ 35,271,022 Full-service restaurants (NAICS 722511) $ 20,981,618 $ 1,815,341 $ 19,166,277 Limited-service restaurants (NAICS 722513) $ 17,426,454 $ 3,986,232 $ 13,440,222 Cafeterias, grill buffets, and buffets (NAICS 722514) $ 444,287 $ 10,267 $ 434,020 Snack and nonalcoholic beverage bars (NAICS 722515) $ 2,659,356 $ 428,854 $ 2,230,502 GAFO* $ 81,978,072 $ 5,811,417 $ 76,166,655 General Merchandise Stores-452 $ 46,435,147 $ 2,835 $ 46,432,312 Clothing & Clothing Accessories Stores-448 $ 15,637,505 $ 2,332,869 $ 13,304,636 Furniture & Home Furnishings Stores-442 $ 8,850,068 $ 862,867 $ 7,987,200 Electronics & Appliance Stores-443 $ 4,961,148 $ 2,608,351 $ 2,352,796 Sporting Goods, Hobby, Book, Music Stores-451 $ 6,092,288 $ 4,473 $ 6,087,815 Office Supplies, Stationery, Gift Stores-4532 $ 1,915,855 $ 21,567 $ 1,894,288 * GAFO (General merchandise, Apparel, Furniture and Other) represents sales at stores that sell merchandise normally sold in department stores. This category is not included in Total Retail Sales Including Eating and Drinking Places. 10140 NW Cornell Rd, Portland, OR 97229 Sitewise Online Retail Market Power Opportunity Gap Report By Retail Store Types Retail Market Power Opportunity Gap Report By Retail Store Types 10140 NW Cornell Rd, Portland, OR 97229 0 - 1 mi 2022 Demand 2022 Supply Opportunity Gap/Surplus
Retail Market Power data is derived from two major sources of information. The demand data is derived from the Consumer Expenditure Survey (CE Survey or CEX), which is fielded by the U.S. Bureau of Labor Statistics (BLS). The supply data is derived from the Census of Retail Trade (CRT), which is made available by the U.S. Census. Additional data sources are incorporated to create both supply and demand estimates. The difference between demand and supply represents the opportunity gap or surplus available for each merchandise line in the specified reporting geography. When this difference is positive (demand is greater than the supply), there is an opportunity gap for that merchandise line; when the difference is negative (supply is greater than demand), there is a surplus. Copyright © 2022 Environics Analytics. All rights reserved. 10140 NW Cornell Rd, Portland, OR 97229 Sitewise Online Retail Market Power Opportunity Gap Report By Retail Store Types Retail Market Power Opportunity Gap Report By Retail Store Types 10140 NW Cornell Rd, Portland, OR 97229 0 - 1 mi 2022 Demand 2022 Supply Opportunity Gap/Surplus
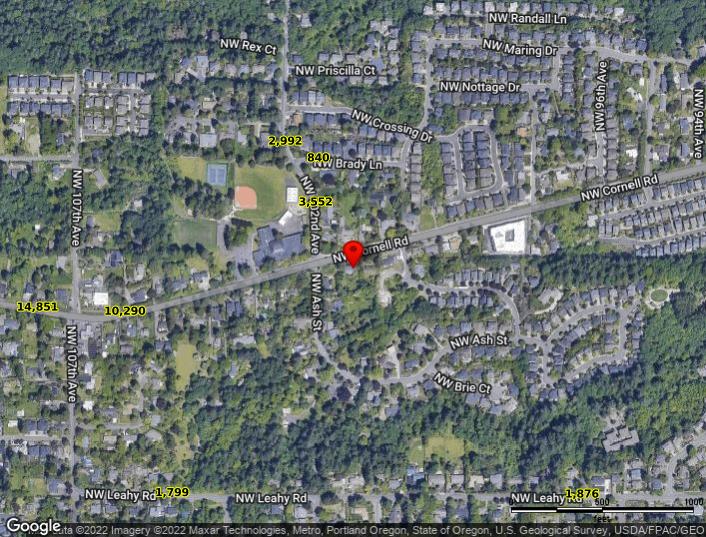
Powered by Sitewise Data Source: Kalibrate TrafficMetrix Traffic Listing 10140 NW Cornell Rd, Portland, OR 97229 July 20, 2022 Map # Street Cross Street Dir. Volume Type/Year Dist. (mi) 1. NW 102nd Ave NW Brady Ln NW 3,552 Current Year 0.1 2. NW Brady Ln NW 102nd Ave W 840 Current Year 0.1 3. NW 102nd Ave NW Brady Ln SE 2,992 Current Year 0.2 4. NW Cornell Rd NW Douglas Pl E 10,290 Published (2001) 0.2 5. NW Leahy Road NW 107th Ave W 1,799 Current Year 0.3 6. NW Cornell Rd NW 107th Ave E 14,851 Current Year 0.3 7. Northwest Leahy Road NW 97th Ave W 1,876 Current Year 0.3 8. NW Cornell Road NW 110th Ave W 13,593 Current Year 0.4 9. NW Cornell Rd NW 110th Ave W 12,572 Current Year 0.4 10. NW Cornell Rd NW 93rd Ave E 9,991 Current Year 0.4 11. NW Cornell Road NW 93rd Ave W 8,109 Current Year 0.5 12. NW Lost Park Dr NW Jolie Pl W 428 Current Year 0.5 13. SW 113th Avenue NW Reeves St N 6,229 Current Year 0.6 14. NW 107th Ave NW Lee St N 1,381 Current Year 0.6 15. NW Lost Park Dr NW 108th Ave W 699 Current Year 0.6 16. NW Morgan Ln NW Mill Pond Rd N 1,153 Published (2001) 0.6