ZONING
• Detailed Zoning Information
West Linn – R4.5 (Residential 4.5)


• Zoning Map
• Community Jurisdiction
The information contained is provided by WFG’s Customer Service Department to our customers, and while deemed reliable, is not guaranteed.
DETAILS
Sections:
14.010 PURPOSE
14.020 PROCEDURES AND APPROVAL PROCESS
14.030 PERMITTED USES
14.040 ACCESSORY USES
14.050 USES AND DEVELOPMENT PERMITTED UNDER PRESCRIBED CONDITIONS
14.060 CONDITIONAL USES
14.070 DIMENSIONAL REQUIREMENTS, USES PERMITTED OUTRIGHT AND USES PERMITTED UNDER PRESCRIBED CONDITIONS
14.080 DIMENSIONAL REQUIREMENTS, CONDITIONAL USES
14.090 OTHER APPLICABLE DEVELOPMENT STANDARDS
14.010 PURPOSE
The purpose of this zone is to provide for urban development at levels which relate to the site development limitations, proximity to commercial development and public facilities and public transportation, and to the surrounding development pattern. This zone is intended to carry out the intent of the Comprehensive Plan which is to provide for a choice in housing types, and is intended to implement the policies and locational criteria in the Comprehensive Plan for medium density residential housing.
14.020 PROCEDURES AND APPROVAL PROCESS
A. A use permitted outright, CDC 14.030, is a use which requires no approval under the provisions of this code. If a use is not listed as a use permitted outright, it may be held to be a similar unlisted use under the provisions of Chapter 80 CDC.
B. A use permitted under prescribed conditions, CDC 14.050, is a use for which approval will be granted provided all conditions are satis�ed, and:
14 RESIDENTIAL,
Chapter
R-4.5
1. The Planning Director shall make the decision in the manner provided by CDC 99.060(A)(2), Administrative Procedures, except that no notice shall be required; and
2. The decision may be appealed by the applicant to the Planning Commission as provided by CDC 99.240(A).
C. The approval of a conditional use (CDC 14.060) is discretionary with the Planning Commission. The approval process and criteria for approval are set forth in Chapter 60 CDC, Conditional Uses. If a use is not listed as a conditional use, it may be held to be a similar unlisted use under the provisions of Chapter 80 CDC.
D. The following code provisions may be applicable in certain situations:
1. Chapter 65 CDC, Non-conforming Uses Involving a Structure.
2. Chapter 66 CDC, Non-conforming Structures.
3. Chapter 67 CDC, Non-conforming Uses of Land.
4. Chapter 68 CDC, Non-conforming Lots, Lots of Record.
5. Chapter 75 CDC, Variance.
14.030 PERMITTED USES
The following are uses permitted outright in this zoning district:
1. Single-family attached or detached residential unit.
a. Duplex residential units.
b. Triplex residential units.
c. Quadplex residential units.
2. Cottage cluster.
3. Family day care.
4. Townhouse.
5. Community recreation.
6. Residential home.
7. Utilities, minor.
8. Manufactured housing.
9. Transportation facilities (Type I). (Ord. 1180, 1986; Ord. 1226, 1988; Ord. 1248, 1989; Ord. 1354, 1994; Ord. 1584, 2008; Ord. 1736 § 1 (Exh. A), 2022)
14.040 ACCESSORY USES
Accessory uses are allowed in this zone as provided by Chapter 34 CDC.
14.050 USES AND DEVELOPMENT PERMITTED UNDER PRESCRIBED CONDITIONS
The following uses are allowed in this zone under prescribed conditions.
1. Manufactured home park, subject to the provisions of Chapters 36 and 55 CDC.
2. Home occupations, subject to the provisions of Chapter 37 CDC.
3. Signs, subject to the provisions of Chapter 52 CDC.
4. Temporary uses, subject to the provisions of Chapter 35 CDC.
5. Water-dependent uses, subject to the provisions of Chapters 28 and 34 CDC.
6. Wireless communication facilities, subject to the provisions of Chapter 57 CDC. (Ord. 1226, 1988; Ord. 1408, 1998; Ord. 1565, 2008)
14.060 CONDITIONAL USES
The following are conditional uses which may be allowed in this zoning district subject to the provisions of Chapter 60 CDC, Conditional Uses.
1. Certi�ed child care center.
2. Cultural exhibits and library services.
3. Lodge, social, community center and civic assembly.
4. Medical and dental o�ces or clinic.
5. Nursing home.
6. Postal services.
7. Professional and administrative services.
8. Public safety facilities.
9. Public support facilities.
10. Recycle collection center.
11. Religious institution.
12. Schools.
13. Senior center.
14. Utilities, major.
15. Senior citizen/handicapped housing facilities with a maximum number of units 50 percent above the allowed density for the property; provided, that in addition to the provisions of Chapter 60 CDC, the following conditions shall apply:
a. Facilities intended for senior citizens shall be restricted to persons 60 years and older. In the case of couples, one member of the couple shall be 60 years or older.
b. Building height restrictions shall be the same as the subject zoning district.
c. Community space and related equipment shall be required to provide social and recreational opportunities for project occupants. Included may be such facilities as game rooms, meeting rooms, music or craft rooms. At least one community room within a project shall include a service area with a kitchen sink, counter top and storage cabinets, and shall have easy access to a storage area sized to store tables, chairs and janitorial supplies. All complexes shall have a minimum of 15 square feet of community space per occupant, based on one person per bedroom.
d. Congregate dining facilities providing regular daily meals for residents shall be provided.
e. A minimum of 10 square feet of general storage area other than regular kitchen, bedroom and linen storage shall be provided within each unit. Complexes which do not include laundry facilities in the units shall have adequate laundry facilities accessible to all tenants.
f. The maximum number of units allowed in a senior citizen or handicapped housing facility shall be as follows:
1) Medium high density district (R-2.1). The base density shall be 50 percent above the allowed density for the property.
2) Medium density district (R-4.5). The density shall be 50 percent above the allowed density for the property.
g. The design of the building(s) and the site and landscaping plans shall be subject to Design Review, Chapter 55 CDC. Special considerations for this use are the following:
1) Structures shall be compatible in style, color, materials, and scale with the general character of the neighborhood.
2) The building design and site layout shall de�ne recognizable semi-public, semiprivate and private spaces; ensure a sense of protection and community identity; and minimize barriers to handicapped or elderly persons.
3) A minimum of 25 percent of the property shall be in landscaping. The landscaping shall include areas for outdoor recreation, pedestrian access and amenities, and adequate visual and sound bu�ering of adjacent properties.
4) No more than 25 percent of the total number of units may be used for nursing care patients.
5) Minimum front, rear and side yard setbacks shall be the same as the underlying district unless the approval authority board �nds that a greater setback is indicated by uses and structures on surrounding properties or unique circumstances of the site.
16. Transportation facilities (Type II). See CDC 60.090 for additional approval criteria. (Ord. 1172, 1985; Ord. 1377, 1995; Ord. 1378, 1995; Ord. 1411, 1998; Ord. 1500, 2003; Ord. 1584, 2008; Ord. 1590 § 1, 2009; Ord. 1604 §§ 10, 11, 2011; Ord. 1675 § 16, 2018)
14.070 DIMENSIONAL REQUIREMENTS, USES PERMITTED OUTRIGHT AND USES PERMITTED UNDER PRESCRIBED CONDITIONS
Except as may be otherwise provided by the provisions of this code, the following are the requirements for uses within this zone:
lot size
STANDARD REQUIREMENT ADDITIONAL NOTES Minimum
STANDARD REQUIREMENT
For single-family detached units 4,500 sf
For single-family attached units
Average minimum lot or parcel size for a townhouse project
Minimum front lot line Minimum lot width at front lot line
4,000 sf
1,500 sf
ADDITIONAL NOTES
No yard shall be required between units.
35 ft
Does not apply to townhouses or cottage clusters
Average minimum lot width 35 ft Does not apply to townhouses or cottage clusters
Minimum yard dimensions or minimum building setbacks
Front, rear, and side yard setbacks for a cottage cluster project are 10 ft. There are no additional setbacks for individual structures on individual lots, but minimum distance between structures shall follow applicable building code requirements.
Front yard 20 ft
Interior side yard 5 ft
Street side yard 15 ft
Rear yard 20 ft
Maximum building height 35 ft
Except for steeply sloped lots where the provisions of CDC 41.010 shall apply
Townhouse common walls that are attached may have a 0-ft side setback.
Maximum lot coverage 40%
Except for steeply sloped lots in which case the provisions of Chapter 41 CDC shall apply.
Maximum lot coverage does not apply to duplexes, triplexes, quadplexes, townhouses or cottage clusters. However, the maximum building footprint for a cottage cluster is less than 900 sf per dwelling unit.
• This does not include detached garages, carports, or accessory structures.
• A developer may deduct up to 200 sf for an attached garage or carport.
ADDITIONAL NOTES
Minimum accessway width to a lot which does not abut a street or a �ag lot
15 ft
Maximum �oor area ratio 0.45
Maximum FAR does not apply to duplexes, triplexes, quadplexes, townhouses or cottage clusters. Type I and II lands shall not be counted toward lot area when determining allowable �oor area ratio, except that a minimum �oor area ratio of 0.30 shall be allowed regardless of the classi�cation of lands within the property. That 30 percent shall be based upon the entire property including Type I and II lands. Existing residences in excess of this standard may be replaced to their prior dimensions when damaged without the requirement that the homeowner obtain a non-conforming structures permit under Chapter 66 CDC.
A. The sidewall provisions of Chapter 43 CDC shall apply. (Ord. 1538, 2006; Ord. 1622 § 24, 2014; Ord. 1675 § 17, 2018; Ord. 1736 § 1 (Exh. A), 2022)
14.080 DIMENSIONAL REQUIREMENTS, CONDITIONAL USES
Except as may otherwise be established by this code, the appropriate lot or parcel size for a conditional use shall be determined by the approval authority at the time of consideration of the application based upon the criteria set forth in CDC 60.070(A) and (B). (Ord. 1636 § 12, 2014)
14.090 OTHER APPLICABLE DEVELOPMENT STANDARDS
A. The following standards apply to all development including permitted uses:
1. Chapter 34 CDC, Accessory Structures, Accessory Dwelling Units, and Accessory Uses.
2. Chapter 35 CDC, Temporary Structures and Uses.
3. Chapter 38 CDC, Additional Yard Area Required; Exceptions to Yard Requirements; Storage in Yards; Projections into Yards.
STANDARD REQUIREMENT
4. Chapter 41 CDC, Building Height, Structures on Steep Lots, Exceptions.
5. Chapter 42 CDC, Clear Vision Areas.
6. Chapter 44 CDC, Fences.
7. Chapter 46 CDC, O�-Street Parking, Loading and Reservoir Areas.
8. Chapter 48 CDC, Access, Egress and Circulation.
9. Chapter 52 CDC, Signs.
10. Chapter 54 CDC, Landscaping.
B. The provisions of Chapter 55 CDC, Design Review, apply to all uses except attached and/or detached single-family dwellings. (Ord. 1590 § 1, 2009; Ord. 1675 § 18, 2018; Ord. 1736 § 1 (Exh. A), 2022)
Zoning

GC R10 R2.1 R4.5 R4.5 R5 R5 F A I L I N G ST E L L I O T T S T H O L M E S S T TOMPKINS ST LEWISST HAMMERLE ST B A R L O W S T WEBBST WILLAMETTEDR LOWRYDR BUCK ST BROADWAYST BUCK ST DAVENPORT ST ATKINSON ST CASON ST BEAMST IHW T E TAIL DR FIRWOOD DR MOOREROBERT ST FIRWOODCT SUMMIT ST W O O D W I N D S C T CUSHMANDR C A U F I E L D S T SKYLINE DR SKYLINEDR BARCLAY ST BRIDGE VIEW DR IRVI NG S T SUMMIT PL A T K I N S O N S T CAUFIELD ST GEER ST RANDALL ST RANDALL ST TOMPKINSCT PERRINST TOMPKINS ST B ARCLAY ST SKYLINECIR BARCLAY ST RENAISS A N C E CT HEATERCT EVE R G R E E NDR WAKEROBIN CT EDGEW ATERCT CENTURY LN TMTHOOD ER FAWNCT PARKSIDE CT HUGHES DR WESTAST WILLAMETTE VIEW CT This map is a copy of public record and is provided solely for information purposes. WFG National Title assumes no liability for variations, if any, in dimensions, area or location of the premises or the location of improvements. Customer Service Department 12909 SW 68th Parkway, Suite 350 Portland, OR 97223 (503) 603-1700 cs@wfgnationaltitle.com 0190380 95 Feet
Subject Property Tax Lots Multi Family Mixed Use Residential Single Family ²
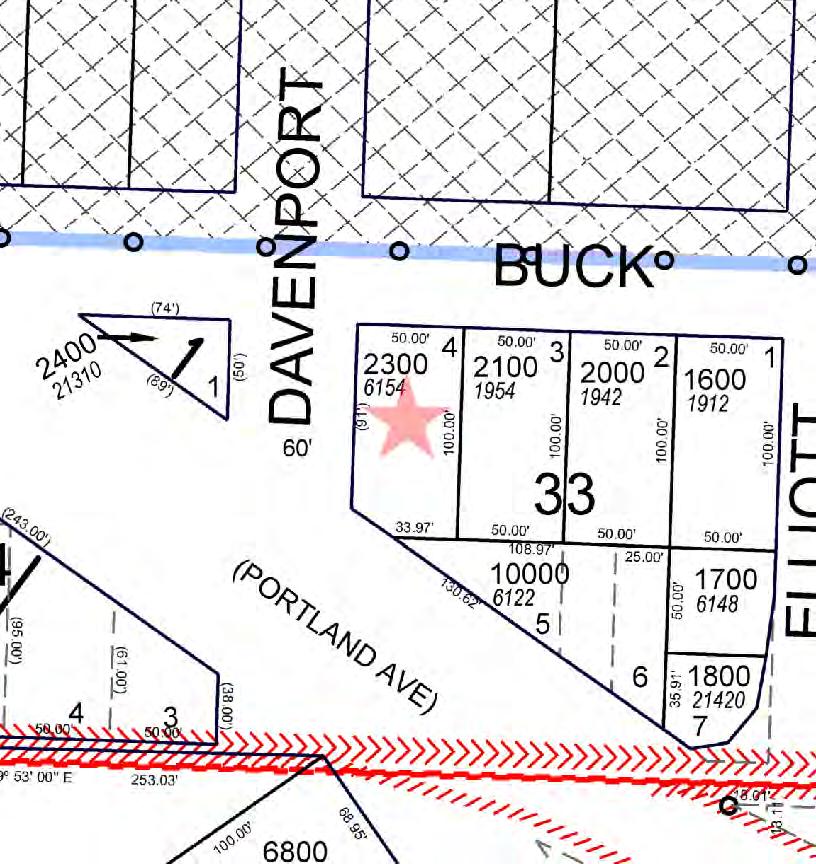
TAXLOT


County
R1E S25
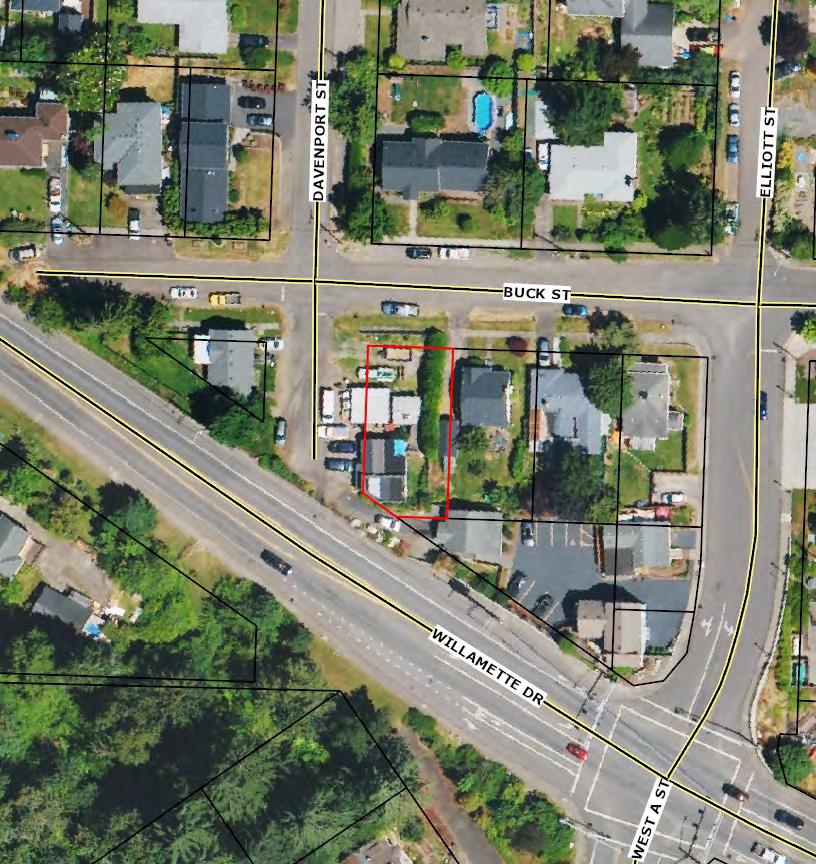
6154 DAVENPORT ST, WEST LINN, OR, 97068 Clackamas
T2S
Latitude: 45.371339
Tax Lot ID: R Number: Tax Lot Size: Building Area Market Total Value Land Use Year Built Sale Date Sale Price Market Land Value Market Building Value State General Property Class 101 County Tax Code Site Address POLITICAL BOUNDARIES Jurisdiction WEST LINN Neighborhood Voting Precinct 133.00000000 Metro Council District 2 Metro Councilor Christine Lewis Metro Councilor Email christine.lewis@oregonmetro.gov US Congressional District 5 Oregon House District 37 +20 m 50 ft
INFORMATION
Lea�et (http://lea�etjs.com) | Tiles: © Metro RLIS
Oregon Senate District 19
USE AND PLANNING Local Zoning R4.5 Generalized Zoning SFR Classi�ed Zoning SFR2 Watershed Johnson Creek Sub-Watershed Oswego Creek-Willamette River Basin Willamette Sub-Basin Lower Willamette Flood Plain Outside Wetland Not in a wetland Urban Growth Boundary Inside Urban/Rural Reserve Reserve Name USGS Quad Name Oregon City SERVICE DISTRICTS Garbage Hauler West Linn Refuse and Recycling, Inc. Commercial Hauler West Linn Refuse and Recycling, Inc. Dropbox Provider Republic Services School District WEST LINN-WILSONVILLE School District Number 3J Oregon Dept. of Ed. Dist. ID 1922 Natl. Center for Ed. Statistics Dist. ID 4113170 Water District Park District Sewer District Tri-City Service District Fire District Tualatin Valley Fire and Rescue District Fire Management Zone 6496 CENSUS INFORMATION Census Tract 206.00000000 Census Block Group 1
LAND
Data Resource Center
600 Northeast Grand Avenue, Portland, OR 97232
503-797-1742
drc@oregonmetro.gov

© Oregon Metro www.oregonmetro.gov/rlis
This Web site is offered as a public service, integrating various government records into a region-wide mapping system. The property assessment records are a multi-county integration of Clackamas, Multnomah and Washington County records. MetroMap blends each county's records into a common database on a quarterly basis. Therefore, to view each county's of�cial records, go to their respective web sites or of�ces. The other MetroMap data are derived from city, county, state, federal and Metro sources. The metadata (data about the data) are included on this site, including the sources to be consulted for veri�cation of the information contained herein. It describes some cases where Metro blends city and county records by generalizing the disparities. Metro assumes no legal responsibility for the compilation of multi-source government information displayed by Metro Map. Users of this information are cautioned to verify all information.
Census Block Population (2010) 1718
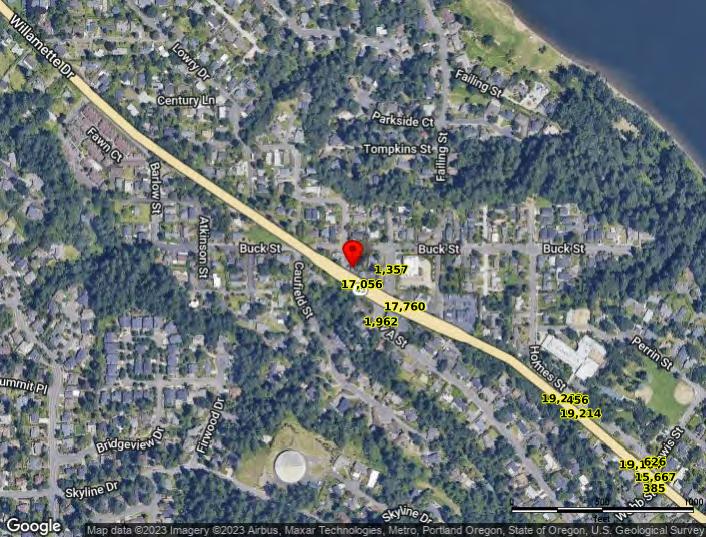
• Topography
COMMUNITY
INFORMATION
Demographics
• Traffic Counts
The information contained is provided by WFG’s Customer Service Department to our customers, and while deemed reliable, is not guaranteed.
6154 Davenport St Sitewise Online

Study Areas
Maps
6154 Davenport St
Profile Tables
Pop-Facts: Population Quick Facts
Pop-Facts: Household Quick Facts
Pop-Facts: Demographic Snapshot (Part 1)
Pop-Facts: Demographic Snapshot (Part 2)
Pop-Facts: Census Demographic Overview (Part 1)
Pop-Facts: Census Demographic Overview (Part 2)
Retail Market Power Opportunity Gap Report By Retail Store Types
Davenport St, West Linn, OR 97068 Lat: 45.37125, Long: -122.62365
6154
6154 Davenport St
Pop-Facts: Population Quick Facts 6154 Davenport St, West Linn, OR 97068 0 - 1 mi Population 2027 Projection 11,524 2022 Estimate 11,041 2010 Census 9,969 2000 Census 8,868 Growth 2022-2027 4.37% Growth 2010-2022 10.75% Growth 2000-2010 12.42% 2022 Est. Population by Age 11,041 Age 0 to 4 549 4.97% Age 5 to 9 592 5.36% Age 10 to 14 653 5.92% Age 15 to 17 432 3.91% Age 18 to 20 393 3.56% Age 21 to 24 535 4.85% Age 25 to 34 1,288 11.66% Age 35 to 44 1,268 11.49% Age 45 to 54 1,467 13.28% Age 55 to 64 1,665 15.08% Age 65 to 74 1,486 13.46% Age 75 to 84 559 5.06% Age 85 and over 153 1.39% Age 16 and over 9,103 82.45% Age 18 and over 8,815 79.83% Age 21 and over 8,421 76.27% Age 65 and over 2,198 19.91% 2022 Est. Median Age 43.50 2022 Est. Average Age 42.15
6154 Davenport St Sitewise Online Pop-Facts: Population Quick Facts
2022 Est. Population by Single-Classification Race 11,041 White Alone 9,599 86.94% Black or African American Alone 187 1.70% American Indian and Alaska Native Alone 66 0.60% Asian Alone 423 3.83% Native Hawaiian and Other Pacific Islander Alone 8 0.08% Some Other Race Alone 181 1.64% Two or More Races 577 5.23% 2022 Est. Population by Ethnicity (Hispanic or Latino) 11,041 Hispanic or Latino 627 5.68% Not Hispanic or Latino 10,414 94.32% 2022 Est. Population by Sex 11,041 Male 5,475 49.59% Female 5,566 50.41%
6154 Davenport St Sitewise Online Pop-Facts: Population Quick Facts Pop-Facts: Population Quick Facts 6154 Davenport St, West Linn, OR 97068 0 - 1 mi
Copyright © Claritas, LLC 2022. All rights reserved.
6154 Davenport St Sitewise Online Pop-Facts: Household Quick Facts Pop-Facts: Household Quick Facts 6154 Davenport St, West Linn, OR 97068 0 - 1 mi Households 2027 Projection 4,627 2022 Estimate 4,412 2010 Census 3,908 2000 Census 3,360 Growth 2022-2027 4.87% Growth 2010-2022 12.91% Growth 2000-2010 16.31% 2022 Est. Households by Household Income 4,412 Income Less than $15,000 202 4.59% Income $15,000 to $24,999 263 5.96% Income $25,000 to $34,999 324 7.34% Income $35,000 to $49,999 404 9.15% Income $50,000 to $74,999 596 13.51% Income $75,000 to $99,999 482 10.94% Income $100,000 to $124,999 360 8.16% Income $125,000 to $149,999 328 7.43% Income $150,000 to $199,999 460 10.43% Income $200,000 to $249,999 249 5.65% Income $250,000 to $499,999 438 9.92% Income $500,000 or more 305 6.91% 2022 Est. Average Household Income $149,091 2022 Est. Median Household Income $96,599 2022 Median HH Inc. by Single-Classification Race White Alone $98,902 Black or African American Alone $29,527 American Indian and Alaska Native Alone $24,754 Asian Alone $178,740 Native Hawaiian and Other Pacific Islander Alone $49,191 Some Other Race Alone $51,288 Two or More Races $50,046 Hispanic or Latino $57,589 Not Hispanic or Latino $98,416 2022 Est. Households by Household Type 4,412 Family Households 3,119 70.69% Nonfamily Households 1,293 29.31% 2022 Est. Group Quarters Population 41
2022 Est. Households by Household Size 4,412 1-person 1,089 24.69% 2-person 1,539 34.87% 3-person 791 17.93% 4-person 651 14.76% 5-person 236 5.35% 6-person 75 1.69% 7-or-more-person 31 0.71% 2022 Est. Average Household Size 2.49
Davenport
Online Pop-Facts: Household Quick Facts Pop-Facts: Household Quick Facts 6154 Davenport St, West Linn, OR 97068 0 - 1 mi
6154
St Sitewise
2022 Est. HHs by Type by Presence of Own Children 3,119 Married-Couple Family, own children 1,089 34.92% Married-Couple Family, no own children 1,422 45.59% Male Householder, own children 83 2.66% Male Householder, no own children 73 2.35% Female Householder, own children 276 8.86% Female Householder, no own children 175 5.62% Copyright © Claritas, LLC 2022. All rights reserved. 6154 Davenport St Sitewise Online Pop-Facts: Household Quick Facts Pop-Facts: Household Quick Facts 6154 Davenport St, West Linn, OR 97068 0 - 1 mi
Davenport
Sitewise Online Pop-Facts: Demographic Snapshot (Part 1) Pop-Facts: Demographic Snapshot (Part 1) 6154 Davenport St, West Linn, OR 97068 0 - 1 mi Population 2027 Projection 11,524 2022 Estimate 11,041 2010 Census 9,969 2000 Census 8,868 Growth 2022-2027 4.37% Growth 2010-2022 10.75% Growth 2000-2010 12.42% 2022 Est. Population by Single-Classification Race 11,041 White Alone 9,599 86.94% Black or African American Alone 187 1.70% American Indian and Alaska Native Alone 66 0.60% Asian Alone 423 3.83% Native Hawaiian and Other Pacific Islander Alone 8 0.08% Some Other Race Alone 181 1.64% Two or More Races 577 5.23% 2022 Est. Population Hispanic or Latino by Origin 11,041 Not Hispanic or Latino 10,414 94.32% Hispanic or Latino 627 5.68% Hispanic or Latino by Origin 627 Mexican 441 70.36% Puerto Rican 31 4.89% Cuban 10 1.53% All Other Hispanic or Latino 146 23.22% 2022 Est. Hisp. or Latino Pop by Single-Classification Race 627 White Alone 374 59.61% Black or African American Alone 5 0.79% American Indian and Alaska Native Alone 12 1.94% Asian Alone 9 1.50% Native Hawaiian and Other Pacific Islander Alone 1 0.13% Some Other Race Alone 171 27.26% Two or More Races 55 8.77%
6154
St
2022 Est. Pop by Race, Asian Alone, by Category 423 Chinese, except Taiwanese 76 18.01% Filipino 83 19.62% Japanese 43 10.07% Asian Indian 51 12.03% Korean 24 5.58% Vietnamese 8 1.88% Cambodian 132 31.34% Hmong 0 0.00% Laotian 4 0.91% Thai 0 0.00% All other Asian Races, including 2 or more 2 0.56% 2022 Est. Population by Ancestry 11,041 Arab 40 0.36% Czech 111 1.00% Danish 104 0.94% Dutch 83 0.75% English 988 8.95% French (except Basque) 229 2.07% French Canadian 24 0.21% German 1,522 13.78% Greek 16 0.15% Hungarian 37 0.33% Irish 836 7.57% Italian 255 2.31% Lithuanian 1 0.01% Norwegian 415 3.76% Polish 185 1.68% Portuguese 142 1.28% Russian 74 0.67% Scottish 452 4.10% Scotch-Irish 101 0.91% Slovak 18 0.16% Subsaharan African 86 0.78% Swedish 334 3.02% Swiss 46 0.41% Ukrainian 67 0.61% United States or American 334 3.03% Welsh 119 1.08% West Indian (except Hisp. groups) 0 0.00% Other Ancestries 3,185 28.84% Ancestry Unclassified 1,241 11.24% 2022 Est. Pop Age 5+ by Language Spoken At Home 10,492 Speak only English 8,789 83.77%
Pop-Facts: Demographic
1) Pop-Facts: Demographic Snapshot (Part 1) 6154 Davenport St,
Linn,
97068 0 - 1 mi
6154 Davenport St Sitewise Online
Snapshot (Part
West
OR
Speak Asian or Pacific Island Language 367 3.49% Speak IndoEuropean Language 521 4.96% Speak Spanish 609 5.80% Speak Other Language 207 1.97% 6154 Davenport St Sitewise Online Pop-Facts: Demographic Snapshot (Part 1) Pop-Facts: Demographic Snapshot (Part 1) 6154 Davenport St, West Linn, OR 97068 0 - 1 mi
2022 Est. Population by Sex 11,041 Male 5,475 49.59% Female 5,566 50.41% 2022 Est. Population by Age 11,041 Age 0 to 4 549 4.97% Age 5 to 9 592 5.36% Age 10 to 14 653 5.92% Age 15 to 17 432 3.91% Age 18 to 20 393 3.56% Age 21 to 24 535 4.85% Age 25 to 34 1,288 11.66% Age 35 to 44 1,268 11.49% Age 45 to 54 1,467 13.28% Age 55 to 64 1,665 15.08% Age 65 to 74 1,486 13.46% Age 75 to 84 559 5.06% Age 85 and over 153 1.39% Age 16 and over 9,103 82.45% Age 18 and over 8,815 79.83% Age 21 and over 8,421 76.27% Age 65 and over 2,198 19.91% 2022 Est. Median Age 43.50 2022 Est. Average Age 42.15
6154 Davenport St Sitewise Online
Pop-Facts:
6154 Davenport
0 - 1 mi
Pop-Facts: Demographic Snapshot (Part 1)
Demographic Snapshot (Part 1)
St, West Linn, OR 97068
2022 Est. Male Population by Age 5,475 Age 0 to 4 278 5.08% Age 5 to 9 304 5.55% Age 10 to 14 352 6.43% Age 15 to 17 224 4.09% Age 18 to 20 206 3.77% Age 21 to 24 281 5.13% Age 25 to 34 692 12.64% Age 35 to 44 620 11.33% Age 45 to 54 707 12.92% Age 55 to 64 790 14.43% Age 65 to 74 700 12.78% Age 75 to 84 262 4.79% Age 85 and over 59 1.08% 2022 Est. Median Age, Male 41.46 2022 Est. Average Age, Male 41.03 2022 Est. Female Population by Age 5,566 Age 0 to 4 271 4.87% Age 5 to 9 289 5.18% Age 10 to 14 301 5.42% Age 15 to 17 208 3.74% Age 18 to 20 187 3.36% Age 21 to 24 254 4.57% Age 25 to 34 596 10.71% Age 35 to 44 648 11.64% Age 45 to 54 760 13.65% Age 55 to 64 875 15.72% Age 65 to 74 786 14.13% Age 75 to 84 297 5.33% Age 85 and over 94 1.69% 2022 Est. Median Age, Female 45.38 2022 Est. Average Age, Female 43.25
Sitewise Online
Demographic Snapshot (Part 1) Pop-Facts: Demographic Snapshot (Part 1) 6154 Davenport St, West Linn, OR 97068 0 - 1 mi
6154 Davenport St
Pop-Facts:
2022 Est. Pop Age 15+ by Marital Status 9,247 Total, Never Married 2,308 24.96% Males, Never Married 1,241 13.42% Females, Never Married 1,067 11.54% Married, Spouse present 5,161 55.82% Married, Spouse absent 270 2.92% Widowed 331 3.57% Males, Widowed 95 1.03% Females, Widowed 235 2.54% Divorced 1,177 12.73% Males, Divorced 442 4.78% Females, Divorced 735 7.95% 2022 Est. Pop Age 25+ by Edu. Attainment 7,886 Less than 9th grade 141 1.79% Some High School, no diploma 197 2.49% High School Graduate (or GED) 1,195 15.16% Some College, no degree 1,578 20.01% Associate Degree 701 8.89% Bachelor's Degree 2,556 32.41% Master's Degree 1,028 13.04% Professional School Degree 264 3.35% Doctorate Degree 225 2.85% 2022 Est. Pop. Age 25+ by Edu. Attain., Hisp./Lat. 343 No High School Diploma 69 20.12% High School Graduate 109 31.85% Some College or Associate's Degree 126 36.56% Bachelor's Degree or Higher 39 11.46% Copyright © Claritas, LLC 2022. All rights reserved. 6154 Davenport St Sitewise Online Pop-Facts: Demographic Snapshot (Part 1) Pop-Facts: Demographic Snapshot (Part 1) 6154 Davenport St, West Linn, OR 97068 0 - 1 mi
6154 Davenport St Sitewise Online Pop-Facts: Demographic Snapshot (Part 2) Pop-Facts: Demographic Snapshot (Part 2) 6154 Davenport St, West Linn, OR 97068 0 - 1 mi Households 2027 Projection 4,627 2022 Estimate 4,412 2010 Census 3,908 2000 Census 3,360 Growth 2022-2027 4.87% Growth 2010-2022 12.91% Growth 2000-2010 16.31% 2022 Est. Households by Household Type 4,412 Family Households 3,119 70.69% Nonfamily Households 1,293 29.31% 2022 Est. Group Quarters Population 41 2022 HHs by Ethnicity: Hispanic/Latino 175 3.96% 2022 Est. Households by HH Income 4,412 Income < $15,000 202 4.59% Income $15,000 to $24,999 263 5.96% Income $25,000 to $34,999 324 7.34% Income $35,000 to $49,999 404 9.15% Income $50,000 to $74,999 596 13.51% Income $75,000 to $99,999 482 10.94% Income $100,000 to $124,999 360 8.16% Income $125,000 to $149,999 328 7.43% Income $150,000 to $199,999 460 10.43% Income $200,000 to $249,999 249 5.65% Income $250,000 to $499,999 438 9.92% Income $500,000+ 305 6.91% 2022 Est. Average Household Income $149,091 2022 Est. Median Household Income $96,599 2022 Median HH Income by Single-Class. Race or Ethn. White Alone $98,902 Black or African American Alone $29,527 American Indian and Alaska Native Alone $24,754 Asian Alone $178,740 Native Hawaiian and Other Pacific Islander Alone $49,191 Some Other Race Alone $51,288 Two or More Races $50,046 Hispanic or Latino $57,589
Not Hispanic or Latino $98,416
6154 Davenport St Sitewise Online Pop-Facts: Demographic Snapshot (Part 2)
Pop-Facts: Demographic Snapshot (Part 2)
6154 Davenport St, West Linn, OR 97068 0 - 1 mi
2022 Est. Family HH Type by Presence of Own Children 3,119 Married-Couple Family, own children 1,089 34.92% Married-Couple Family, no own children 1,422 45.59% Male Householder, own children 83 2.66% Male Householder, no own children 73 2.35% Female Householder, own children 276 8.86% Female Householder, no own children 175 5.62% 2022 Est. Households by Household Size 4,412 1-person 1,089 24.69% 2-person 1,539 34.87% 3-person 791 17.93% 4-person 651 14.76% 5-person 236 5.35% 6-person 75 1.69% 7-or-more-person 31 0.71% 2022 Est. Average Household Size 2.49 2022 Est. Households by Presence of People Under 18 4,412 Households with 1 or more People under Age 18 1,540 34.91% Households with No People under Age 18 2,872 65.09% Households with 1 or more People under Age 18 1,540 Married-Couple Family 1,127 73.16% Other Family, Male Householder 90 5.83% Other Family, Female Householder 308 20.01% Nonfamily, Male Householder 11 0.69% Nonfamily, Female Householder 5 0.30% Households with No People under Age 18 2,872 Married-Couple Family 1,382 48.14% Other Family, Male Householder 67 2.32% Other Family, Female Householder 143 4.98% Nonfamily, Male Householder 583 20.29% Nonfamily, Female Householder 697 24.27% 6154 Davenport St Sitewise Online Pop-Facts: Demographic Snapshot (Part 2) Pop-Facts: Demographic Snapshot (Part 2) 6154 Davenport St, West Linn, OR 97068 0 - 1 mi
2022 Est. Households by Number of Vehicles 4,412 No Vehicles 187 4.23% 1 Vehicle 1,314 29.78% 2 Vehicles 1,991 45.12% 3 Vehicles 533 12.09% 4 Vehicles 281 6.37% 5 or more Vehicles 107 2.41% 2022 Est. Average Number of Vehicles 1.97 Family Households 2027 Projection 3,269 2022 Estimate 3,119 2010 Census 2,760 2000 Census 2,433 Growth 2022-2027 4.83% Growth 2010-2022 12.98% Growth 2000-2010 13.46% 2022 Est. Families by Poverty Status 3,119 2022 Families at or Above Poverty 2,972 95.28% 2022 Families at or Above Poverty with Children 1,470 47.14% 2022 Families Below Poverty 147 4.72% 2022 Families Below Poverty with Children 89 2.86% 2022 Est. Pop Age 16+ by Employment Status 9,103 In Armed Forces 1 0.01% Civilian - Employed 5,699 62.60% Civilian - Unemployed 241 2.64% Not in Labor Force 3,163 34.75% 2022 Est. Civ. Employed Pop 16+ by Class of Worker 5,880 For-Profit Private Workers 3,732 63.48% Non-Profit Private Workers 607 10.32% Local Government Workers 372 6.32% State Government Workers 240 4.09% Federal Government Workers 65 1.11% Self-Employed Workers 861 14.65% Unpaid Family Workers 2 0.04%
Pop-Facts: Demographic Snapshot (Part 2) 6154 Davenport St, West Linn, OR 97068 0 - 1 mi
6154 Davenport
St
Sitewise Online Pop-Facts: Demographic Snapshot (Part 2)
2022 Est. Civ. Employed Pop 16+ by Occupation 5,880 Architect/Engineer 177 3.02% Arts/Entertainment/Sports 167 2.84% Building Grounds Maintenance 208 3.54% Business/Financial Operations 386 6.57% Community/Social Services 186 3.16% Computer/Mathematical 141 2.40% Construction/Extraction 199 3.39% Education/Training/Library 420 7.15% Farming/Fishing/Forestry 30 0.52% Food Prep/Serving 283 4.81% Healthcare Practitioner/Technician 467 7.94% Healthcare Support 116 1.97% Maintenance Repair 135 2.29% Legal 21 0.36% Life/Physical/Social Science 40 0.69% Management 1,002 17.03% Office/Admin. Support 490 8.33% Production 150 2.56% Protective Service 17 0.29% Sales/Related 837 14.23% Personal Care/Service 120 2.04% Transportation/Moving 288 4.89% 2022 Est. Pop 16+ by Occupation Classification 5,880 Blue Collar 772 13.13% White Collar 4,334 73.71% Service & Farm 774 13.16% 2022 Est. Workers Age 16+ by Transp. To Work 5,773 Drove Alone 4,260 73.79% Car Pooled 450 7.79% Public Transportation 221 3.83% Walked 113 1.96% Bicycle 25 0.44% Other Means 49 0.85% Worked at Home 654 11.33% 2022 Est. Workers Age 16+ by Travel Time to Work* Less than 15 minutes 992 15 to 29 Minutes 1,993 30 to 44 Minutes 1,262 45 to 59 Minutes 538 60 or more Minutes 321
Pop-Facts: Demographic
Pop-Facts: Demographic Snapshot (Part 2) 6154 Davenport St, West Linn, OR 97068 0 - 1 mi
6154 Davenport St Sitewise Online
Snapshot (Part 2)
2022 Est. Avg. Travel Time to Work in Minutes* 30.09 2022 Est. Occupied Housing Units by Tenure 4,412 Owner-Occupied 3,223 73.05% Renter-Occupied 1,189 26.95% 2022 Occupied Housing Units: Avg. Length of Residence Owner-Occupied 13 Renter-Occupied 6 6154 Davenport St Sitewise Online Pop-Facts: Demographic Snapshot (Part 2) Pop-Facts: Demographic Snapshot (Part 2) 6154 Davenport St, West Linn, OR 97068 0 - 1 mi
2022 Est. Owner Occupied Housing Units by Value 3,223 Value Less than $20,000 25 0.76% Value $20,000 to $39,999 36 1.11% Value $40,000 to $59,999 19 0.58% Value $60,000 to $79,999 3 0.10% Value $80,000 to $99,999 21 0.64% Value $100,000 to $149,999 34 1.04% Value $150,000 to $199,999 21 0.66% Value $200,000 to $299,999 51 1.59% Value $300,000 to $399,999 254 7.88% Value $400,000 to $499,999 466 14.46% Value $500,000 to $749,999 1,197 37.15% Value $750,000 to $999,999 722 22.40% Value $1,000,000 to $1,499,999 277 8.59% Value $1,500,000 to $1,999,999 75 2.33% Value $2,000,000 or more 23 0.71% 2022 Est. Median All Owner-Occupied Housing Unit Value $642,469 2022 Est. Housing Units by Units in Structure 4,625 1 Unit Attached 73 1.58% 1 Unit Detached 3,301 71.37% 2 Units 100 2.16% 3 or 4 Units 212 4.58% 5 to 19 Units 558 12.07% 20 to 49 Units 93 2.01% 50 or More Units 90 1.94% Mobile Home or Trailer 198 4.28% Boat, RV, Van, etc. 0 0.00% Dominant structure type 1 Unit Detached 2022 Est. Housing Units by Year Structure Built 4,625 Housing Units Built 2014 or Later 511 11.04% Housing Units Built 2010 to 2013 72 1.55% Housing Units Built 2000 to 2009 452 9.76% Housing Units Built 1990 to 1999 855 18.48% Housing Units Built 1980 to 1989 941 20.34% Housing Units Built 1970 to 1979 850 18.38% Housing Units Built 1960 to 1969 348 7.51% Housing Units Built 1950 to 1959 222 4.79% Housing Units Built 1940 to 1949 100 2.16% Housing Units Built 1939 or Earlier 277 5.98% 2022 Est. Median Year Structure Built** 1985 Dominant Year Structure Built 1980 to 1989
Pop-Facts:
6154 Davenport
Linn,
0 - 1 mi
6154 Davenport St Sitewise Online
Pop-Facts: Demographic Snapshot (Part 2)
Demographic Snapshot (Part 2)
St, West
OR 97068
6154 Davenport St Sitewise Online
Pop-Facts: Demographic Snapshot (Part 2)
Pop-Facts: Demographic Snapshot (Part 2)
Copyright © Claritas, LLC 2022. All rights reserved.
* This row intentionally left blank. No Total Category.
**1939 will appear when at least half of the Housing Units in this reports area were built in 1939 or earlier.
6154 Davenport St, West Linn, OR 97068 0 - 1 mi
6154 Davenport St Sitewise Online Pop-Facts: Census Demographic Overview (Part 1) Pop-Facts: Census Demographic Overview (Part 1) 6154 Davenport St, West Linn, OR 97068 0 - 1 mi Population 2027 Projection 11,524 2022 Estimate 11,041 2010 Census 9,969 2000 Census 8,868 Growth 2022-2027 4.37% Growth 2010-2022 10.75% Growth 2000-2010 12.42% 2010 Population by Single-Classification Race 9,969 White Alone 9,000 90.28% Black or African American Alone 97 0.98% American Indian and Alaska Native Alone 48 0.48% Asian Alone 320 3.21% Native Hawaiian and Other Pacific Islander Alone 7 0.07% Some Other Race Alone 159 1.60% Two or More Races 338 3.39% 2010 Population By Ethnicity 9,969 Not Hispanic or Latino 9,434 94.63% Hispanic or Latino 535 5.37% 2010 Hispanic or Latino by Single-Classification Race 535 White Alone 312 58.38% Black or African American Alone 6 1.06% American Indian and Alaska Native Alone 9 1.70% Asian Alone 8 1.44% Native Hawaiian and Other Pacific Islander Alone 0 0.08% Some Other Race Alone 148 27.68% Two or More Races 52 9.66% 2010 Population by Sex 9,969 Male 4,943 49.58% Female 5,026 50.42% Male/Female Ratio 0.98
Pop-Facts: Census Demographic Overview (Part 1)
Pop-Facts: Census Demographic Overview
2010 Population by Age 9,969 Age 0 to 4 552 5.53% Age 5 to 9 679 6.81% Age 10 to 14 783 7.86% Age 15 to 17 467 4.68% Age 18 to 20 308 3.09% Age 21 to 24 356 3.57% Age 25 to 34 965 9.68% Age 35 to 44 1,397 14.01% Age 45 to 54 1,794 18.00% Age 55 to 64 1,568 15.73% Age 65 to 74 674 6.76% Age 75 to 84 318 3.19% Age 85 and over 109 1.10% Age 16 and over 7,787 78.11% Age 18 and over 7,489 75.12% Age 21 and over 7,181 72.03% Age 65 and over 1,101 11.04% 2010 Median Age 41.27
6154 Davenport St Sitewise Online
0 - 1 mi
(Part 1) 6154 Davenport St, West Linn, OR 97068
Copyright © Claritas, LLC 2022. All rights reserved.
2010 Male Population by Age 4,943 Age 0 to 4 308 6.23% Age 5 to 9 339 6.87% Age 10 to 14 414 8.37% Age 15 to 17 261 5.27% Age 18 to 20 170 3.44% Age 21 to 24 192 3.89% Age 25 to 34 467 9.44% Age 35 to 44 664 13.43% Age 45 to 54 864 17.49% Age 55 to 64 766 15.49% Age 65 to 74 322 6.51% Age 75 to 84 140 2.82% Age 85 and over 36 0.74% 2010 Median Age, Male 39.83 2010 Female Population by Age 5,026 Age 0 to 4 243 4.84% Age 5 to 9 339 6.75% Age 10 to 14 370 7.36% Age 15 to 17 206 4.10% Age 18 to 20 137 2.74% Age 21 to 24 163 3.25% Age 25 to 34 498 9.91% Age 35 to 44 733 14.58% Age 45 to 54 930 18.50% Age 55 to 64 803 15.97% Age 65 to 74 352 7.00% Age 75 to 84 178 3.54% Age 85 and over 73 1.45% 2010 Median Age, Female 42.58
6154 Davenport St Sitewise Online Pop-Facts: Census Demographic Overview (Part 1) Pop-Facts: Census Demographic Overview (Part 1) 6154 Davenport St, West Linn, OR 97068 0 - 1 mi
6154 Davenport St Sitewise Online Pop-Facts: Census Demographic Overview (Part 2) Pop-Facts: Census Demographic Overview (Part 2) 6154 Davenport St, West Linn, OR 97068 0 - 1 mi Households 2027 Projection 4,627 2022 Estimate 4,412 2010 Census 3,908 2000 Census 3,360 Growth 2022-2027 4.87% Growth 2010-2022 12.91% Growth 2000-2010 16.31% 2010 Households by Household Type 3,908 Family Households 2,760 70.64% Non-family Households 1,147 29.36% 2010 Group Quarters Population 39 2010 Hispanic or Latino Households 138 3.53% 2010 Households by Household Size 3,908 1-person 902 23.09% 2-person 1,388 35.51% 3-person 684 17.50% 4-person 611 15.64% 5-person 222 5.68% 6-person 68 1.74% 7-or-more-person 33 0.84%
2010 Households by Type and Presence of Children 3,908 Married-Couple Family, own children 963 24.63% Male Householder, own children 73 1.88% Female Householder, own children 244 6.25% Married-Couple Family, no own children 1,259 32.22% Male Householder, no own children 64 1.65% Female Householder, no own children 157 4.02% Non-family Households 1,147 29.36% 2010 Households by Presence of People Under Age 18 3,908 HH with 1 or More People Under Age 18: 1,361 34.83% Households with No People Under Age 18: 2,546 65.17% HH with 1 or More People Under Age 18: 1,361 Married-Couple Family 996 73.17% Other Family, Male Householder 79 5.83% Other Family, Female Householder 274 20.11% Nonfamily, Male Householder 8 0.59% Nonfamily, Female Householder 4 0.29% Households with No People Under Age 18: 2,546 Married-Couple Family 1,225 48.13% Other Family, Male Householder 58 2.29% Other Family, Female Householder 128 5.01% Nonfamily, Male Householder 517 20.30% Nonfamily, Female Householder 618 24.28% 2010 Occupied Housing Units by Tenure 3,908 Owner-Occupied 2,854 73.03% Renter-Occupied 1,054 26.97%
6154 Davenport St Sitewise Online Pop-Facts: Census Demographic Overview (Part 2) Pop-Facts: Census Demographic Overview (Part 2) 6154 Davenport St, West Linn, OR 97068 0 - 1 mi
Copyright © Claritas, LLC 2022. All rights reserved.
6154 Davenport St Sitewise Online Retail Market Power Opportunity Gap Report By Retail Store Types Retail Market Power Opportunity Gap Report By Retail Store Types 6154 Davenport St, West Linn, OR 97068 0 - 1 mi 2022 Demand 2022 Supply Opportunity Gap/Surplus Total retail trade including food and drink (NAICS 44, 45 and 722) $312,233,131 $165,083,961 $147,149,172 Total retail trade (NAICS 44 and 45) $278,762,271 $155,184,393 $123,577,878 Motor vehicle and parts dealers (NAICS 441) $62,248,959 $100,808,498 -$38,559,542 Automobile dealers (NAICS 4411) $51,873,450 $95,525,328 -$43,651,878 New car dealers (NAICS 44111) $46,105,878 $95,510,550 -$49,404,673 Used car dealers (NAICS 44112) $5,767,573 $ 14,778 $5,752,794 Other motor vehicle dealers (NAICS 4412) $6,010,192 $1,817,083 $4,193,109 Recreational vehicle dealers (NAICS 44121) $2,418,751 $1,817,083 $601,668 Motorcycle, boat, and other motor vehicle dealers (NAICS 44122) $3,591,441 $ 0 $3,591,441 Boat dealers (NAICS 441222) $1,436,857 $ 0 $1,436,857 Motorcycle, ATV, and all other motor vehicle dealers (NAICS 441228) $2,154,584 $ 0 $2,154,584 Automotive parts, accessories, and tire stores (NAICS 4413) $4,365,316 $3,466,087 $899,229 Automotive parts and accessories stores (NAICS 44131) $2,760,693 $2,611,523 $149,169 Tire dealers (NAICS 44132) $1,604,623 $854,564 $750,060 Furniture and home furnishings stores (NAICS 442) $6,168,303 $1,816,606 $4,351,696 Furniture stores (NAICS 4421) $3,381,221 $720,889 $2,660,332 Home furnishings stores (NAICS 4422) $2,787,082 $1,095,717 $1,691,365 Floor covering stores (NAICS 44221) $1,355,139 $852,726 $502,413 Other home furnishings stores (NAICS 44229) $1,431,943 $242,991 $1,188,952 Window treatment stores (NAICS 442291) $ 69,217 $241,773 -$172,556 All other home furnishings stores (NAICS 442299) $1,362,726 $ 1,218 $1,361,508 Electronics and appliance stores (NAICS 443) $3,716,495 $2,043,989 $1,672,506 Household appliance stores (NAICS 443141) $906,248 $ 37,364 $868,884 Electronics stores (NAICS 443142) $2,810,247 $2,006,625 $803,622 Building material and garden equipment and supplies dealers (NAICS 444) $22,373,710 $5,199,181 $17,174,529 Building material and supplies dealers (NAICS 4441) $19,343,930 $4,475,234 $14,868,696 Home centers (NAICS 44411) $10,699,872 $2,028,624 $8,671,248 Paint and wallpaper stores (NAICS 44412) $657,081 $343,729 $313,352 Hardware stores (NAICS 44413) $1,671,985 $116,187 $1,555,798 Other building material dealers (NAICS 44419) $6,314,993 $1,986,694 $4,328,298 Lawn and garden equipment and supplies stores (NAICS 4442) $3,029,780 $723,948 $2,305,832 Outdoor power equipment stores (NAICS 44421) $624,851 $ 0 $624,851 Nursery, garden center, and farm supply stores (NAICS 44422) $2,404,929 $723,948 $1,680,981 Food and beverage stores (NAICS 445) $40,823,147 $23,646,248 $17,176,899 Grocery stores (NAICS 4451) $36,246,479 $22,306,087 $13,940,393 Supermarkets and other grocery (except convenience) stores (NAICS 44511) $34,805,078 $20,838,286 $13,966,792 Convenience stores (NAICS 44512) $1,441,401 $1,467,800 -$26,399 Specialty food stores (NAICS 4452) $1,053,953 $420,646 $633,307
Meat markets (NAICS 44521) $318,393 $ 0 $318,393 Fish and seafood markets (NAICS 44522) $125,302 $ 0 $125,302 Fruit and vegetable markets (NAICS 44523) $219,006 $ 0 $219,006 Other specialty food stores (NAICS 44529) $391,251 $420,646 -$29,395 Baked goods and confectionery and nut stores (NAICS 445291 + 445292) $207,661 $ 0 $207,661 All other specialty food stores (NAICS 445299) $183,591 $420,646 -$237,056 Beer, wine, and liquor stores (NAICS 4453) $3,522,715 $919,515 $2,603,200 Health and personal care stores (NAICS 446) $16,341,261 $1,630,687 $14,710,574 Pharmacies and drug stores (NAICS 44611) $14,167,032 $1,630,685 $12,536,347 Cosmetics, beauty supplies, and perfume stores (NAICS 44612) $953,185 $ 0 $953,185 Optical goods stores (NAICS 44613) $463,190 $ 0 $463,190 Other health and personal care stores (NAICS 44619) $757,855 $ 3 $757,852 Food (health) supplement stores (NAICS 446191) $268,834 $ 3 $268,831 All other health and personal care stores (NAICS 446199) $489,021 $ 0 $489,021 Gasoline stations (NAICS 447) $20,663,113 $9,073,306 $11,589,807 Clothing and clothing accessories stores (NAICS 448) $11,202,415 $2,790,550 $8,411,864 Clothing stores (NAICS 4481) $7,336,720 $2,769,154 $4,567,566 Men's clothing stores (NAICS 44811) $330,467 $ 30,123 $300,344 Women's clothing stores (NAICS 44812) $1,312,498 $ 23,297 $1,289,201 Children's and infants' clothing stores (NAICS 44813) $246,032 $ 2,574 $243,458 Family clothing stores (NAICS 44814) $4,400,575 $2,491,616 $1,908,960 Clothing accessories stores (NAICS 44815) $368,681 $ 14,090 $354,591 Other clothing stores (NAICS 44819) $678,467 $207,455 $471,012 Shoe stores (NAICS 4482) $1,519,013 $ 936 $1,518,078 Jewelry, luggage, and leather goods stores (NAICS 4483) $2,346,681 $ 20,461 $2,326,220 Jewelry stores (NAICS 44831) $1,561,500 $ 19,749 $1,541,752 Luggage and leather goods stores (NAICS 44832) $785,181 $ 712 $784,469 Sporting goods, hobby, musical instrument, and book stores (NAICS 451) $4,337,208 $1,709,090 $2,628,118 Sporting goods, hobby, and musical instrument stores (NAICS 4511) $3,905,429 $1,709,090 $2,196,339 Sporting goods stores (NAICS 45111) $2,845,087 $1,159,116 $1,685,970 Hobby, toy, and game stores (NAICS 45112) $771,372 $549,678 $221,694 Sewing, needlework, and piece goods stores (NAICS 45113) $138,145 $ 296 $137,849 Musical instrument and supplies stores (NAICS 45114) $150,826 $ 0 $150,826 Book stores and news dealers (NAICS 4512) $431,779 $ 0 $431,779 Book stores (NAICS 451211) $402,132 $ 0 $402,132 News dealers and newsstands (NAICS 451212) $ 29,647 $ 0 $ 29,647 General merchandise stores (NAICS 452) $35,393,654 $394,965 $34,998,689 Department stores (NAICS 4522) $4,480,380 $ 8,876 $4,471,504 Other general merchandise stores (NAICS 4523) $30,913,274 $386,089 $30,527,186 Warehouse clubs and supercenters (NAICS 452311) $27,889,276 $277,744 $27,611,531 All other general merchandise stores (NAICS 452319) $3,023,999 $108,345 $2,915,654 6154 Davenport St Sitewise Online Retail Market Power Opportunity Gap Report By Retail Store Types Retail Market Power Opportunity Gap Report By Retail Store Types 6154 Davenport St, West Linn, OR 97068 0 - 1 mi 2022 Demand 2022 Supply Opportunity Gap/Surplus
* GAFO (General merchandise, Apparel, Furniture and Other) represents sales at stores that sell merchandise normally sold in department stores. This category is not included in Total Retail Sales Including Eating and Drinking Places.
Miscellaneous store retailers (NAICS 453) $6,197,116 $5,112,542 $1,084,574 Florists (NAICS 4531) $308,565 $ 0 $308,565 Office supplies, stationery, and gift stores (NAICS 4532) $1,375,085 $3,944,078 -$2,568,993 Office supplies and stationery stores (NAICS 45321) $589,511 $3,691,327 -$3,101,816 Gift, novelty, and souvenir stores (NAICS 45322) $785,574 $252,751 $532,823 Used merchandise stores (NAICS 4533) $906,813 $ 5,420 $901,394 Other miscellaneous store retailers (NAICS 4539) $3,606,653 $1,163,044 $2,443,609 Pet and pet supplies stores (NAICS 45391) $1,018,621 $1,149,728 -$131,107 Art dealers (NAICS 45392) $620,311 $ 0 $620,311 Manufactured (mobile) home dealers (NAICS 45393) $412,158 $ 2,187 $409,971 All other miscellaneous store retailers (NAICS 45399) $1,555,563 $ 11,128 $1,544,434 Tobacco stores (NAICS 453991) $366,848 $ 8,099 $358,749 All other miscellaneous store retailers (except tobacco stores) (NAICS 453998) $1,188,715 $ 3,029 $1,185,686 Non-store retailers (NAICS 454) $49,296,891 $958,729 $48,338,162 Electronic shopping and mail-order houses (NAICS 4541) $46,733,378 $956,390 $45,776,989 Vending machine operators (NAICS 4542) $336,295 $ 0 $336,295 Direct selling establishments (NAICS 4543) $2,227,219 $ 2,340 $2,224,879 Fuel dealers (NAICS 45431) $1,080,280 $ 562 $1,079,719 Other direct selling establishments (NAICS 45439) $1,146,938 $ 1,778 $1,145,160 Food services and drinking places (NAICS 722) $33,470,860 $9,899,569 $23,571,292 Special food services (NAICS 7223) $2,673,658 $ 79,071 $2,594,587 Food service contractors (NAICS 72231) $2,115,156 $ 79,071 $2,036,085 Caterers (NAICS 72232) $508,865 $ 0 $508,865 Mobile food services (NAICS 72233) $ 49,637 $ 0 $ 49,637 Drinking places (alcoholic beverages) (NAICS 7224) $1,097,781 $ 1,317 $1,096,464 Restaurants and other eating places (NAICS 7225) $29,699,421 $9,819,181 $19,880,241 Full-service restaurants (NAICS 722511) $14,883,033 $5,056,256 $9,826,777 Limited-service restaurants (NAICS 722513) $12,572,417 $4,056,817 $8,515,599 Cafeterias, grill buffets, and buffets (NAICS 722514) $320,482 $ 24,578 $295,905 Snack and nonalcoholic beverage bars (NAICS 722515) $1,923,489 $681,529 $1,241,960 GAFO* $60,819,449 $8,759,145 $52,060,304 General Merchandise Stores-452 $35,393,654 $394,965 $34,998,689 Clothing & Clothing Accessories Stores-448 $11,202,415 $2,790,550 $8,411,864 Furniture & Home Furnishings Stores-442 $6,168,303 $1,816,606 $4,351,696 Electronics & Appliance Stores-443 $3,716,495 $2,043,989 $1,672,506 Sporting Goods, Hobby, Book, Music Stores-451 $4,337,208 $1,709,090 $2,628,118 Office Supplies, Stationery, Gift Stores-4532 $1,375,085 $3,944,078 -$2,568,993
6154 Davenport St Sitewise Online Retail Market Power Opportunity Gap Report By Retail Store Types Retail Market Power Opportunity Gap Report By Retail Store Types 6154 Davenport St, West Linn, OR 97068 0 - 1 mi 2022 Demand 2022 Supply Opportunity Gap/Surplus
6154 Davenport St
Sitewise Online
Retail Market Power Opportunity Gap Report By Retail Store Types
Retail Market Power Opportunity Gap Report By
Retail Store Types
Retail Market Power data is derived from two major sources of information. The demand data is derived from the Consumer Expenditure Survey (CE Survey or CEX), which is fielded by the U.S. Bureau of Labor Statistics (BLS). The supply data is derived from the Census of Retail Trade (CRT), which is made available by the U.S. Census. Additional data sources are incorporated to create both supply and demand estimates. The difference between demand and supply represents the opportunity gap or surplus available for each merchandise line in the specified reporting geography. When this difference is positive (demand is greater than the supply), there is an opportunity gap for that merchandise line; when the difference is negative (supply is greater than demand), there is a surplus.
Copyright © 2022 Environics Analytics. All rights reserved.
0
1 mi
Demand 2022 Supply Opportunity Gap/Surplus
6154 Davenport St, West Linn, OR 97068
-
2022


 Powered by Sitewise
Data Source: Kalibrate TrafficMetrix
Powered by Sitewise
Data Source: Kalibrate TrafficMetrix