DEVELOPER PACKET
6035 NW LARKSPUR ST
CAMAS, WA 98607
PARCEL # 175959000
CLARK COUNTY
Compliments of WFG National Title Insurance Company Customer Service Department
TABLE OF
Property Details
Custom Maps
Zoning Information
Community Information

-Demographics
-Traffic Counts
CONTENT S The information contained is provided by WFG’s Customer Service Department to our customers, and while deemed reliable, is not guaranteed.
The information contained is provided by WFG’s Customer Service Department to our customers, and while deemed reliable, is not guaranteed.
PROPERTY Property Information
Assessors Tax Map
Vesting Deed
Exhibit A
County GIS Details DETAILS
ClarkCountyPropertyProfileInformation
Parcel#:175959000
RefParcel#:
Owner:Tupikov,Sergey
CoOwner:Tupikov,Svetlana
Site:6035NWLarkspurSt
CamasWA98607-7652
Mail:2016NW7thAve
CamasWA98607-2647
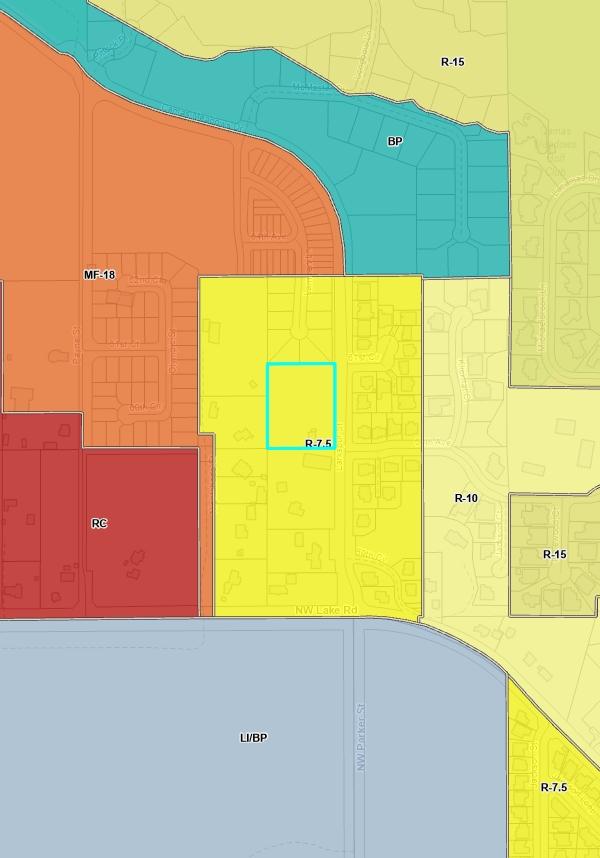
Zoning:R-75Residential-7,500(R-75)
SchoolDist:117CamasSchoolDistrict
Census:1011040608
LandUse:91UndevelopedLand
Legal:#32SEC28T2NR3EWM2.11A
ASSESSMENT&TAXINFORMATION

MarketTotal:$798,895.00
MarketLand:$798,895.00
MarketImpr:
AssessedTotal:$798,895.00
Exemption:
Taxes:$7,460.93
LevyCode:117000
LevyRate:93091
SALE&LOANINFORMATION
SaleDate:09/09/2019
SaleAmount:
Document#:5645684
DeedType:Deed
LoanAmount:
Lender:
LoanType:
InterestType:
TitleCo:SIMPLIFILELCE-RECORDING
PROPERTYCHARACTERISTICS
ParcelType:PRIMELAND
YearBuilt:1988
Bedrooms:3
Bathrooms:2
BuildingTotal:
1stFloor:1,040SqFt
2ndFloor:
AC:
BsmtFin/Unfin:/ LotSize:211Acres(91,912SqFt)
LotWidth/Depth:324/324
Garage:
HeatSource:FA
Fireplace:
ImprType:
Plat/Subdiv:
Map:539-A6
Waterfront:
Watershed:WashougalRiver
Recreation:
Latitude:45623671
Longitude:-122448155
SentryDynamics,Inc anditscustomersmakenorepresentations,warrantiesorconditions,expressorimplied,astotheaccuracyor completenessofinformationcontainedinthisreport
IMPROVEMENT1
BldgDesc:MOBILEHOME
Bedrooms:3
Baths,Full:2
Stories:1
1stFloor:1,040SqFt
2ndFloor:
Baths,3/4: YearBuilt:1988(1988)
ParcelID:175959000
Description:RANCH
Condition:AVERAGE
Use:MOBILEHOME
Quality:
Baths,1/2: BsmtFin: RoofingMatl:AL
Baths,1/4: BsmtUnfin:
Deck: BldgFinTotal:1,040SqFt
Garage:
Carport:

ExtWall:PLY AC: #Fireplaces:0
HeatType:FA
%Complete:100.00%
ParcelID:175959000
SiteAddress:6035NWLarkspurSt
SentryDynamics,Inc anditscustomersmakenorepresentations, warrantiesorconditions,expressorimplied,astotheaccuracyor completenessofinformationcontainedinthisreport
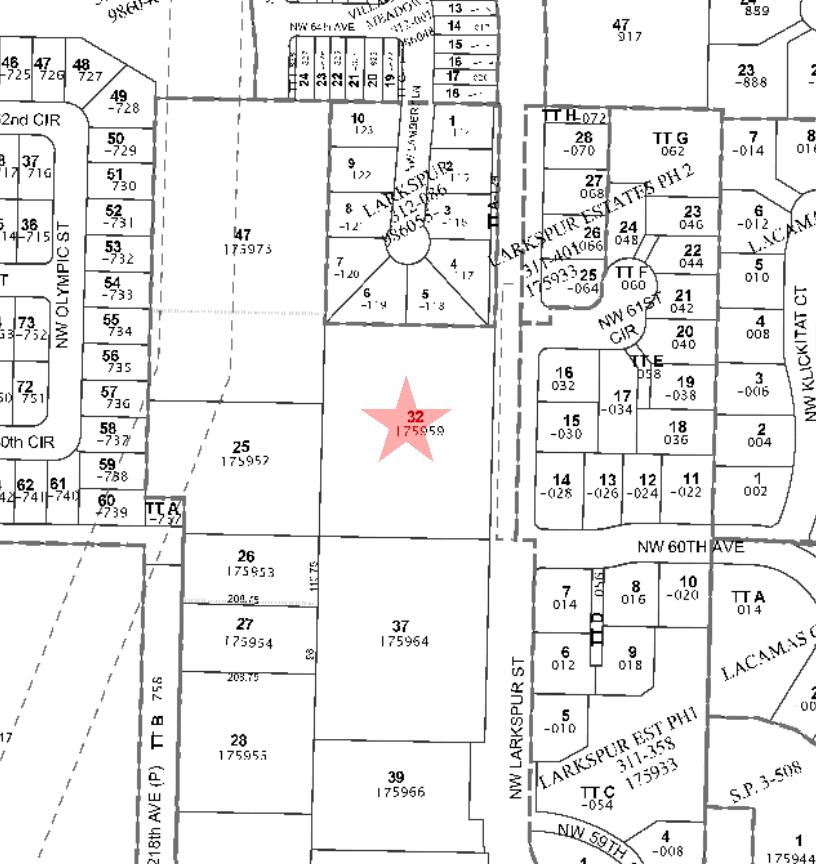
AssessorMap
ParcelID:175959000
SentryDynamics,Inc anditscustomersmakenorepresentations, warrantiesorconditions,expressorimplied,astotheaccuracyor completenessofinformationcontainedinthisreport
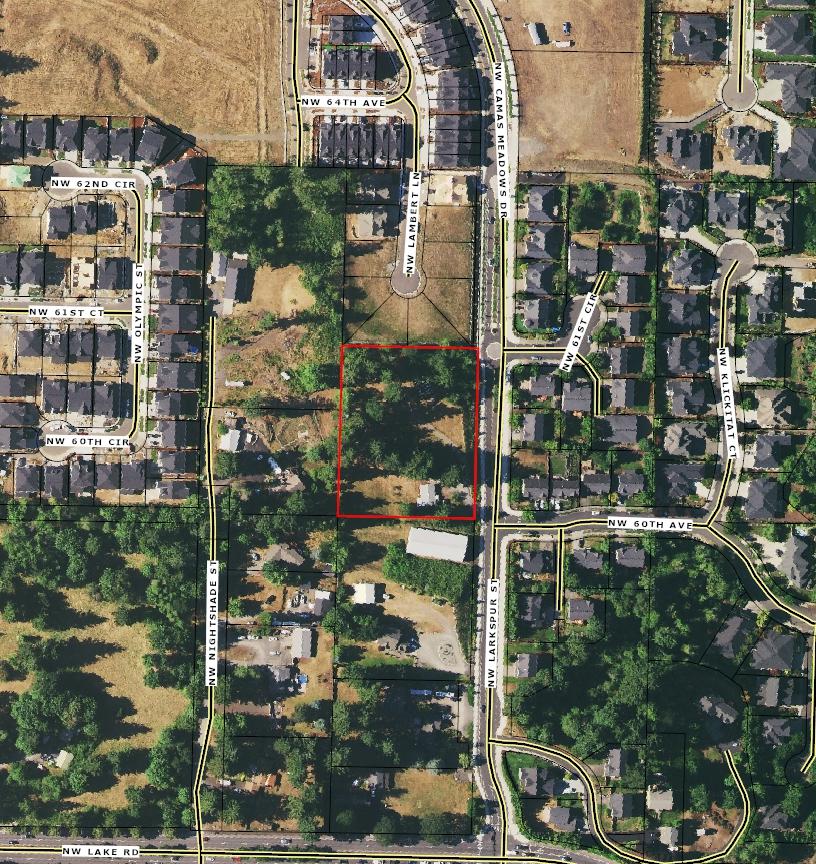
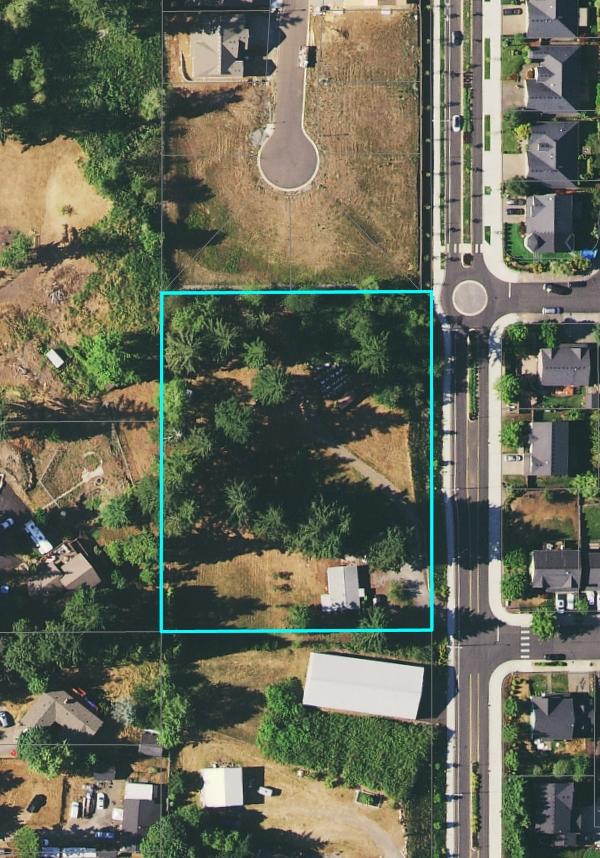
AerialMap
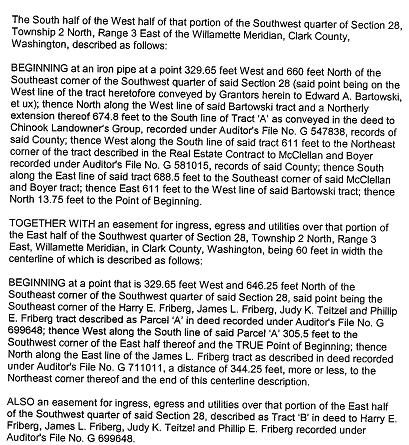
Exhibit
The real property described above is commonly known as: [__________] [__________] __________ [__________] [__________] __________ Buyer Initials Date Seller Initials Date 6035 NW Larkspur Street Camas, WA 98607
“A”
PROPERTY INFORMATION CENTER
Property Identification Number: 175959000 MapsOnline Fact Sheet
Property assessment value is valid as of the date printed on the linked notice of value. The notice of value will not reflect any updates to property value that occurred after the notice mail date Please contact the Assessor's office
Property Owner TUPIKOV SERGEY & TUPIKOV SVETLANA
Summary
Property
Property Status: Active Site Address: 6035
Abbreviated Description: #32 SEC 28 T2N R3EWM 2.11A Tax Status: Regular Info for Senior/Disabled Property Tax Exemption Owner Mailing Address 2016 NW 7TH AVE CAMAS WA , 98607 US Property Site Address 6035 NW LARKSPUR ST, CAMAS, WA 98607 Google Maps Street View Administrative Data Info... Jurisdiction Camas Land Use Planning Comprehensive Plan Designation SFM Comprehensive Plan Overlay(s) none Urban Growth Area Camas Zoning DesignationCodes Residential7,500 (R7.5) Zoning Overlay(s) none Miscellaneous Census Tract 406.08 Drainage District n/a Neighborhood n/a Park District n/a Public Safety Burning Allowed No EMS Response Area Camas Washougal Fire Fire District Camas Increased Wildfire Danger Area No Police Jurisdiction Camas Police Dept Schools School District Name Camas Elementary School Attendance Area Grass Valley Middle School Attendance Area Skyridge Middle High School Attendance Area Camas Transportation Electoral Data Board of County Councilors District 4 Camas Council Ward 2 CPU Commissioner District 2 Election Precinct 966 Legislative District 17 Library District Camas Public Library Port District Camas Port District 2 School District Board Director District Director District 3 Sewer Board District Camas State Weed Board District 2 Land Data Approximate Area Info... 91,912 sq. ft. 2.11 acres Clark County Road Atlas Page 11 DOR Land Use Code Info... 91 Section-Township-Range SW 1/4,S28,T2N,R3E PDF Subdivision no data Survey No Records Sales History Date of Sale 07/16/2004 Document Type DEED Document Number 0019177M Excise Number 999999999 Sale Amount $220,000.00 Assessment Data Info... 2022 Values for 2023 Taxes Market Value as of January 1, 2022 Land Value $798,895.00 Building Value $0.00 Total Property $798,895.00 Taxable Value Info... Total $798,895.00 2021 Values for 2022 Taxes Market Value as of January 1, 2021 Land Value $639,115.00 Building Value $0.00 Total Property $639,115.00 Taxable Value Info Total $639,115.00 General Assessor Neighborhood 74 Re-valuation Cycle 5 Notice of Value 2022 2021 2020 2019 2018 2017 2016
Account
Type: Real
NW LARKSPUR ST, CAMAS, WA 98607 (Situs Addresses)
If you have questions concerning the data on this page, please contact the Clark County Assessor’s Office. Main Phone: (564) 397-2391, Email: assessor@clark.wa.gov
C-TRAN Public Transportation Benefit Area Yes Traffic Impact Fee (TIF) District Camas Transportation Analysis Zone 653 Utilities CPU Lighting Utility District n/a Last Street Sweeping n/a Sewer District Camas Waste Collection Provider n/a Waste Collection Day No Data Water District Camas Date of Sale 07/14/2004 Document Type DEED Document Number Excise Number 546237 Sale Amount $220,000.00 Date of Sale 01/01/1900 Document Type D-DED Document Number 5645684 Excise Number 0 Sale Amount $0.00 Date of Sale 01/01/1900 Document Type D-DED Document Number 5531693 Excise Number 0 Sale Amount $0.00 if you have a question about your assessed value
PROPERTY INFORMATION CENTER
Land & Building Details
Property Identification Number: 175959000 MapsOnline Fact Sheet
Property Type: Real
Property Status: Active
Site Address: 6035 NW LARKSPUR ST, CAMAS, WA 98607 (Situs Addresses)
Abbreviated Description: #32 SEC 28 T2N R3EWM 2.11A
Tax Status: Regular
Info for Senior/Disabled Property Tax Exemption
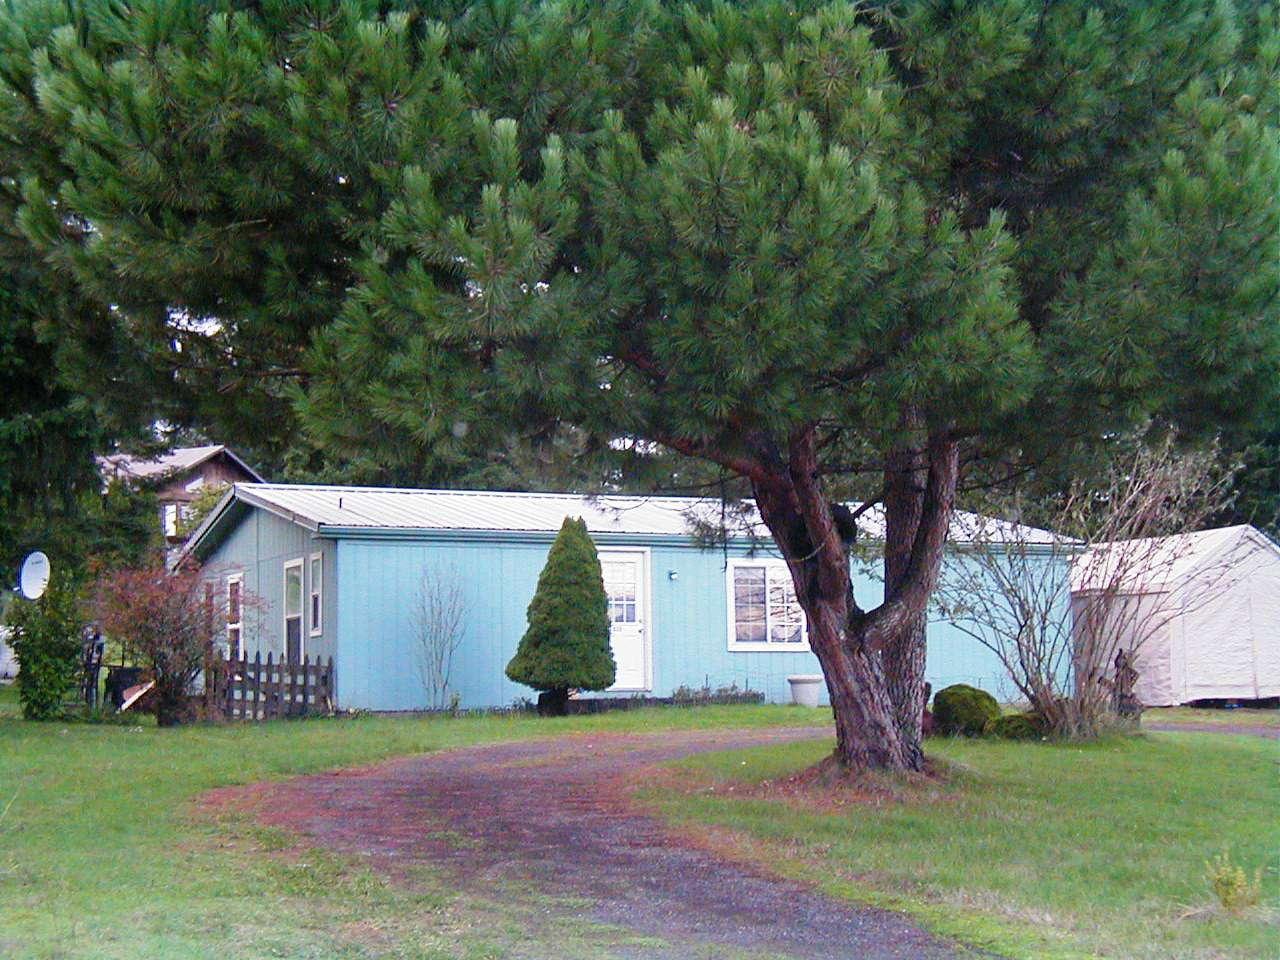
Photos & Imagery Property Photo Photo Date: 12/06/2012
Click photo for printable image
Building Sketch
No Image Available.
Scanned Building Card
If you have questions concerning the data on this page, please contact the Clark County Assessor’s Office. Main Phone: (564) 397-2391, Email: assessor@clark.wa.gov
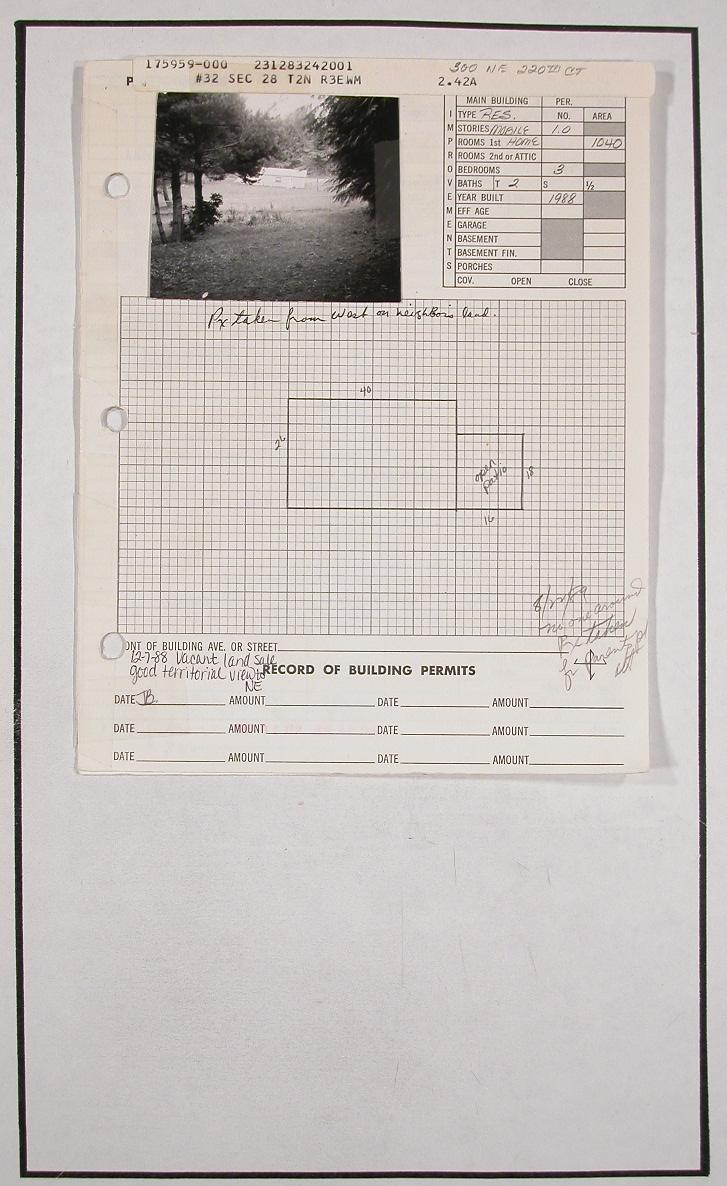
Building 1 Summary Information Building Style RANCH Number of Bedrooms 3 Number of Bedrooms Approved for Septic System no data FULL BATH 2 HEAT TYPE FA Details 1 MOBILE HOME 1040 sq. ft. Effective Year Built 1988 Actual Year Built 1988 Building Type MOBILE HOME Construction Quality FAIR Condition AVERAGE
PROPERTY INFORMATION CENTER
Environmental Constraints
Property Identification Number: 175959000 MapsOnline Fact Sheet
Property Type: Real
Property Status: Active
Site Address: 6035 NW LARKSPUR ST, CAMAS, WA 98607 (Situs Addresses)
Abbreviated Description: #32 SEC 28 T2N R3EWM 2.11A
Tax Status: Regular
Info for Senior/Disabled Property Tax Exemption
Cultural Resources
Archaeological Probability: Low-Moderate Moderate
Archaeological Site Buffer: Yes
Historic Site: No Mapping Indicators
Forest Practice Moratorium Info...
none
Geological Hazards Info...
Geological Hazard: Slopes > 15%
Liquefaction: Very Low
NEHRP Class: C
Slope Stability:
Habitat and Species Resources Info...
Habitat and Species Impacts: No Mapping Indicators
Wetlands and Soil Types
Critical Aquifer Recharge Area: Category 2 Recharge Areas
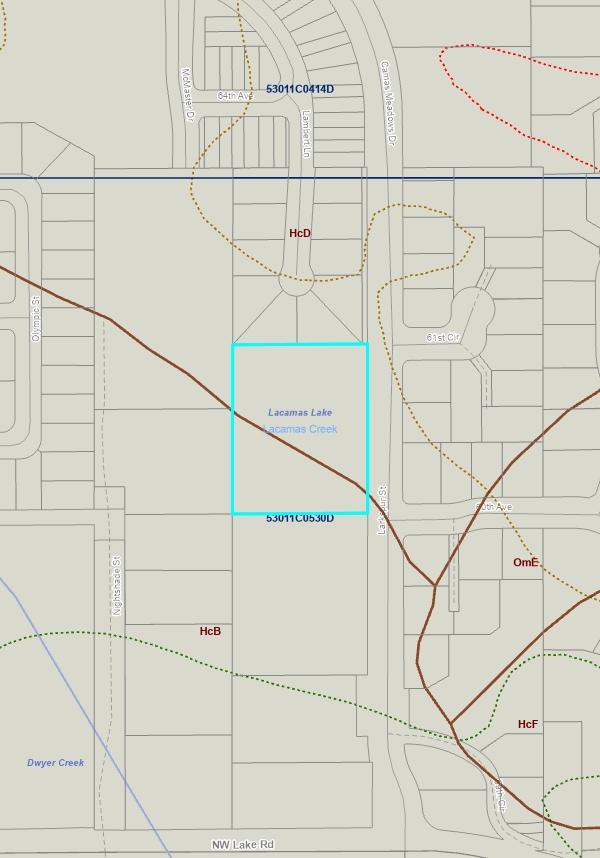
FEMA Map / FIRM Panel: Info 53011C0530D
FEMA Flood Map Service Center
Flood Hazard Area: Info... Outside Flood Area
Shoreline
Designation: none
Soil Types / Class: Non-Hydric / HcB
Non-Hydric / HcD
Water Resource Inventory Area: Name: SALMONWASHOUGAL Sub-Basin: LaCamas
Watershed: Lacamas Creek
Sub Watershed: Lacamas Lake
Wetland Class: No Mapping Indicators
Wetland Inventory: Info No Mapping Indicators
Septic Document Details
Application Date October 2, 2006
As-Built: August 15, 1989
Last Inspected August 18, 1989
Permit: February 9, 1989
Water Well Details
none
If you have any questions concerning the data on this page, please contact the land use department in your jurisdiction. For properties not within a city limits, contact Clark County Community Development. Main Phone: (564) 397-2375, Email: commdev@clark.wa.gov
PROPERTY INFORMATION CENTER
If you have any questions concerning the data on this page, please contact Clark County Treasurer's Office. Main Phone: (564) 397-2252, Email: treasoff@clark.wa.gov
Property Owner TUPIKOV SERGEY & TUPIKOV SVETLANA Other Payment Options 04/28/2023
Tax Summary Property Identification Number: 175959000 MapsOnline Fact Sheet Property Type: Real Property Status: Active Site Address: 6035 NW LARKSPUR ST, CAMAS, WA 98607 (Situs Addresses) Abbreviated Description: #32 SEC 28 T2N R3EWM 2.11A Tax Status: Regular Info for Senior/Disabled Property Tax Exemption Owner Mailing Address 2016 NW 7TH AVE CAMAS WA, 98607 Property Location Address 6035 NW LARKSPUR ST, CAMAS, WA 98607 Google Maps Street View Bing Maps Birds Eye 2023 Tax Information Pay Online Payment service fees: Free E-Check, 2.39% Credit Card, $3.95 Debit Card Tax Code Area: 117000 Millage Rate: 9.3090761894 Tax and Assessment Distribution Tax Statements Tax Bill Summary Taxable Value $798,895.00 Tax Amount $7,460.93 Tax Paid $0.00 1st Half Billed - Does not reflect payments Amount Billed $3,730.51 Payment Due Date Apr. 30, 2023 2nd Half Billed - Does not reflect payments Amount Billed $3,730.42 Payment Due Date Oct. 31, 2023 Tax Years Owing *Interest & Penalty calculates on delinquent taxes Tax Year Statement ID Amount Billed Calc Date* Interest Penalty Total Due 2023 115338 $7,460.93 $0.00 $0.00 $7,460.93 Tax History Tax Year Statement ID Billed Paid Interest Paid Penalty Paid 2023 115338 $7,460.93 $0.00 $0.00 $0.00 2022 115420 $7,142.15 $7,142.15 $0.00 $0.00 2021 115540 $7,063.27 $7,063.27 $0.00 $0.00 2020 115656 $6,924.84 $6,924.84 $0.00 $0.00 2019 115798 $5,045.53 $5,045.53 $0.00 $0.00 2018 115900 $5,434.95 $5,434.95 $0.00 $0.00 2017 115985 $5,494.18 $5,494.18 $0.00 $0.00 2016 116053 $4,604.74 $4,604.74 $0.00 $0.00 2015 116352 $2,306.34 $2,306.34 $0.00 $0.00 2014 116454 $2,190.13 $2,190.13 $0.00 $0.00 2013 116545 $2,631.12 $2,631.12 $0.00 $0.00 2012 116666 $2,604.91 $2,604.91 $0.00 $0.00 2011 116757 $3,778.36 $3,778.36 $226.66 $113.32 2010 116828 $4,286.15 $4,286.15 $42.86 $0.00 2009 116945 $4,443.12 $4,443.12 $0.00 $0.00 2008 440855 $4,277.24 $4,277.24 $0.00 $0.00 2007 279020 $2,469.13 $2,469.13 $0.00 $0.00 2006 121170 $1,975.20 $1,975.20 $0.00 $0.00
CUSTOM
Aerial
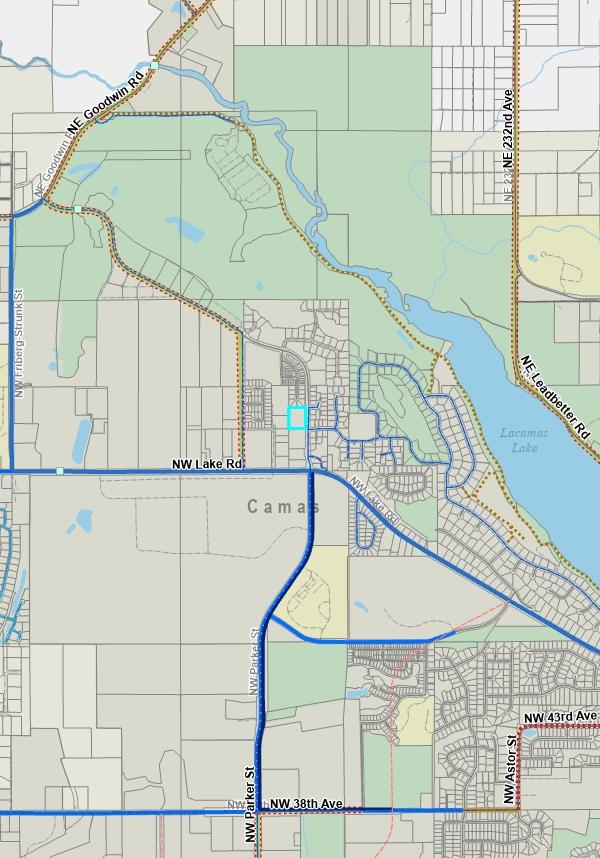
Transportation
Environmental Public Health
Slopes & Geologic Hazards
Soils, Wetlands & Natural Resources
Surveys
Utilities (Water & Sewer lines)
The information contained is provided by WFG’s Customer Service Department to our customers, and while deemed reliable, is not guaranteed.
MAPS
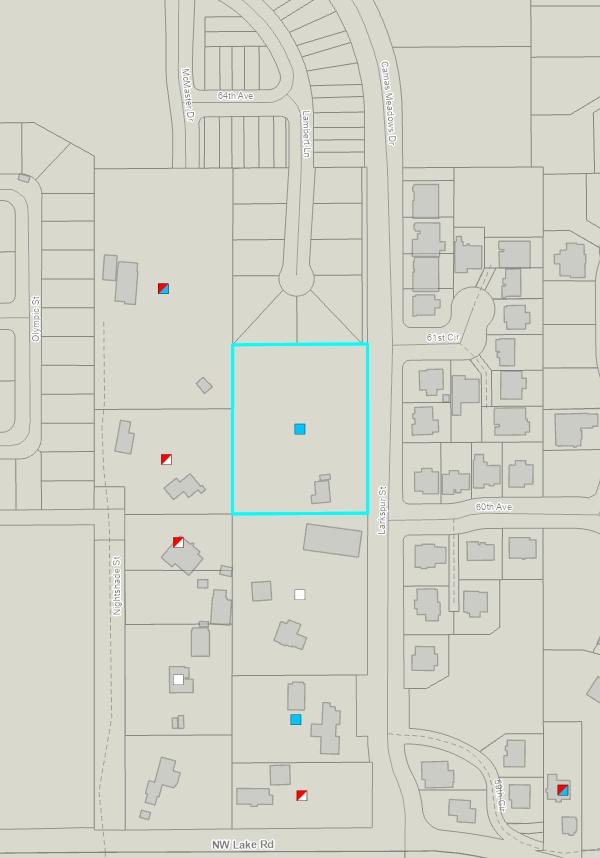
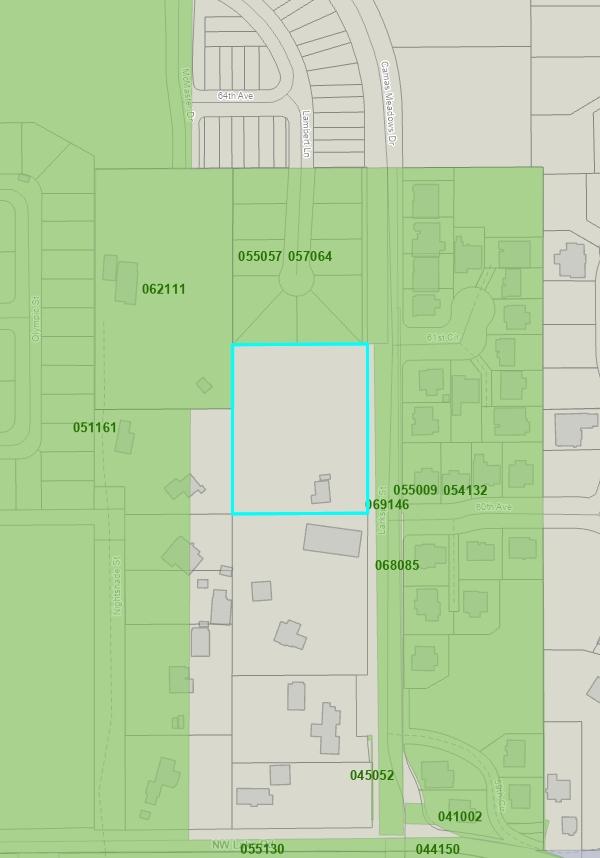
Aerial
1,128 1:
Legend Notes:

Taxlots
This map was generated by Clark County's "MapsOnline" website. Clark County does not warrant the accuracy, reliability or timeliness of any information on this map, and shall not be held liable for losses caused by using this information. Taxlot (i.e., parcel) boundaries cannot be used to determine the location of property lines on the ground.

Clark County, WA. GIS - http://gis.clark.wa.gov 188.0 WGS_1984_Web_Mercator_Auxiliary_Sphere
188.0 0 94.00
Feet
18,056
Legend Notes:
Bridge
C-Tran Bus Stop
C-Tran Facilities
C-Tran Transit Center
C-Tran Park and Ride
C-TRAN Routes
Road Route Systems State Route
Battle Ground Route
LaCenter Route
Other Municipal Route
Vancouver Route County Route
Proposed Route
Concurrency Route
Bike Routes
Bike Lanes or wide shoulders, usually on higher
Shared Roadway, on lower traffic street
Shared Roadway, with wider outside Lane on higher traffic street
Difficult Connection
Shared Roadway/Difficult Connection, lower traffic sight limitations and higher speeds
Paved Multi-use Paths, closed to motor vehicles
Unpaved Multi-use Paths, closed to motor vehicles
Cyclists Prohibited
Planned Bikeways
Main Track
All Roads
Interstate State Route Arterial
Forest Arterial
Minor Collector
Forest Collector
Private or Other
Taxlots
This map was generated by Clark County's "MapsOnline" website. Clark County does not warrant the accuracy, reliability or timeliness of any information on this map, and shall not be held liable for losses caused by using this information. Taxlot (i.e., parcel) boundaries cannot be used to determine the location of property lines on the ground.
County, WA.
3,009.3 WGS_1984_Web_Mercator_Auxiliary_Sphere Feet 3,009.3 0 1,504.67
Transportation Clark
GIS - http://gis.clark.wa.gov
1:
Environmental Public Health
Legend Notes:
This map was generated by Clark County's "MapsOnline" website. Clark County does not warrant the accuracy, reliability or timeliness of any information on this map, and shall not be held liable for losses caused by using this information. Taxlot (i.e., parcel) boundaries cannot be used to determine the location of property lines on the ground.
Clark County, WA. GIS - http://gis.clark.wa.gov 376.2 WGS_1984_Web_Mercator_Auxiliary_Sphere Feet 376.2 0 188.08
Septic System No Associated Documents Apps. and As-Builts online RME Documents Both Available Landfills Building Footprints Taxlots
2,257 1:
WGS_1984_Web_Mercator_Auxiliary_Sphere
Clark County, WA. GIS - http://gis.clark.wa.gov
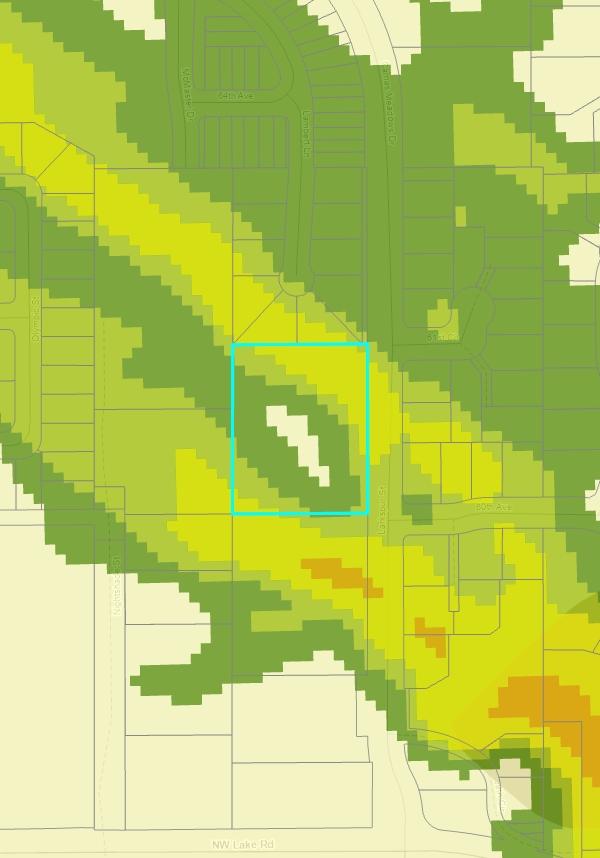
Slopes & Geological Hazards
2,257 1:
Legend
Taxlots
Percent Slope
0-5 percent
>5-10 percent
>10-15 percent
>15-25 percent
>25-40 percent
>40-80 percent
>80 percent
Severe Erosion Hazard Areas
Steep Slopes and Landslide Hazard Areas
Areas of Historic or Active Landslides
Areas of Potential Instability
Areas of Older Landslide Debris
Slopes > 15%
Slopes > 25%
Notes:
This map was generated by Clark County's "MapsOnline" website. Clark County does not warrant the accuracy, reliability or timeliness of any information on this map, and shall not be held liable for losses caused by using this information. Taxlot (i.e., parcel) boundaries cannot be used to determine the location of property lines on the ground.
376.2
376.2 0 188.08
Feet
Soils, Wetlands & Natural Resources
2,257 1:
Legend
Taxlots
FIRM Panels
Base Flood Elevation
Flood Zone Designation Floodway
Floodway Fringe
500 Year Flood Area
Area Not Studied
Soil Type
Permitted Wetland
NWI Wetland
Modeled Wetland
Depth to Water 10 ft 20 ft 30 ft
Watershed
Sub-Watershed
Notes:
This map was generated by Clark County's "MapsOnline" website. Clark County does not warrant the accuracy, reliability or timeliness of any information on this map, and shall not be held liable for losses caused by using this information. Taxlot (i.e., parcel) boundaries cannot be used to determine the location of property lines on the ground.
376.2
Feet 376.2 0 188.08
Clark County, WA. GIS - http://gis.clark.wa.gov
WGS_1984_Web_Mercator_Auxiliary_Sphere
Surveys
2,257 1:
Legend Notes:
Survey - Recorded
Survey - Unrecorded
Survey - Performed by County Building Footprints Taxlots
This map was generated by Clark County's "MapsOnline" website. Clark County does not warrant the accuracy, reliability or timeliness of any information on this map, and shall not be held liable for losses caused by using this information. Taxlot (i.e., parcel) boundaries cannot be used to determine the location of property lines on the ground.
Clark County, WA. GIS - http://gis.clark.wa.gov 376.2 WGS_1984_Web_Mercator_Auxiliary_Sphere Feet 376.2 0 188.08
Utilities
2,257 1:
Legend Notes:
Sanitary Sewer Water Line
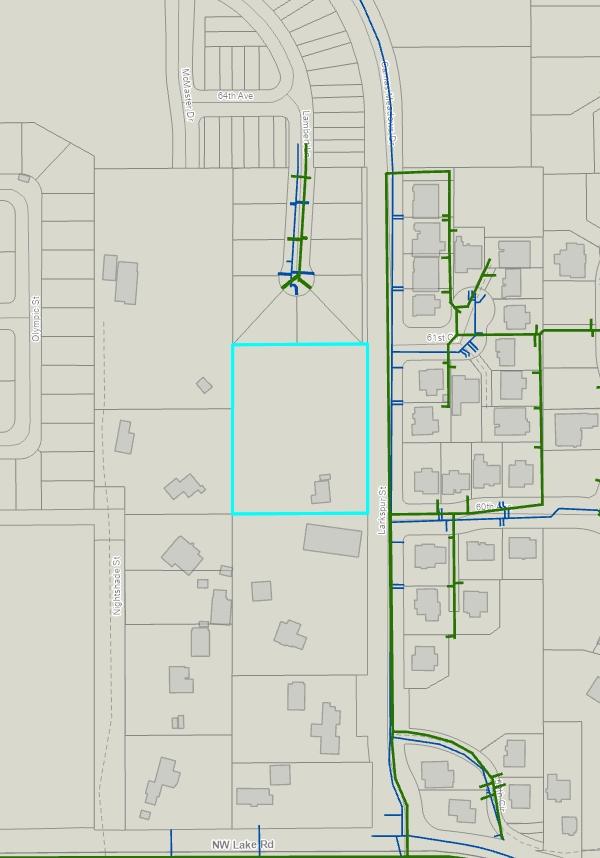
Building Footprints
Taxlots
This map was generated by Clark County's "MapsOnline" website. Clark County does not warrant the accuracy, reliability or timeliness of any information on this map, and shall not be held liable for losses caused by using this information. Taxlot (i.e., parcel) boundaries cannot be used to determine the location of property lines on the ground.
Clark County, WA. GIS - http://gis.clark.wa.gov 376.2 WGS_1984_Web_Mercator_Auxiliary_Sphere Feet 376.2 0 188.08
ZONING
The information contained is provided by WFG’s Customer Service Department to our customers, and while deemed reliable, is not guaranteed.
Zoning Map Detailed Zoning
7.5 (Residential
7,500)
Information R-
-
DETAILS
Zoning
4,514 1:
Legend Notes:
Zoning - Outline
Zoning - Outline_labels Zoning
Single-Family residential (R1-20, R-20)
Single-Family residential (R1-15, R-15)
Single-Family residential - 12 (R-12)
Single-Family residential (R1-10, R-10, R10)
Single-Family residential (R1-7.5, R-7.5, LDR-7.5)
Single-Family residential (R1-6, R-6, LDR-6)
Single-Family residential (R1-5)
Residential (R-12, R12)
Residential (R-18, MF-18)
Residential (R-22, AR-22)
Residential (R-30)
Residential (R-43)
Office residential-15 (OR-15)
Office residential-18 (OR-18)
Office residential-22 (OR-22)
Office residential-30 (OR-30)
Office residential-43 (OR-43)
Neighborhood commercial (NC, C1, CN, CNB)
Community commercial (CC, C2, CCB)
General commercial (GC, CG)
Mixed use (MX)
Business park (BP, OFF)
Light industrial (IL, ML, LI, IND, LI/EC, WE)
Heavy industrial (IH, MH, HI) University (U)
Airport (A)
Public facilities (PF, IP, UP)
Rural-5 (R-5)
Rural-10 (R-10)
Rural-20 (R-20)
Rural center residential 1 ac min (RC-1)
Rural center residential 2.5 ac min (RC-2.5)
Rural comm.-inside rur.centers (CR-2)
Rural comm.-outside rur.center (CR-1)
Agriculture-20 (AG-20)
Agriculture/Wildlife (AG/WL)
Parks/Open Space (P/OS)
Parks/Wildlife refuge (P/WL)
Forest tier II-40 (FR-40)
Forest-80 (FR-80)
Water
Low density residential-2 du/ac (R-2)
Residential 3 units/acre (R3)
Single-family residential (R1-12.5)
This map was generated by Clark County's "MapsOnline" website. Clark County does not warrant the accuracy, reliability or timeliness of any information on this map, and shall not be held liable for losses caused by using this information. Taxlot (i.e., parcel) boundaries cannot be used to determine the location of property lines on the ground.

Low density residential-4 du/ac (R-4, RLD-4)
Clark County, WA. GIS - http://gis.clark.wa.gov 752.3 WGS_1984_Web_Mercator_Auxiliary_Sphere Feet 752.3 0 376.17
maps administration
This title shall consist of the text titled the "City of Camas Zoning Code," and that certain map or books of maps identified by the approving signatures of the mayor and the city clerk, and marked and designated as "The Zoning Map of the City of Camas," which map or book of maps shall be placed on file in the offices of the city clerk, county auditor, and other city departments This title, and each and all of its terms and map details, is to be interpreted in light of the context of the book of maps in relationship to the comprehensive plan In any conflict between the maps and the text of this code the text shall prevail.
Zoning Text and Map Amendments. Amendments may be proposed by city council or by the planning commission on its own motion, or such an amendment may be proposed by an applicant or city staff pursuant to CMC Chapter 18.51 Comprehensive Plan and Zoning Amendments
Administration and Procedures. A correct copy of each amendment to the text or to the map established by this title shall be maintained on file in the offices of the city clerk and the planning official.
Site Specific Rezones A site specific rezone involves an application of an owner of a specific parcel or set of contiguous parcels that does not require modification of the comprehensive plan.
Site specific rezones are decided by the hearing officer after a public hearing. The criteria for reviewing and approving a site specific rezone are as follows:
The use or change in zoning requested shall be in conformity with the adopted comprehensive plan, the provisions of this title, and the public interest
The proposed zone change shall be compatible with the existing established development pattern of the surrounding area in terms of lot sizes, densities and uses
Timing and Responsibility for Updating Official Zoning Map. All amendments hereafter made to the zoning map by ordinance shall be shown on such map(s), and it shall be the responsibility of the planning official to keep the maps up to date at all times. Any amendments to the zoning map shall be made in accordance with the comprehensive plan map, as amended.
(Ord 2515 § 1 (Exh A (part)), 2008: Ord 2443 § 3 (Exh A (part)), 2006)
(Ord. No. 2612, § I(Exh. A), 2-7-2011; Ord. No. 2691, § I(Exh. A), 1-21-2014 ; Ord. No. 17-013 , § I(Exh. A), 10-22017)
18.05.020 - Districts designated.
For the purposes of the Code, the city is divided into zoning districts designated as follows:
A
D
18 05 010 -
B. C.
1. 2. E.
Zoning
District Symbol Comprehensive Plan Designation Residential 15,000 R-15 Single-family Low Residential 12,000 R-12 Single-family Medium Residential 10,000 R-10 Single-family Medium Residential 7,500 R-7.5 Single-family Medium Residential 6,000 R-6 Single-family High Multifamily-10 MF-10 Multifamily Low Multifamily-18 MF-18 Multifamily High Multifamily Cottage MF-C Overlay Neighborhood Commercial NC Commercial Community Commercial CC Commercial Regional Commercial RC Commercial Mixed Use MX Commercial Downtown Commercial DC Commercial Light Industrial LI Industrial Heavy Industrial HI Industrial Business Park BP Industrial Light Industrial/Business Park LI/BP Industrial
Special Use Park SU Park
(Ord. 2515 § 1 (Exh. A (part)), 2008: Ord. 2443 § 3 (Exh. A (part)), 2006)
(Ord. No. 2547, § II(Exh. B), 5-18-2009; Ord. No. 2667, § I, 12-17-2012 ; Ord. No. 2672, § I(Exh. A), 1-22-2013 ; Ord No 2691, § I(Exh A), 1-21-2014 ; Ord No 2694, § I, 2-3-2014 ; Ord No 17-013 , § I(Exh A), 10-2-2017)
18 05 030 - Boundary determination
Unless otherwise specified or shown on the zoning map, district boundaries are lot lines or the centerlines of streets, alleys, railroad, and other rights-of-way:
Where boundaries are other than lot lines or centerlines of streets, alleys, railroad, and other rights-of-way, they shall be determined by dimensions shown on the zoning map;
Where actual streets or other features on the ground vary from those shown on the zoning map, interpretations or adjustments shall be made by the planning commission;
Where a district boundary line, as shown on the zoning map, divides a lot in single ownership at the time of passage of the code, the zoning district classification that has been applied to greater than fifty percent of such lot shall apply (Ord. 2515 § 1 (Exh. A (part)), 2008: Ord. 2443 § 3 (Exh. A (part)), 2006)
18.05.040 - Residential and multifamily zones.
R-15 Residential-15,000. This zone is intended for single-family dwellings with a minimum density of two to three dwellings per acre. This zone will permit the rural character of a number of existing neighborhoods to be maintained The average lot size is fifteen thousand square feet
R-12 Residential-12,000. This zone is intended for single-family dwellings with densities of three to four dwelling units per acre This zone is designated for areas with steep topography for greater flexibility in site layout, and where potential hazards do not exist. The average lot size is twelve thousand square feet.
R-10 Residential-10,000. This zone is intended for single-family dwellings with densities of four to five dwellings per acre. This zone is intended to be zoned near low density residential districts, and where potential natural hazards do not exist The average lot size is ten thousand square feet.
A. B. C A. B.
NP
C. Neighborhood Park
Park
Open space/Green space OS Open space I Green space
R-7 5 Residential-7,500 This zone is intended for single-family dwellings with densities of five to six dwellings per acre. This zone should have less slope than lower density zones, and be adjacent to existing high density residential districts. The average lot size is seven thousand five hundred square feet
R-6 Residential-6,000. This zone is intended for single-family dwellings with densities of six to seven dwellings per acre The slope of property is less than other lower density residential zones This zone serves a transition to multifamily or commercial zones. The average lot size is six thousand square feet.
MF-10 Multifamily Residential. This zone provides for a diversity of dwellings such as duplexes, triplexes, fourplexes, rowhouses, and apartment complexes, with a density of up to ten units per acre It is desirable for this zone to be adjacent to parks and multi-modal transportation systems This zone can also serve as a transition between commercial and residential zones.
MF-18 Multifamily Residential These zones are intended to provide for dwellings such as rowhouses and apartment complexes. It is desirable for these zones to be adjacent to parks and multi-modal transportation systems. These zones also serve as a transition between commercial and residential zones.
MF-C Cottage. This is an overlay zone, which is intended to increase the housing supply and style choices for smaller, single-level dwellings It is desirable that cottages are designed to include unique architectural elements such as a front porch, steep-pitch gable roof, and a recessed garage; and to accommodate those with mobility impairments This overlay zone may be utilized within multi-family zones only, and upon approval of a zoning district change.
(Ord 2515 § 1 (Exh A (part)), 2008: Ord 2443 § 3 (Exh A (part)), 2006)
( Ord No 2691, § I(Exh A), 1-21-2014 ; Ord No 2694, § II, 2-3-2014 ; Ord No 17-013 , § I(Exh A), 10-2-2017)
18
07 010 - Establishment of uses
The use of a property is defined by the activity for which the building or lot is intended, designed, arranged, occupied or maintained. The use is considered permanently established when that use will, or has been, in continuous operation for a period exceeding sixty days. A use which will operate for less than one hundred eighty days is considered a temporary use, and shall be governed by Chapter 18 47 "Temporary Use Permits." All applicable requirements of this code, or other applicable state or federal requirements, shall govern a use located in the city
(Ord. 2515 § 1 (Exh. A (part)), 2008: Ord. 2443 § 3 (Exh. A (part)), 2006)
18.07.020 - Interpretation of land use tables.
D E.
G
F.
H.
The land use tables in this chapter determine whether a specific use is allowed in a zone district. The zone district is located on the vertical column and the specific use is located on the horizontal rows of these tables.
If the letter "X" appears in the box at the intersection of the column and the row, the use is not allowed in that district, except for certain temporary uses.
If the letter "P" appears in the box at the intersection of the column and the row, the use is allowed in that district subject to review procedures in accordance with CMC Chapter 18.55 "Administration and Procedures "
If the letter "C" appears in the box at the intersection of the column and the row, the use is allowed subject to the conditional use review procedures specified in Chapter 18 43 "Conditional Use Permits," and the general requirements of the Camas Municipal Code.
If the letter "T" appears in the box at the intersection of the row, the use is temporarily permitted under the procedures of Chapter 18.47 "Temporary Use Permits." Other temporary uses not listed may be authorized as provided in Chapter 18.47.
If a number appears in a box at the intersection of the column and the row, the use is subject to the requirements specified in the note corresponding with the number immediately following the table
Uses accessory to a use permitted or conditionally permitted in any zone may be authorized subject only to those criteria and/or processes deemed applicable by the head of the planning department.
If a use is not listed under either Section 18 07 030 Table 1 or 18 07 040 Table 2, and is not an accessory or temporary use, then the use shall be subject to a zoning code text amendment. Notwithstanding a zoning code text amendment, the community development director may determine whether a proposed land use not specifically listed in a land use table is allowed in a zone. The director shall take into consideration the following when making a determination:
Whether or not the proposed use in a particular zone is similar impact to other permitted or conditional uses or is compatible with other uses; and
Whether or not the proposed use is consistent with the zone's purpose
A use listed in one table but not the other shall be considered a prohibited use in the latter.
(Ord. 2515 § 1 (Exh. A (part)), 2008: Ord. 2443 § 3 (Exh. A (part)), 2006)
(Ord. No. 2612, § I(Exh. A), 2-7-2011; Ord. No. 2691, § I(Exh. A), 1-21-2014 ; Ord. No. 17-013 , § I(Exh. A), 10-22017)
18.07.040 - Table 2 Residential and multifamily land uses.
A. B. C. D E. F. G 1 2
KEY: P = Permitted Use C = Conditional Use X = Prohibited Use T = Temporary Use Authorized Uses in Residential and Multifamily Zones R MF Residential Uses Adult family home, residential care facility, supported living arrangement, or housing for the disabled P P Apartments P P Assisted living , retirement home C P Designated manufactured homes P P Duplex or two-family dwelling C P Manufactured home X X Manufactured home park X C Nursing, rest, convalescent home C P Permanent Supportive Housing C/P P Residential attached housing for three or more units (e.g., rowhouses) X/P P Residential Treatment Facility X C Single-family dwelling (detached) P P Sober Living Homes P P 1 2 1 1 1 2 2 5
Transitional Housing P P Incidental Uses Accessory dwelling unit P P Animal training, kennel, boarding X C Day care center C P Day care, family home P P Day care, minicenter C P Electric vehicle battery charging station and rapid charging stations P P Gardening and horticulture activities P P Home occupation P P Bed and breakfast C C Recreation/Religious/Cultural Church C C Community clubs, private or public C C Library C C Museum C C Open space P P Public or semi-public building C C Park or playground P P 1 1 1 1 1 1 1 1 1
1. See Chapter 18.19 "Design Review" for additional regulations.
2. Permitted in the R zones as part of a planned development only.
3. Site plan review required per CMC Section 18.18.020(A)(1).
Sports �elds C C Trails P P Educational Uses Private, public or parochial school C C Trade, technical, business college X C College/university X X Communication and Utilities Wireless communication facility Refer to Chapter 18.35 Facilities, minor public C C Public utilities, minor C C Pumping station C C Railroad tracks and facilities 1 C C Temporary Uses Sales o�ce for a development in a dwelling T T Sales o�ce for
in a trailer T T
a development
Notes:
1 1 1 1 1 1, 4 3, 4
4 Notwithstanding the time limitations of a temporary use, a sales office proposed and approved through a Type III application may be approved with a longer time frame than one hundred eighty days.
5. A Residential Treatment Facility shall not be located within one thousand feet of public and private schools, public parks, public libraries, other RTFs, or similar uses
(Ord 2515 § 1 (Exh A (part)), 2008: Ord 2481 § 1 (Exh A (part)), 2007; Ord 2443 § 3 (Exh A (part)), 2006)
(Ord No 2612, § I(Exh A), 2-7-2011; Ord No 2691, § I(Exh A), 1-21-2014 ; Ord No 17-013 , § I(Exh A), 10-22017; Ord. No. 21-004 , § II(Exh. A), 3-15-2021; Ord. No. 21-005 , § I(Exh. A), 3-15-2021; Ord. No. 22-007 , § I, 5-16-2022)
18.09.010
- Purpose.
The purpose of this chapter is to establish requirements for development relative to basic dimensional standards, as well as specific rules for general application. The standards and rules are established to provide flexibility in project design, maintain privacy between adjacent land uses, and promote public safety Supplementary provisions are included to govern density calculations for residential districts and specific deviations from general rules.
(Ord. 2515 § 1 (Exh. A (part)), 2008: Ord. 2443 § 3 (Exh. A (part)), 2006)
18 09 020 - Interpretation of tables
The Camas Municipal Code Sections 18 09 030 through 18 09 050 (Tables) contain general density and dimension standards of the particular zone districts. Additional rules and exceptions are stated in Sections 18.09.060 through 18.09.180.
The density and dimension tables are arranged in a matrix format on three separate tables, and are delineated into three general land use categories:
Commercial and industrial; Single-family residential; and Multifamily residential.
Development standards are listed down the left side of the tables, and the zones are listed across the top. Each cell contains the minimum or maximum requirement of the zone. Footnote numbers identify specific requirements found in the notes immediately following the table. Additional dimensional and density exceptions are included in Sections 18 09 060 through 18.09.180 of this chapter following the tables.
(Ord 2515 § 1 (Exh A (part)), 2008: Ord 2443 § 3 (Exh A (part)), 2006)
A B. 1. 2. 3. C
and dimensions
residential zones
A. Standard New Lots
B. Density Transfer Lots
18 09 040
R-6 R-7.5 R-10 R-12 R-15
- Density
Single-family
Table 1 Density and Dimensions for Single-family Residential Zones
Maximum density (dwelling units/net acre) 7.2 5.8 4.3 3.6 2.9 Average lot area (square feet) 6,000 7,500 10,000 12,000 15,000 Minimum lot size (square feet) 4,800 6,000 8,000 9,600 12,000 Maximum lot size (square feet) 9,000 12,000 14,000 18,000 24,000 Minimum lot width (feet) 60 70 80 90 100 Minimum lot depth (feet) 80 90 100 100 100 Maximum building lot coverage 40% 40% 35% 30% 30% Maximum building height (feet) 35 35 35 35 35
Maximum density (dwelling units/net acre 7.2 5.8 4.3 3.6 2.9 Minimum lot size (square feet) 4,200 5,250 7,000 8,400 10,500 Maximum lot size (square feet) 7,200 9,000 12,000 14,400 18,000 Minimum lot width (feet) 50 60 60 70 80 Minimum lot depth (feet) 80 80 90 90 100 1 4 3 5 2 1 3 1 1
Maximum building lot coverage 40% 40% 40% 35% 35%
Maximum building height (feet) 35 35 35 35 35
Notes:
1. For additional density and dimension provisions, see CMC Sections 18.09.060 through 18.09.180.
2. Maximum building height: three stories and a basement, not to exceed height listed.
3. For parcels with an existing dwelling, a one-time exception may be allowed to partition from the parent parcel a lot that exceeds the maximum lot size permitted in the underlying zone Any further partitioning of the parent parcel or the oversized lot must comply with the lot size requirements of the underlying zone.
4. Average lot area is based on the square footage of all lots within the development or plat. The average lot size may vary from the stated standard by no more than five hundred square feet
5 The maximum building lot coverage for single-story homes may be up to forty-five percent in R-6 and R-7.5 zones, and forty percent in R-10 and R-12 zones. To qualify for increased lot coverage, a single-story home cannot include a basement or additional levels.
Lot Area Up to 4,999 sq. ft. 5,000 to 11,999 sq. ft. 12,000 to 14,999 sq. ft. 15,000 or more sq. ft. Minimum front yard (feet) 20 20 25 30 Minimum side yard (feet) 5 5 10 15 Minimum side yard �anking a street and corner lot rear yard (feet) 10 10 15 15 Minimum rear yard (feet) 20 25 30 35 Minimum lot frontage on a cul-de-sac or curve (feet) 25 30 35 40 2 1 2
Table 2—Building Setbacks for Single-Family Residential Zones
Note:
1. Setbacks may be reduced to be consistent with the lot sizes of the development in which it is located. Notwithstanding the setbacks requirements of this chapter, setbacks and/or building envelopes clearly established on an approved plat or development shall be applicable.
2 Garage setback is five feet behind the front of the dwelling
(Ord 2515 § 1 (Exh A (part)), 2008: Ord 2443 § 3 (Exh A (part)), 2006)
(Ord No 2612, § I(Exh A), 2-7-2011; Ord No 15-010 , § I, 8-17-2015; Ord No 17-013 , § I(Exh A), 10-2-2017;
Ord. No. 19-012, § II(Exh. A), 11-4-2019 ; Ord. No. 21-005 , § I(Exh. A), 3-15-2021)
18.09.060 - Density transfers.
Purpose. To achieve the density goals of the comprehensive plan with respect to the urban area, while preserving environmentally sensitive lands and the livability of the single-family residential neighborhoods, while also maintaining compatibility with existing residences.
Scope. This section shall apply to new development in all residential (R) zoning districts. Where a land division proposes to set aside a tract for the protection of a critical area, natural open space network, or network connector (identified in the city of Camas parks plan), or approved as a recreational area, lots proposed within the development may utilize the density transfer standards under CMC Section 18.09.040.B Table-1. Where a tract under "C" above, includes one-half acre or more of contiguous area, the city may provide additional or negotiated flexibility to the lot size, lot width, lot depth, building setback, or lot coverage standards under CMC Section 18.09.040 Table 1 and 2. In no case shall the maximum density of the overall site be exceeded A letter explaining the request for negotiated flexibility shall be submitted to the director for consideration. The city may also provide the landowner with:
A credit against park and open space impact fees per Chapter 3.88; or Cash from the parks and open space impact fee fund or other public fund (Ord. 2515 § 1 (Exh. A (part)), 2008: Ord. 2443 § 3 (Exh. A (part)), 2006)
( Ord. No. 18-014, § XII, 9-4-2018 ; Ord. No. 19-001 , § I(Att. A), 1-22-2019; Ord. No. 21-005 , § I(Exh. A), 3-152021)
18.09.080 - Lot sizes.
A. B. C. D 1. 2
In planned residential developments with sensitive lands and the required recreational open space set aside, a twenty per-cent density bonus on a unit count basis is permitted Density may be transferred for sensitive areas but the total lot count shall never exceed the number of lots established in the density standards established in CMC Section 18.23.040 "Density Standards." When creating new lots via short plats or subdivisions that are adjacent to a different residential zone designation, the new lots along that common boundary shall be the maximum lot size allowed for the zone designation of the new development (if a lower density adjacent zone), or the minimum lot size allowed for the zone designation of the new development (if a greater density adjacent zone), as based on CMC 18.09.040 Table 2, Section A. In applying this section, where a land division is required to increase the size of lots, the land division may utilize the density transfer provisions provided for in CMC Section 18.09.060.
For residentially zoned parcels owned or controlled by a religious organization, a twenty percent density bonus to the dwelling unit maximum (Refer to Sections 18.09.040 and 18.09.050) is permitted for the development of affordable housing, when the following criteria are met:
Affordable housing is for low-income households. "Low-income household" means a single person, family, or unrelated persons living together whose adjusted income is less than eighty percent of the median family income, adjusted for household size for Clark County;
A lease or other binding obligation shall require development to be used exclusively for affordable housing purposes for at least fifty years, even if the religious organization no longer owns the property; and
Does not discriminate against any person who qualifies as a member of a low-income household.
(Ord 2515 § 1 (Exh A (part)), 2008: Ord 2443 § 3 (Exh A (part)), 2006)
(Ord No 2612, § I(Exh A), 2-7-2011; Ord No 21-004 , § II(Exh A), 3-15-2021)
18.09.090 - Reduction prohibited.
No lot area, yard, open space, off-street parking area, or loading area existing after the effective date of the ordinance codified in this chapter shall be reduced below the minimum standards required by the ordinance codified in this chapter, nor used as another use, except as provided in Chapter 18.41
"Nonconforming Lots, Structures, Uses "
(Ord 2515 § 1 (Exh A (part)), 2008: Ord 2443 § 3 (Exh A (part)), 2006)
18.09.100 - Lot exception.
A. B. C
1.
2. 3
If at the time of passage of the code, a lot has an area or dimension which does not conform with the density provisions of the zoning district in which it is located, the lot may be occupied by any use permitted outright in the district, subject to the other requirements of the district. The person claiming benefits under this section shall submit documentary proof of the fact that the lot existed by title at the time of passage of the code. See Section 18.41.040 "Buildable lot of record."
(Ord 2515 § 1 (Exh A (part)), 2008: Ord 2443 § 3 (Exh A (part)), 2006)
18.09.110 - Height Exception.
The following type of structures or structural parts are not subject to the building height limitations of the code: tanks, church spires, belfries, domes, monuments, fire and hose towers, observation towers, transmission towers, wind turbines, chimneys, flag poles (see setbacks at CMC Section 18.09130(G)), radio and television towers, masts, aerials, cooling towers, and other similar structures or facilities The heights of telecommunication facilities are addressed in CMC Chapter 18.35 Telecommunication Ordinance.
(Ord. 2515 § 1 (Exh. A (part)), 2008: Ord. 2443 § 3 (Exh. A (part)), 2006)
(Ord. No. 2612, § I(Exh. A), 2-7-2011; Ord. No. 2691, § I(Exh. A), 1-21-2014 )
18 09 120 - Roof overhang permitted
The maximum a roof overhang may intrude into yard setbacks shall be as follows:
(Ord 2515 § 1 (Exh A (part)), 2008: Ord 2443 § 3 (Exh A (part)), 2006)
18.09.130 - Setback Exception.
Yard Setback Maximum Roof Overhang 5 feet 2 feet 10 feet 3.5 feet 15 feet 5 feet 15 feet or greater 5 feet
Cornices, eaves, chimneys, belt courses, leaders, sills, pilasters, or other similar architectural or ornamental features (not including bay windows or vertical projections) may extend or project into a required yard not more than two feet.
Open balconies, unenclosed fire escapes, or stairways, not covered by a roof or canopy, may extend or project into a required front yard, or a required rear yard along a flanking street of a corner lot, or into a required side yard not more than three feet.
Open, unenclosed patios, terraces, roadways, courtyards, or similar surfaced areas, not covered by a roof or canopy, and not more than thirty inches from the finished ground surface, may occupy, extend, or project into a required yard
Cantilevered floors, bay windows, or similar architectural projections, not wider than twelve feet, may extend or project into the required side yard along a flanking street of a corner lot not more than two feet. The total of all projections for each building elevation shall not exceed fifty percent of each building elevation.
Detached accessory buildings or structures may be established in a side or rear yard, provided such structure maintains a minimum setback of five feet from side and rear lot lines, and a minimum six feet setback from any building In no event shall an accessory building(s) occupy more than thirty percent of a rear yard requirement. For accessory dwelling units, see Chapter 18.27.
On sloping lots greater than fifty percent, only uncovered stairways and wheelchair ramps that lead to the front door of a building may extend or project into the required front yard setback no more than five feet in any R or MF zone
Flag poles may be placed within any required yard but shall maintain a five-foot setback from any lot line
(Ord. 2515 § 1 (Exh. A (part)), 2008: Ord. 2443 § 3 (Exh. A (part)), 2006)
(Ord. No. 2612, § I(Exh. A), 2-7-2011; Ord. No. 2691, § I(Exh. A), 1-21-2014 )
18.09.140
- Front yard Exception.
Commercial and Industrial Districts. For a lot in a NC, CC, RC, LI or HI district proposed for commercial or industrial development, which is across a street from a residential (R) zone, the yard setback from the street shall be fifteen feet.
B.
Sloping Lot in Any Zone. If the natural gradient of a lot from front to rear along the lot depth line exceeds an average of twenty percent, the front yard may be reduced by one foot for each two percent gradient over twenty percent. In no case under the provisions of this subsection shall the setback be less than ten feet. The front of a garage shall not be closer than eighteen feet from the back of the sidewalk.
B
A.
C. D. E.
F.
G.
A.
(Ord 2515 § 1 (Exh A (part)), 2008: Ord 2443 § 3 (Exh A (part)), 2006)
(
Ord No 17-013 , § I(Exh A), 10-2-2017)
18 09 150 - Side yard Exception
For a lot in a NC, CC or RC district containing a use other than a dwelling structure, and adjoining a residential zoning district, minimum side yard along a side lot line adjoining a lot in a residential zoning district shall be fifteen feet In the case of a lot in a LI or HI district the side yard setbacks shall be twenty feet. If the adjoining residential district is within an area shown in the comprehensive plan for future commercial or industrial use or expansion, no minimum side yard shall be required.
(Ord. 2515 § 1 (Exh. A (part)), 2008: Ord. 2443 § 3 (Exh. A (part)), 2006)
18.09.160 - Side yard Flanking street.
For a corner lot in a NC, CC, RC, LI or HI district proposed for commercial or industrial development, which is across a street from a residential (R) zone, the yard setback from the street shall be fifteen feet.
(Ord. 2515 § 1 (Exh. A (part)), 2008: Ord. 2443 § 3 (Exh. A (part)), 2006)
18.09.170 - Rear yard Exception.
For a lot in a NC, CC or RC district containing a use other than a dwelling structure and adjoining a residential zoning district, minimum rear yard along a rear lot line adjoining a side or rear yard of a lot in a residential zoning district shall be fifteen feet. In the case of a lot in a LI or HI district, the rear yard setback shall be twenty feet. If the adjoining residential district is within an area shown in the comprehensive plan for future commercial or industrial use or expansion, no minimum rear yard shall be required
(Ord. 2515 § 1 (Exh. A (part)), 2008: Ord. 2443 § 3 (Exh. A (part)), 2006)
18.09.180 - Elevated decks.
Rear Yard Setback. The rear yard setback for an elevated deck shall be fifteen feet. As used herein, an elevated deck shall mean a deck thirty inches or more aboveground level that is physically attached to a residential structure. The areas covered by an elevated deck shall be counted when calculating the maximum lot coverage permitted under the applicable density provisions.
(Ord. 2515 § 1 (Exh. A (part)), 2008: Ord. 2443 § 3 (Exh. A (part)), 2006)
COMMUNITY
INFORMATION
Demographics
Traffic Counts
The information contained is provided by WFG’s Customer Service Department to our customers, and while deemed reliable, is not guaranteed.

6035 NW Larkspur St, Camas, WA 98607
6035 NW Larkspur St, Camas, WA 98607 Sitewise Online Pop-Facts: Population Quick Facts Pop-Facts: Population Quick Facts 6035 NW Larkspur St, Camas, WA 98607 0 - 1 mi Population 2027 Projection 2,560 2022 Estimate 2,377 2010 Census 1,593 2000 Census 930 Growth 2022-2027 7.68% Growth 2010-2022 49.24% Growth 2000-2010 71.27% 2022 Est. Population by Age 2,377 Age 0 to 4 117 4.91% Age 5 to 9 152 6.38% Age 10 to 14 155 6.54% Age 15 to 17 106 4.48% Age 18 to 20 100 4.20% Age 21 to 24 141 5.93% Age 25 to 34 298 12.54% Age 35 to 44 180 7.55% Age 45 to 54 317 13.34% Age 55 to 64 375 15.79% Age 65 to 74 290 12.20% Age 75 to 84 120 5.05% Age 85 and over 26 1.09% Age 16 and over 1,919 80.73% Age 18 and over 1,847 77.69% Age 21 and over 1,747 73.50% Age 65 and over 436 18.34% 2022 Est. Median Age 41.66 2022 Est. Average Age 40.74
2022 Est. Population by Single-Classification Race 2,377 White Alone 1,727 72.65% Black or African American Alone 33 1.41% American Indian and Alaska Native Alone 9 0.38% Asian Alone 371 15.60% Native Hawaiian and Other Pacific Islander Alone 26 1.09% Some Other Race Alone 47 1.99% Two or More Races 163 6.88% 2022 Est. Population by Ethnicity (Hispanic or Latino) 2,377 Hispanic or Latino 131 5.52% Not Hispanic or Latino 2,246 94.48% 2022 Est. Population by Sex 2,377 Male 1,187 49.92% Female 1,190 50.08%
6035 NW Larkspur St, Camas, WA 98607 Sitewise Online Pop-Facts: Population Quick Facts Pop-Facts: Population Quick Facts 6035 NW Larkspur St, Camas, WA 98607 0 - 1 mi
Copyright © Claritas, LLC 2022. All rights reserved.
6035 NW Larkspur St, Camas, WA 98607 Sitewise Online Pop-Facts: Household Quick Facts Pop-Facts: Household Quick Facts 6035 NW Larkspur St, Camas, WA 98607 0 - 1 mi Households 2027 Projection 873 2022 Estimate 815 2010 Census 545 2000 Census 331 Growth 2022-2027 7.12% Growth 2010-2022 49.60% Growth 2000-2010 64.54% 2022 Est. Households by Household Income 815 Income Less than $15,000 14 1.67% Income $15,000 to $24,999 17 2.11% Income $25,000 to $34,999 15 1.81% Income $35,000 to $49,999 36 4.37% Income $50,000 to $74,999 64 7.87% Income $75,000 to $99,999 88 10.79% Income $100,000 to $124,999 112 13.79% Income $125,000 to $149,999 98 12.07% Income $150,000 to $199,999 121 14.86% Income $200,000 to $249,999 77 9.46% Income $250,000 to $499,999 102 12.56% Income $500,000 or more 70 8.64% 2022 Est. Average Household Income $ 188,633 2022 Est. Median Household Income $ 140,718 2022 Median HH Inc. by Single-Classification Race White Alone $ 138,561 Black or African American Alone $ 233,334 American Indian and Alaska Native Alone $ 164,685 Asian Alone $ 202,483 Native Hawaiian and Other Pacific Islander Alone $ 125,373 Some Other Race Alone $ 101,491 Two or More Races $ 81,263 Hispanic or Latino $ 114,015 Not Hispanic or Latino $ 143,640 2022 Est. Households by Household Type 815 Family Households 709 86.96% Nonfamily Households 106 13.04% 2022 Est. Group Quarters Population 7
2022 Est. Households by Household Size 815 1-person 84 10.34% 2-person 284 34.90% 3-person 134 16.46% 4-person 173 21.28% 5-person 87 10.62% 6-person 36 4.39% 7-or-more-person 16 2.01% 2022 Est. Average Household Size 2.91 6035 NW Larkspur St, Camas, WA 98607 Sitewise Online Pop-Facts: Household Quick Facts Pop-Facts: Household Quick Facts 6035 NW Larkspur St, Camas, WA 98607 0 - 1 mi
2022 Est. HHs by Type by Presence of Own Children 709 Married-Couple Family, own children 329 46.37% Married-Couple Family, no own children 317 44.66% Male Householder, own children 19 2.74% Male Householder, no own children 10 1.35% Female Householder, own children 23 3.28% Female Householder, no own children 11 1.60% Copyright © Claritas, LLC 2022. All rights reserved. 6035 NW Larkspur St, Camas, WA 98607 Sitewise Online Pop-Facts: Household Quick Facts Pop-Facts: Household Quick Facts 6035 NW Larkspur St, Camas, WA 98607 0 - 1 mi
Pop-Facts: Demographic Snapshot (Part 1) 6035 NW Larkspur St, Camas, WA 98607 0 - 1 mi Population 2027 Projection 2,560 2022 Estimate 2,377 2010 Census 1,593 2000 Census 930 Growth 2022-2027 7.68% Growth 2010-2022 49.24% Growth 2000-2010 71.27% 2022 Est. Population by Single-Classification Race 2,377 White Alone 1,727 72.65% Black or African American Alone 33 1.41% American Indian and Alaska Native Alone 9 0.38% Asian Alone 371 15.60% Native Hawaiian and Other Pacific Islander Alone 26 1.09% Some Other Race Alone 47 1.99% Two or More Races 163 6.88% 2022 Est. Population Hispanic or Latino by Origin 2,377 Not Hispanic or Latino 2,246 94.48% Hispanic or Latino 131 5.52% Hispanic or Latino by Origin 131 Mexican 90 68.90% Puerto Rican 4 2.73% Cuban 2 1.90% All Other Hispanic or Latino 35 26.47% 2022 Est. Hisp. or Latino Pop by Single-Classification Race 131 White Alone 98 74.79% Black or African American Alone 1 0.83% American Indian and Alaska Native Alone 2 1.90% Asian Alone 0 0.12% Native Hawaiian and Other Pacific Islander Alone 0 0.00% Some Other Race Alone 25 18.75% Two or More Races 5 3.62%
6035 NW Larkspur St, Camas, WA 98607 Sitewise Online Pop-Facts: Demographic Snapshot (Part 1)
2022 Est. Pop by Race, Asian Alone, by Category 371 Chinese, except Taiwanese 173 46.59% Filipino 24 6.59% Japanese 4 1.02% Asian Indian 33 8.88% Korean 44 11.87% Vietnamese 55 14.81% Cambodian 0 0.00% Hmong 0 0.00% Laotian 0 0.00% Thai 0 0.00% All other Asian Races, including 2 or more 38 10.25% 2022 Est. Population by Ancestry 2,377 Arab 4 0.18% Czech 9 0.39% Danish 33 1.38% Dutch 31 1.30% English 231 9.72% French (except Basque) 25 1.04% French Canadian 3 0.14% German 335 14.10% Greek 19 0.81% Hungarian 9 0.40% Irish 164 6.90% Italian 53 2.25% Lithuanian 0 0.00% Norwegian 107 4.52% Polish 40 1.68% Portuguese 14 0.58% Russian 18 0.76% Scottish 33 1.39% Scotch-Irish 10 0.41% Slovak 0 0.01% Subsaharan African 14 0.58% Swedish 55 2.30% Swiss 15 0.64% Ukrainian 7 0.28% United States or American 7 0.29% Welsh 6 0.26% West Indian (except Hisp. groups) 0 0.00% Other Ancestries 870 36.62% Ancestry Unclassified 263 11.08% 2022 Est. Pop Age 5+ by Language Spoken At Home 2,260
Online Pop-Facts:
1) Pop-Facts: Demographic Snapshot (Part 1) 6035 NW Larkspur St,
WA 98607 0 - 1 mi
6035 NW Larkspur St, Camas, WA 98607 Sitewise
Demographic Snapshot (Part
Camas,
Speak only English 1,938 85.75% Speak Asian or Pacific Island Language 206 9.11% Speak IndoEuropean Language 70 3.08% Speak Spanish 46 2.04% Speak Other Language 1 0.03% 6035 NW Larkspur St, Camas, WA 98607 Sitewise Online Pop-Facts: Demographic Snapshot (Part 1) Pop-Facts: Demographic Snapshot (Part 1) 6035 NW Larkspur St, Camas, WA 98607 0 - 1 mi
2022 Est. Population by Sex 2,377 Male 1,187 49.92% Female 1,190 50.08% 2022 Est. Population by Age 2,377 Age 0 to 4 117 4.91% Age 5 to 9 152 6.38% Age 10 to 14 155 6.54% Age 15 to 17 106 4.48% Age 18 to 20 100 4.20% Age 21 to 24 141 5.93% Age 25 to 34 298 12.54% Age 35 to 44 180 7.55% Age 45 to 54 317 13.34% Age 55 to 64 375 15.79% Age 65 to 74 290 12.20% Age 75 to 84 120 5.05% Age 85 and over 26 1.09% Age 16 and over 1,919 80.73% Age 18 and over 1,847 77.69% Age 21 and over 1,747 73.50% Age 65 and over 436 18.34% 2022 Est. Median Age 41.66 2022 Est. Average Age 40.74
6035 NW Larkspur St, Camas, WA 98607 Sitewise Online
Demographic Snapshot (Part 1) 6035
Larkspur
WA 98607 0 - 1 mi
Pop-Facts: Demographic Snapshot (Part 1)
Pop-Facts:
NW
St, Camas,
2022 Est. Male Population by Age 1,187 Age 0 to 4 60 5.06% Age 5 to 9 80 6.77% Age 10 to 14 79 6.67% Age 15 to 17 51 4.30% Age 18 to 20 49 4.13% Age 21 to 24 69 5.83% Age 25 to 34 159 13.38% Age 35 to 44 88 7.42% Age 45 to 54 149 12.57% Age 55 to 64 191 16.09% Age 65 to 74 143 12.07% Age 75 to 84 57 4.81% Age 85 and over 11 0.91% 2022 Est. Median Age, Male 40.21 2022 Est. Average Age, Male 40.26 2022 Est. Female Population by Age 1,190 Age 0 to 4 57 4.76% Age 5 to 9 71 5.99% Age 10 to 14 76 6.41% Age 15 to 17 55 4.66% Age 18 to 20 51 4.27% Age 21 to 24 72 6.02% Age 25 to 34 139 11.70% Age 35 to 44 92 7.69% Age 45 to 54 168 14.11% Age 55 to 64 184 15.50% Age 65 to 74 147 12.33% Age 75 to 84 63 5.29% Age 85 and over 15 1.27% 2022 Est. Median Age, Female 43.05 2022 Est. Average Age, Female 41.26 6035 NW Larkspur St, Camas, WA 98607 Sitewise Online Pop-Facts: Demographic Snapshot (Part 1) Pop-Facts: Demographic Snapshot (Part 1) 6035 NW Larkspur St, Camas, WA 98607 0 - 1 mi
2022 Est. Pop Age 15+ by Marital Status 1,953 Total, Never Married 499 25.55% Males, Never Married 255 13.07% Females, Never Married 244 12.47% Married, Spouse present 1,193 61.07% Married, Spouse absent 55 2.83% Widowed 66 3.36% Males, Widowed 15 0.79% Females, Widowed 50 2.57% Divorced 141 7.19% Males, Divorced 48 2.43% Females, Divorced 93 4.76% 2022 Est. Pop Age 25+ by Edu. Attainment 1,606 Less than 9th grade 5 0.28% Some High School, no diploma 40 2.50% High School Graduate (or GED) 248 15.42% Some College, no degree 258 16.04% Associate Degree 128 7.97% Bachelor's Degree 563 35.03% Master's Degree 246 15.29% Professional School Degree 52 3.23% Doctorate Degree 68 4.25% 2022 Est. Pop. Age 25+ by Edu. Attain., Hisp./Lat. 65 No High School Diploma 11 16.91% High School Graduate 7 10.28% Some College or Associate's Degree 23 35.98% Bachelor's Degree or Higher 24 36.83% Copyright © Claritas, LLC 2022. All rights reserved. 6035 NW Larkspur St, Camas, WA 98607 Sitewise Online Pop-Facts: Demographic Snapshot (Part 1) Pop-Facts: Demographic Snapshot (Part 1) 6035 NW Larkspur St, Camas, WA 98607 0 - 1 mi
6035 NW Larkspur St, Camas, WA 98607 Sitewise Online Pop-Facts: Demographic Snapshot (Part 2) Pop-Facts: Demographic Snapshot (Part 2) 6035 NW Larkspur St, Camas, WA 98607 0 - 1 mi Households 2027 Projection 873 2022 Estimate 815 2010 Census 545 2000 Census 331 Growth 2022-2027 7.12% Growth 2010-2022 49.60% Growth 2000-2010 64.54% 2022 Est. Households by Household Type 815 Family Households 709 86.96% Nonfamily Households 106 13.04% 2022 Est. Group Quarters Population 7 2022 HHs by Ethnicity: Hispanic/Latino 27 3.34% 2022 Est. Households by HH Income 815 Income < $15,000 14 1.67% Income $15,000 to $24,999 17 2.11% Income $25,000 to $34,999 15 1.81% Income $35,000 to $49,999 36 4.37% Income $50,000 to $74,999 64 7.87% Income $75,000 to $99,999 88 10.79% Income $100,000 to $124,999 112 13.79% Income $125,000 to $149,999 98 12.07% Income $150,000 to $199,999 121 14.86% Income $200,000 to $249,999 77 9.46% Income $250,000 to $499,999 102 12.56% Income $500,000+ 70 8.64% 2022 Est. Average Household Income $ 188,633 2022 Est. Median Household Income $ 140,718 2022 Median HH Income by Single-Class. Race or Ethn. White Alone $ 138,561 Black or African American Alone $ 233,334 American Indian and Alaska Native Alone $ 164,685 Asian Alone $ 202,483 Native Hawaiian and Other Pacific Islander Alone $ 125,373 Some Other Race Alone $ 101,491 Two or More Races $ 81,263 Hispanic or Latino $ 114,015
Not Hispanic or Latino $ 143,640 6035 NW Larkspur St, Camas, WA 98607 Sitewise Online Pop-Facts: Demographic Snapshot (Part 2) Pop-Facts: Demographic Snapshot (Part 2) 6035 NW Larkspur St, Camas, WA 98607 0 - 1 mi
2022 Est. Family HH Type by Presence of Own Children 709 Married-Couple Family, own children 329 46.37% Married-Couple Family, no own children 317 44.66% Male Householder, own children 19 2.74% Male Householder, no own children 10 1.35% Female Householder, own children 23 3.28% Female Householder, no own children 11 1.60% 2022 Est. Households by Household Size 815 1-person 84 10.34% 2-person 284 34.90% 3-person 134 16.46% 4-person 173 21.28% 5-person 87 10.62% 6-person 36 4.39% 7-or-more-person 16 2.01% 2022 Est. Average Household Size 2.91 2022 Est. Households by Presence of People Under 18 815 Households with 1 or more People under Age 18 387 47.48% Households with No People under Age 18 428 52.52% Households with 1 or more People under Age 18 387 Married-Couple Family 336 86.87% Other Family, Male Householder 24 6.08% Other Family, Female Householder 25 6.37% Nonfamily, Male Householder 1 0.38% Nonfamily, Female Householder 1 0.30% Households with No People under Age 18 428 Married-Couple Family 309 72.10% Other Family, Male Householder 6 1.37% Other Family, Female Householder 10 2.27% Nonfamily, Male Householder 53 12.46% Nonfamily, Female Householder 51 11.80%
Online Pop-Facts: Demographic Snapshot (Part 2) Pop-Facts: Demographic Snapshot (Part 2) 6035 NW Larkspur St, Camas, WA 98607 0 - 1 mi
6035 NW Larkspur St, Camas, WA 98607 Sitewise
2022 Est. Households by Number of Vehicles 815 No Vehicles 18 2.17% 1 Vehicle 118 14.46% 2 Vehicles 386 47.40% 3 Vehicles 226 27.79% 4 Vehicles 40 4.86% 5 or more Vehicles 27 3.31% 2022 Est. Average Number of Vehicles 2.32 Family Households 2027 Projection 759 2022 Estimate 709 2010 Census 473 2000 Census 289 Growth 2022-2027 7.15% Growth 2010-2022 49.82% Growth 2000-2010 63.65% 2022 Est. Families by Poverty Status 709 2022 Families at or Above Poverty 696 98.17% 2022 Families at or Above Poverty with Children 383 54.09% 2022 Families Below Poverty 13 1.83% 2022 Families Below Poverty with Children 11 1.56% 2022 Est. Pop Age 16+ by Employment Status 1,919 In Armed Forces 11 0.59% Civilian - Employed 1,167 60.84% Civilian - Unemployed 39 2.05% Not in Labor Force 701 36.52% 2022 Est. Civ. Employed Pop 16+ by Class of Worker 1,140 For-Profit Private Workers 714 62.67% Non-Profit Private Workers 81 7.08% Local Government Workers 96 8.39% State Government Workers 41 3.57% Federal Government Workers 24 2.10% Self-Employed Workers 167 14.68% Unpaid Family Workers 17 1.51% 6035 NW Larkspur St, Camas, WA 98607 Sitewise Online Pop-Facts: Demographic Snapshot (Part 2) Pop-Facts: Demographic Snapshot (Part 2) 6035 NW Larkspur St, Camas, WA 98607 0 - 1 mi
2022 Est. Civ. Employed Pop 16+ by Occupation 1,140 Architect/Engineer 40 3.48% Arts/Entertainment/Sports 29 2.58% Building Grounds Maintenance 10 0.85% Business/Financial Operations 138 12.07% Community/Social Services 14 1.21% Computer/Mathematical 65 5.66% Construction/Extraction 43 3.73% Education/Training/Library 100 8.79% Farming/Fishing/Forestry 1 0.10% Food Prep/Serving 19 1.63% Healthcare Practitioner/Technician 100 8.81% Healthcare Support 10 0.85% Maintenance Repair 16 1.43% Legal 20 1.76% Life/Physical/Social Science 12 1.01% Management 207 18.20% Office/Admin. Support 103 9.04% Production 30 2.66% Protective Service 26 2.26% Sales/Related 110 9.61% Personal Care/Service 24 2.09% Transportation/Moving 25 2.19% 2022 Est. Pop 16+ by Occupation Classification 1,140 Blue Collar 114 10.01% White Collar 937 82.22% Service & Farm 89 7.78% 2022 Est. Workers Age 16+ by Transp. To Work 1,143 Drove Alone 761 66.56% Car Pooled 100 8.71% Public Transportation 27 2.34% Walked 10 0.87% Bicycle 8 0.70% Other Means 24 2.07% Worked at Home 214 18.74% 2022 Est. Workers Age 16+ by Travel Time to Work* Less than 15 minutes 241 15 to 29 Minutes 380 30 to 44 Minutes 120 45 to 59 Minutes 66 60 or more Minutes 101
Online Pop-Facts:
Pop-Facts: Demographic Snapshot (Part 2) 6035 NW Larkspur St, Camas, WA 98607 0 - 1 mi
6035 NW Larkspur St, Camas, WA 98607 Sitewise
Demographic Snapshot (Part 2)
2022 Est. Avg. Travel Time to Work in Minutes* 28.90 2022 Est. Occupied Housing Units by Tenure 815 Owner-Occupied 742 91.07% Renter-Occupied 73 8.93% 2022 Occupied Housing Units: Avg. Length of Residence Owner-Occupied 9 Renter-Occupied 6 6035 NW Larkspur St, Camas, WA 98607 Sitewise Online Pop-Facts: Demographic Snapshot (Part 2) Pop-Facts: Demographic Snapshot (Part 2) 6035 NW Larkspur St, Camas, WA 98607 0 - 1 mi
2022 Est. Owner Occupied Housing Units by Value 742 Value Less than $20,000 0 0.02% Value $20,000 to $39,999 0 0.00% Value $40,000 to $59,999 2 0.32% Value $60,000 to $79,999 0 0.01% Value $80,000 to $99,999 0 0.00% Value $100,000 to $149,999 1 0.15% Value $150,000 to $199,999 0 0.00% Value $200,000 to $299,999 7 0.88% Value $300,000 to $399,999 51 6.81% Value $400,000 to $499,999 124 16.71% Value $500,000 to $749,999 270 36.34% Value $750,000 to $999,999 180 24.21% Value $1,000,000 to $1,499,999 86 11.65% Value $1,500,000 to $1,999,999 17 2.30% Value $2,000,000 or more 4 0.60% 2022 Est. Median All Owner-Occupied Housing Unit Value $ 672,672 2022 Est. Housing Units by Units in Structure 855 1 Unit Attached 57 6.65% 1 Unit Detached 718 83.91% 2 Units 14 1.66% 3 or 4 Units 6 0.67% 5 to 19 Units 22 2.56% 20 to 49 Units 0 0.00% 50 or More Units 33 3.90% Mobile Home or Trailer 6 0.65% Boat, RV, Van, etc. 0 0.00% Dominant structure type 1 Unit Detached 2022 Est. Housing Units by Year Structure Built 855 Housing Units Built 2014 or Later 184 21.55% Housing Units Built 2010 to 2013 68 7.96% Housing Units Built 2000 to 2009 270 31.58% Housing Units Built 1990 to 1999 238 27.84% Housing Units Built 1980 to 1989 29 3.44% Housing Units Built 1970 to 1979 34 4.00% Housing Units Built 1960 to 1969 14 1.65% Housing Units Built 1950 to 1959 6 0.72% Housing Units Built 1940 to 1949 7 0.87% Housing Units Built 1939 or Earlier 3 0.38% 2022 Est. Median Year Structure Built** 2004 Dominant Year Structure Built 2000 to 2009
Pop-Facts:
Pop-Facts: Demographic Snapshot (Part 2) 6035
0 - 1 mi
6035
NW Larkspur St, Camas, WA 98607
Sitewise Online
Demographic Snapshot (Part 2)
NW Larkspur St, Camas, WA 98607
6035 NW Larkspur St, Camas, WA 98607 Sitewise Online
Pop-Facts: Demographic Snapshot (Part 2)
Pop-Facts: Demographic Snapshot (Part 2) 6035 NW Larkspur St, Camas, WA 98607 0 - 1 mi
Copyright © Claritas, LLC 2022. All rights reserved.
* This row intentionally left blank. No Total Category.
**1939 will appear when at least half of the Housing Units in this reports area were built in 1939 or earlier.
6035 NW Larkspur St, Camas, WA 98607 Sitewise Online Pop-Facts: Census Demographic Overview (Part 1) Pop-Facts: Census Demographic Overview (Part 1) 6035 NW Larkspur St, Camas, WA 98607 0 - 1 mi Population 2027 Projection 2,560 2022 Estimate 2,377 2010 Census 1,593 2000 Census 930 Growth 2022-2027 7.68% Growth 2010-2022 49.24% Growth 2000-2010 71.27% 2010 Population by Single-Classification Race 1,593 White Alone 1,306 81.97% Black or African American Alone 22 1.36% American Indian and Alaska Native Alone 6 0.38% Asian Alone 167 10.46% Native Hawaiian and Other Pacific Islander Alone 8 0.53% Some Other Race Alone 21 1.30% Two or More Races 64 4.00% 2010 Population By Ethnicity 1,593 Not Hispanic or Latino 1,534 96.32% Hispanic or Latino 59 3.68% 2010 Hispanic or Latino by Single-Classification Race 59 White Alone 44 75.43% Black or African American Alone 1 1.23% American Indian and Alaska Native Alone 0 0.85% Asian Alone 0 0.18% Native Hawaiian and Other Pacific Islander Alone 0 0.00% Some Other Race Alone 10 17.29% Two or More Races 3 5.02% 2010 Population by Sex 1,593 Male 802 50.35% Female 791 49.65% Male/Female Ratio 1.01
2010 Population by Age 1,593 Age 0 to 4 97 6.10% Age 5 to 9 153 9.63% Age 10 to 14 162 10.14% Age 15 to 17 96 6.02% Age 18 to 20 42 2.65% Age 21 to 24 34 2.16% Age 25 to 34 107 6.73% Age 35 to 44 265 16.67% Age 45 to 54 280 17.58% Age 55 to 64 202 12.71% Age 65 to 74 111 6.99% Age 75 to 84 33 2.10% Age 85 and over 8 0.53% Age 16 and over 1,152 72.30% Age 18 and over 1,085 68.11% Age 21 and over 1,043 65.46% Age 65 and over 153 9.62% 2010 Median Age 38.94 6035 NW Larkspur St, Camas, WA 98607 Sitewise Online
Census Demographic Overview (Part 1) Pop-Facts: Census Demographic Overview (Part 1) 6035 NW Larkspur St, Camas, WA 98607 0 - 1 mi
Pop-Facts:
Copyright © Claritas, LLC 2022. All rights reserved.
2010 Male Population by Age 802 Age 0 to 4 47 5.90% Age 5 to 9 77 9.59% Age 10 to 14 84 10.42% Age 15 to 17 51 6.41% Age 18 to 20 24 3.02% Age 21 to 24 19 2.33% Age 25 to 34 51 6.40% Age 35 to 44 124 15.40% Age 45 to 54 147 18.28% Age 55 to 64 100 12.46% Age 65 to 74 60 7.49% Age 75 to 84 16 2.01% Age 85 and over 2 0.29% 2010 Median Age, Male 38.85 2010 Female Population by Age 791 Age 0 to 4 50 6.31% Age 5 to 9 76 9.67% Age 10 to 14 78 9.85% Age 15 to 17 44 5.62% Age 18 to 20 18 2.26% Age 21 to 24 16 1.98% Age 25 to 34 56 7.08% Age 35 to 44 142 17.95% Age 45 to 54 133 16.86% Age 55 to 64 103 12.96% Age 65 to 74 51 6.48% Age 75 to 84 17 2.19% Age 85 and over 6 0.78% 2010 Median Age, Female 39.02
6035
Pop-Facts:
Pop-Facts: Census Demographic Overview (Part 1) 6035 NW Larkspur St,
WA 98607 0 - 1 mi
NW Larkspur St, Camas, WA 98607 Sitewise Online
Census Demographic Overview (Part 1)
Camas,
6035 NW Larkspur St, Camas, WA 98607 Sitewise Online Pop-Facts: Census Demographic Overview (Part 2) Pop-Facts: Census Demographic Overview (Part 2) 6035 NW Larkspur St, Camas, WA 98607 0 - 1 mi Households 2027 Projection 873 2022 Estimate 815 2010 Census 545 2000 Census 331 Growth 2022-2027 7.12% Growth 2010-2022 49.60% Growth 2000-2010 64.54% 2010 Households by Household Type 545 Family Households 473 86.84% Non-family Households 72 13.16% 2010 Group Quarters Population 6 2010 Hispanic or Latino Households 11 2.06% 2010 Households by Household Size 545 1-person 57 10.47% 2-person 189 34.68% 3-person 90 16.61% 4-person 126 23.08% 5-person 53 9.66% 6-person 21 3.86% 7-or-more-person 9 1.65%
2010 Households by Type and Presence of Children 545 Married-Couple Family, own children 225 41.29% Male Householder, own children 13 2.41% Female Householder, own children 17 3.03% Married-Couple Family, no own children 204 37.54% Male Householder, no own children 6 1.18% Female Householder, no own children 8 1.39% Non-family Households 72 13.16% 2010 Households by Presence of People Under Age 18 545 HH with 1 or More People Under Age 18: 265 48.63% Households with No People Under Age 18: 280 51.37% HH with 1 or More People Under Age 18: 265 Married-Couple Family 230 86.80% Other Family, Male Householder 16 5.92% Other Family, Female Householder 18 6.63% Nonfamily, Male Householder 1 0.42% Nonfamily, Female Householder 1 0.22% Households with No People Under Age 18: 280 Married-Couple Family 199 71.27% Other Family, Male Householder 4 1.39% Other Family, Female Householder 7 2.33% Nonfamily, Male Householder 35 12.66% Nonfamily, Female Householder 35 12.36% 2010 Occupied Housing Units by Tenure 545 Owner-Occupied 494 90.77% Renter-Occupied 50 9.23% Copyright © Claritas, LLC 2022. All rights reserved. 6035 NW Larkspur St, Camas, WA 98607 Sitewise Online Pop-Facts: Census Demographic Overview (Part 2) Pop-Facts: Census Demographic Overview (Part 2) 6035 NW Larkspur St, Camas, WA 98607 0 - 1 mi
Retail Market Power Opportunity Gap Report By Retail Store Types Retail Market Power Opportunity Gap Report By Retail Store Types 6035 NW Larkspur St, Camas, WA 98607 0 - 1 mi 2022 Demand 2022 Supply Opportunity Gap/Surplus Total retail trade including food and drink (NAICS 44, 45 and 722) $ 102,369,507 $ 58,953,405 $ 43,416,103 Total retail trade (NAICS 44 and 45) $ 91,408,763 $ 48,965,944 $ 42,442,820 Motor vehicle and parts dealers (NAICS 441) $ 20,458,931 $ 2,121,835 $ 18,337,096 Automobile dealers (NAICS 4411) $ 17,057,119 $ 309,602 $ 16,747,516 New car dealers (NAICS 44111) $ 15,159,281 $ 309,602 $ 14,849,679 Used car dealers (NAICS 44112) $ 1,897,838 $ 0 $ 1,897,838 Other motor vehicle dealers (NAICS 4412) $ 1,986,634 $ 0 $ 1,986,634 Recreational vehicle dealers (NAICS 44121) $ 799,793 $ 0 $ 799,793 Motorcycle, boat, and other motor vehicle dealers (NAICS 44122) $ 1,186,841 $ 0 $ 1,186,841 Boat dealers (NAICS 441222) $ 475,599 $ 0 $ 475,599 Motorcycle, ATV, and all other motor vehicle dealers (NAICS 441228) $ 711,242 $ 0 $ 711,242 Automotive parts, accessories, and tire stores (NAICS 4413) $ 1,415,177 $ 1,812,232 - $ 397,055 Automotive parts and accessories stores (NAICS 44131) $ 895,005 $ 470,192 $ 424,813 Tire dealers (NAICS 44132) $ 520,173 $ 1,342,040 - $ 821,868 Furniture and home furnishings stores (NAICS 442) $ 2,106,321 $ 501,315 $ 1,605,006 Furniture stores (NAICS 4421) $ 1,154,858 $ 441,042 $ 713,817 Home furnishings stores (NAICS 4422) $ 951,463 $ 60,274 $ 891,189 Floor covering stores (NAICS 44221) $ 467,789 $ 21,628 $ 446,160 Other home furnishings stores (NAICS 44229) $ 483,674 $ 38,645 $ 445,029 Window treatment stores (NAICS 442291) $ 22,814 $ 0 $ 22,814 All other home furnishings stores (NAICS 442299) $ 460,860 $ 38,645 $ 422,215 Electronics and appliance stores (NAICS 443) $ 1,232,189 $ 0 $ 1,232,189 Household appliance stores (NAICS 443141) $ 299,637 $ 0 $ 299,637 Electronics stores (NAICS 443142) $ 932,552 $ 0 $ 932,552 Building material and garden equipment and supplies dealers (NAICS 444) $ 7,409,642 $ 2,824,781 $ 4,584,861 Building material and supplies dealers (NAICS 4441) $ 6,390,740 $ 2,824,781 $ 3,565,959 Home centers (NAICS 44411) $ 3,541,430 $ 1,588,509 $ 1,952,921 Paint and wallpaper stores (NAICS 44412) $ 217,533 $ 69,373 $ 148,160 Hardware stores (NAICS 44413) $ 549,955 $ 113,262 $ 436,693 Other building material dealers (NAICS 44419) $ 2,081,822 $ 1,053,637 $ 1,028,185 Lawn and garden equipment and supplies stores (NAICS 4442) $ 1,018,902 $ 0 $ 1,018,902 Outdoor power equipment stores (NAICS 44421) $ 211,023 $ 0 $ 211,023 Nursery, garden center, and farm supply stores (NAICS 44422) $ 807,879 $ 0 $ 807,879 Food and beverage stores (NAICS 445) $ 13,246,914 $ 1,545,534 $ 11,701,381 Grocery stores (NAICS 4451) $ 11,778,025 $ 1,545,534 $ 10,232,491 Supermarkets and other grocery (except convenience) stores (NAICS 44511) $ 11,322,858 $ 1,068,677 $ 10,254,181 Convenience stores (NAICS 44512) $ 455,167 $ 476,856 - $ 21,690 Specialty food stores (NAICS 4452) $ 343,906 $ 0 $ 343,906
6035 NW Larkspur St, Camas, WA 98607 Sitewise Online
Meat markets (NAICS 44521) $ 103,815 $ 0 $ 103,815 Fish and seafood markets (NAICS 44522) $ 40,867 $ 0 $ 40,867 Fruit and vegetable markets (NAICS 44523) $ 71,499 $ 0 $ 71,499 Other specialty food stores (NAICS 44529) $ 127,725 $ 0 $ 127,725 Baked goods and confectionery and nut stores (NAICS 445291 + 445292) $ 67,811 $ 0 $ 67,811 All other specialty food stores (NAICS 445299) $ 59,914 $ 0 $ 59,914 Beer, wine, and liquor stores (NAICS 4453) $ 1,124,983 $ 0 $ 1,124,983 Health and personal care stores (NAICS 446) $ 5,244,824 $ 301,540 $ 4,943,284 Pharmacies and drug stores (NAICS 44611) $ 4,542,392 $ 301,540 $ 4,240,852 Cosmetics, beauty supplies, and perfume stores (NAICS 44612) $ 306,302 $ 0 $ 306,302 Optical goods stores (NAICS 44613) $ 152,405 $ 0 $ 152,405 Other health and personal care stores (NAICS 44619) $ 243,725 $ 0 $ 243,725 Food (health) supplement stores (NAICS 446191) $ 86,602 $ 0 $ 86,602 All other health and personal care stores (NAICS 446199) $ 157,122 $ 0 $ 157,122 Gasoline stations (NAICS 447) $ 6,500,562 $ 471,504 $ 6,029,058 Clothing and clothing accessories stores (NAICS 448) $ 3,801,744 $ 94,908 $ 3,706,836 Clothing stores (NAICS 4481) $ 2,494,690 $ 94,908 $ 2,399,782 Men's clothing stores (NAICS 44811) $ 110,662 $ 0 $ 110,662 Women's clothing stores (NAICS 44812) $ 441,894 $ 37,976 $ 403,918 Children's and infants' clothing stores (NAICS 44813) $ 92,703 $ 0 $ 92,703 Family clothing stores (NAICS 44814) $ 1,496,734 $ 40,471 $ 1,456,263 Clothing accessories stores (NAICS 44815) $ 123,873 $ 0 $ 123,873 Other clothing stores (NAICS 44819) $ 228,823 $ 16,461 $ 212,362 Shoe stores (NAICS 4482) $ 517,546 $ 0 $ 517,546 Jewelry, luggage, and leather goods stores (NAICS 4483) $ 789,508 $ 0 $ 789,508 Jewelry stores (NAICS 44831) $ 524,840 $ 0 $ 524,840 Luggage and leather goods stores (NAICS 44832) $ 264,668 $ 0 $ 264,668 Sporting goods, hobby, musical instrument, and book stores (NAICS 451) $ 1,475,188 $ 65,410 $ 1,409,778 Sporting goods, hobby, and musical instrument stores (NAICS 4511) $ 1,328,572 $ 65,410 $ 1,263,162 Sporting goods stores (NAICS 45111) $ 973,537 $ 40,166 $ 933,371 Hobby, toy, and game stores (NAICS 45112) $ 263,106 $ 25,244 $ 237,862 Sewing, needlework, and piece goods stores (NAICS 45113) $ 45,688 $ 0 $ 45,688 Musical instrument and supplies stores (NAICS 45114) $ 46,240 $ 0 $ 46,240 Book stores and news dealers (NAICS 4512) $ 146,616 $ 0 $ 146,616 Book stores (NAICS 451211) $ 136,887 $ 0 $ 136,887 News dealers and newsstands (NAICS 451212) $ 9,729 $ 0 $ 9,729 General merchandise stores (NAICS 452) $ 11,596,182 $ 39,149,738 - $ 27,553,557 Department stores (NAICS 4522) $ 1,502,600 $ 0 $ 1,502,600 Other general merchandise stores (NAICS 4523) $ 10,093,582 $ 39,149,738 - $ 29,056,157 Warehouse clubs and supercenters (NAICS 452311) $ 9,096,145 $ 39,149,738 - $ 30,053,593 All other general merchandise stores (NAICS 452319) $ 997,437 $ 0 $ 997,437 6035 NW Larkspur St, Camas, WA 98607 Sitewise Online Retail Market Power Opportunity Gap Report By Retail Store Types Retail Market Power Opportunity Gap Report By Retail Store Types 6035 NW Larkspur St, Camas, WA 98607 0 - 1 mi 2022 Demand 2022 Supply Opportunity Gap/Surplus
* GAFO (General merchandise, Apparel, Furniture and Other) represents sales at stores that sell merchandise normally sold in department stores. This category is not included in Total Retail Sales Including Eating and Drinking Places.
Miscellaneous store retailers (NAICS 453) $ 2,035,441 $ 544,363 $ 1,491,078 Florists (NAICS 4531) $ 104,348 $ 0 $ 104,348 Office supplies, stationery, and gift stores (NAICS 4532) $ 467,812 $ 6,942 $ 460,870 Office supplies and stationery stores (NAICS 45321) $ 200,765 $ 3,408 $ 197,357 Gift, novelty, and souvenir stores (NAICS 45322) $ 267,047 $ 3,535 $ 263,513 Used merchandise stores (NAICS 4533) $ 304,555 $ 79,509 $ 225,046 Other miscellaneous store retailers (NAICS 4539) $ 1,158,726 $ 457,911 $ 700,815 Pet and pet supplies stores (NAICS 45391) $ 318,563 $ 23,426 $ 295,136 Art dealers (NAICS 45392) $ 209,962 $ 761 $ 209,201 Manufactured (mobile) home dealers (NAICS 45393) $ 136,413 $ 5,014 $ 131,399 All other miscellaneous store retailers (NAICS 45399) $ 493,788 $ 428,710 $ 65,078 Tobacco stores (NAICS 453991) $ 94,678 $ 0 $ 94,678 All other miscellaneous store retailers (except tobacco stores) (NAICS 453998) $ 399,111 $ 428,710 - $ 29,599 Non-store retailers (NAICS 454) $ 16,300,825 $ 1,345,016 $ 14,955,810 Electronic shopping and mail-order houses (NAICS 4541) $ 15,468,379 $ 1,345,016 $ 14,123,363 Vending machine operators (NAICS 4542) $ 109,809 $ 0 $ 109,809 Direct selling establishments (NAICS 4543) $ 722,637 $ 0 $ 722,637 Fuel dealers (NAICS 45431) $ 344,123 $ 0 $ 344,123 Other direct selling establishments (NAICS 45439) $ 378,514 $ 0 $ 378,514 Food services and drinking places (NAICS 722) $ 10,960,744 $ 9,987,461 $ 973,283 Special food services (NAICS 7223) $ 876,370 $ 2,855,031 - $ 1,978,662 Food service contractors (NAICS 72231) $ 693,032 $ 2,855,031 - $ 2,161,999 Caterers (NAICS 72232) $ 167,046 $ 0 $ 167,046 Mobile food services (NAICS 72233) $ 16,291 $ 0 $ 16,291 Drinking places (alcoholic beverages) (NAICS 7224) $ 351,921 $ 0 $ 351,921 Restaurants and other eating places (NAICS 7225) $ 9,732,453 $ 7,132,429 $ 2,600,023 Full-service restaurants (NAICS 722511) $ 4,865,494 $ 3,320,794 $ 1,544,700 Limited-service restaurants (NAICS 722513) $ 4,129,901 $ 3,402,630 $ 727,271 Cafeterias, grill buffets, and buffets (NAICS 722514) $ 105,277 $ 11,949 $ 93,327 Snack and nonalcoholic beverage bars (NAICS 722515) $ 631,781 $ 397,056 $ 234,724 GAFO* $ 20,212,092 $ 39,811,378 - $ 19,599,286 General Merchandise Stores-452 $ 11,596,182 $ 39,149,738 - $ 27,553,557 Clothing & Clothing Accessories Stores-448 $ 3,801,744 $ 94,908 $ 3,706,836 Furniture & Home Furnishings Stores-442 $ 2,106,321 $ 501,315 $ 1,605,006 Electronics & Appliance Stores-443 $ 1,232,189 $ 0 $ 1,232,189 Sporting Goods, Hobby, Book, Music Stores-451 $ 1,475,188 $ 65,410 $ 1,409,778 Office Supplies, Stationery, Gift Stores-4532 $ 467,812 $ 6,942 $ 460,870
NW Larkspur
Sitewise Online Retail Market Power Opportunity Gap Report By Retail Store Types Retail Market Power Opportunity Gap Report By Retail Store Types 6035 NW Larkspur St, Camas, WA 98607 0 - 1 mi 2022 Demand 2022 Supply Opportunity Gap/Surplus
6035
St, Camas, WA 98607
6035 NW Larkspur St, Camas, WA 98607
Sitewise Online
Retail Market Power Opportunity Gap Report By Retail Store Types
Retail Market Power Opportunity Gap Report By
Retail Market Power data is derived from two major sources of information. The demand data is derived from the Consumer Expenditure Survey (CE Survey or CEX), which is fielded by the U.S. Bureau of Labor Statistics (BLS). The supply data is derived from the Census of Retail Trade (CRT), which is made available by the U.S. Census. Additional data sources are incorporated to create both supply and demand estimates. The difference between demand and supply represents the opportunity gap or surplus available for each merchandise line in the specified reporting geography. When this difference is positive (demand is greater than the supply), there is an opportunity gap for that merchandise line; when the difference is negative (supply is greater than demand), there is a surplus.
Copyright © 2022 Environics Analytics. All rights reserved.
6035 NW Larkspur St, Camas, WA 98607 0 - 1 mi 2022 Demand 2022 Supply Opportunity Gap/Surplus
Retail Store Types
Traffic Listing
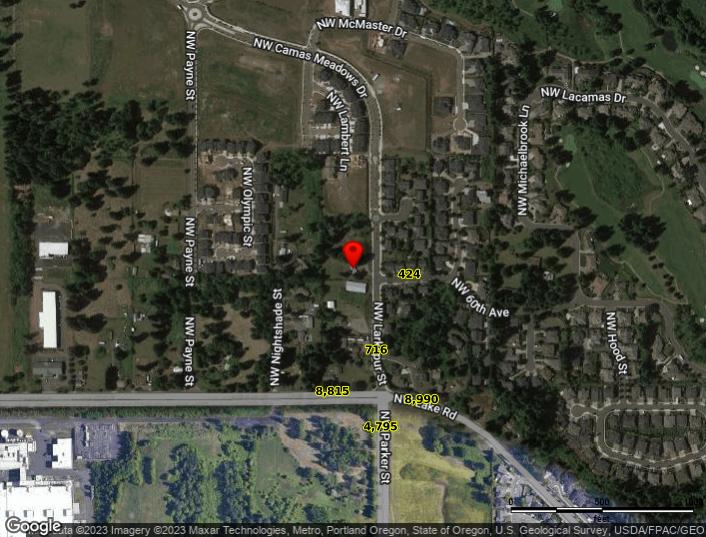 Powered
by Sitewise Data Source: Kalibrate TrafficMetrix
NW Larkspur
Camas,
28, 2023 Map # Street Cross Street Dir. Volume Type/Year Dist. (mi) 1. NW 60th Ave NW Klickitat St E 424 Current Year 0.1 2. NW Larkspur St NW 59th Cr S 716 Current Year 0.1 3. SE 1st St NW Larkspur St E 8,815 Current Year 0.1 4. NW Lake Rd NW 59th Cr W 8,990 Current Year 0.2 5. NW Parker St NW 38th Ave S 4,795 Current Year 0.2 6. NW Parker St NW 38th Ave S 4,489 Published (2002) 0.4 7. NW Lake Rd SE 202nd Ave W 10,013 Current Year 0.7 8. NE 202nd Ave E NE 202nd Ave S 2,488 Current Year 0.9 9. SE 1st St SE Westridge Blvd W 5,488 Published (1999) 0.9 10. NW Camas Meadows Dr NE Goodwin Rd NW 715 Current Year 1.0
6035
St,
WA 98607 April
