DEVELOPER PACKET
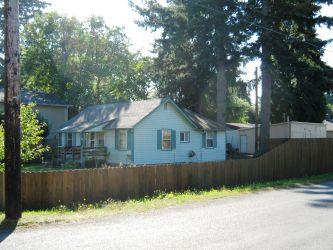
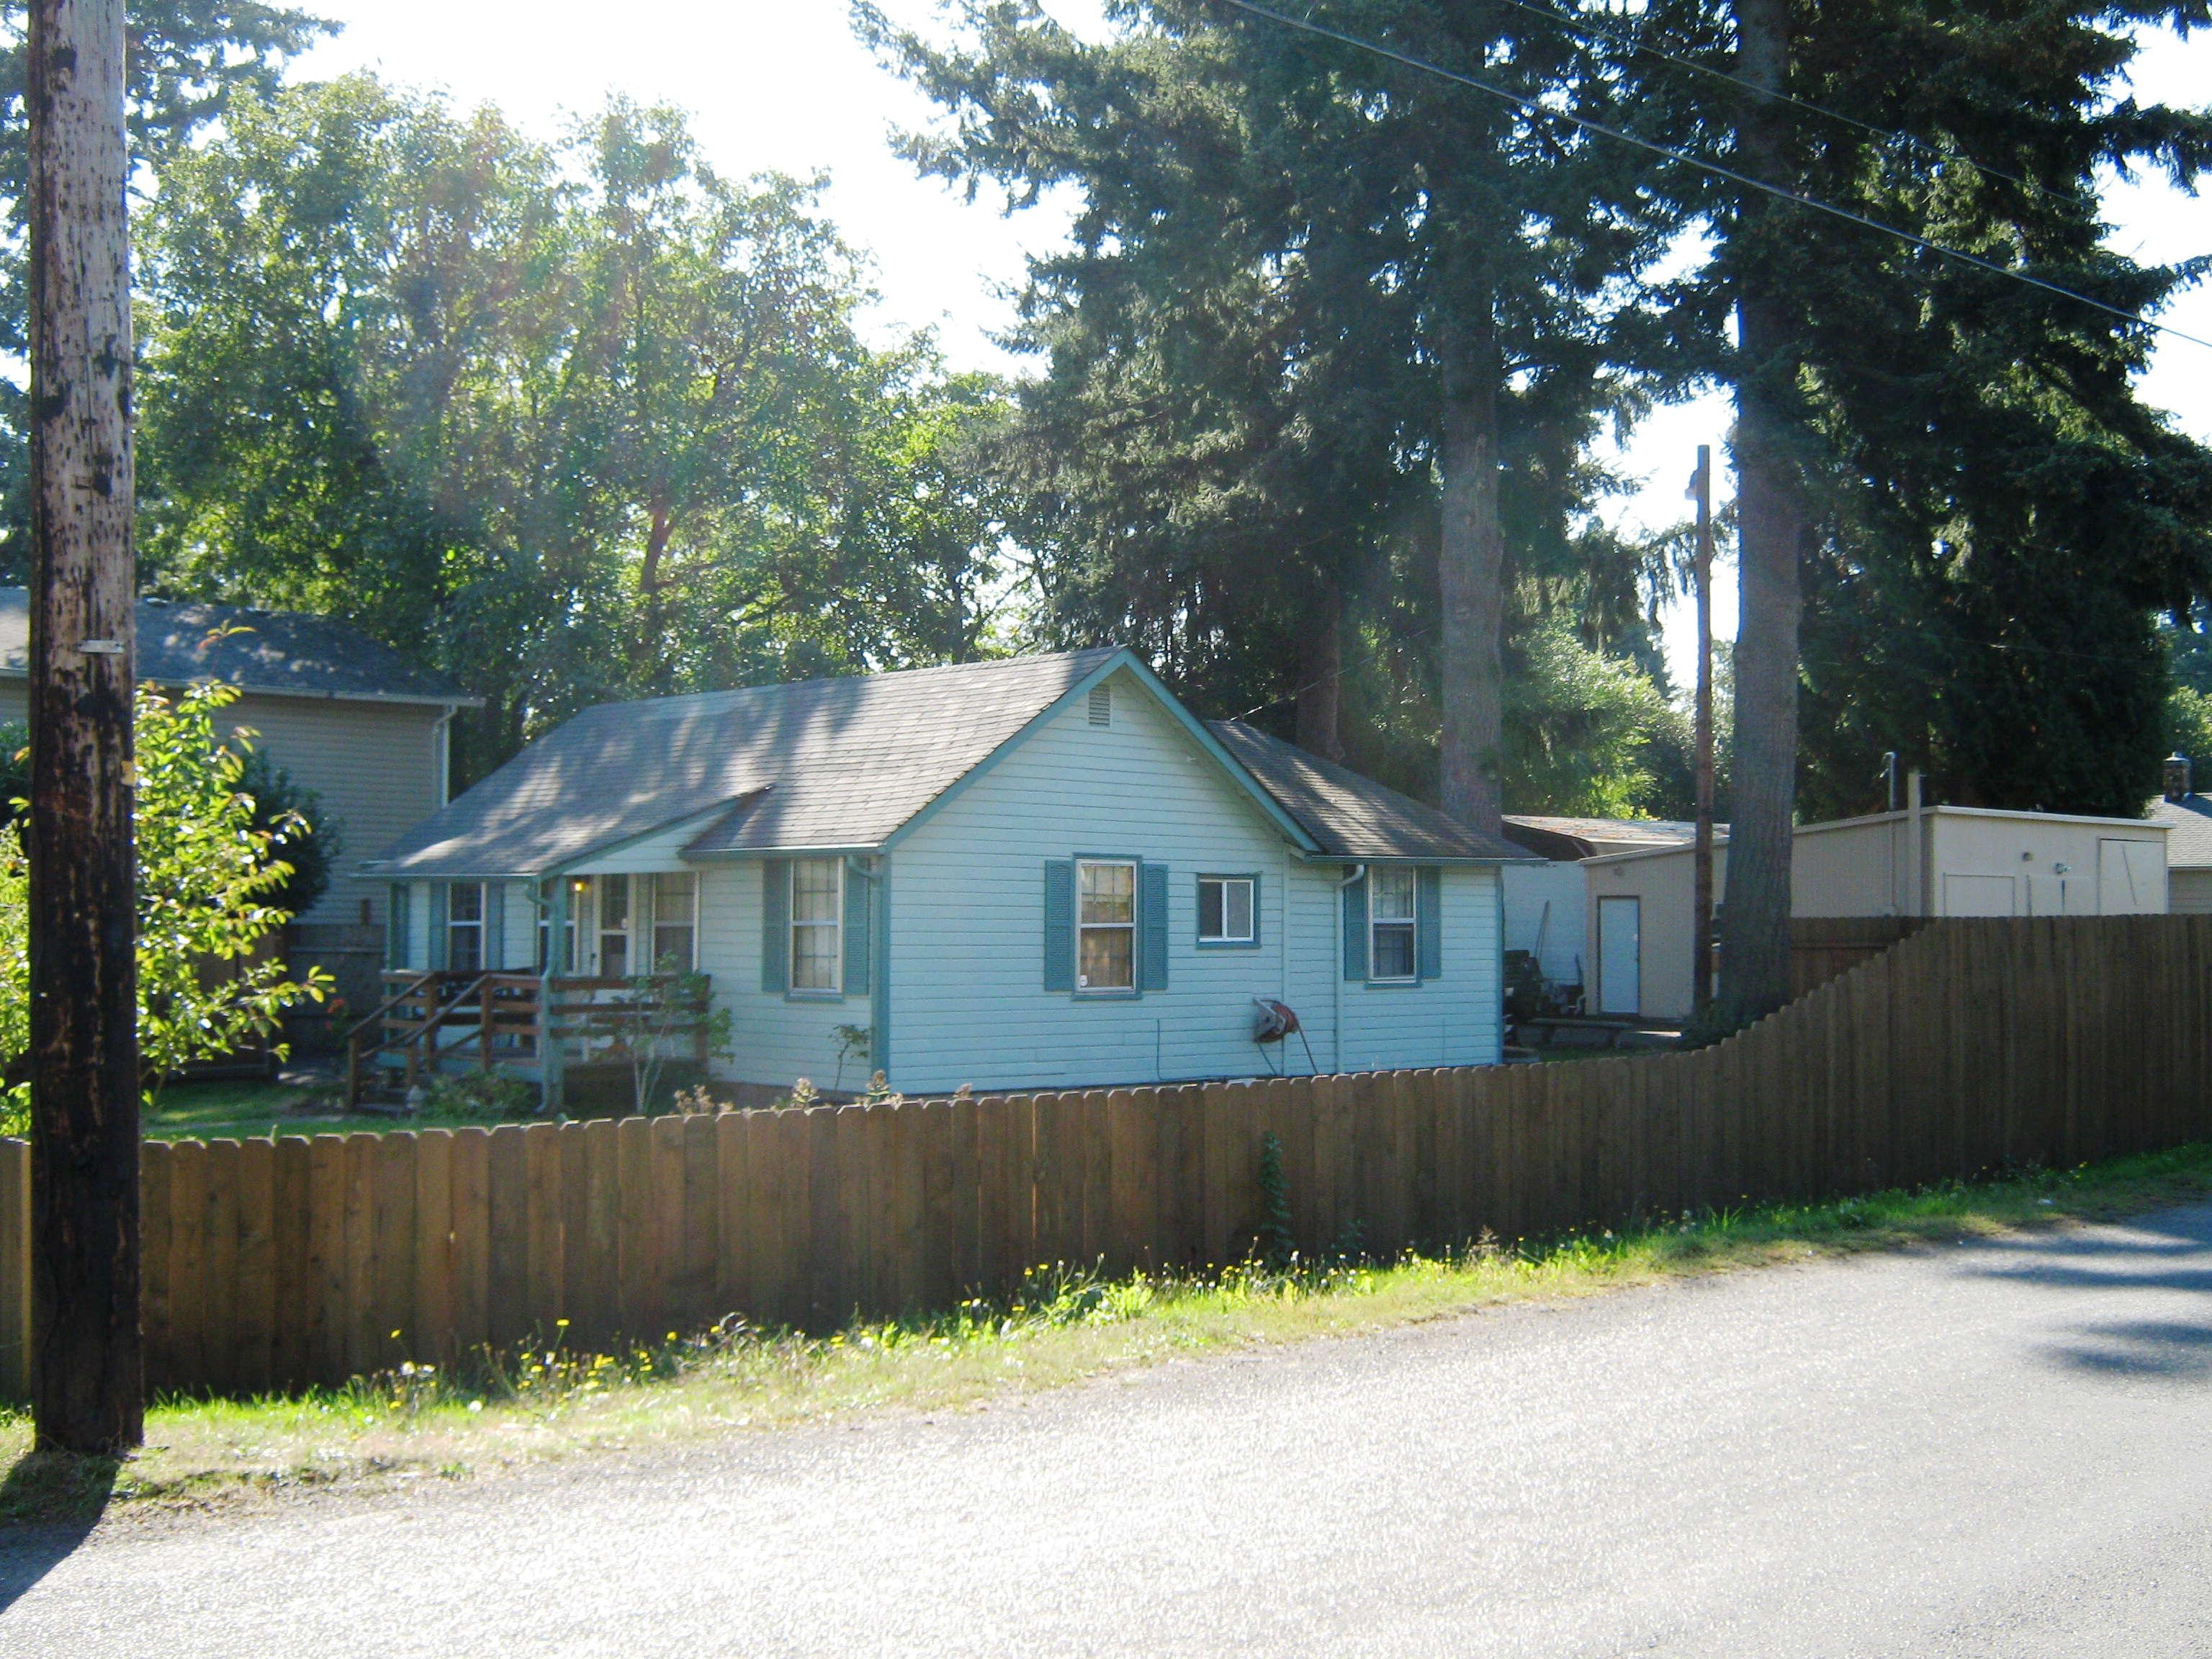
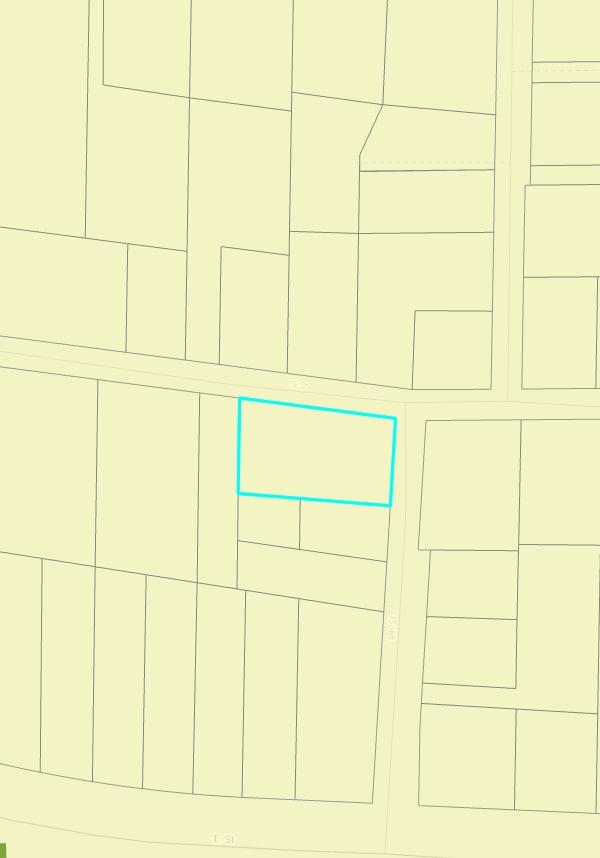
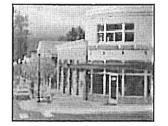
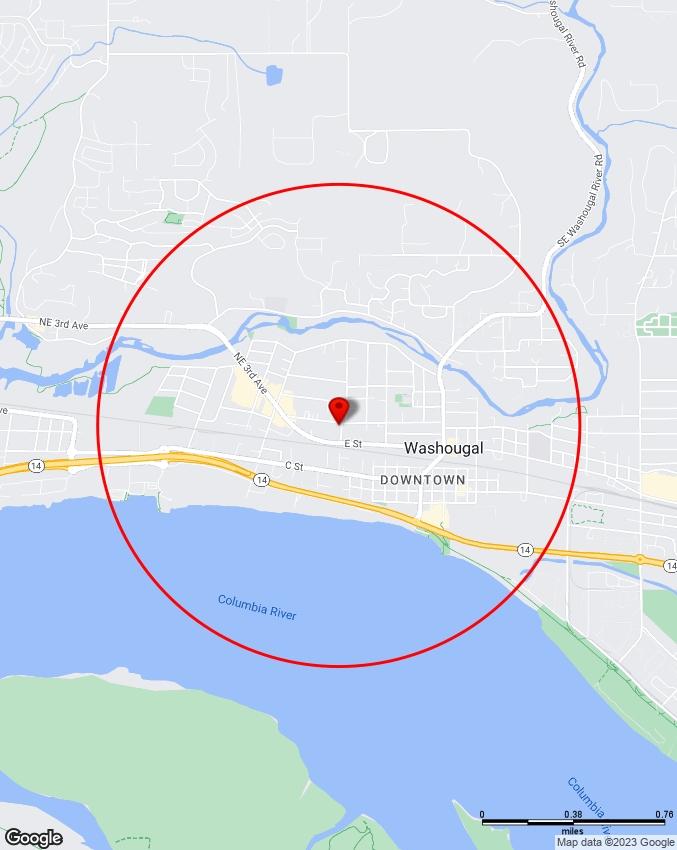
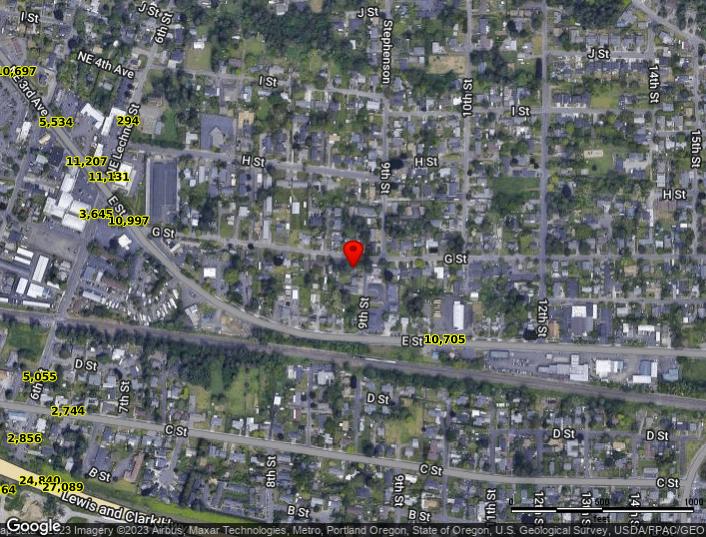
565 9TH ST
WASHOUGAL, WA 98671
PARCEL # 075358390
CLARK COUNTY
Compliments of WFG National Title Insurance Company Customer Service Department

565 9TH ST
WASHOUGAL, WA 98671
PARCEL # 075358390
CLARK COUNTY
Property Details
Custom Maps
Zoning Information
Community Information

-Demographics
-Traffic Counts
The information contained is provided by WFG’s Customer Service Department to our customers, and while deemed reliable, is not guaranteed.
ClarkCountyPropertyProfileInformation
Parcel#:075358390
RefParcel#:
Owner:Mason,Mary
CoOwner:
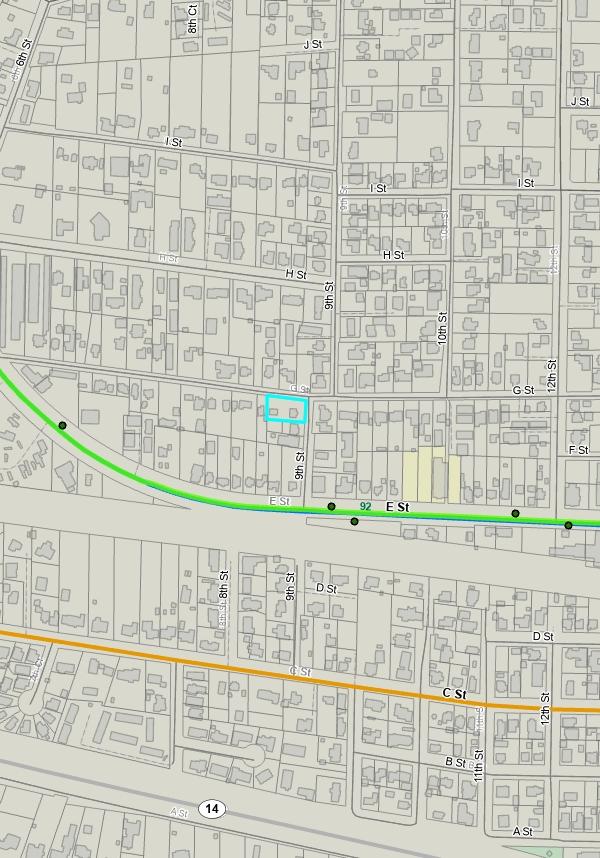
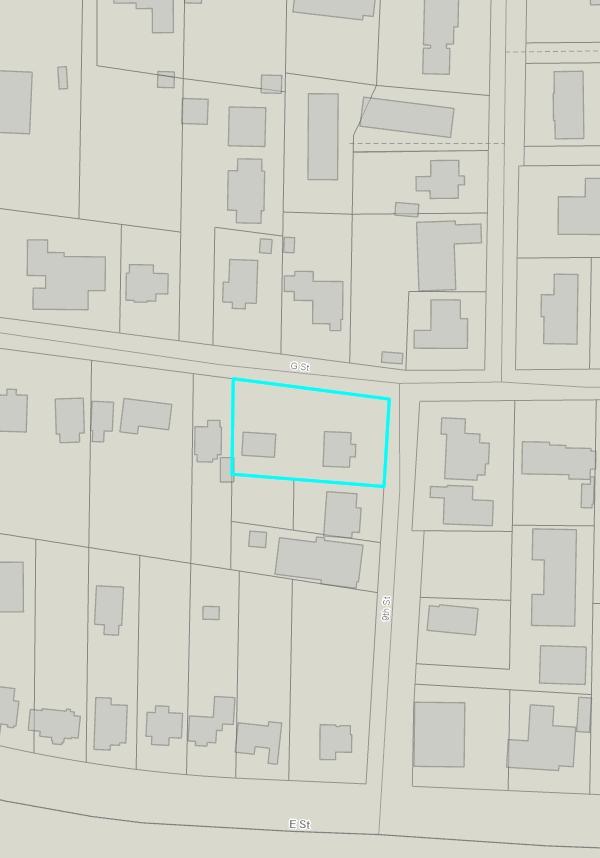
Site:5659thSt
WashougalWA98671-1302
Mail:5659thSt
WashougalWA98671-1302
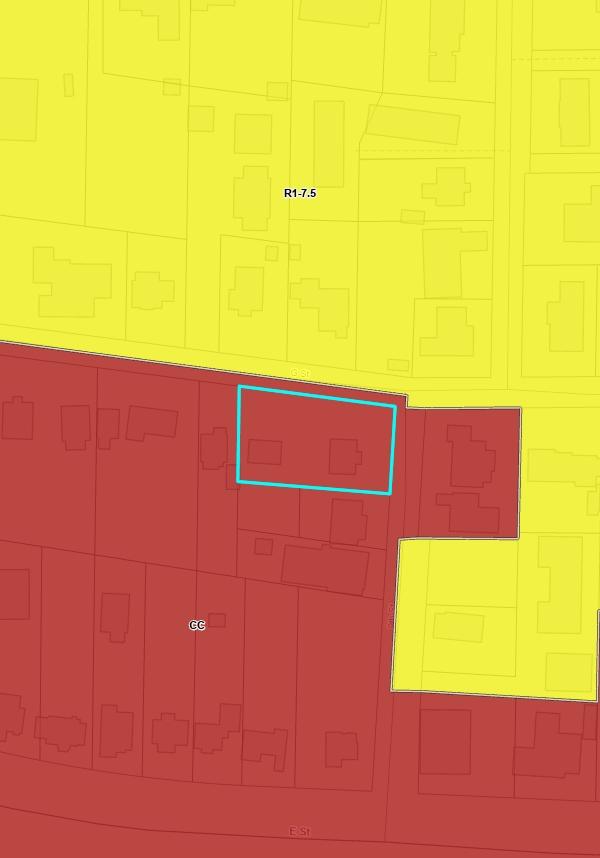
Zoning:CCCommunityCommercial(Cc)
SchoolDist:112WashougalSchoolDistrict
Census:1028040509
LandUse:11Household,SingleFamilyUnits
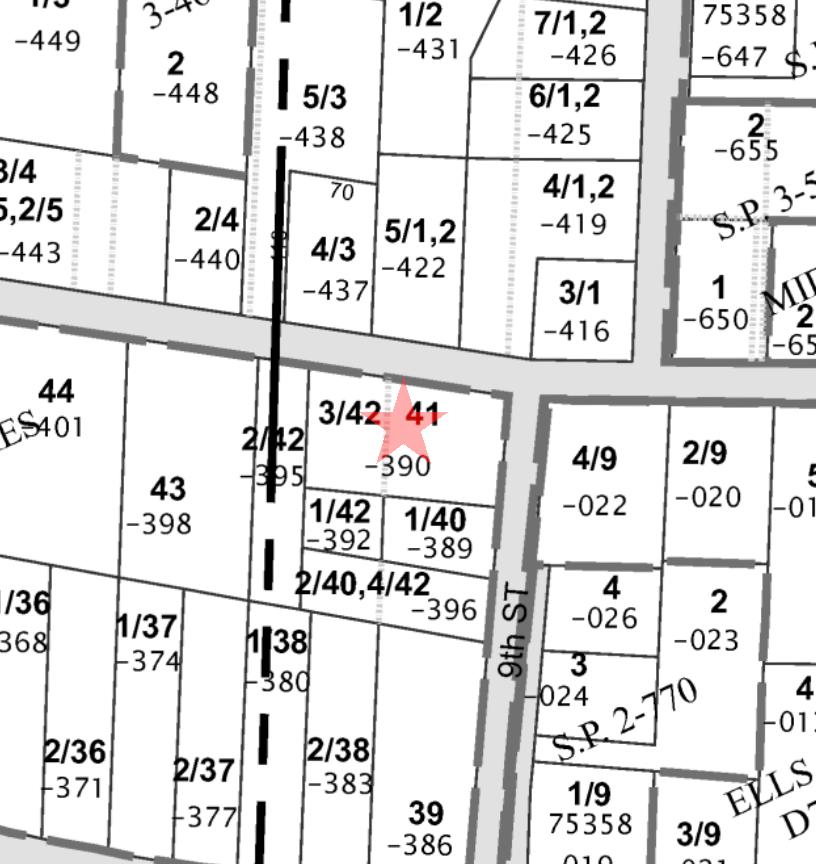
Legal:REPLATOFMIDLANDACRESLOT41 LOT42BLK1
ASSESSMENT&TAXINFORMATION

MarketTotal:$310,945.00
MarketLand:$159,720.00
MarketImpr:$151,225.00
AssessedTotal:$310,94500
Exemption:
Taxes:$2,881.68
LevyCode:112000
LevyRate:92386
SaleDate:01/23/2022
SaleAmount:
Document#:
DeedType:DEATH
LoanAmount:
Lender:
LoanType:
InterestType:
TitleCo:
PROPERTYCHARACTERISTICS
ParcelType:RESIDENTIALSUBDIV
YearBuilt:1934
Bedrooms:2
Bathrooms:1
BuildingTotal:
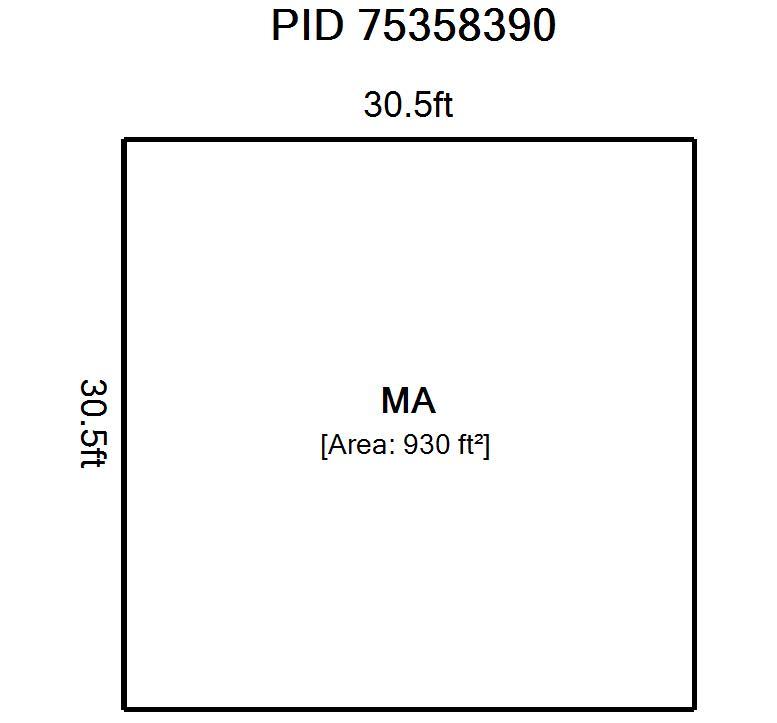
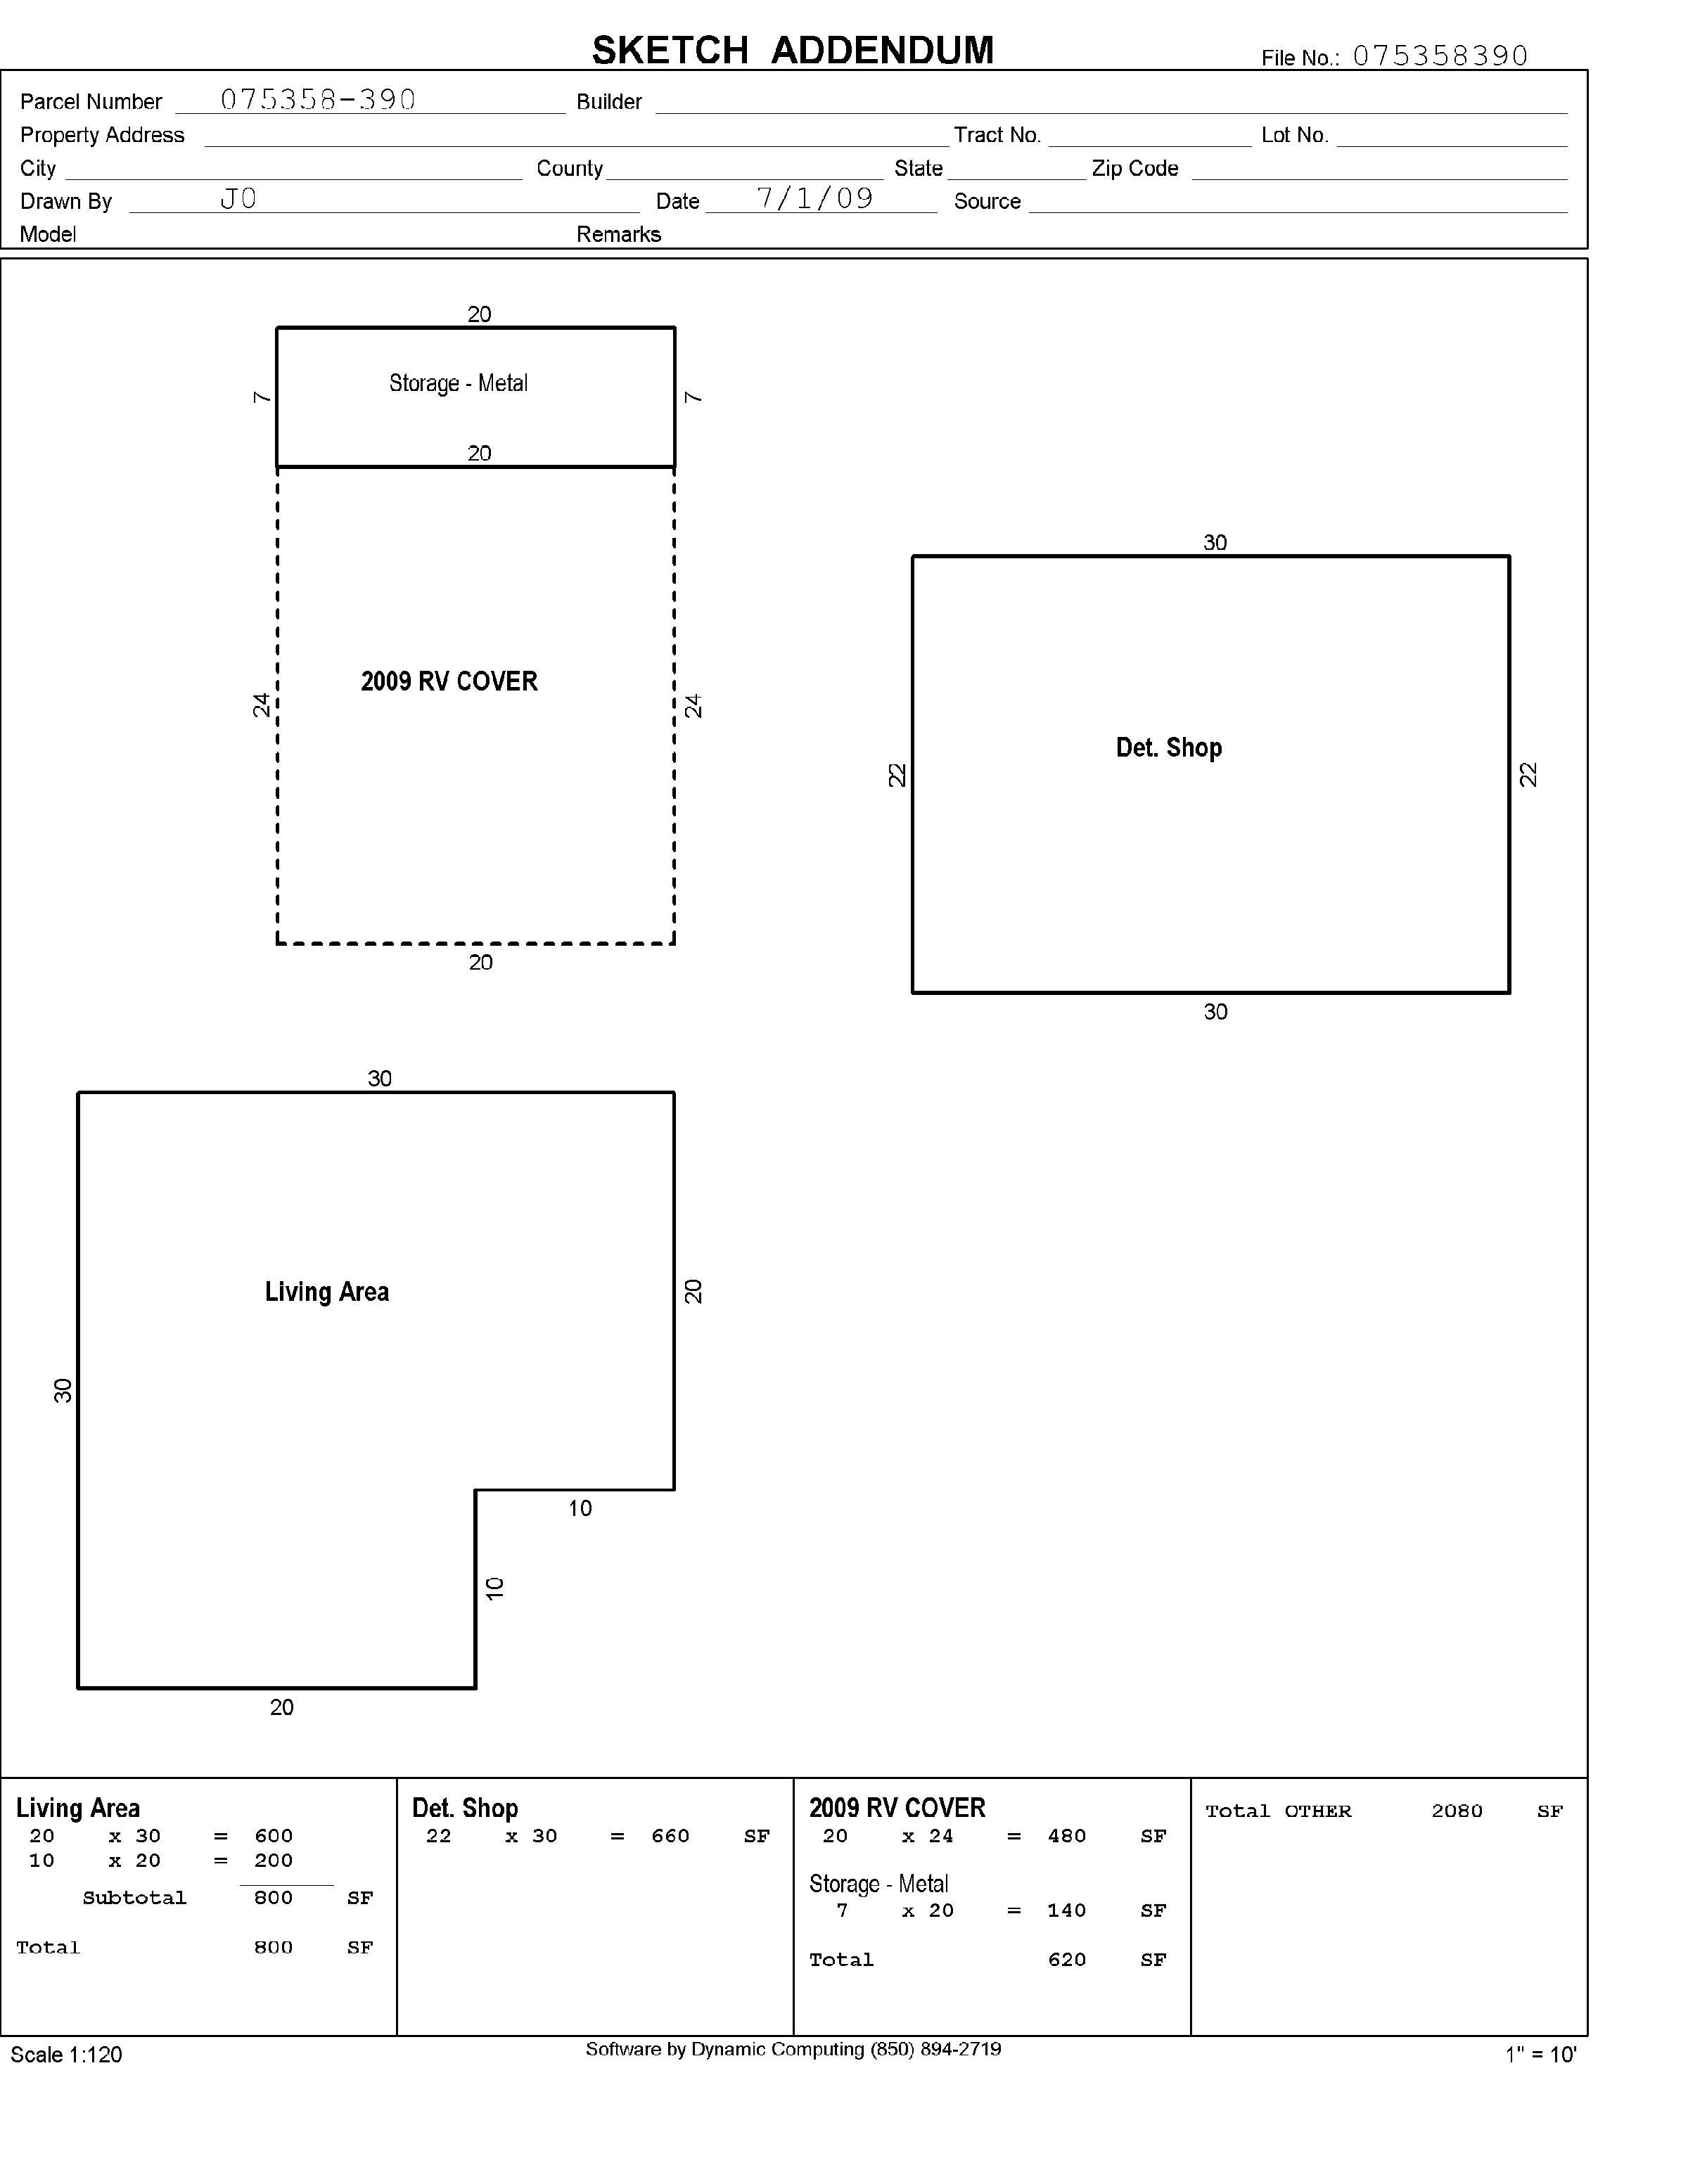
1stFloor:930SqFt
2ndFloor:
AC:
BsmtFin/Unfin:/ LotSize:029Acres(12,632SqFt)
LotWidth/Depth:240/56
Garage:
HeatSource:BB
Fireplace:
ImprType:01Ranch
Plat/Subdiv:MidlandAcresRplt
Map:570-A5
Waterfront:
Watershed:CityofWashougal-ColumbiaRiver
Recreation:
Latitude:45582489
Longitude:-122362928
SentryDynamics,Inc anditscustomersmakenorepresentations,warrantiesorconditions,expressorimplied,astotheaccuracyor completenessofinformationcontainedinthisreport
IMPROVEMENT1
BldgDesc:CONVENTIONAL Stories:1
Bedrooms:2
Baths,Full:1
Baths,3/4:
1stFloor:930SqFt
2ndFloor:
YearBuilt:1934(1950)
Baths,1/2: BsmtFin:
Baths,1/4: BsmtUnfin:
Deck:
BldgFinTotal:930SqFt
ParcelID:075358390
Description:RANCH
Condition:AVERAGE
Use:RESIDENTIAL
Quality:
RoofingMatl:CMP
Garage:
Carport:
ExtWall:SS AC: #Fireplaces:1
HeatType:BB
%Complete:10000%
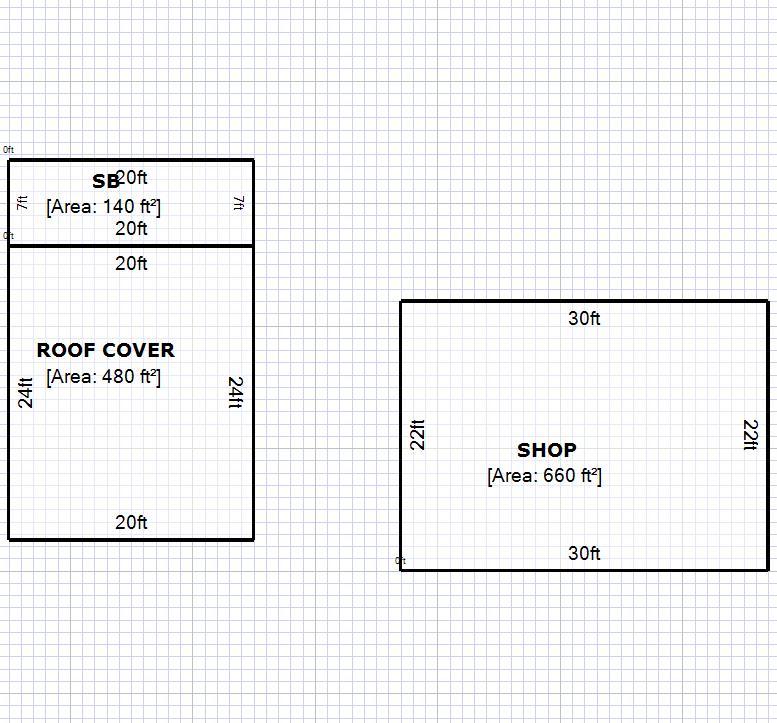
BldgDesc:OUTBUILDING
ParcelID:075358390
Stories: Description:
Bedrooms: 1stFloor: Condition:AVERAGE
Baths,Full: 2ndFloor: Use:OUTBUILDING
Baths,3/4: YearBuilt:1934(1934) Quality:
Baths,1/2: BsmtFin: RoofingMatl:RL
Baths,1/4: BsmtUnfin: Garage:
Deck: BldgFinTotal: Carport:
ExtWall:WD AC: #Fireplaces:0
HeatType: %Complete:10000%
ParcelID:075358390
SiteAddress:5659thSt
SentryDynamics,Inc anditscustomersmakenorepresentations, warrantiesorconditions,expressorimplied,astotheaccuracyor completenessofinformationcontainedinthisreport
ParcelID:075358390
SentryDynamics,Inc anditscustomersmakenorepresentations, warrantiesorconditions,expressorimplied,astotheaccuracyor completenessofinformationcontainedinthisreport
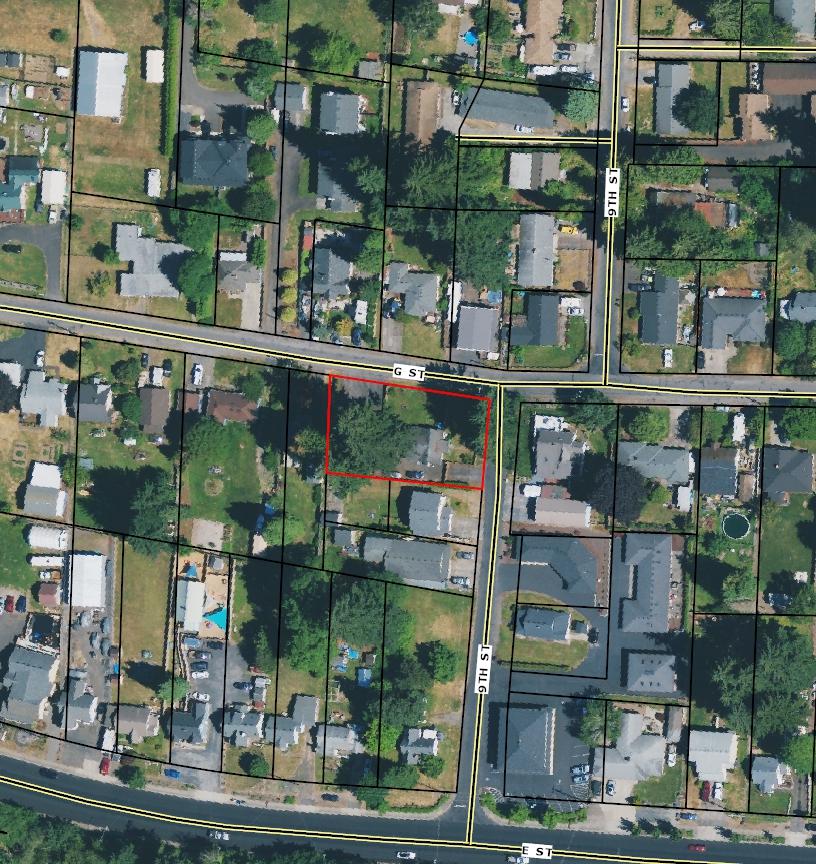
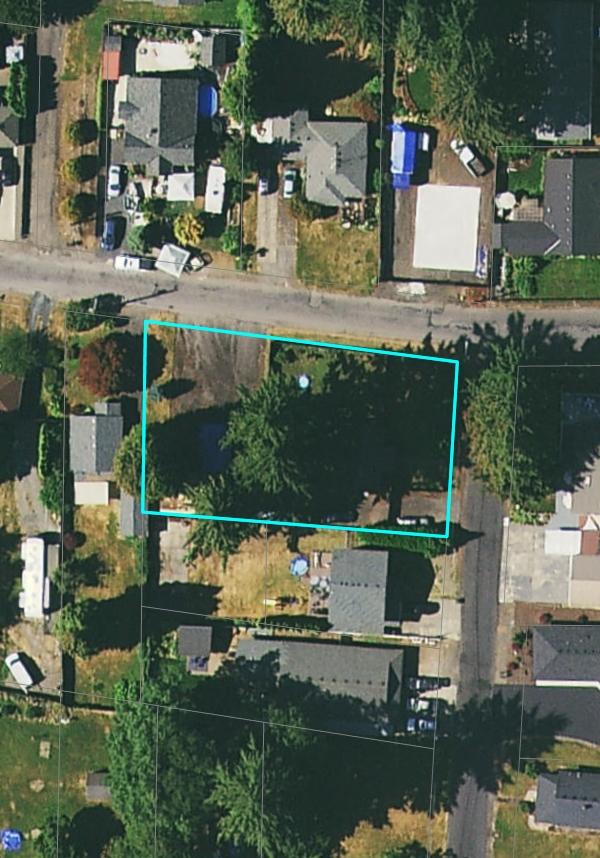
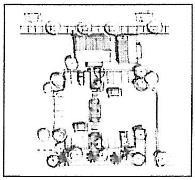
AerialMap
Account Summary
Property Identification Number: 75358390 MapsOnline Fact Sheet
Property Type: Real Property Status: Active Site Address: 565 9TH ST, WASHOUGAL, WA 98671 (Situs Addresses)
Abbreviated Description: REPLAT OF MIDLAND ACRES LOT 41 & #3 LOT 42 BLK 1
Tax Status: Regular
Info for Senior/Disabled Property Tax Exemption
Property Owner MASON MARY
9TH ST
WA , 98671
Property assessment value is valid as of the date printed on the linked notice of value. The notice of value will not reflect any updates to property value that occurred after the notice mail date Please contact the Assessor's office if you have a question about your assessed value
If you have questions concerning the data on this page, please contact the Clark County Assessor’s Office. Main Phone: (564) 397-2391, Email: assessor@clark.wa.gov
Land & Building Details
Property Identification Number: 75358390 MapsOnline Fact Sheet
Property Type: Real
Property Status: Active
Site Address: 565 9TH ST, WASHOUGAL, WA 98671 (Situs Addresses)
Abbreviated Description: REPLAT OF MIDLAND ACRES LOT 41 & #3 LOT 42 BLK 1
Tax Status: Regular
Info for Senior/Disabled Property Tax Exemption
If you have questions concerning the data on this page, please contact the Clark County Assessor’s Office. Main Phone: (564) 397-2391, Email: assessor@clark.wa.gov
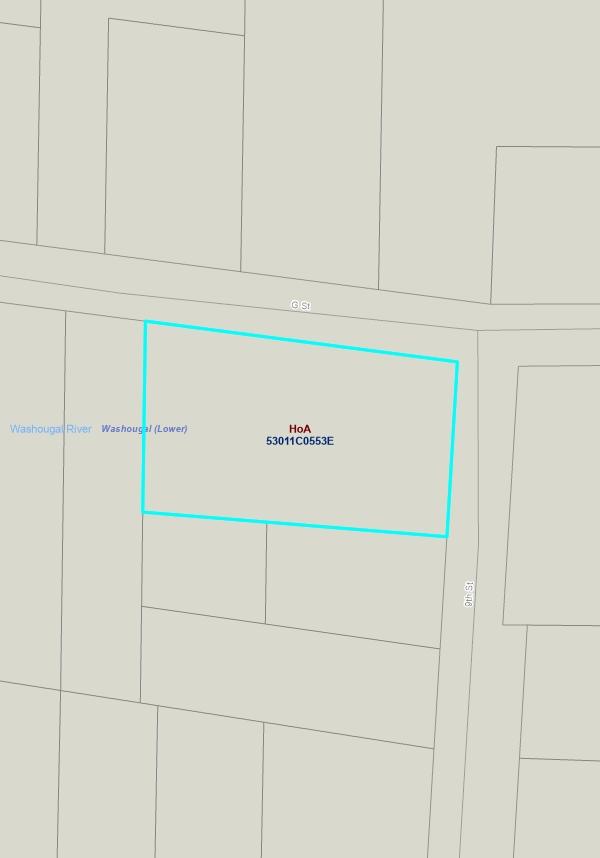
Environmental Constraints
Property Identification Number: 75358390 MapsOnline Fact Sheet
Property Type: Real
Property Status: Active
Site Address: 565 9TH ST, WASHOUGAL, WA 98671 (Situs Addresses)
Abbreviated Description: REPLAT OF MIDLAND ACRES LOT 41 & #3 LOT 42 BLK 1
Tax Status: Regular
Info for Senior/Disabled Property Tax Exemption
Cultural Resources
Archaeological Probability: High
Archaeological Site Buffer: No
Historic Site: No Mapping Indicators
Forest Practice Moratorium Info...
none
Geological Hazards Info...
Geological Hazard:
Liquefaction: Very Low
NEHRP Class: C
Slope Stability:
Habitat and Species Resources Info...
Habitat and Species Impacts: No Mapping Indicators
Wetlands and Soil Types
Critical Aquifer Recharge Area: Category 2 Recharge Areas
FEMA Map / FIRM
Panel: Info
53011C0553E
FEMA Flood Map Service Center
Flood Hazard Area: Info... Outside Flood Area
Shoreline
Designation: none
Soil Types / Class: Non-Hydric / HoA
Water Resource
Inventory Area:
Name: SALMONWASHOUGAL
Sub-Basin: Washougal
Watershed: Washougal River
Sub Watershed: Washougal (Lower)
Wetland Class: No Mapping Indicators
Wetland Inventory: Info... No Mapping Indicators
Septic Document Details
none
Water Well Details
none
If you have any questions concerning the data on this page, please contact the land use department in your jurisdiction. For properties not within a city limits, contact Clark County Community Development. Main Phone: (564) 397-2375, Email: commdev@clark.wa.gov
Property Identification Number: 75358390 MapsOnline Fact Sheet Property Type: Real
Status: Active
Address: 565 9TH ST, WASHOUGAL, WA 98671 (Situs Addresses) Abbreviated Description: REPLAT OF MIDLAND ACRES LOT 41 & #3 LOT 42 BLK 1
If you have any questions concerning the data on this page, please contact Clark County Treasurer's Office. Main Phone: (564) 397-2252, Email: treasoff@clark.wa.gov
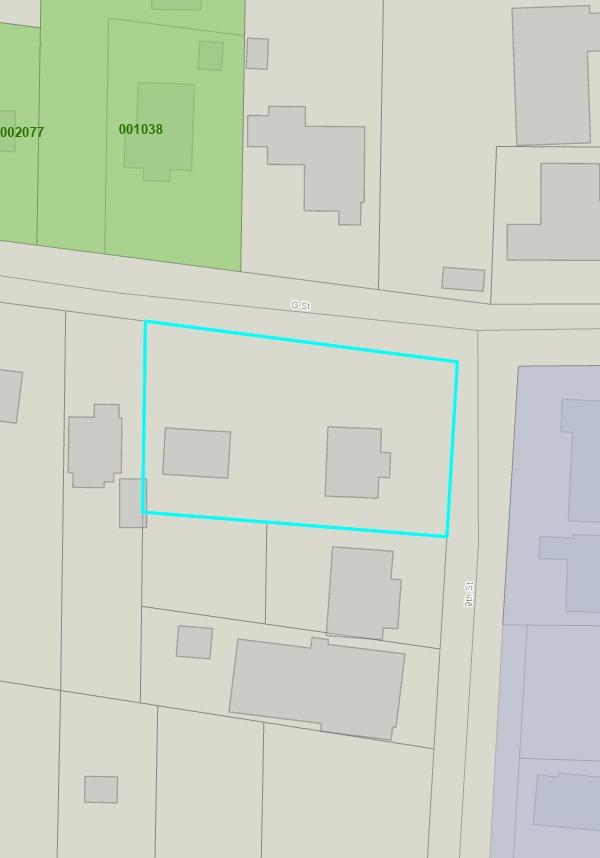
Aerial
Transportation
Environmental Public Health
Slopes & Geologic Hazards
Soils, Wetlands & Natural Resources
Surveys
Utilities (Water & Sewer lines)
Legend Notes:
Taxlots
This map was generated by Clark County's "MapsOnline" website. Clark County does not warrant the accuracy, reliability or timeliness of any information on this map, and shall not be held liable for losses caused by using this information. Taxlot (i.e., parcel) boundaries cannot be used to determine the location of property lines on the ground.


4,514 1:
Legend Notes:
Bridge
C-Tran Bus Stop
C-Tran Facilities
C-Tran Transit Center
C-Tran Park and Ride
C-TRAN Routes
Road Route Systems
State Route
Battle Ground Route
LaCenter Route
Other Municipal Route
Vancouver Route County Route
Proposed Route
Concurrency Route
Bike Routes
Bike Lanes or wide shoulders, usually on higher
Shared Roadway, on lower traffic street
Shared Roadway, with wider outside Lane on higher traffic street
Difficult Connection
Shared Roadway/Difficult Connection, lower traffic sight limitations and higher speeds
Paved Multi-use Paths, closed to motor vehicles
Unpaved Multi-use Paths, closed to motor vehicles
Cyclists Prohibited
Planned Bikeways
Railroad Crossings
All Roads Interstate State Route Arterial
Forest Arterial
Minor Collector
Forest Collector
Private or Other
Building Footprints
Taxlots
This map was generated by Clark County's "MapsOnline" website. Clark County does not warrant the accuracy, reliability or timeliness of any information on this map, and shall not be held liable for losses caused by using this information. Taxlot (i.e., parcel) boundaries cannot be used to determine the location of property lines on the ground.
1:
1,128
Legend Notes:
188.0
WGS_1984_Web_Mercator_Auxiliary_Sphere
Clark County, WA. GIS - http://gis.clark.wa.gov

1,128 1:
Taxlots
Percent Slope
0-5 percent
>5-10 percent
>10-15 percent
>15-25 percent
>25-40 percent
>40-80 percent
>80 percent
Steep Slopes and Landslide Hazard Areas
Areas of Historic or Active Landslides
Areas of Potential Instability
Areas of Older Landslide Debris
Slopes > 15%
Slopes > 25%
This map was generated by Clark County's "MapsOnline" website. Clark County does not warrant the accuracy, reliability or timeliness of any information on this map, and shall not be held liable for losses caused by using this information. Taxlot (i.e., parcel) boundaries cannot be used to determine the location of property lines on the ground.
564
Legend
Taxlots
FIRM Panels
Base Flood Elevation
Flood Zone Designation Floodway
Floodway Fringe
500 Year Flood Area
Area Not Studied
Soil Type
Potential Wetlands Presence
Permitted Wetland
NWI Wetland
Modeled Wetland
Depth to Water
10 ft
20 ft
30 ft
Watershed
Sub-Watershed
Notes:
This map was generated by Clark County's "MapsOnline" website. Clark County does not warrant the accuracy, reliability or timeliness of any information on this map, and shall not be held liable for losses caused by using this information. Taxlot (i.e., parcel) boundaries cannot be used to determine the location of property lines on the ground.
564
Legend Notes:
Survey - Recorded
Survey - Unrecorded
Survey - Performed by County Building Footprints
Taxlots
564
Legend Notes:
Sanitary Sewer Water Line
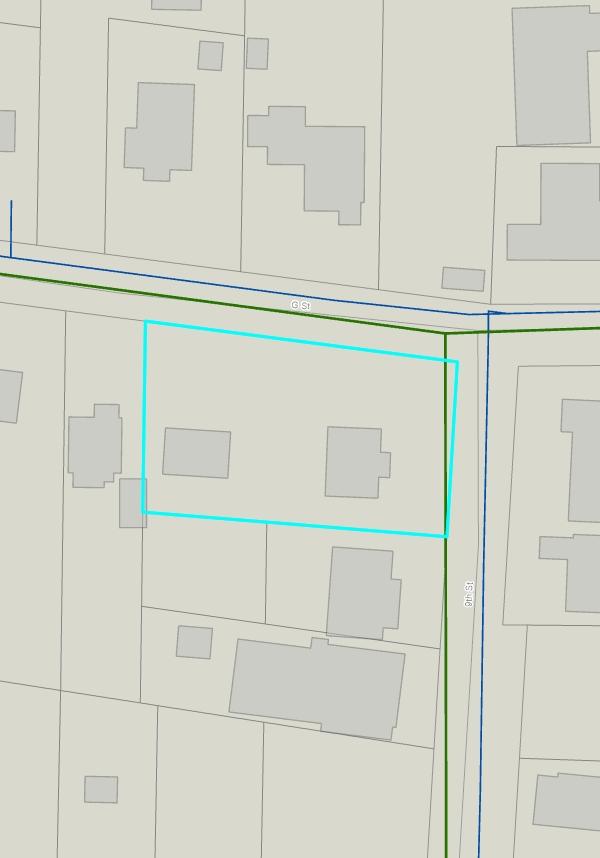
Building Footprints
Taxlots
Zoning Map
Detailed Zoning Information
CC (Community Commercial)
The information contained is provided by WFG’s Customer Service Department to our customers, and while deemed reliable, is not guaranteed.
1,128 1:
Legend Notes:
Single-Family residential (R1-20, R-20)
Single-Family residential (R1-15, R-15)
Single-Family residential - 12 (R-12)
Single-Family residential (R1-10, R-10, R10)
Single-Family residential (R1-7.5, R-7.5, LDR-7.5)
Single-Family residential (R1-6, R-6, LDR-6)
Single-Family residential (R1-5)
Residential (R-12, R12)
Residential (R-18, MF-18)
Residential (R-22, AR-22)
Residential (R-30)
Residential (R-43)
Office residential-15 (OR-15)
Office residential-18 (OR-18)
Office residential-22 (OR-22)
Office residential-30 (OR-30)
Office residential-43 (OR-43)
Neighborhood commercial (NC, C1, CN, CNB)
Community commercial (CC, C2, CCB)
General commercial (GC, CG)
Mixed use (MX)
Business park (BP, OFF)
Light industrial (IL, ML, LI, IND, LI/EC, WE)
Heavy industrial (IH, MH, HI)
University (U)
Airport (A)
Public facilities (PF, IP, UP)
Rural-5 (R-5)
Rural-10 (R-10)
Rural-20 (R-20)
Rural center residential 1 ac min (RC-1)
Rural center residential 2.5 ac min (RC-2.5)
Rural comm.-inside rur.centers (CR-2)
Rural comm.-outside rur.center (CR-1)
Agriculture-20 (AG-20)
Agriculture/Wildlife (AG/WL)
Parks/Open Space (P/OS)
Parks/Wildlife refuge (P/WL)
Forest tier II-40 (FR-40)
Forest-80 (FR-80)
Water
Low density residential-2 du/ac (R-2)
Residential 3 units/acre (R3)
Single-family residential (R1-12.5)
This map was generated by Clark County's "MapsOnline" website. Clark County does not warrant the accuracy, reliability or timeliness of any information on this map, and shall not be held liable for losses caused by using this information. Taxlot (i.e., parcel) boundaries cannot be used to determine the location of property lines on the ground.
Low density residential-4 du/ac (R-4, RLD-4)
Sections:
18.32.010 Purposes.
18.32.020 Uses.
18.32.030 Lot performance standards.
18.32.040 Commercial site design standards.
18.32.050 Espresso stands – Drive-through.
18.32.060 Commercial recreational facilities (enclosed and unenclosed) – Design standards.
*Prior ordinance history: Ords 1167 and 1264
18 32 010 Purposes
(1) Convenience Commercial (CV)
(a)The intent of the convenience commercial district is to provide goods and services that cater to the frequent needs of residents in immediately surrounding neighborhoods This district is designed to be compatible with adjacent residential environments and provide easy accessibility to adjacent neighborhoods.The successful integration of these commercial districts adjacent to neighborhoods serves to reduce vehicle miles traveled and contributes to a more viable neighborhood atmosphere
(b) Convenience retail and service establishments are the only uses permitted in this district. Normally, the size of the site for a convenience commercial district does not exceed five acres, and typically does not contain more than five individual services or retail establishments Floor area limitations are imposed to ensure such services and establishments remain small in scale and compatible with the residential environment. Businesses catering to highway traffic are inappropriate due to large areas of parking, heavy traffic volumes, and potential nuisance characteristics such as noise from loudspeakers and odors from painting Uses that cater to a larger market area, such as major chain grocery stores, are too large in scale to be compatible with immediately adjacent neighborhoods
(a)The intent of this commercial district is to provide goods and services to a more regional rather than local market area
(b) Generally, the mix of permitted uses is intended to encourage a pedestrian-friendly environment, one that does not promote extensive vehicle travel For this reason, highway business uses are generally not permitted and industrial and storage operations that
necessitate truck traffic are only permitted as conditional uses if they can peacefully coexist in a pedestrian environment
(c) Development within this district is typically characterized by very large percentages of the lots occupied by buildings; few, if any, front, side and rear yards
(3) Highway Commercial District (CH) The highway commercial district is intended to acknowledge the existing highway orientation of a significant stock of commercial development. The purpose of these commercial areas is primarily to serve the needs of highway travelers, conveniently. Uses include intensive commercial activities and establishments that rely on highway-oriented, passerby traffic Characteristics of these sites include high visibility from highway traffic, large sites, and immediate highway access This district is not normally suitable adjacent to residential neighborhoods, without substantial mitigation efforts This district is designed to be the least restrictive of all the commercial districts and includes most every use permitted in the community commercial district. (Ord. 1849 § 1 (Exh.A), 2018; Ord. 1503 § 1, 2005; Ord. 1496 § 1, 2004; Ord. 1473 § 1, 2004; Ord. 1437 § 1, 2002; Ord. 1398 § 1 (Exh.A), 2000)
18.32.020 Uses.
Uses permitted, conditional and prohibited and their associated review procedures are listed in Table 18 32-1 If a use is not listed, it is understood to be prohibited In addition, all commercial uses shall comply with the commercial design standards at WMC 18 32 040, Commercial site design standards.
Table 18 32-1
1 New single-family residences
2. Existing residences without any increase in density
3 High density multifamily residential within a mixed use development (10 to 16 units/acre, including condominiums and townhouses*), up to 30 units/acre with retail/commercial on first floor and residential above
* Townhouses shall also comply with WMC 18 46 200
4. Mixed commercial and residential use, including professional offices
5 Residential and congregate care facilities
6. Sanitarium, convalescent and rest homes
B. Retail Trade.
1. Car washes
2 Commercial off-street parking facilities
*Allowed in CV if the site is currently surrounded on at least two sides by other commercial uses and has street frontage on E Street
6 Enclosed retail establishments, >50,000 square feet gross floor area
a. Apparel, shoe and accessory clothing stores
b. Automotive parts stores not involving repair
c Book, art and stationery stores
d Camera and photographic supply stores, luggage and leather goods stores
e Catalog and mail order stores
f Convenience stores
g Drug stores, proprietary stores and apothecaries
h Florists
i. Furniture, floor covering and home furnishing stores
j. Grocery and food stores including bakeries
k Hobby, toy and game shops
l. Jewelry, gift, novelty, souvenir and antique shops
m Liquor stores
n Musical instrument stores
o Newsstands
p Optical goods stores
q Paint, glass and wallpaper stores
r Pawnshops
s Record, tape and compact disc stores
t Sewing, needlework and piece goods stores
u Sporting goods and bicycle shops
v Tobacco stores
w Used merchandise stores
x Video rental and sales stores
y Watches and clock shops
7. Finished product retailers with primary fabrication or assembly on-site. Within an entirely enclosed building.
a. Uses of < 5,000 square feet gross floor area
b. Uses of 5,000 – 25,000 square feet gross floor area
c. Uses of 25,000 square feet gross floor area or greater
8 Manufactured home sales
9. Motorcycle sales
10 Motor vehicle dealers, new and used, including auto, truck trailer, boat, recreational vehicles and equipment subject to WMC 18 46 045
11. Quick vehicle servicing
12 Restaurants, with associated drinking places, alcoholic beverages *not including drive-in or drive-through facilities in CV
*Allowed in CV if the site is currently surrounded on at least two sides by other commercial uses and has street frontage on E Street
10 Business
a Accounting, auditing and bookkeeping services
b Advertising agencies
c Blueprinting and duplication services
d Commercial art and graphic design
e Computer and data processing
f Detective, protective and security system services
g Food catering
h Interior decorating
i. Locksmiths
j. Mailing agencies and mailbox rental
k Personnel services and employment agencies
l. Photocopying
m. Publications and business consulting firms
*Allowed in CV if the site is currently surrounded on at least two sides by other commercial uses and has street frontage on E Street
11 Churches (subject to WMC 18 46 090)
12 Contractor’s establishment, not including the outside storage of materials or equipment or the overnight parking of commercial vehicles
Frontage on Washougal River Road, 32nd Street or E Street required (subject to WMC 18.32.050).
16 Espresso (walk-up)
17. Health
a. Blood banks, oxygen and miscellaneous types of medical supplies and services
b. Medical and dental laboratories
c. Offices of doctors, dentists and other medical practitioners
*Allowed in CV if the site is currently surrounded on at least 2 sides by other commercial uses and has street frontage on E Street 18.
b Bed and breakfast inns
c Fraternal organizations
d Recreational vehicle parks and campgrounds
20. Miscellaneous
Funeral homes, mortuaries and mausoleums, pet grooming, taxidermists
21 Mini-warehouse not including outdoor storage of RV, boats, and rental equipment and supplies within the CC district
23 Personal < 2,500 square feet per floor > 2,500 square feet per floor
a Barber and beauty shop
b Coin-operated and full service laundries and dry cleaners (not including drivethrough facilities)
c Dance studios, schools and halls
d Photographic studios
e Shoe repair and shoeshine parlors
f Specialized instructional studios and schools
g Travel agencies
*Allowed in CV if the site is currently surrounded on at least 2 sides by other commercial uses and has street frontage on E Street
24 Professional offices (< 5,000 square feet per floor)
25 Professional offices (> 5,000 square feet per floor)
*Allowed in CV if the site is currently surrounded on at least 2 sides by other commercial uses and has street frontage on E Street
26 Public uses (see WMC 18 06 1000) including public parks, parkways, recreation facilities, trails, government administration buildings including police and fire stations, and community centers
(see WMC 18 06 1120) – buildings or structures used, owned, and operated by private utilities for public purpose including but not limited to electrical, gas, steam, or water distribution lines and systems, and electric power stations
P= Permitted subject to site plan review approval
C = Conditional use (public hearing before hearing examiner – discretionary decision)
X = Prohibited
MC = Minor conditional use (public hearing before hearing examiner
discretionary decision)
(Ord 1849 § 1 (Exh A), 2018; Ord 1807 § 2 (Exh A), 2016; Ord 1793 § 1 (Exh A), 2016; Ord 1764 § 2 (Exh A), 2014; Ord 1740 § 1 (Exh A), 2013; Ord 1613 § 1 (Exh A), 2008; Ord 1503 § 1, 2005; Ord 1496 § 1, 2004; Ord 1473 § 1, 2004; Ord 1451 § 1, 2003; Ord 1437 § 1, 2002; Ord 1422 § 1, 2001; Ord 1398 § 1 (Exh A), 2000)
18.32.030 Lot performance standards.
Table 18.32-2
Commercial Districts Dimensional Requirements
(A) Minimum lot area applies to all land uses, residential or nonresidential.
(B) Buffering and/or screening requirements may apply, as indicated inTable 18 48-1
(C) Community Commercial (CC) front, rear and side yard requirements as well as maximum height may be used in the CV zone district if the site is currently surrounded on at least two sides by other commercial uses and has street frontage along E Street If a commercial use abuts a residential zone or use, a B3 buffer is required
(D) No side yard setback required if abutting other light industrial uses
N/A= Not applicable, residential use not permitted
(Ord. 1758 § 1 (Exh.A), 2014; Ord. 1503 § 1, 2005; Ord. 1496 § 1, 2004; Ord. 1437 § 1, 2002; Ord. 1398 § 1 (Exh.A), 2000)
18.32.040 Commercial site design standards.
(1) General.These standards and guidelines shall apply to all property zoned commercial within the city of Washougal.
(2) Site Design.
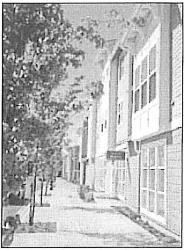
(a) Sidewalks and StreetTrees (seeAppendixA, Figures 1 through 3).
Intent: to maintain a continuous, safe and consistent street frontage and character.
(i) Sidewalk area shall maintain a clear zone of five feet for pedestrian travel.
(ii) Within a development, sidewalks shall be continuous without gaps and connect to adjacent sidewalks, if any
(iii) Unless otherwise specified, sidewalk paving material shall be consistent with street frontage improvements of adjacent developments
(iv) Street trees shall be spaced equivalent to one every 30 feet in tree pits or four-footwide continuous planted area.Trees may be grouped.Tree pits may be planted or have pavers.
(v) Street trees shall be a minimum of 1.5 inches in caliper and approved by the city.
(b) Plazas, Courtyards and SeatingAreas (seeAppendixA, Figures 4 through 6).
Intent: to provide a friendly pedestrian environment by creating a variety of usable and interesting open spaces within private development.
(i) New buildings shall have plazas, courtyards, or other pedestrian spaces at or near their main entrances. Pedestrian spaces should be a minimum of one square foot of plaza per 100 square feet of building area
(ii) Plazas, courtyards and other pedestrian space should include at least three of the following:
(A) Special interest landscape
(B) Pedestrian scale bollard or other accent lighting
(C) Special paving, such as colored/stained concrete, brick, or other unit paver
(D) Public art.
(E) Seating, such as benches, tables, or low seating walls.
(F) Water feature.
(G)An element not listed here that meets the intent.
(c) Setbacks (seeAppendixA, Figures 7 and 8).
Intent: to establish active, lively uses within close proximity to the sidewalk.
(i) Commercial buildings shall be set as close as possible to the sidewalk.
(ii) Major portions of single buildings shall abut the sidewalk In multi-building developments, one or more buildings shall be set to the sidewalk.
(iii) Buildings at the corners of intersections should be set back from the corner property lines to allow for both a more generous sidewalk and additional street landscaping.
(d) Lighting (seeAppendixA, Figures 9 through 11).
Intent: to ensure that lighting contributes to the character of the streetscape and does not disturb adjacent developments and residences
(i) Use city-approved standardized fixtures for sidewalk lighting
(ii) Lighting elements throughout and surrounding the site should be complementary, including pedestrian pathway, accent and parking lot lighting, lighting of adjacent developments and the public right-of-way.
(iii)All lighting should be shielded from the sky and adjacent properties and structures, either through exterior shields or through optics within the fixture.
(iv) Lighting used in parking lots shall not exceed a maximum of 30 feet in height. Pedestrian scale lighting shall be a maximum of 16 feet in height.
(v) Parking lot lighting should be appropriate to create adequate visibility at night and evenly distributed to increase security.
(vi) Lighting design should comply with the Illuminating Engineering Society of North America’s Recommended Practices and Design Guidelines, latest editions, or other publication approved by the city, for each applicable lighting type (i e , parking lots, walkways, etc )
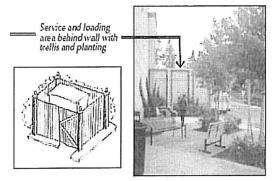
(e) Screening ofTrash and ServiceAreas (seeAppendixA, Figure 12)
Intent: to screen trash and service areas from public view
All loading docks and trash collection areas shall be screened by a combination of planting and architectural treatment (masonry, wood) similar to the design of the building and shall not be located between the building and the street frontage unless no other location is reasonable.
(f) Curb Cuts (seeAppendixA, Figure 13).
Intent: to enhance pedestrian safety by consolidating driveways, while providing for adequate vehicular and service access.
Adjacent developments should share driveways to the greatest extent possible (cross-over agreements between properties strongly encouraged).
(g) Drive-Thru Lanes (seeAppendixA, Figure 14).
Intent: to reduce vehicle/pedestrian conflicts and improve the pedestrian environment.
Drive-thru lanes should not be allowed between the building and the public right-of-way unless reasonably impractical.
(h) Location and Screening of Parking (seeAppendixA, Figures 15 through 18).
Intent: to locate parking lots in areas that are as visually unobtrusive as possible while also maintaining visibility for public safety
(i) New development should locate parking lots behind buildings when possible
(ii) Where parking lots are allowed to remain in front of or beside buildings, parking lots shall be screened adjacent to the right-of-way with one or a combination of the following treatments:
(A) Low walls made of concrete, masonry, or other similar material and not exceeding a maximum height of three feet.
(B) Raised planter walls planted with a minimum 80 percent of evergreen shrubs not to exceed a total height of three feet, including planter wall and landscape planting.
(C) Landscape plantings consisting of trees of which at least 80 percent are deciduous and shrubs and groundcover materials of which at least 80 percent are evergreen Aclear view between three and eight feet above the ground shall be maintained
(D) Bioretention facilities Aclear view between three and eight feet above the surrounding grade shall be maintained
(E)An element not listed here that meets the intent
(iii) Walls and raised planters shall not exceed a maximum height of three feet, unless all of the following are provided:
(A) Screen treatment does not create a safety hazard
(B) Portion of treatment that is above three feet in height is a minimum 75 percent transparent (i e , see-through metal railing, trellis, or other similar treatment)
(C) Portion of wall/landscape treatment that is above three feet in height provides added visual interest, detail, and character suitable to the character of the development.
(iv) Fencing around parking lots shall be allowed if the following conditions are met:
(A)All screen fencing should not exceed a maximum height of six feet, and any portion higher than three feet must be 75 percent transparent.
(B) Fencing and architectural details shall complement the materials used in the development.
(C) Chain link fencing, coated or uncoated, shall not be used on any street frontage or adjacent public sidewalk
(i) Parking Lot Landscape (seeAppendixA, Figures 19 through 21)
Intent: to reduce the visual impact of parking lots through landscaped areas and/or architectural features that complement the overall design and character of development
(i) Parking lot landscape should reinforce pedestrian and vehicular circulation, especially parking lot entrances, ends of driving aisles, and pedestrian walkways leading through parking lots.
(ii)The number of trees required in the interior landscape area in parking lots shall be dependent upon the location of the parking lot in relation to the building and public rightof-way:
(A) Where the parking lot is located between the building and the public right-of-way, one tree for every four spaces shall be provided
(B) Where the parking lot is located to the side of the building and partially abuts the public right-of-way, one tree for every six spaces shall be provided
(C) Where the parking lot is located behind the building and is not visible from the public right-of-way, one tree for every eight spaces shall be provided
(D) Required street trees may be counted towards these ratios if they screen the parking lot
(E)Trees planted within bioretention facilities may be counted toward these ratios if they screen the parking lot
(iii)To protect vegetation, a minimum four-foot area from the base shall be provided for all trees and shrubs where vehicle overhang extends into landscape areas.
(j) Pedestrian Connections (seeAppendixA, Figures 22 through 24)
Intent: to create a network of safe and attractive linkages for pedestrians
(i) Clearly defined pedestrian connections not less than five feet wide shall be provided:
(A) Between a public right-of-way and building entrances
(B) Between parking lots and building entrances
(ii) Pedestrian connections should be clearly defined in a combination of two or more of the following ways:
(A) Six-inch vertical curb
(B)Trellis
(C) Special railing
(D) Bollards
(E) Special paving
(F) Low seat wall and/or other architectural features
(G)Acontinuous landscape area a minimum of three feet wide on at least one side of the walkway, except when walkway crosses vehicular travel lanes
(H) Pedestrian scale lighting, bollard lighting, accent lighting, or combination thereof to aid in pedestrian way finding
(I)An element not listed here that meets the intent
(3) Building Design
(a) Orientation to the Street (seeAppendixA, Figures 25 and 26)
Intent: to ensure that buildings contribute to the liveliness of streets and overall community character
(i) Buildings, along with trees and landscaping, shall be predominant rather than parking lots and freestanding signs
(ii) People traveling along arterial streets should be able to see storefronts, windows, merchandise, and other aspects of business activity
(b) Entrances (seeAppendixA, Figures 27 through 29)
Intent: to ensure that entrances are easily identifiable and accessible from streets and sidewalks.
(i) Principal building entry shall be visible from the street and marked by at least one element from GroupAand one element from Group B:
GroupA:
Large entry doors
Recessed entrance
Protruding entrance
Plaza entrance
Group B: Canopy
Portico
Overhang
(ii) Weather Protection Canopies and awnings shall be provided along facades that give access to the building Minimum depth of any sidewalk canopy shall be five feet The
vertical dimension between the underside of a canopy and the sidewalk shall be at least eight feet and no more than 12 feet, except for vehicle entrances
(c) Massing/Articulation (seeAppendixA, Figures 30 through 32)
Intent: to reduce the apparent bulk of multi-story buildings and buildings over 30 feet and maintain pedestrian scale
(i) Buildings will distinguish a base at ground level using articulation and materials such as stone, masonry, or decorative concrete
(ii)The top of the building will emphasize a distinct profile or outline with elements such as a projecting parapet, cornice, upper level setback or pitched roofline.
(iii)The middle of the building may be distinguished by a change in materials or color, windows, balconies, stepbacks and signage.
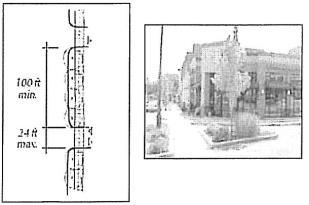
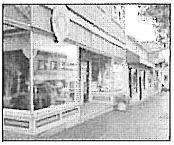
(d)Transparency (seeAppendixA, Figures 33 and 34).
Intent: to provide a visual connection between activities inside and outside of buildings.
(i)Aminimum of 15 percent of any ground floor facade* that is visible from any street shall be comprised of windows with clear, “vision” glass.
(ii)Aminimum of 30 percent of any ground floor facade* located closer than 60 feet to an arterial street shall be comprised of windows with clear, “vision” glass.
(iii)Aminimum of 60 percent of any ground floor facade* located closer than 20 feet to an arterial street shall be comprised of windows with clear, “vision” glass Display windows may be used to meet this requirement
(iv) For portions of facades that do not have windows, see guidelines for blank wall treatments
*The portion of the facade between two feet and 12 feet above grade
(e) Ground Level Details (seeAppendixA, Figures 35 and 36)
Intent: to reinforce the character of the streetscape by encouraging the greatest amount of visual interest along the ground level of buildings
Facades of commercial and mixed-use buildings that face the street shall be designed to be pedestrian-friendly through the inclusion of at least three of the following elements:
(i) Kickplates for storefront windows;
(ii) Projecting window sills;
(iii) Pedestrian scale signs;
(iv) Canopies;
(v) Plinths;
(vi) Containers for seasonal plantings;
(vii) Ornamental tilework;
(viii) Medallions;
(ix) Lighting or hanging baskets supported by ornamental brackets;
(x)An element not listed here that meets the intent.
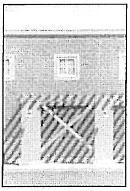
(f) Blank WallTreatments (seeAppendixA, Figures 37 and 38).
Intent: to reduce the visual impact of blank walls by providing visual interest.
Blank walls longer than 30 feet facing streets or visible from residential areas shall incorporate two or more of the following:
(i) Vegetation, such as trees, shrubs, ground cover and/or vines adjacent to the wall surface
(ii)Artwork, such as bas-relief sculpture, murals, or trellis structures.
(iii) Seating area with special paving and seasonal plantings.
(iv)Architectural detailing, reveals, contrasting materials or other special visual interest.
(g) Roofline (seeAppendixA, Figures 39 and 40).
Intent: to ensure that rooflines present a distinct profile and appearance for the building and express the neighborhood character.
Commercial buildings with flat roofs shall have extended parapets and projecting cornices to create a prominent edge when viewed against the sky Cornices shall be made of a different material and color than the predominant siding of the building
(h) Screening Rooftop Equipment (seeAppendixA, Figures 41 and 42)
Intent: to screen rooftop mechanical and communications equipment from the ground level of nearby streets and residential areas of the same elevation
(i) Mechanical equipment shall be screened by an extended parapet wall or other roof forms that are integrated with the architecture of the building
(ii) Communication equipment should be blended in with the design of the roofs rather than being merely attached to the roof deck All communication equipment shall be subject to Chapter 18.74 WMC,Telecommunications.
(a) Creativity (seeAppendixA, Figures 43 through 47)
Intent: to encourage interesting, creative and unique approaches to the design of signage
(i) Projecting signs, supported by ornamental brackets and oriented to pedestrians, are strongly encouraged
(ii)All signage shall comply with Chapter 18 60 WMC, Sign Regulations
(b) Historic Signage (seeAppendixA, Figures 48 through 52)
Intent: to preserve the unique character of Washougal
Retain existing historic signs that feature the character of the area, wherever possible
(c) Pedestrian-Oriented Signs (seeAppendixA, Figures 53 through 56).
Intent: to provide signs that complement and strengthen the pedestrian use of the commercial zones
(i) Pedestrian signs include projecting signs (blade signs), window signs (painted on glass or hung behind glass), logo signs (symbols, shapes), wall signs over entrance,Aboard and freestanding sidewalk signs
(ii)All signage shall comply with Chapter 18 60 WMC, Sign Regulations
AppendixA
Design Standards and Guidelines for Commercial Zones
Figure 1 Five-foot wide clear and continuous pedestrian zone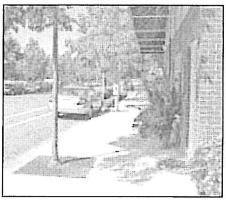
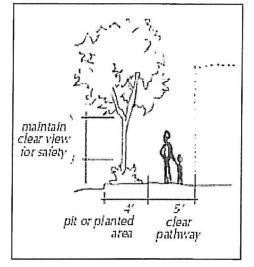
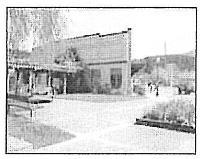 Figure 2
Street trees in grates
Figure 3
Figure 4
Plaza with seating and landscaping
Figure 5
Figure 2
Street trees in grates
Figure 3
Figure 4
Plaza with seating and landscaping
Figure 5
Half-circle of shared seating area within a private development
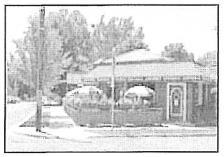
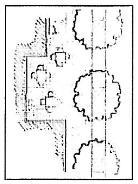
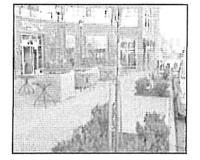 Figure 6
Accessible and visible open space
Figure 7
Varied setback from sidewalk
Figure 8
Figure 6
Accessible and visible open space
Figure 7
Varied setback from sidewalk
Figure 8
Setback at intersection for patron seating
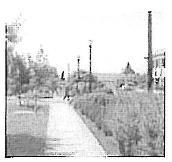
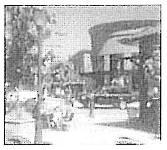
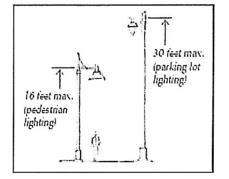 Figure 9
Light fixtures shall be shielded from the sky
Figure 10
Pedestrian scale lighting
Figure 11
Site and parking lot lighting
Figure 12
Figure 9
Light fixtures shall be shielded from the sky
Figure 10
Pedestrian scale lighting
Figure 11
Site and parking lot lighting
Figure 12
 Screening of service area
Figure 13
Pedestrian-friendly driveway
Figure 14
Drive-thru located at the rear of the building
Figure 15
Screening of service area
Figure 13
Pedestrian-friendly driveway
Figure 14
Drive-thru located at the rear of the building
Figure 15
Rear parking screened from adjacent residences
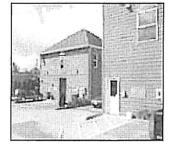
 Figure 16
Parking located beside building
Figure 17
Rear parking
Figure 18
Low masonry wall with landscaping
Figure 19
Figure 16
Parking located beside building
Figure 17
Rear parking
Figure 18
Low masonry wall with landscaping
Figure 19
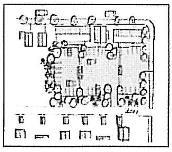
Trees at a 1:6 ratio in a consolidated parking lot
Trees contribute to shopping experiences
 Figure 20
Figure 21
Landscaped “fingers” break up the expanse of asphalt
Figure 22
Figure 20
Figure 21
Landscaped “fingers” break up the expanse of asphalt
Figure 22
Five-foot wide pedestrian connection through rear parking lot
Figure 23
Connections provide safety and comfort in large parking lots
Figure 24
Connection combined with lighting and trees
Figure 25
Storefronts and entrances should open up towards the street
Buildings should enhance the activity on the street
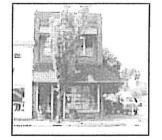 Figure 26
Figure 27
Recessed entrance
Figure 28
Large entrance and portico
Figure 29
Weather protection along front facade
Figure 26
Figure 27
Recessed entrance
Figure 28
Large entrance and portico
Figure 29
Weather protection along front facade
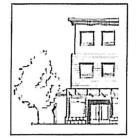
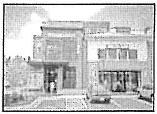
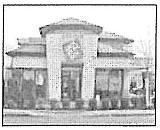
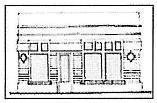
 Figure 30
Distinct base, middle, and top
Figure 31
Figure 32
Figure 33
60 percent transparency
Figure 34
Figure 30
Distinct base, middle, and top
Figure 31
Figure 32
Figure 33
60 percent transparency
Figure 34
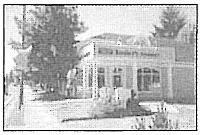
Large clear windows allow businesses to thrive
Avariety of details at the ground level attracts people and activity
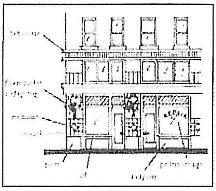 Figure 35
Figure 36
Figure 37
Trellis with vines next to a garage entrance
Figure 38
Figure 35
Figure 36
Figure 37
Trellis with vines next to a garage entrance
Figure 38
Figure 39
Pitched roof profile may provide a more gentle transition to nearby residential uses
Figure 40
Figure 41
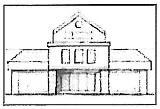
Figure 42
 Architectural details and trellis
Distinct building presence on the street
Mechanical equipment screened from pedestrians
Architectural details and trellis
Distinct building presence on the street
Mechanical equipment screened from pedestrians
 Figure 43
Figure 44
Figure 45
Figure 46
Figure 47
Figure 43
Figure 44
Figure 45
Figure 46
Figure 47
 Figure 48
Figure 49
Figure 50
Figure 51
Figure 52
Figure 48
Figure 49
Figure 50
Figure 51
Figure 52
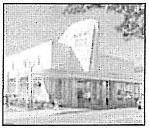
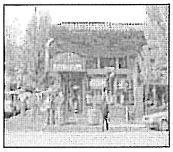 Figure 53
Figure 54
Figure 55
Figure 56
Figure 53
Figure 54
Figure 55
Figure 56
(Ord 1821 § 1 (Att A), 2016; Ord 1591 § 1, 2007; Ord 1503 § 1, 2005; Ord 1398 § 1 (Exh A), 2000)
18 32 050 Espresso stands – Drive-through
The design requirements for drive-through espresso stands, where permitted by site plan review approval, are:
(1) On-site circulation shall be provided for the espresso stand that is designed to accommodate a free flow of vehicles that does not conflict with any other uses on the same site or traffic circulation on the site.
(2) Drive-through lanes shall be designed to accommodate awaiting vehicles so that vehicle stacking does not extend into public streets or other connecting travel lanes on the same site.
(3) Drive-through espresso stands are to meet the development standards of this code and site plan review criteria as found in Chapter 18.88 WMC and the commercial site design standards including signage as found in Chapter 18 60 WMC
(4)Transportation studies in compliance with Chapter 18.90 WMC may be required of applicants for drive-through espresso stands regarding traffic loading, traffic circulation, and the impacts upon the transportation level of service on adjoining streets and roads (Ord 1886 § 1 (Exh A), 2019; Ord 1613 § 1 (Exh A), 2008; Ord 1422 § 1, 2001)
18.32.060 Commercial recreational facilities (enclosed and unenclosed) – Design standards. The design requirements for commercial recreational facilities, where permitted by site plan review approval and/or conditional use, are:
(1) Building design and construction shall provide the following:
(a) Solid masonry or concrete on all walls.
(b) Sound baffling to assure noise levels not greater than 60 dBAat the outside of the building as determined by an acoustical engineer.
(c)Air ventilation and filtration system capable of removing dangerous levels of smoke and particulates, as determined by OSHAstandards.
(2) Hearing protection devices shall be required for all persons exposed to noise levels above 75 dBA
(3)Air emission permit shall be obtained from Southwest Washington CleanAirAgency prior to occupancy permit
(4) Baffling to assure noise levels do not exceed 60 dBAin waiting areas and 50 dBAin an office area.
(5)Avariance may be available to the noise level standard, depending on adjacent use and the use proposed.
(6)The hours of commercial recreational facilities shall be limited to 7:00 a.m. to 10:00 p.m. (Ord. 1451 § 1, 2003)
INFORMATION
Traffic Counts
The information contained is provided by WFG’s Customer Service Department to our customers, and while deemed reliable, is not guaranteed.

565 9th St, Washougal, WA 98671 Sitewise Online
Pop-Facts: Demographic Snapshot (Part 2)
Copyright © Claritas, LLC 2022. All rights reserved.
* This row intentionally left blank. No Total Category.
**1939 will appear when at least half of the Housing Units in this reports area were built in 1939 or earlier.
565 9th St, Washougal, WA 98671 Sitewise Online
Pop-Facts: Census Demographic Overview (Part 1)
Pop-Facts:
* GAFO (General merchandise, Apparel, Furniture and Other) represents sales at stores that sell merchandise normally sold in department stores. This category is not included in Total Retail Sales Including Eating and Drinking Places.
Retail Store Types
Retail Market Power data is derived from two major sources of information. The demand data is derived from the Consumer Expenditure Survey (CE Survey or CEX), which is fielded by the U.S. Bureau of Labor Statistics (BLS). The supply data is derived from the Census of Retail Trade (CRT), which is made available by the U.S. Census. Additional data sources are incorporated to create both supply and demand estimates. The difference between demand and supply represents the opportunity gap or surplus available for each merchandise line in the specified reporting geography. When this difference is positive (demand is greater than the supply), there is an opportunity gap for that merchandise line; when the difference is negative (supply is greater than demand), there is a surplus.
Copyright © 2022 Environics Analytics. All rights reserved.
565 9th St, Washougal, WA 98671
June 21, 2023
 Powered