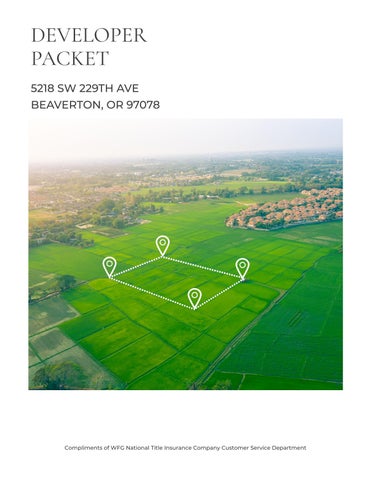
ZONING
DETAILS
Detailed Zoning Information
FD-20 (Future Development 20-Acre District)
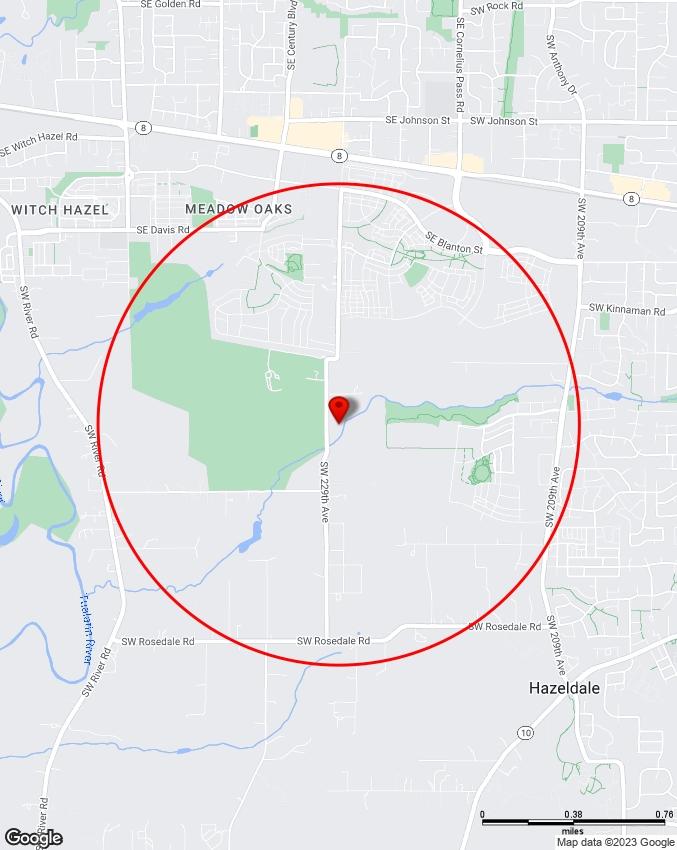
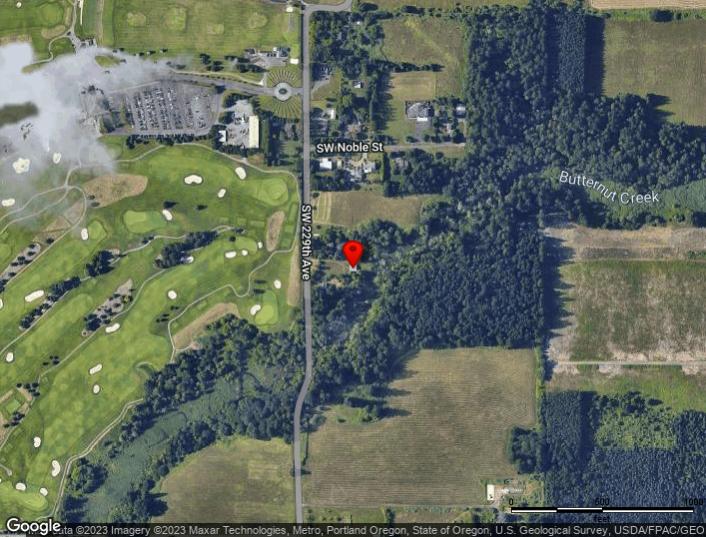
Zoning Map
Community Jurisdiction
The information contained is provided by WFG’s Customer Service Department to our customers, and while deemed reliable, is not guaranteed.

Intent and Purpose
The FD-20 District applies to the unincorporated urban lands added to the urban growth boundary by Metro through a Major or Legislative Amendment process after 1998 The FD-20 District recognizes the desirability of encouraging and retaining limited interim uses until the urban comprehensive planning for future urban development of these areas is complete. The provisions of this District are also intended to implement the requirements of Metro's Urban Growth Management Functional Plan.
Uses Permitted Through a Type I Procedure:
The following uses may be permitted unless specified otherwise by the applicable Community Plan or Policy 41 of the Comprehensive Framework Plan for the Urban Area. These uses are permitted subject to the specific standards for the use set forth below and in applicable Special Use Sections of Section 430, as well as the general standards for the District, the Development Standards of Article IV and all other applicable standards of this Code.
Accessory Uses and Structures - Section 430-1.
Any Type II or III use, expansion of an existing use or change of use which meets all of the following:
Is exempt from application of the Public Facility Standards under Section 501-2 or meets the standards for a Type I review pursuant to Section 501-3.2;
Is not in an Area of Special Concern as designated on the applicable Community Plan or the Future Development Areas Map in Policy 41 of the Comprehensive Framework Plan for the Urban Area;
Is on an existing lot; Does not amend any previous approval or previous condition of approval;
Is in compliance with all applicable standards of this Code; and
Is not a telecommunication facility.
Bus Shelter - Section 430-23.
Detached Dwelling Unit (one) - when a city's future comprehensive plan designation for the subject property is single-family residential; or when the county land use district that was applicable to the property prior to designating the subject property FD-20 permitted a detached dwelling through a Type I procedure - Section 430-37.1 A. and 430-37.1 B.(1) & (2).
Home Occupation - Section 430-63 1
Parks - Section 430-97; see also Section 308-7.1.
308-1 308-2 308-2.1 308-2.2 A B C. D E. F. 308-2.3 308-2.4 308-2 5 308-2.6 308-2.7 308 - FUTURE DEVELOPMENT 20-ACRE DISTRICT (FD-20)
Public and Private Conservation areas and structures for the conservation of water, soil, open space, forest or wildlife resources.
Temporary Use - Section 430-135 1, excluding C (9) and J
Manufactured Home - Section 430-76.
Co-location of antennas, excluding those antennas exempt pursuant to Sections 430-109 3 and 201-2 - Section 430-109; see also Section 308-7.1.
New Telecommunication Facilities with Towers using Stealth Design to a maximum height of 100 feet and new Small Wireless Facilities, excluding those facilities exempt pursuant to Sections 430-109.3 and 201-2 - Section 430-109; see also Section 308-7.1.
Accessory Dwelling Unit(s) - only with an existing or approved detached dwelling unit that complies with 308-2.4 - Section 430-2.1.
( Ord. No. 826A, § 2.A.(Exh. 1, § 9), 10-24-17 , eff. 11-24-17; Ord. No. 831A , § 2.A.(Exh. 1, § 9), 7-17-18, eff. 816-18; Ord. No. 855 , § 2.A.(Exh. 1, § 9), 8-6-19, eff. 11-28-19; Ord. No. 856A , § 2.A.(Exh. 1, § 8), 10-22-19, eff. 11-28-19; Ord No 859 , § 2 A (Exh 1, § 8), 9-17-19, eff 11-28-19)
Uses Permitted Through a Type II Procedure
The following uses may be permitted unless specified otherwise by the applicable Community Plan or Policy 41 of the Comprehensive Framework Plan for the Urban Area These uses are permitted subject to the specific standards for the use set forth below and in applicable Special Use Sections of Section 430, as well as the general standards for the District, the Development Standards of Article IV and all other applicable standards of the Code. Approval may be further conditioned by the Review Authority pursuant to Section 207-5.
Home Occupation - Section 430-63.2.
Parks - Section 430-97; see also Section 308-7.1.
Construction of a local street not in conjunction with a development application or within existing right-of-way.
Temporary Use - Section 430-135.2 A. and B.
Expansion of Existing Telecommunication Facilities, including co-located antennas, not otherwise allowed through a Type I Procedure pursuant to Section 430-109.5 or exempt pursuant to Sections 430-109 3 and 201-2 - Section 430-109; see also Section 308-7 1
Day Care Facility - 430-53.2 I., except as prohibited in Areas of Special Concern 4, 5, 6 and 7 in Policy 41 of the Comprehensive Framework Plan for the Urban Area, Area of Special Concern 1 in the West Union Community Plan and Areas of Special Concern 6 and 7 in the East Hillsboro Community Plan.
308-2 8 308-2.9 308-2 10 308-2 11 308-2.12 308-3 308-3.1 308-3.2 308-3.3 308-3.4 308-3.5 308-3.6 308-3.7
Tree removal in areas identified in the applicable Community Plan as Significant Natural Resources, Section 407-3.
( Ord No 826A, § 2 A (Exh 1, § 9), 10-24-17 , eff 11-24-17; Ord No 832A , § 2 A (Exh 1, § 9), 9-18-18, eff 1018-18)
Uses Which May Be Permitted Through a Type III Procedure
The following uses may be permitted unless specified otherwise by the applicable Community Plan or Policy 41 of the Comprehensive Framework Plan for the Urban Area. These uses may be permitted subject to the specific standards for the use set forth below and in applicable Special Use Sections of Section 430, as well as the general standards for the District, the Development Standards of Article IV and all other applicable standards of the Code. Approval may be further conditioned by the Review Authority pursuant to Section 207-5.
Cemetery - Section 430-27 , except as prohibited in Areas of Special Concern 4, 5, 6 and 7 in Policy 41 of the Comprehensive Framework Plan for the Urban Area, Area of Special Concern 1 in the West Union Community Plan and Areas of Special Concern 6 and 7 in the East Hillsboro Community Plan
Commercial Chicken or Rabbit Raising.
Commercial Greenhouse.
Commercial Equestrian Uses, including Training Tracks, Riding Arenas and Stables (See Boarding of Horses - Section 430-21)
Contractor's Establishment.
Day Care Facility - Section 430-53.2., except as prohibited in Areas of Special Concern 4, 5, 6 and 7 in Policy 41 of the Comprehensive Framework Plan for the Urban Area, Area of Special Concern 1 in the West Union Community Plan and Areas of Special Concern 6 and 7 in the East Hillsboro Community Plan.
Public Building - Section 430-103; see also Section 308-7 1
Public Utility - Section 430-105; see also Section 308-7.1. New Telecommunication Facilities with towers not using Stealth Design, to a maximum height of 100 feet - Section 430-109; see also Section 308-7.1.
School - Section 430-121 , except as prohibited in Areas of Special Concern 4, 5, 6 and 7 in Policy 41 of the Comprehensive Framework Plan for the Urban Area, Area of Special Concern 1 in the West Union Community Plan and Areas of Special Concern 6 and 7 in the East Hillsboro Community Plan.
Religious Institution - Section 430-116 except as prohibited in Areas of Special Concern 7 and 9 in Policy 41 of the Comprehensive Framework Plan for the Urban Area, and Areas of Special
308-4 308-4 1 308-4.2 308-4.3 308-4.4 308-4.5 308-4.6 308-4
308-4.8 308-4
308-4
308-4.11
7
9
10
Concern 6, 7 and 8 in the East Hillsboro Community Plan; see also Section 308-7 1
( Ord. No. 826A, § 2.A.(Exh. 1, § 9), 10-24-17 , eff. 11-24-17)
Prohibited Uses
Structures or uses not specifically authorized in Section 308, except as listed under Section 201-2 (Exclusions from Permit Requirement).
Structures or uses prohibited by the applicable Community Plan or Policy 41 of the Comprehensive Framework Plan for the Urban Area.
The use of a recreational vehicle as a residence except where specifically authorized as a temporary use in Sections 308-2.8 and 308-3.4 or as allowed under Section 201-2 (Exclusions from Permit Requirement)
The outdoor parking or storage of any five or more vehicles on a single lot or parcel for more than 48 hours, except as approved in conjunction with a development or as allowed under Section 201-2 (Exclusions from Permit Requirement).
Keeping of fowl for sale, keeping of swine (except for up to three purebred potbelly pigs as household pets and not for breeding purposes) or operating a feed lot, except as provided in Section 308-4.2.
Mounting a communication tower or antenna, that is not a permitted accessory use, on a detached dwelling.
Mounting an antenna, that is not a permitted accessory use, on a communication tower that is accessory to a detached dwelling.
Auto wrecking yards
Any parking or storage of tractor-trailers, semi-trucks, or heavy equipment, except in conjunction with an approved development or with a farm or forest use
Any recreational marijuana activity or use that requires a license from the Oregon Liquor Control Commission
( Ord. No. 810, § 2.A.(Exh. 1, § 7), 10-25-16 ; Ord. No. 867 , § 2.A.(Exh. 1, § 3), 9-1-20, eff. 10-1-20)
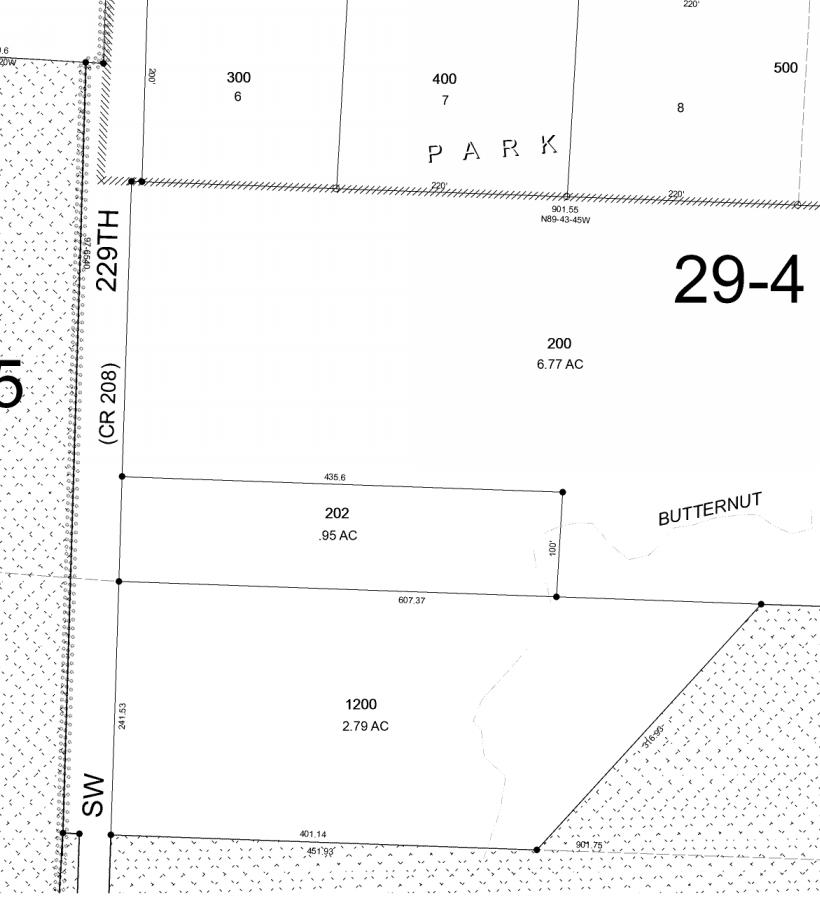
Dimensional Requirements
In applying the minimum lot size provisions of this District, the boundary lines used in the deed or sales contract shall be used. If a lot is bounded by a dedicated road, 50% of the area of the road contiguous to the lot shall be considered as a portion of the lot If the lot is severed by the road, 100% of the road area within the lot shall be considered a portion of the lot. This provision shall be liberally construed in favor of the landowner.
Lot Area:
308-5 308-5.1 308-5.2 308-5 3 308-5.4 308-5.5 308-5 6 308-5 7 308-5 8 308-5.9 308-5.10 308-6 308-6.1 A.
The minimum lot area shall be 20 acres unless specified otherwise by the applicable Community Plan or Policy 41 of the Comprehensive Framework Plan for the Urban Area, or as provided below.
Partitions or property line adjustments to create or reconfigure parcels less than 20 acres may be allowed for public facilities and services associated with the provision of sewer, water, school, fire, and park and recreation services. If the partition is required to accommodate the sale of land for the noted public facilities and services, application submittal materials shall include the following in order to demonstrate proof of a qualified service provider's intent to purchase the parcel(s) created through such a partition:
A letter of intent to purchase or signed purchase agreement from the applicable service provider for the proposed parcel(s), and Application by all the owners of the subject property and the service provider(s) intending to purchase the proposed parcel(s), or any person authorized in writing to act as agent of the owners or service providers.
In the North Bethany Subarea Plan, the minimum lot area for a property line adjustment may be less than 20 acres when the following requirements are met:
The proposed configuration of each parcel is consistent with the applicable land use district(s) shown on the Subarea Plan's "Future Land Use Designations" map;
The proposed configuration of each parcel is consistent with the dimensional standards of the applicable land use district shown on the "Future Land Use Designations" map or the lot dimensions of Section 308-6.4, whichever is greater; The proposed configuration of each parcel complies with any applicable requirements of the North Bethany Subarea Plan; and
The proposed configuration of each parcel complies with the provisions of Section 605-1.3.
Yard Requirements:
The minimum yard requirements shall be:
Thirty-foot front yard;
Ten-foot side yard;
Thirty-foot street side yard;
Twenty-five-foot rear yard;
Additional setbacks may be required as specified in Sections 411 and 418; and
Required yards shall be horizontally unobstructed except as provided by Section 418.
Height:
B (1) (2) C (1) (2) (3) (4) 308-6.2 A. B. C D. E F. 308-6.3
The maximum height for structures shall be 35 feet, except as modified by other Sections of this Code.
The maximum height for accessory structures shall be 15 feet except as modified by other Sections of this Code.
Normal building appurtenances and projections such as spires, belfries, cupolas, chimneys, ventilators, elevator housings or other structures placed on or extending above roof level may exceed the 35-foot building height limit to a maximum height of 60 feet.
The height of telecommunication facilities are regulated by the Permitted Use sections of this Land Use District, Sections 201, 430-1, 430-109 and other applicable provisions of this Code
For any detached dwelling or manufactured dwelling (except manufactured dwellings in a manufactured dwelling park or a manufactured dwelling approved as a temporary use), and their accessory structures, the maximum building height shall comply with the Solar Balance Point Standard in Section 427-4.
Lot Dimensions:
The minimum lot width at the street shall be 40 feet; The minimum lot width at the building line shall be 70 feet; and The minimum lot depth shall be 100 feet
Additional Standards
All new permitted uses shall be constructed in a manner which does not interfere with future conversion of the land to planned urban densities and/or uses.
Lawful nonconforming uses in the FD-20 District may be expanded or rebuilt to the limit of available services, through a Type II procedure when in conformance with the adopted Comprehensive Plan for the area. Expansion or replacement shall be subject to the provisions of development review and shall not include new uses.
Property in an Area of Special Concern on the Future Development Areas Map in the Comprehensive Framework Plan for the Urban Area is subject to the applicable Area of Special Concern provisions in Plan Policy 41.
Access
All lots in this District shall either:
Abut a public street; or
Have an easement of record at least 40 feet wide at the street or as approved by the appropriate fire marshal. In cases where no fire marshal has jurisdiction, the easement shall be subject to the standards of Fire District #1
A B C D. E. 308-6.4 A B. C 308-7 308-7.1 308-7 2 308-7.3 308-8 308-8.1 308-8.2
COMMUNITY
INFORMATION
Demographics
Traffic Counts
The information contained is provided by WFG’s Customer Service Department to our customers, and while deemed reliable, is not guaranteed.
5218 SW 229th Ave, Beaverton, OR 97007

5218 SW 229th Ave, Beaverton, OR 97007 Sitewise Online Pop-Facts: Population Quick Facts Pop-Facts: Population Quick Facts 5218 SW 229th Ave, Beaverton, OR 97007 0 - 1 mi Population 2027 Projection 1,271 2022 Estimate 1,179 2010 Census 858 2000 Census 528 Growth 2022-2027 7.79% Growth 2010-2022 37.40% Growth 2000-2010 62.39% 2022 Est. Population by Age 1,179 Age 0 to 4 80 6.78% Age 5 to 9 86 7.30% Age 10 to 14 89 7.51% Age 15 to 17 48 4.05% Age 18 to 20 42 3.58% Age 21 to 24 54 4.58% Age 25 to 34 165 13.96% Age 35 to 44 198 16.76% Age 45 to 54 154 13.05% Age 55 to 64 118 10.04% Age 65 to 74 89 7.56% Age 75 to 84 45 3.81% Age 85 and over 12 1.02% Age 16 and over 909 77.06% Age 18 and over 877 74.35% Age 21 and over 834 70.77% Age 65 and over 146 12.39% 2022 Est. Median Age 36.33 2022 Est. Average Age 36.70
2022 Est. Population by Single-Classification Race 1,179 White Alone 743 63.03% Black or African American Alone 37 3.14% American Indian and Alaska Native Alone 15 1.26% Asian Alone 231 19.61% Native Hawaiian and Other Pacific Islander Alone 19 1.65% Some Other Race Alone 67 5.68% Two or More Races 66 5.62% 2022 Est. Population by Ethnicity (Hispanic or Latino) 1,179 Hispanic or Latino 212 17.97% Not Hispanic or Latino 967 82.03% 2022 Est. Population by Sex 1,179 Male 609 51.64% Female 570 48.36%
5218 SW 229th Ave, Beaverton, OR 97007 Sitewise Online Pop-Facts: Population Quick Facts Pop-Facts: Population Quick Facts 5218 SW 229th Ave, Beaverton, OR 97007 0 - 1 mi
Copyright © Claritas, LLC 2022. All rights reserved.
5218 SW 229th Ave, Beaverton, OR 97007 Sitewise Online Pop-Facts: Household Quick Facts Pop-Facts: Household Quick Facts 5218 SW 229th Ave, Beaverton, OR 97007 0 - 1 mi Households 2027 Projection 420 2022 Estimate 390 2010 Census 285 2000 Census 171 Growth 2022-2027 7.65% Growth 2010-2022 36.73% Growth 2000-2010 66.48% 2022 Est. Households by Household Income 390 Income Less than $15,000 14 3.46% Income $15,000 to $24,999 9 2.19% Income $25,000 to $34,999 17 4.24% Income $35,000 to $49,999 24 6.05% Income $50,000 to $74,999 66 16.82% Income $75,000 to $99,999 67 17.16% Income $100,000 to $124,999 45 11.46% Income $125,000 to $149,999 38 9.65% Income $150,000 to $199,999 59 15.16% Income $200,000 to $249,999 31 7.85% Income $250,000 to $499,999 19 4.83% Income $500,000 or more 4 1.12% 2022 Est. Average Household Income $ 123,578 2022 Est. Median Household Income $ 100,160 2022 Median HH Inc. by Single-Classification Race White Alone $ 94,643 Black or African American Alone $ 112,500 American Indian and Alaska Native Alone $ 89,844 Asian Alone $ 124,621 Native Hawaiian and Other Pacific Islander Alone $ 134,375 Some Other Race Alone $ 76,220 Two or More Races $ 168,478 Hispanic or Latino $ 79,577 Not Hispanic or Latino $ 107,151 2022 Est. Households by Household Type 390 Family Households 301 77.13% Nonfamily Households 89 22.87% 2022 Est. Group Quarters Population 3
2022 Est. Households by Household Size 390 1-person 59 15.02% 2-person 132 33.89% 3-person 68 17.31% 4-person 69 17.60% 5-person 34 8.68% 6-person 17 4.34% 7-or-more-person 12 3.17% 2022 Est. Average Household Size 3.02 5218 SW 229th Ave, Beaverton, OR 97007 Sitewise Online Pop-Facts: Household Quick Facts Pop-Facts: Household Quick Facts 5218 SW 229th Ave, Beaverton, OR 97007 0 - 1 mi
2022 Est. HHs by Type by Presence of Own Children 301 Married-Couple Family, own children 119 39.44% Married-Couple Family, no own children 124 41.15% Male Householder, own children 12 3.98% Male Householder, no own children 11 3.60% Female Householder, own children 21 7.14% Female Householder, no own children 14 4.68% Copyright © Claritas, LLC 2022. All rights reserved. 5218 SW 229th Ave, Beaverton, OR 97007 Sitewise Online Pop-Facts: Household Quick Facts Pop-Facts: Household Quick Facts 5218 SW 229th Ave, Beaverton, OR 97007 0 - 1 mi
5218 SW 229th Ave, Beaverton, OR 97007 Sitewise Online Pop-Facts: Demographic Snapshot (Part 1) Pop-Facts: Demographic Snapshot (Part 1) 5218 SW 229th Ave, Beaverton, OR 97007 0 - 1 mi Population 2027 Projection 1,271 2022 Estimate 1,179 2010 Census 858 2000 Census 528 Growth 2022-2027 7.79% Growth 2010-2022 37.40% Growth 2000-2010 62.39% 2022 Est. Population by Single-Classification Race 1,179 White Alone 743 63.03% Black or African American Alone 37 3.14% American Indian and Alaska Native Alone 15 1.26% Asian Alone 231 19.61% Native Hawaiian and Other Pacific Islander Alone 19 1.65% Some Other Race Alone 67 5.68% Two or More Races 66 5.62% 2022 Est. Population Hispanic or Latino by Origin 1,179 Not Hispanic or Latino 967 82.03% Hispanic or Latino 212 17.97% Hispanic or Latino by Origin 212 Mexican 175 82.43% Puerto Rican 4 2.07% Cuban 2 0.99% All Other Hispanic or Latino 31 14.50% 2022 Est. Hisp. or Latino Pop by Single-Classification Race 212 White Alone 118 55.50% Black or African American Alone 5 2.25% American Indian and Alaska Native Alone 6 2.97% Asian Alone 4 1.80% Native Hawaiian and Other Pacific Islander Alone 3 1.35% Some Other Race Alone 66 30.99% Two or More Races 11 5.14%
2022 Est. Pop by Race, Asian Alone, by Category 231 Chinese, except Taiwanese 15 6.28% Filipino 36 15.77% Japanese 18 7.84% Asian Indian 70 30.14% Korean 8 3.55% Vietnamese 32 13.96% Cambodian 0 0.00% Hmong 0 0.00% Laotian 17 7.18% Thai 8 3.30% All other Asian Races, including 2 or more 28 11.97% 2022 Est. Population by Ancestry 1,179 Arab 0 0.00% Czech 7 0.62% Danish 9 0.78% Dutch 10 0.81% English 66 5.59% French (except Basque) 30 2.56% French Canadian 0 0.00% German 121 10.28% Greek 13 1.12% Hungarian 4 0.31% Irish 52 4.37% Italian 38 3.21% Lithuanian 4 0.34% Norwegian 12 1.04% Polish 14 1.21% Portuguese 1 0.11% Russian 6 0.53% Scottish 22 1.89% Scotch-Irish 3 0.26% Slovak 4 0.36% Subsaharan African 36 3.09% Swedish 14 1.21% Swiss 3 0.29% Ukrainian 0 0.00% United States or American 26 2.19% Welsh 5 0.39% West Indian (except Hisp. groups) 1 0.10% Other Ancestries 530 44.95% Ancestry Unclassified 146 12.40% 2022 Est. Pop Age 5+ by Language Spoken At Home 1,099 Speak only English 783 71.20%
Pop-Facts: Demographic
Pop-Facts: Demographic Snapshot (Part 1) 5218 SW 229th Ave, Beaverton, OR 97007 0 - 1 mi
5218 SW 229th Ave, Beaverton, OR 97007 Sitewise Online
Snapshot (Part 1)
Speak Asian or Pacific Island Language 99 9.02% Speak IndoEuropean Language 46 4.15% Speak Spanish 157 14.24% Speak Other Language 15 1.39% 5218 SW 229th Ave, Beaverton, OR 97007 Sitewise Online Pop-Facts: Demographic Snapshot (Part 1) Pop-Facts: Demographic Snapshot (Part 1) 5218 SW 229th Ave, Beaverton, OR 97007 0 - 1 mi
2022 Est. Population by Sex 1,179 Male 609 51.64% Female 570 48.36% 2022 Est. Population by Age 1,179 Age 0 to 4 80 6.78% Age 5 to 9 86 7.30% Age 10 to 14 89 7.51% Age 15 to 17 48 4.05% Age 18 to 20 42 3.58% Age 21 to 24 54 4.58% Age 25 to 34 165 13.96% Age 35 to 44 198 16.76% Age 45 to 54 154 13.05% Age 55 to 64 118 10.04% Age 65 to 74 89 7.56% Age 75 to 84 45 3.81% Age 85 and over 12 1.02% Age 16 and over 909 77.06% Age 18 and over 877 74.35% Age 21 and over 834 70.77% Age 65 and over 146 12.39% 2022 Est. Median Age 36.33 2022 Est. Average Age 36.70
5218 SW 229th Ave, Beaverton, OR 97007 Sitewise Online
Demographic
5218
0 - 1 mi
Pop-Facts: Demographic Snapshot (Part 1)
Pop-Facts:
Snapshot (Part 1)
SW 229th Ave, Beaverton, OR 97007
2022 Est. Male Population by Age 609 Age 0 to 4 41 6.68% Age 5 to 9 44 7.28% Age 10 to 14 47 7.78% Age 15 to 17 25 4.17% Age 18 to 20 23 3.76% Age 21 to 24 29 4.77% Age 25 to 34 84 13.83% Age 35 to 44 103 16.84% Age 45 to 54 83 13.70% Age 55 to 64 58 9.50% Age 65 to 74 44 7.15% Age 75 to 84 22 3.67% Age 85 and over 5 0.88% 2022 Est. Median Age, Male 36.03 2022 Est. Average Age, Male 36.30 2022 Est. Female Population by Age 570 Age 0 to 4 39 6.90% Age 5 to 9 42 7.33% Age 10 to 14 41 7.23% Age 15 to 17 22 3.92% Age 18 to 20 19 3.38% Age 21 to 24 25 4.39% Age 25 to 34 80 14.09% Age 35 to 44 95 16.67% Age 45 to 54 70 12.35% Age 55 to 64 61 10.61% Age 65 to 74 46 8.00% Age 75 to 84 23 3.95% Age 85 and over 7 1.17% 2022 Est. Median Age, Female 36.66 2022 Est. Average Age, Female 37.20 5218 SW 229th Ave, Beaverton, OR 97007 Sitewise Online Pop-Facts: Demographic Snapshot (Part 1) Pop-Facts: Demographic Snapshot (Part 1) 5218 SW 229th Ave, Beaverton, OR 97007 0 - 1 mi
2022 Est. Pop Age 15+ by Marital Status 924 Total, Never Married 295 31.95% Males, Never Married 179 19.39% Females, Never Married 116 12.56% Married, Spouse present 490 53.06% Married, Spouse absent 12 1.26% Widowed 27 2.95% Males, Widowed 0 0.02% Females, Widowed 27 2.93% Divorced 100 10.78% Males, Divorced 42 4.56% Females, Divorced 57 6.22% 2022 Est. Pop Age 25+ by Edu. Attainment 780 Less than 9th grade 23 2.94% Some High School, no diploma 47 5.97% High School Graduate (or GED) 199 25.49% Some College, no degree 160 20.45% Associate Degree 55 7.00% Bachelor's Degree 174 22.26% Master's Degree 94 12.01% Professional School Degree 5 0.64% Doctorate Degree 25 3.25% 2022 Est. Pop. Age 25+ by Edu. Attain., Hisp./Lat. 104 No High School Diploma 23 22.49% High School Graduate 37 35.47% Some College or Associate's Degree 35 33.27% Bachelor's Degree or Higher 9 8.78% Copyright © Claritas, LLC 2022. All rights reserved. 5218 SW 229th Ave, Beaverton, OR 97007 Sitewise Online Pop-Facts: Demographic Snapshot (Part 1) Pop-Facts: Demographic Snapshot (Part 1) 5218 SW 229th Ave, Beaverton, OR 97007 0 - 1 mi
5218 SW 229th Ave, Beaverton, OR 97007 Sitewise Online Pop-Facts: Demographic Snapshot (Part 2) Pop-Facts: Demographic Snapshot (Part 2) 5218 SW 229th Ave, Beaverton, OR 97007 0 - 1 mi Households 2027 Projection 420 2022 Estimate 390 2010 Census 285 2000 Census 171 Growth 2022-2027 7.65% Growth 2010-2022 36.73% Growth 2000-2010 66.48% 2022 Est. Households by Household Type 390 Family Households 301 77.13% Nonfamily Households 89 22.87% 2022 Est. Group Quarters Population 3 2022 HHs by Ethnicity: Hispanic/Latino 48 12.38% 2022 Est. Households by HH Income 390 Income < $15,000 14 3.46% Income $15,000 to $24,999 9 2.19% Income $25,000 to $34,999 17 4.24% Income $35,000 to $49,999 24 6.05% Income $50,000 to $74,999 66 16.82% Income $75,000 to $99,999 67 17.16% Income $100,000 to $124,999 45 11.46% Income $125,000 to $149,999 38 9.65% Income $150,000 to $199,999 59 15.16% Income $200,000 to $249,999 31 7.85% Income $250,000 to $499,999 19 4.83% Income $500,000+ 4 1.12% 2022 Est. Average Household Income $ 123,578 2022 Est. Median Household Income $ 100,160 2022 Median HH Income by Single-Class. Race or Ethn. White Alone $ 94,643 Black or African American Alone $ 112,500 American Indian and Alaska Native Alone $ 89,844 Asian Alone $ 124,621 Native Hawaiian and Other Pacific Islander Alone $ 134,375 Some Other Race Alone $ 76,220 Two or More Races $ 168,478 Hispanic or Latino $ 79,577
Not Hispanic or Latino $ 107,151
Pop-Facts: Demographic
5218 SW 229th Ave,
97007 0 - 1 mi
5218 SW 229th Ave, Beaverton, OR 97007 Sitewise Online Pop-Facts: Demographic Snapshot (Part 2)
Snapshot (Part 2)
Beaverton, OR
2022 Est. Family HH Type by Presence of Own Children 301 Married-Couple Family, own children 119 39.44% Married-Couple Family, no own children 124 41.15% Male Householder, own children 12 3.98% Male Householder, no own children 11 3.60% Female Householder, own children 21 7.14% Female Householder, no own children 14 4.68% 2022 Est. Households by Household Size 390 1-person 59 15.02% 2-person 132 33.89% 3-person 68 17.31% 4-person 69 17.60% 5-person 34 8.68% 6-person 17 4.34% 7-or-more-person 12 3.17% 2022 Est. Average Household Size 3.02 2022 Est. Households by Presence of People Under 18 390 Households with 1 or more People under Age 18 167 42.76% Households with No People under Age 18 223 57.24% Households with 1 or more People under Age 18 167 Married-Couple Family 126 75.60% Other Family, Male Householder 13 7.75% Other Family, Female Householder 25 15.17% Nonfamily, Male Householder 2 1.25% Nonfamily, Female Householder 0 0.23% Households with No People under Age 18 223 Married-Couple Family 116 52.04% Other Family, Male Householder 10 4.43% Other Family, Female Householder 10 4.68% Nonfamily, Male Householder 52 23.25% Nonfamily, Female Householder 35 15.59%
Pop-Facts: Demographic Snapshot
Pop-Facts: Demographic Snapshot (Part 2) 5218 SW 229th Ave, Beaverton, OR 97007 0 - 1 mi
5218 SW 229th Ave, Beaverton, OR 97007 Sitewise Online
(Part 2)
2022 Est. Households by Number of Vehicles 390 No Vehicles 4 1.02% 1 Vehicle 95 24.33% 2 Vehicles 169 43.44% 3 Vehicles 58 14.87% 4 Vehicles 51 12.97% 5 or more Vehicles 13 3.36% 2022 Est. Average Number of Vehicles 2.30 Family Households 2027 Projection 324 2022 Estimate 301 2010 Census 220 2000 Census 133 Growth 2022-2027 7.65% Growth 2010-2022 36.73% Growth 2000-2010 65.52% 2022 Est. Families by Poverty Status 301 2022 Families at or Above Poverty 286 95.20% 2022 Families at or Above Poverty with Children 151 50.25% 2022 Families Below Poverty 14 4.80% 2022 Families Below Poverty with Children 12 4.05% 2022 Est. Pop Age 16+ by Employment Status 909 In Armed Forces 0 0.00% Civilian - Employed 611 67.26% Civilian - Unemployed 26 2.88% Not in Labor Force 271 29.86% 2022 Est. Civ. Employed Pop 16+ by Class of Worker 603 For-Profit Private Workers 426 70.54% Non-Profit Private Workers 54 9.02% Local Government Workers 49 8.07% State Government Workers 10 1.74% Federal Government Workers 9 1.49% Self-Employed Workers 55 9.15% Unpaid Family Workers 0 0.00% 5218 SW 229th Ave, Beaverton, OR 97007 Sitewise Online Pop-Facts: Demographic Snapshot (Part 2) Pop-Facts: Demographic Snapshot (Part 2) 5218 SW 229th Ave, Beaverton, OR 97007 0 - 1 mi
2022 Est. Civ. Employed Pop 16+ by Occupation 603 Architect/Engineer 64 10.66% Arts/Entertainment/Sports 15 2.47% Building Grounds Maintenance 18 2.91% Business/Financial Operations 47 7.75% Community/Social Services 12 2.03% Computer/Mathematical 33 5.51% Construction/Extraction 36 6.04% Education/Training/Library 41 6.80% Farming/Fishing/Forestry 11 1.90% Food Prep/Serving 22 3.67% Healthcare Practitioner/Technician 34 5.60% Healthcare Support 11 1.77% Maintenance Repair 14 2.25% Legal 2 0.28% Life/Physical/Social Science 2 0.41% Management 76 12.56% Office/Admin. Support 44 7.22% Production 36 6.01% Protective Service 6 1.04% Sales/Related 35 5.73% Personal Care/Service 6 0.98% Transportation/Moving 39 6.39% 2022 Est. Pop 16+ by Occupation Classification 603 Blue Collar 125 20.70% White Collar 404 67.03% Service & Farm 74 12.28% 2022 Est. Workers Age 16+ by Transp. To Work 597 Drove Alone 488 81.70% Car Pooled 45 7.49% Public Transportation 9 1.47% Walked 16 2.75% Bicycle 0 0.00% Other Means 0 0.00% Worked at Home 39 6.59% 2022 Est. Workers Age 16+ by Travel Time to Work* Less than 15 minutes 132 15 to 29 Minutes 259 30 to 44 Minutes 70 45 to 59 Minutes 56 60 or more Minutes 41 5218
Sitewise Online Pop-Facts: Demographic
2) Pop-Facts: Demographic Snapshot (Part 2) 5218 SW 229th Ave, Beaverton, OR 97007 0 - 1 mi
SW 229th Ave, Beaverton, OR 97007
Snapshot (Part
2022 Est. Avg. Travel Time to Work in Minutes* 28.07 2022 Est. Occupied Housing Units by Tenure 390 Owner-Occupied 296 75.82% Renter-Occupied 94 24.18% 2022 Occupied Housing Units: Avg. Length of Residence Owner-Occupied 12 Renter-Occupied 5 5218 SW 229th Ave, Beaverton, OR 97007 Sitewise Online Pop-Facts: Demographic Snapshot (Part 2) Pop-Facts: Demographic Snapshot (Part 2) 5218 SW 229th Ave, Beaverton, OR 97007 0 - 1 mi
2022 Est. Owner Occupied Housing Units by Value 296 Value Less than $20,000 1 0.45% Value $20,000 to $39,999 2 0.71% Value $40,000 to $59,999 0 0.00% Value $60,000 to $79,999 0 0.00% Value $80,000 to $99,999 0 0.00% Value $100,000 to $149,999 1 0.19% Value $150,000 to $199,999 2 0.71% Value $200,000 to $299,999 12 4.18% Value $300,000 to $399,999 67 22.77% Value $400,000 to $499,999 84 28.30% Value $500,000 to $749,999 66 22.38% Value $750,000 to $999,999 29 9.84% Value $1,000,000 to $1,499,999 22 7.46% Value $1,500,000 to $1,999,999 6 1.86% Value $2,000,000 or more 3 1.16% 2022 Est. Median All Owner-Occupied Housing Unit Value $ 474,205 2022 Est. Housing Units by Units in Structure 403 1 Unit Attached 55 13.74% 1 Unit Detached 323 80.17% 2 Units 12 2.88% 3 or 4 Units 7 1.70% 5 to 19 Units 0 0.00% 20 to 49 Units 0 0.00% 50 or More Units 0 0.00% Mobile Home or Trailer 6 1.51% Boat, RV, Van, etc. 0 0.00% Dominant structure type 1 Unit Detached 2022 Est. Housing Units by Year Structure Built 403 Housing Units Built 2014 or Later 138 34.37% Housing Units Built 2010 to 2013 35 8.73% Housing Units Built 2000 to 2009 103 25.54% Housing Units Built 1990 to 1999 34 8.45% Housing Units Built 1980 to 1989 35 8.64% Housing Units Built 1970 to 1979 29 7.13% Housing Units Built 1960 to 1969 9 2.31% Housing Units Built 1950 to 1959 7 1.65% Housing Units Built 1940 to 1949 5 1.18% Housing Units Built 1939 or Earlier 8 1.98% 2022 Est. Median Year Structure Built** 2007 Dominant Year Structure Built 2014 or Later 5218 SW 229th Ave, Beaverton, OR 97007 Sitewise Online Pop-Facts: Demographic Snapshot (Part 2) Pop-Facts: Demographic Snapshot (Part 2) 5218 SW 229th Ave, Beaverton, OR 97007 0 - 1 mi
5218 SW 229th Ave, Beaverton, OR 97007 Sitewise Online
Pop-Facts: Demographic Snapshot (Part 2)
Pop-Facts: Demographic Snapshot (Part 2)
Copyright © Claritas, LLC 2022. All rights reserved.
* This row intentionally left blank. No Total Category.
**1939 will appear when at least half of the Housing Units in this reports area were built in 1939 or earlier.
5218 SW 229th Ave, Beaverton, OR 97007 0 - 1 mi
5218 SW 229th Ave, Beaverton, OR 97007 Sitewise Online Pop-Facts: Census Demographic Overview (Part 1) Pop-Facts: Census Demographic Overview (Part 1) 5218 SW 229th Ave, Beaverton, OR 97007 0 - 1 mi Population 2027 Projection 1,271 2022 Estimate 1,179 2010 Census 858 2000 Census 528 Growth 2022-2027 7.79% Growth 2010-2022 37.40% Growth 2000-2010 62.39% 2010 Population by Single-Classification Race 858 White Alone 633 73.75% Black or African American Alone 15 1.76% American Indian and Alaska Native Alone 9 1.05% Asian Alone 82 9.59% Native Hawaiian and Other Pacific Islander Alone 11 1.25% Some Other Race Alone 72 8.34% Two or More Races 37 4.27% 2010 Population By Ethnicity 858 Not Hispanic or Latino 701 81.69% Hispanic or Latino 157 18.31% 2010 Hispanic or Latino by Single-Classification Race 157 White Alone 69 43.74% Black or African American Alone 3 1.82% American Indian and Alaska Native Alone 3 2.19% Asian Alone 2 1.34% Native Hawaiian and Other Pacific Islander Alone 2 1.22% Some Other Race Alone 71 45.08% Two or More Races 7 4.62% 2010 Population by Sex 858 Male 445 51.81% Female 413 48.19% Male/Female Ratio 1.08
2010 Population by Age 858 Age 0 to 4 75 8.70% Age 5 to 9 64 7.50% Age 10 to 14 64 7.50% Age 15 to 17 35 4.07% Age 18 to 20 27 3.11% Age 21 to 24 39 4.49% Age 25 to 34 157 18.31% Age 35 to 44 122 14.17% Age 45 to 54 114 13.33% Age 55 to 64 84 9.83% Age 65 to 74 48 5.61% Age 75 to 84 25 2.89% Age 85 and over 4 0.49% Age 16 and over 642 74.79% Age 18 and over 620 72.24% Age 21 and over 593 69.12% Age 65 and over 77 8.99% 2010 Median Age 32.99 5218 SW 229th Ave, Beaverton, OR 97007 Sitewise Online
Census Demographic Overview (Part 1) Pop-Facts: Census Demographic Overview (Part 1) 5218 SW 229th Ave, Beaverton, OR 97007 0 - 1 mi
Pop-Facts:
© Claritas, LLC 2022. All rights reserved.
2010 Male Population by Age 445 Age 0 to 4 41 9.15% Age 5 to 9 34 7.60% Age 10 to 14 35 7.90% Age 15 to 17 17 3.86% Age 18 to 20 14 3.22% Age 21 to 24 19 4.38% Age 25 to 34 80 17.95% Age 35 to 44 67 15.07% Age 45 to 54 57 12.71% Age 55 to 64 42 9.53% Age 65 to 74 24 5.41% Age 75 to 84 13 2.88% Age 85 and over 2 0.34% 2010 Median Age, Male 32.74 2010 Female Population by Age 413 Age 0 to 4 34 8.22% Age 5 to 9 31 7.39% Age 10 to 14 29 7.06% Age 15 to 17 18 4.29% Age 18 to 20 12 3.00% Age 21 to 24 19 4.62% Age 25 to 34 77 18.70% Age 35 to 44 55 13.20% Age 45 to 54 58 13.99% Age 55 to 64 42 10.16% Age 65 to 74 24 5.82% Age 75 to 84 12 2.91% Age 85 and over 3 0.65% 2010 Median Age, Female 33.25
5218
229th
Sitewise Online Pop-Facts: Census Demographic Overview (Part 1) Pop-Facts: Census Demographic Overview (Part 1) 5218 SW 229th Ave, Beaverton, OR 97007 0 - 1 mi
Copyright
SW
Ave, Beaverton, OR 97007
5218 SW 229th Ave, Beaverton, OR 97007 Sitewise Online Pop-Facts: Census Demographic Overview (Part 2) Pop-Facts: Census Demographic Overview (Part 2) 5218 SW 229th Ave, Beaverton, OR 97007 0 - 1 mi Households 2027 Projection 420 2022 Estimate 390 2010 Census 285 2000 Census 171 Growth 2022-2027 7.65% Growth 2010-2022 36.73% Growth 2000-2010 66.48% 2010 Households by Household Type 285 Family Households 220 77.13% Non-family Households 65 22.87% 2010 Group Quarters Population 2 2010 Hispanic or Latino Households 35 12.20% 2010 Households by Household Size 285 1-person 43 15.13% 2-person 97 34.13% 3-person 49 17.20% 4-person 50 17.67% 5-person 24 8.53% 6-person 12 4.27% 7-or-more-person 9 3.07%
2010 Households by Type and Presence of Children 285 Married-Couple Family, own children 87 30.40% Male Householder, own children 9 3.07% Female Householder, own children 16 5.53% Married-Couple Family, no own children 91 31.73% Male Householder, no own children 8 2.80% Female Householder, no own children 10 3.60% Non-family Households 65 22.87% 2010 Households by Presence of People Under Age 18 285 HH with 1 or More People Under Age 18: 122 42.73% Households with No People Under Age 18: 163 57.27% HH with 1 or More People Under Age 18: 122 Married-Couple Family 92 75.66% Other Family, Male Householder 10 7.80% Other Family, Female Householder 18 15.13% Nonfamily, Male Householder 2 1.25% Nonfamily, Female Householder 0 0.16% Households with No People Under Age 18: 163 Married-Couple Family 85 52.04% Other Family, Male Householder 7 4.42% Other Family, Female Householder 8 4.66% Nonfamily, Male Householder 38 23.28% Nonfamily, Female Householder 25 15.60% 2010 Occupied Housing Units by Tenure 285 Owner-Occupied 216 75.80% Renter-Occupied 69 24.20% Copyright © Claritas, LLC 2022. All rights reserved. 5218 SW 229th Ave, Beaverton, OR 97007 Sitewise Online Pop-Facts: Census Demographic Overview (Part 2) Pop-Facts: Census Demographic Overview (Part 2) 5218 SW 229th Ave, Beaverton, OR 97007 0 - 1 mi
5218 SW
Retail Market Power Opportunity Gap Report By Retail Store Types Retail Market Power Opportunity Gap Report By Retail Store Types 5218 SW 229th Ave, Beaverton, OR 97007 0 - 1 mi 2022 Demand 2022 Supply Opportunity Gap/Surplus Total retail trade including food and drink (NAICS 44, 45 and 722) $ 21,202,369 $ 21,852,509 - $ 650,140 Total retail trade (NAICS 44 and 45) $ 18,805,254 $ 21,302,523 - $ 2,497,270 Motor vehicle and parts dealers (NAICS 441) $ 4,273,053 $ 9,678,612 - $ 5,405,559 Automobile dealers (NAICS 4411) $ 3,605,998 $ 8,785,756 - $ 5,179,758 New car dealers (NAICS 44111) $ 3,203,813 $ 7,295,435 - $ 4,091,622 Used car dealers (NAICS 44112) $ 402,185 $ 1,490,321 - $ 1,088,136 Other motor vehicle dealers (NAICS 4412) $ 384,083 $ 892,856 - $ 508,772 Recreational vehicle dealers (NAICS 44121) $ 150,435 $ 408,305 - $ 257,870 Motorcycle, boat, and other motor vehicle dealers (NAICS 44122) $ 233,648 $ 484,550 - $ 250,902 Boat dealers (NAICS 441222) $ 89,853 $ 82,971 $ 6,882 Motorcycle, ATV, and all other motor vehicle dealers (NAICS 441228) $ 143,795 $ 401,579 - $ 257,783 Automotive parts, accessories, and tire stores (NAICS 4413) $ 282,971 $ 0 $ 282,971 Automotive parts and accessories stores (NAICS 44131) $ 178,964 $ 0 $ 178,964 Tire dealers (NAICS 44132) $ 104,007 $ 0 $ 104,007 Furniture and home furnishings stores (NAICS 442) $ 411,783 $ 162,506 $ 249,277 Furniture stores (NAICS 4421) $ 225,393 $ 142,839 $ 82,554 Home furnishings stores (NAICS 4422) $ 186,389 $ 19,667 $ 166,722 Floor covering stores (NAICS 44221) $ 90,443 $ 19,667 $ 70,776 Other home furnishings stores (NAICS 44229) $ 95,947 $ 0 $ 95,947 Window treatment stores (NAICS 442291) $ 4,671 $ 0 $ 4,671 All other home furnishings stores (NAICS 442299) $ 91,276 $ 0 $ 91,276 Electronics and appliance stores (NAICS 443) $ 250,449 $ 875,727 - $ 625,278 Household appliance stores (NAICS 443141) $ 59,584 $ 0 $ 59,584 Electronics stores (NAICS 443142) $ 190,865 $ 875,727 - $ 684,862 Building material and garden equipment and supplies dealers (NAICS 444) $ 1,391,032 $ 3,183,634 - $ 1,792,602 Building material and supplies dealers (NAICS 4441) $ 1,198,823 $ 2,157,433 - $ 958,610 Home centers (NAICS 44411) $ 665,634 $ 982,258 - $ 316,624 Paint and wallpaper stores (NAICS 44412) $ 40,827 $ 2,080 $ 38,747 Hardware stores (NAICS 44413) $ 106,348 $ 41,811 $ 64,536 Other building material dealers (NAICS 44419) $ 386,014 $ 1,131,284 - $ 745,270 Lawn and garden equipment and supplies stores (NAICS 4442) $ 192,209 $ 1,026,202 - $ 833,992 Outdoor power equipment stores (NAICS 44421) $ 39,261 $ 0 $ 39,261 Nursery, garden center, and farm supply stores (NAICS 44422) $ 152,948 $ 1,026,202 - $ 873,254 Food and beverage stores (NAICS 445) $ 2,782,196 $ 3,802,912 - $ 1,020,716 Grocery stores (NAICS 4451) $ 2,468,620 $ 2,230,181 $ 238,439 Supermarkets and other grocery (except convenience) stores (NAICS 44511) $ 2,369,657 $ 2,011,101 $ 358,557 Convenience stores (NAICS 44512) $ 98,963 $ 219,080 - $ 120,117 Specialty food stores (NAICS 4452) $ 72,177 $ 634,608 - $ 562,432
229th Ave, Beaverton, OR 97007 Sitewise Online
Meat markets (NAICS 44521) $ 21,814 $ 0 $ 21,814 Fish and seafood markets (NAICS 44522) $ 8,591 $ 0 $ 8,591 Fruit and vegetable markets (NAICS 44523) $ 14,962 $ 0 $ 14,962 Other specialty food stores (NAICS 44529) $ 26,810 $ 634,608 - $ 607,799 Baked goods and confectionery and nut stores (NAICS 445291 + 445292) $ 14,225 $ 0 $ 14,225 All other specialty food stores (NAICS 445299) $ 12,585 $ 634,608 - $ 622,024 Beer, wine, and liquor stores (NAICS 4453) $ 241,399 $ 938,122 - $ 696,723 Health and personal care stores (NAICS 446) $ 1,062,771 $ 22,609 $ 1,040,162 Pharmacies and drug stores (NAICS 44611) $ 922,806 $ 22,609 $ 900,197 Cosmetics, beauty supplies, and perfume stores (NAICS 44612) $ 61,746 $ 0 $ 61,746 Optical goods stores (NAICS 44613) $ 28,973 $ 0 $ 28,973 Other health and personal care stores (NAICS 44619) $ 49,246 $ 0 $ 49,246 Food (health) supplement stores (NAICS 446191) $ 17,561 $ 0 $ 17,561 All other health and personal care stores (NAICS 446199) $ 31,685 $ 0 $ 31,685 Gasoline stations (NAICS 447) $ 1,442,391 $ 0 $ 1,442,391 Clothing and clothing accessories stores (NAICS 448) $ 767,020 $ 372,985 $ 394,035 Clothing stores (NAICS 4481) $ 501,756 $ 372,985 $ 128,771 Men's clothing stores (NAICS 44811) $ 23,017 $ 0 $ 23,017 Women's clothing stores (NAICS 44812) $ 87,437 $ 0 $ 87,437 Children's and infants' clothing stores (NAICS 44813) $ 18,763 $ 0 $ 18,763 Family clothing stores (NAICS 44814) $ 302,165 $ 372,985 - $ 70,820 Clothing accessories stores (NAICS 44815) $ 24,665 $ 0 $ 24,665 Other clothing stores (NAICS 44819) $ 45,709 $ 0 $ 45,709 Shoe stores (NAICS 4482) $ 108,960 $ 0 $ 108,960 Jewelry, luggage, and leather goods stores (NAICS 4483) $ 156,304 $ 0 $ 156,304 Jewelry stores (NAICS 44831) $ 101,921 $ 0 $ 101,921 Luggage and leather goods stores (NAICS 44832) $ 54,383 $ 0 $ 54,383 Sporting goods, hobby, musical instrument, and book stores (NAICS 451) $ 307,996 $ 0 $ 307,996 Sporting goods, hobby, and musical instrument stores (NAICS 4511) $ 277,943 $ 0 $ 277,943 Sporting goods stores (NAICS 45111) $ 204,210 $ 0 $ 204,210 Hobby, toy, and game stores (NAICS 45112) $ 55,068 $ 0 $ 55,068 Sewing, needlework, and piece goods stores (NAICS 45113) $ 8,537 $ 0 $ 8,537 Musical instrument and supplies stores (NAICS 45114) $ 10,128 $ 0 $ 10,128 Book stores and news dealers (NAICS 4512) $ 30,052 $ 0 $ 30,052 Book stores (NAICS 451211) $ 28,011 $ 0 $ 28,011 News dealers and newsstands (NAICS 451212) $ 2,042 $ 0 $ 2,042 General merchandise stores (NAICS 452) $ 2,402,092 $ 2,845,634 - $ 443,542 Department stores (NAICS 4522) $ 304,938 $ 0 $ 304,938 Other general merchandise stores (NAICS 4523) $ 2,097,154 $ 2,845,634 - $ 748,480 Warehouse clubs and supercenters (NAICS 452311) $ 1,893,284 $ 2,820,110 - $ 926,826 All other general merchandise stores (NAICS 452319) $ 203,870 $ 25,524 $ 178,345 5218 SW 229th Ave, Beaverton, OR 97007 Sitewise Online Retail Market Power Opportunity Gap Report By Retail Store Types Retail Market Power Opportunity Gap Report By Retail Store Types 5218 SW 229th Ave, Beaverton, OR 97007 0 - 1 mi 2022 Demand 2022 Supply Opportunity Gap/Surplus
229th Ave, Beaverton, OR 97007
* GAFO (General merchandise, Apparel, Furniture and Other) represents sales at stores that sell merchandise normally sold in department stores. This category is not included in Total Retail Sales Including Eating and Drinking Places.
Miscellaneous store retailers (NAICS 453) $ 416,787 $ 357,905 $ 58,882 Florists (NAICS 4531) $ 19,433 $ 0 $ 19,433 Office supplies, stationery, and gift stores (NAICS 4532) $ 94,772 $ 0 $ 94,772 Office supplies and stationery stores (NAICS 45321) $ 39,755 $ 0 $ 39,755 Gift, novelty, and souvenir stores (NAICS 45322) $ 55,017 $ 0 $ 55,017 Used merchandise stores (NAICS 4533) $ 61,638 $ 232,934 - $ 171,295 Other miscellaneous store retailers (NAICS 4539) $ 240,944 $ 124,971 $ 115,973 Pet and pet supplies stores (NAICS 45391) $ 70,013 $ 44,684 $ 25,329 Art dealers (NAICS 45392) $ 41,051 $ 225 $ 40,826 Manufactured (mobile) home dealers (NAICS 45393) $ 25,724 $ 206 $ 25,518 All other miscellaneous store retailers (NAICS 45399) $ 104,156 $ 79,856 $ 24,299 Tobacco stores (NAICS 453991) $ 25,328 $ 4,028 $ 21,300 All other miscellaneous store retailers (except tobacco stores) (NAICS 453998) $ 78,828 $ 75,829 $ 2,999 Non-store retailers (NAICS 454) $ 3,297,686 $ 0 $ 3,297,686 Electronic shopping and mail-order houses (NAICS 4541) $ 3,126,509 $ 0 $ 3,126,509 Vending machine operators (NAICS 4542) $ 23,233 $ 0 $ 23,233 Direct selling establishments (NAICS 4543) $ 147,944 $ 0 $ 147,944 Fuel dealers (NAICS 45431) $ 70,874 $ 0 $ 70,874 Other direct selling establishments (NAICS 45439) $ 77,070 $ 0 $ 77,070 Food services and drinking places (NAICS 722) $ 2,397,115 $ 549,986 $ 1,847,129 Special food services (NAICS 7223) $ 191,244 $ 16,481 $ 174,763 Food service contractors (NAICS 72231) $ 151,370 $ 16,481 $ 134,889 Caterers (NAICS 72232) $ 36,336 $ 0 $ 36,336 Mobile food services (NAICS 72233) $ 3,538 $ 0 $ 3,538 Drinking places (alcoholic beverages) (NAICS 7224) $ 80,544 $ 0 $ 80,544 Restaurants and other eating places (NAICS 7225) $ 2,125,327 $ 533,505 $ 1,591,823 Full-service restaurants (NAICS 722511) $ 1,068,269 $ 89,670 $ 978,599 Limited-service restaurants (NAICS 722513) $ 897,114 $ 443,835 $ 453,279 Cafeterias, grill buffets, and buffets (NAICS 722514) $ 22,870 $ 0 $ 22,870 Snack and nonalcoholic beverage bars (NAICS 722515) $ 137,074 $ 0 $ 137,074 GAFO* $ 4,139,433 $ 4,256,852 - $ 117,419 General Merchandise Stores-452 $ 2,402,092 $ 2,845,634 - $ 443,542 Clothing & Clothing Accessories Stores-448 $ 767,020 $ 372,985 $ 394,035 Furniture & Home Furnishings Stores-442 $ 411,783 $ 162,506 $ 249,277 Electronics & Appliance Stores-443 $ 250,449 $ 875,727 - $ 625,278 Sporting Goods, Hobby, Book, Music Stores-451 $ 307,996 $ 0 $ 307,996 Office Supplies, Stationery, Gift Stores-4532 $ 94,772 $ 0 $ 94,772
Sitewise Online Retail Market Power Opportunity Gap Report By Retail Store Types Retail Market Power Opportunity Gap Report By Retail Store Types 5218 SW 229th Ave, Beaverton, OR 97007 0 - 1 mi 2022 Demand 2022 Supply Opportunity Gap/Surplus
5218 SW
5218 SW 229th Ave, Beaverton, OR 97007 Sitewise Online
Retail Market Power Opportunity Gap Report By Retail Store Types
Retail Market Power Opportunity Gap Report By
Retail Market Power data is derived from two major sources of information. The demand data is derived from the Consumer Expenditure Survey (CE Survey or CEX), which is fielded by the U.S. Bureau of Labor Statistics (BLS). The supply data is derived from the Census of Retail Trade (CRT), which is made available by the U.S. Census. Additional data sources are incorporated to create both supply and demand estimates. The difference between demand and supply represents the opportunity gap or surplus available for each merchandise line in the specified reporting geography. When this difference is positive (demand is greater than the supply), there is an opportunity gap for that merchandise line; when the difference is negative (supply is greater than demand), there is a surplus.
Copyright © 2022 Environics Analytics. All rights reserved.
5218 SW 229th Ave, Beaverton, OR 97007 0 - 1 mi 2022 Demand 2022 Supply Opportunity Gap/Surplus
Retail Store Types

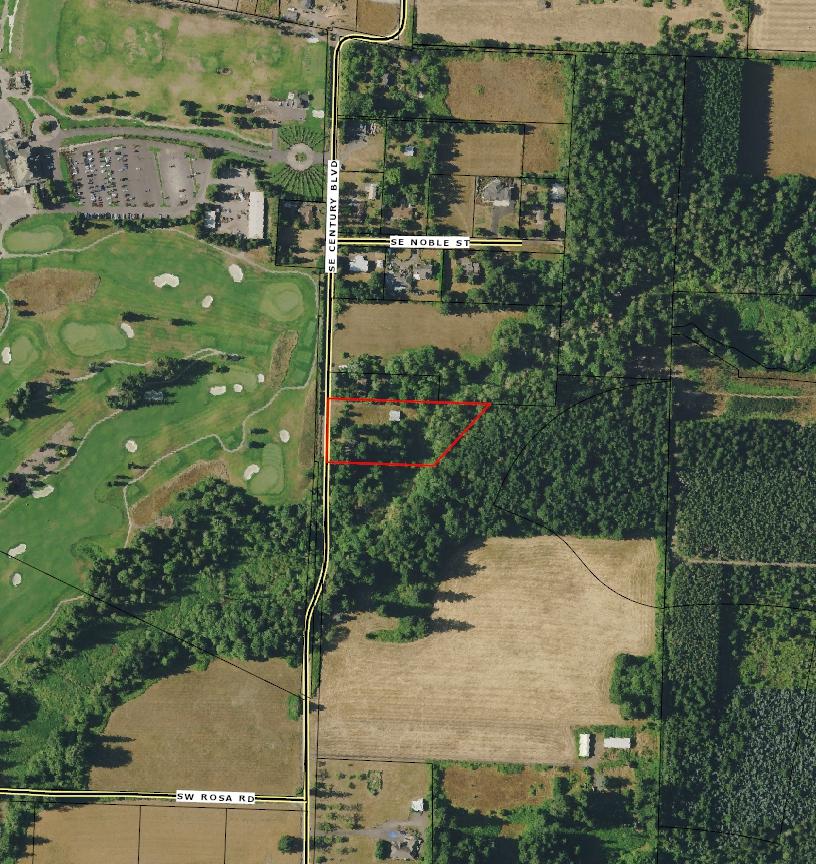 AerialMap


 Powered