COMMUNITY

Demographics
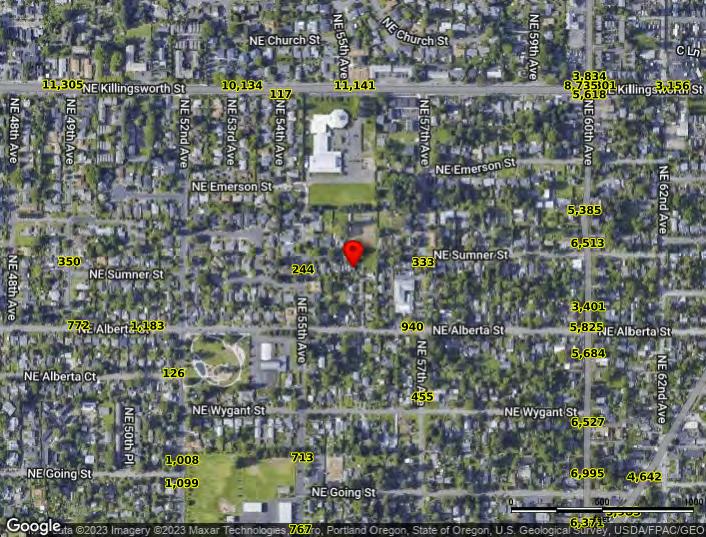
Traffic Counts
The information contained is provided by WFG’s Customer Service Department to our customers, and while deemed reliable, is not guaranteed.
INFORMATION

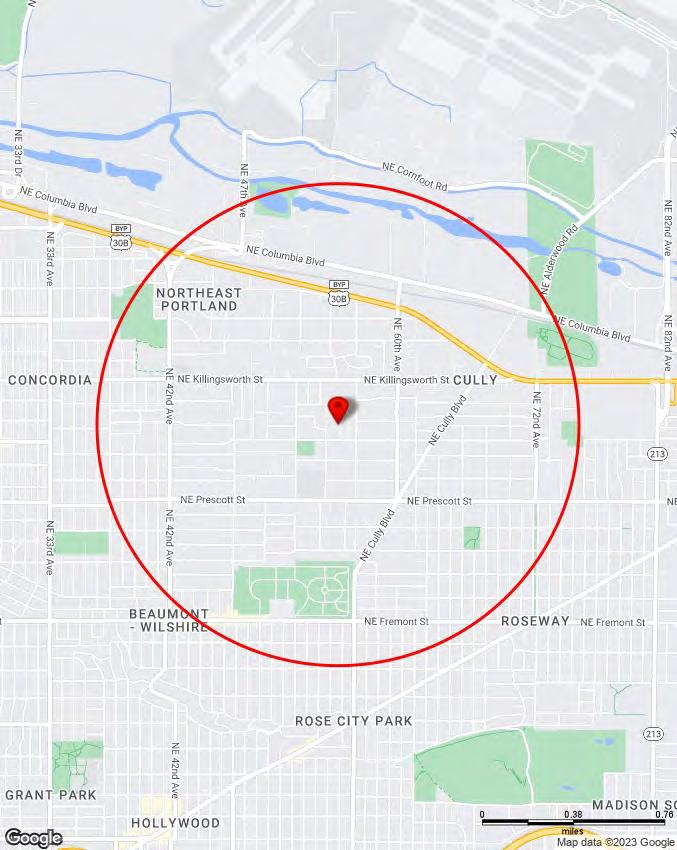
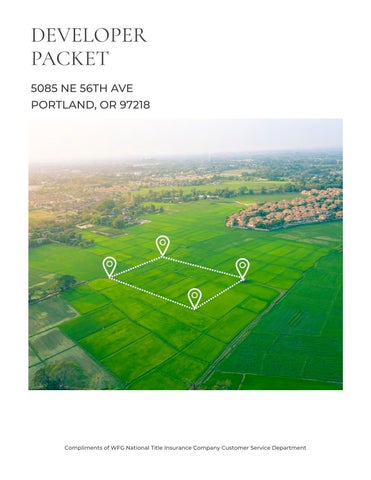
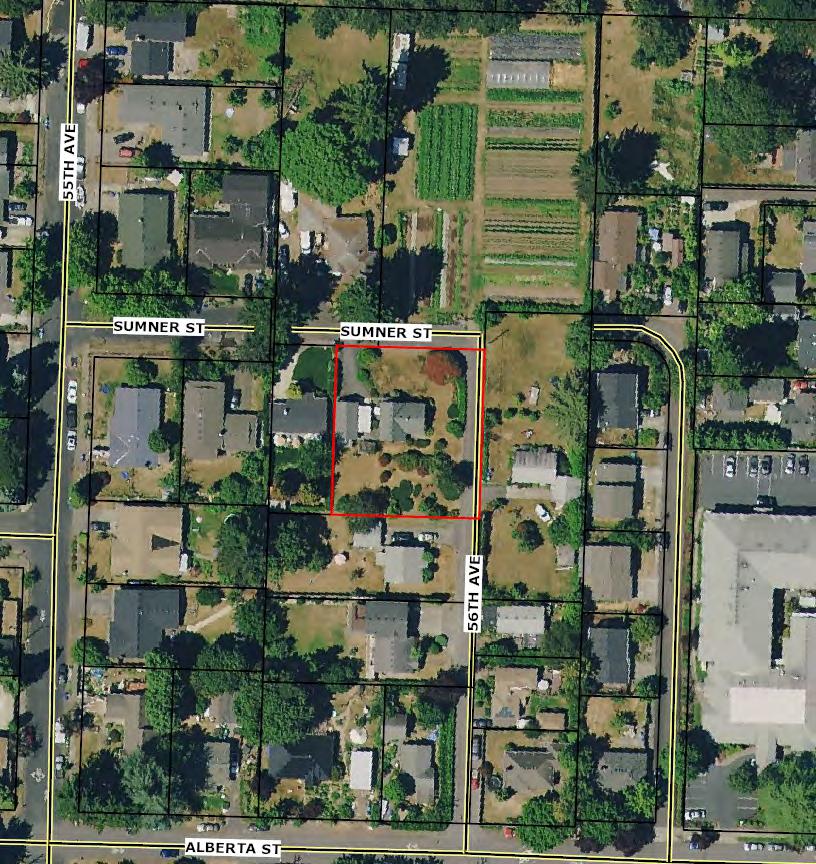
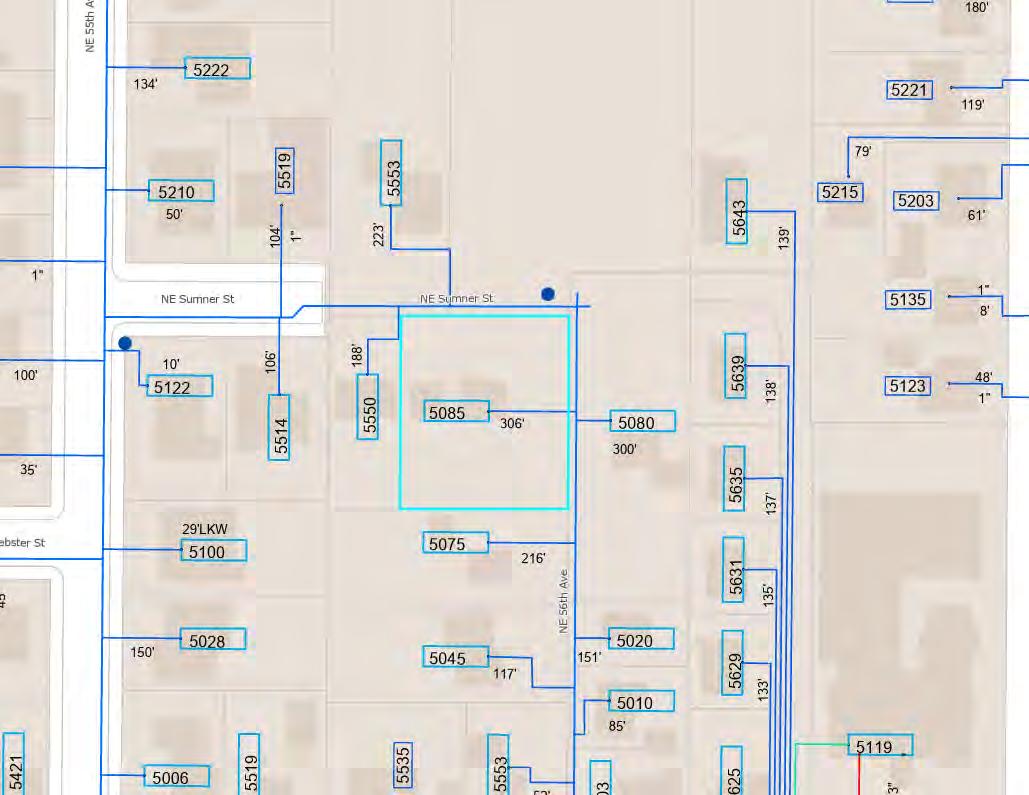
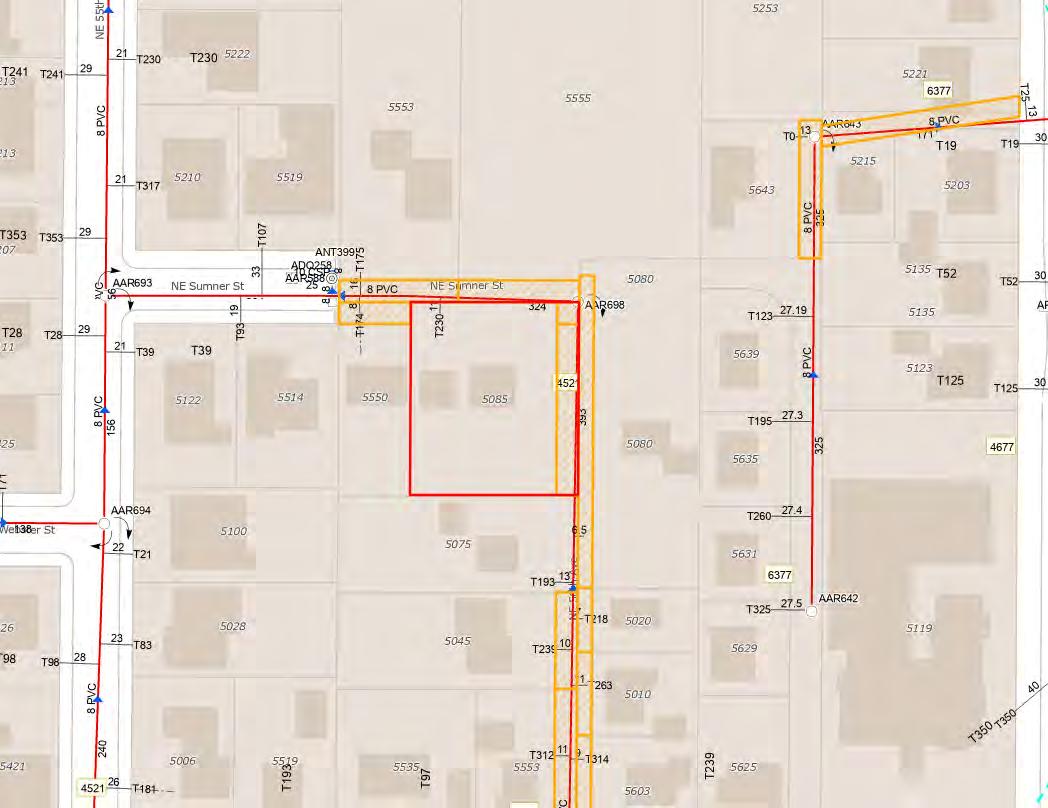
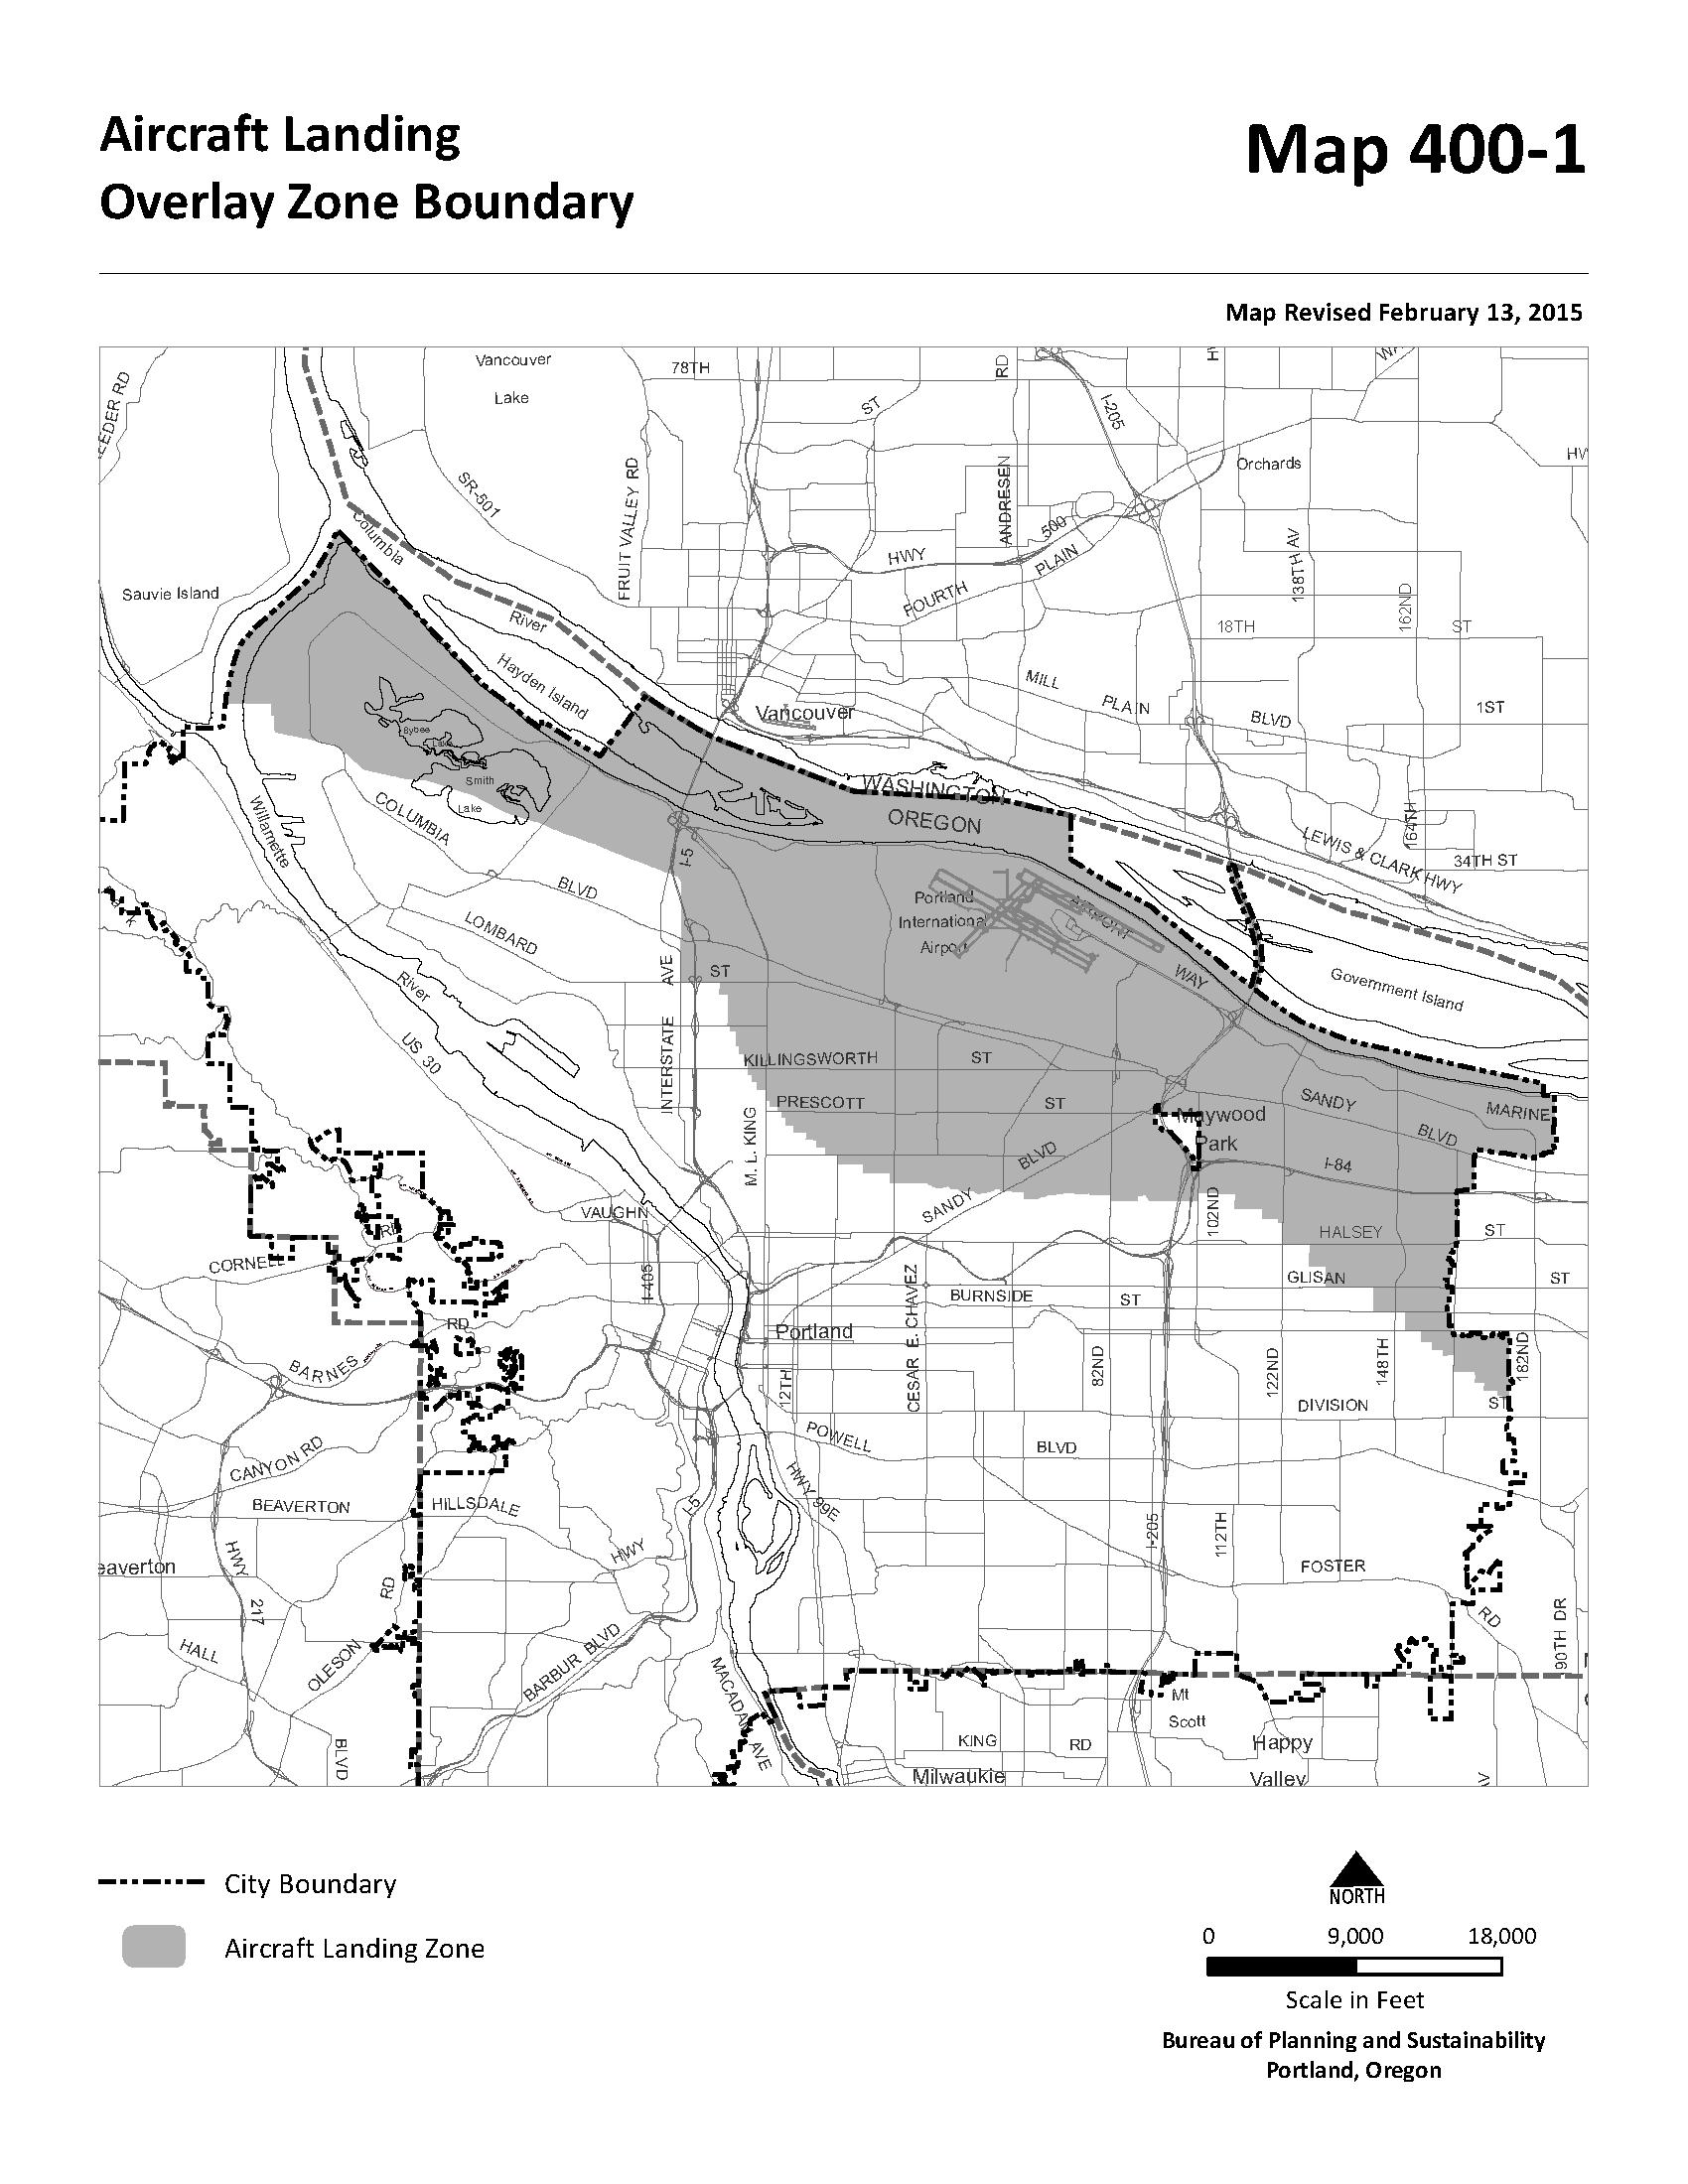
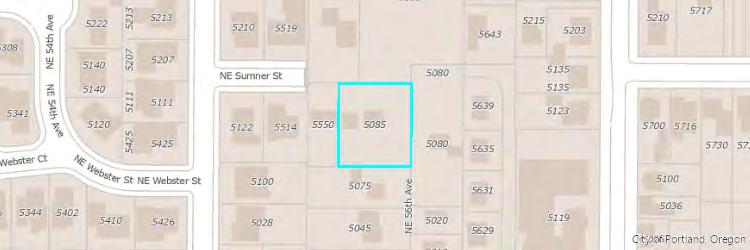
5085 NE 56th Ave, Portland, OR 97218
5085 NE 56th Ave, Portland, OR 97218 Sitewise Online Pop-Facts: Population Quick Facts Pop-Facts: Population Quick Facts 5085 NE 56th Ave, Portland, OR 97218 0 - 1 mi Population 2027 Projection 19,996 2022 Estimate 19,338 2010 Census 17,924 2000 Census 17,479 Growth 2022-2027 3.40% Growth 2010-2022 7.89% Growth 2000-2010 2.55% 2022 Est. Population by Age 19,338 Age 0 to 4 1,094 5.66% Age 5 to 9 1,164 6.02% Age 10 to 14 1,178 6.09% Age 15 to 17 660 3.41% Age 18 to 20 583 3.01% Age 21 to 24 741 3.83% Age 25 to 34 2,845 14.71% Age 35 to 44 3,317 17.15% Age 45 to 54 2,939 15.20% Age 55 to 64 2,181 11.28% Age 65 to 74 1,778 9.20% Age 75 to 84 673 3.48% Age 85 and over 184 0.95% Age 16 and over 15,686 81.11% Age 18 and over 15,242 78.82% Age 21 and over 14,660 75.81% Age 65 and over 2,636 13.63% 2022 Est. Median Age 39.23 2022 Est. Average Age 39.05
Copyright © Claritas, LLC 2022. All rights reserved.
2022 Est. Population by Single-Classification Race 19,338 White Alone 12,612 65.22% Black or African American Alone 2,804 14.50% American Indian and Alaska Native Alone 325 1.68% Asian Alone 981 5.07% Native Hawaiian and Other Pacific Islander Alone 58 0.30% Some Other Race Alone 1,470 7.60% Two or More Races 1,088 5.63% 2022 Est. Population by Ethnicity (Hispanic or Latino) 19,338 Hispanic or Latino 2,891 14.95% Not Hispanic or Latino 16,447 85.05% 2022 Est. Population by Sex 19,338 Male 9,483 49.04% Female 9,855 50.96%
5085 NE 56th Ave, Portland, OR 97218 Sitewise Online Pop-Facts: Population Quick Facts Pop-Facts: Population Quick Facts 5085 NE 56th Ave, Portland, OR 97218 0 - 1 mi
5085 NE 56th Ave, Portland, OR 97218 Sitewise Online Pop-Facts: Household Quick Facts Pop-Facts: Household Quick Facts 5085 NE 56th Ave, Portland, OR 97218 0 - 1 mi Households 2027 Projection 7,968 2022 Estimate 7,682 2010 Census 7,040 2000 Census 6,661 Growth 2022-2027 3.72% Growth 2010-2022 9.12% Growth 2000-2010 5.69% 2022 Est. Households by Household Income 7,682 Income Less than $15,000 550 7.16% Income $15,000 to $24,999 374 4.87% Income $25,000 to $34,999 542 7.06% Income $35,000 to $49,999 724 9.42% Income $50,000 to $74,999 991 12.90% Income $75,000 to $99,999 1,189 15.48% Income $100,000 to $124,999 933 12.14% Income $125,000 to $149,999 692 9.00% Income $150,000 to $199,999 816 10.62% Income $200,000 to $249,999 482 6.28% Income $250,000 to $499,999 291 3.79% Income $500,000 or more 98 1.28% 2022 Est. Average Household Income $108,318 2022 Est. Median Household Income $88,865 2022 Median HH Inc. by Single-Classification Race White Alone $97,177 Black or African American Alone $62,171 American Indian and Alaska Native Alone $65,597 Asian Alone $73,430 Native Hawaiian and Other Pacific Islander Alone $46,892 Some Other Race Alone $53,578 Two or More Races $111,059 Hispanic or Latino $45,108 Not Hispanic or Latino $92,873 2022 Est. Households by Household Type 7,682 Family Households 4,372 56.91% Nonfamily Households 3,310 43.09% 2022 Est. Group Quarters Population 267
2022 Est. Households by Household Size 7,682 1-person 2,239 29.15% 2-person 2,525 32.87% 3-person 1,281 16.67% 4-person 876 11.41% 5-person 405 5.27% 6-person 190 2.47% 7-or-more-person 166 2.17% 2022 Est. Average Household Size 2.48 5085 NE 56th Ave, Portland, OR 97218 Sitewise Online Pop-Facts: Household Quick Facts Pop-Facts: Household Quick Facts 5085 NE 56th Ave, Portland, OR 97218 0 - 1 mi
2022 Est. HHs by Type by Presence of Own Children 4,372 Married-Couple Family, own children 1,387 31.73% Married-Couple Family, no own children 1,635 37.39% Male Householder, own children 169 3.87% Male Householder, no own children 220 5.04% Female Householder, own children 554 12.67% Female Householder, no own children 406 9.29% Copyright © Claritas, LLC 2022. All rights reserved. 5085 NE 56th Ave, Portland, OR 97218 Sitewise Online Pop-Facts: Household Quick Facts Pop-Facts: Household Quick Facts 5085 NE 56th Ave, Portland, OR 97218 0 - 1 mi
5085 NE 56th Ave, Portland, OR 97218 Sitewise Online Pop-Facts: Demographic Snapshot (Part 1) Pop-Facts: Demographic Snapshot (Part 1) 5085 NE 56th Ave, Portland, OR 97218 0 - 1 mi Population 2027 Projection 19,996 2022 Estimate 19,338 2010 Census 17,924 2000 Census 17,479 Growth 2022-2027 3.40% Growth 2010-2022 7.89% Growth 2000-2010 2.55% 2022 Est. Population by Single-Classification Race 19,338 White Alone 12,612 65.22% Black or African American Alone 2,804 14.50% American Indian and Alaska Native Alone 325 1.68% Asian Alone 981 5.07% Native Hawaiian and Other Pacific Islander Alone 58 0.30% Some Other Race Alone 1,470 7.60% Two or More Races 1,088 5.63% 2022 Est. Population Hispanic or Latino by Origin 19,338 Not Hispanic or Latino 16,447 85.05% Hispanic or Latino 2,891 14.95% Hispanic or Latino by Origin 2,891 Mexican 2,332 80.66% Puerto Rican 72 2.49% Cuban 64 2.20% All Other Hispanic or Latino 423 14.65% 2022 Est. Hisp. or Latino Pop by Single-Classification Race 2,891 White Alone 988 34.18% Black or African American Alone 73 2.52% American Indian and Alaska Native Alone 149 5.16% Asian Alone 13 0.45% Native Hawaiian and Other Pacific Islander Alone 3 0.10% Some Other Race Alone 1,427 49.36% Two or More Races 238 8.23%
2022 Est. Pop by Race, Asian Alone, by Category 981 Chinese, except Taiwanese 78 7.96% Filipino 65 6.67% Japanese 46 4.72% Asian Indian 20 2.06% Korean 38 3.92% Vietnamese 677 68.97% Cambodian 0 0.00% Hmong 0 0.01% Laotian 0 0.01% Thai 1 0.11% All other Asian Races, including 2 or more 55 5.56% 2022 Est. Population by Ancestry 19,338 Arab 2 0.01% Czech 69 0.36% Danish 151 0.78% Dutch 172 0.89% English 1,626 8.41% French (except Basque) 312 1.62% French Canadian 168 0.87% German 2,204 11.40% Greek 50 0.26% Hungarian 42 0.22% Irish 1,743 9.02% Italian 555 2.87% Lithuanian 32 0.16% Norwegian 467 2.41% Polish 229 1.18% Portuguese 48 0.25% Russian 86 0.45% Scottish 368 1.90% Scotch-Irish 156 0.80% Slovak 1 0.01% Subsaharan African 330 1.71% Swedish 335 1.73% Swiss 191 0.99% Ukrainian 49 0.25% United States or American 713 3.69% Welsh 136 0.70% West Indian (except Hisp. groups) 0 0.00% Other Ancestries 6,939 35.89% Ancestry Unclassified 2,163 11.19% 2022 Est. Pop Age 5+ by Language Spoken At Home 18,244 Speak only English 13,945 76.44% 5085 NE 56th Ave, Portland,
97218 Sitewise Online Pop-Facts: Demographic Snapshot (Part 1) Pop-Facts: Demographic Snapshot (Part 1) 5085 NE 56th Ave, Portland, OR 97218 0 - 1 mi
OR
Speak Asian or Pacific Island Language 932 5.11% Speak IndoEuropean Language 254 1.39% Speak Spanish 2,724 14.93% Speak Other Language 389 2.13% 5085 NE 56th Ave, Portland, OR 97218 Sitewise Online Pop-Facts: Demographic Snapshot (Part 1) Pop-Facts: Demographic Snapshot (Part 1) 5085 NE 56th Ave, Portland, OR 97218 0 - 1 mi
2022 Est. Population by Sex 19,338 Male 9,483 49.04% Female 9,855 50.96% 2022 Est. Population by Age 19,338 Age 0 to 4 1,094 5.66% Age 5 to 9 1,164 6.02% Age 10 to 14 1,178 6.09% Age 15 to 17 660 3.41% Age 18 to 20 583 3.01% Age 21 to 24 741 3.83% Age 25 to 34 2,845 14.71% Age 35 to 44 3,317 17.15% Age 45 to 54 2,939 15.20% Age 55 to 64 2,181 11.28% Age 65 to 74 1,778 9.20% Age 75 to 84 673 3.48% Age 85 and over 184 0.95% Age 16 and over 15,686 81.11% Age 18 and over 15,242 78.82% Age 21 and over 14,660 75.81% Age 65 and over 2,636 13.63% 2022 Est. Median Age 39.23 2022 Est. Average Age 39.05 5085 NE 56th Ave, Portland, OR 97218
Online
Demographic Snapshot
Pop-Facts: Demographic Snapshot (Part 1) 5085 NE 56th Ave, Portland, OR 97218 0 - 1 mi
Sitewise
Pop-Facts:
(Part 1)
2022 Est. Male Population by Age 9,483 Age 0 to 4 540 5.70% Age 5 to 9 587 6.19% Age 10 to 14 596 6.29% Age 15 to 17 335 3.53% Age 18 to 20 303 3.19% Age 21 to 24 389 4.10% Age 25 to 34 1,416 14.93% Age 35 to 44 1,638 17.27% Age 45 to 54 1,480 15.61% Age 55 to 64 1,031 10.87% Age 65 to 74 806 8.50% Age 75 to 84 298 3.14% Age 85 and over 64 0.68% 2022 Est. Median Age, Male 38.51 2022 Est. Average Age, Male 38.26 2022 Est. Female Population by Age 9,855 Age 0 to 4 554 5.62% Age 5 to 9 577 5.86% Age 10 to 14 582 5.90% Age 15 to 17 325 3.30% Age 18 to 20 280 2.84% Age 21 to 24 352 3.57% Age 25 to 34 1,429 14.50% Age 35 to 44 1,679 17.04% Age 45 to 54 1,459 14.80% Age 55 to 64 1,151 11.67% Age 65 to 74 972 9.87% Age 75 to 84 376 3.81% Age 85 and over 120 1.22% 2022 Est. Median Age, Female 39.93 2022 Est. Average Age, Female 39.79 5085 NE 56th Ave, Portland, OR 97218 Sitewise Online Pop-Facts: Demographic Snapshot (Part 1) Pop-Facts: Demographic Snapshot (Part 1) 5085 NE 56th Ave, Portland, OR 97218 0 - 1 mi
2022 Est. Pop Age 15+ by Marital Status 15,902 Total, Never Married 6,749 42.44% Males, Never Married 3,399 21.38% Females, Never Married 3,350 21.07% Married, Spouse present 6,287 39.54% Married, Spouse absent 600 3.77% Widowed 348 2.19% Males, Widowed 95 0.60% Females, Widowed 253 1.59% Divorced 1,918 12.06% Males, Divorced 822 5.17% Females, Divorced 1,096 6.89% 2022 Est. Pop Age 25+ by Edu. Attainment 13,918 Less than 9th grade 580 4.17% Some High School, no diploma 602 4.32% High School Graduate (or GED) 2,076 14.91% Some College, no degree 2,652 19.05% Associate Degree 1,200 8.62% Bachelor's Degree 4,128 29.66% Master's Degree 1,927 13.85% Professional School Degree 426 3.06% Doctorate Degree 328 2.35% 2022 Est. Pop. Age 25+ by Edu. Attain., Hisp./Lat. 1,527 No High School Diploma 601 39.34% High School Graduate 338 22.15% Some College or Associate's Degree 291 19.08% Bachelor's Degree or Higher 297 19.43% Copyright © Claritas, LLC 2022. All rights reserved. 5085 NE 56th Ave, Portland, OR 97218 Sitewise Online Pop-Facts: Demographic Snapshot (Part 1) Pop-Facts: Demographic Snapshot (Part 1) 5085 NE 56th Ave, Portland, OR 97218 0 - 1 mi
5085 NE 56th Ave, Portland, OR 97218 Sitewise Online Pop-Facts: Demographic Snapshot (Part 2) Pop-Facts: Demographic Snapshot (Part 2) 5085 NE 56th Ave, Portland, OR 97218 0 - 1 mi Households 2027 Projection 7,968 2022 Estimate 7,682 2010 Census 7,040 2000 Census 6,661 Growth 2022-2027 3.72% Growth 2010-2022 9.12% Growth 2000-2010 5.69% 2022 Est. Households by Household Type 7,682 Family Households 4,372 56.91% Nonfamily Households 3,310 43.09% 2022 Est. Group Quarters Population 267 2022 HHs by Ethnicity: Hispanic/Latino 694 9.04% 2022 Est. Households by HH Income 7,682 Income < $15,000 550 7.16% Income $15,000 to $24,999 374 4.87% Income $25,000 to $34,999 542 7.06% Income $35,000 to $49,999 724 9.42% Income $50,000 to $74,999 991 12.90% Income $75,000 to $99,999 1,189 15.48% Income $100,000 to $124,999 933 12.14% Income $125,000 to $149,999 692 9.00% Income $150,000 to $199,999 816 10.62% Income $200,000 to $249,999 482 6.28% Income $250,000 to $499,999 291 3.79% Income $500,000+ 98 1.28% 2022 Est. Average Household Income $108,318 2022 Est. Median Household Income $88,865 2022 Median HH Income by Single-Class. Race or Ethn. White Alone $97,177 Black or African American Alone $62,171 American Indian and Alaska Native Alone $65,597 Asian Alone $73,430 Native Hawaiian and Other Pacific Islander Alone $46,892 Some Other Race Alone $53,578 Two or More Races $111,059 Hispanic or Latino $45,108
Not Hispanic or Latino $92,873
NE 56th Ave,
OR 97218 Sitewise Online
Pop-Facts: Demographic Snapshot (Part 2) 5085 NE 56th Ave, Portland, OR 97218 0 - 1 mi
5085
Portland,
Pop-Facts: Demographic Snapshot (Part 2)
2022 Est. Family HH Type by Presence of Own Children 4,372 Married-Couple Family, own children 1,387 31.73% Married-Couple Family, no own children 1,635 37.39% Male Householder, own children 169 3.87% Male Householder, no own children 220 5.04% Female Householder, own children 554 12.67% Female Householder, no own children 406 9.29% 2022 Est. Households by Household Size 7,682 1-person 2,239 29.15% 2-person 2,525 32.87% 3-person 1,281 16.67% 4-person 876 11.41% 5-person 405 5.27% 6-person 190 2.47% 7-or-more-person 166 2.17% 2022 Est. Average Household Size 2.48 2022 Est. Households by Presence of People Under 18 7,682 Households with 1 or more People under Age 18 2,343 30.50% Households with No People under Age 18 5,339 69.50% Households with 1 or more People under Age 18 2,343 Married-Couple Family 1,449 61.83% Other Family, Male Householder 208 8.86% Other Family, Female Householder 643 27.44% Nonfamily, Male Householder 24 1.04% Nonfamily, Female Householder 19 0.83% Households with No People under Age 18 5,339 Married-Couple Family 1,569 29.39% Other Family, Male Householder 182 3.41% Other Family, Female Householder 321 6.02% Nonfamily, Male Householder 1,499 28.08% Nonfamily, Female Householder 1,767 33.10% 5085 NE 56th Ave, Portland, OR 97218 Sitewise Online Pop-Facts: Demographic Snapshot (Part 2) Pop-Facts: Demographic Snapshot (Part 2) 5085 NE 56th Ave, Portland, OR 97218 0 - 1 mi
2022 Est. Households by Number of Vehicles 7,682 No Vehicles 622 8.09% 1 Vehicle 2,887 37.58% 2 Vehicles 3,019 39.31% 3 Vehicles 847 11.02% 4 Vehicles 253 3.30% 5 or more Vehicles 55 0.71% 2022 Est. Average Number of Vehicles 1.67 Family Households 2027 Projection 4,533 2022 Estimate 4,372 2010 Census 4,006 2000 Census 4,092 Growth 2022-2027 3.67% Growth 2010-2022 9.14% Growth 2000-2010 -2.10% 2022 Est. Families by Poverty Status 4,372 2022 Families at or Above Poverty 3,961 90.60% 2022 Families at or Above Poverty with Children 1,906 43.60% 2022 Families Below Poverty 411 9.40% 2022 Families Below Poverty with Children 352 8.05% 2022 Est. Pop Age 16+ by Employment Status 15,686 In Armed Forces 0 0.00% Civilian - Employed 10,864 69.26% Civilian - Unemployed 424 2.71% Not in Labor Force 4,398 28.03% 2022 Est. Civ. Employed Pop 16+ by Class of Worker 10,805 For-Profit Private Workers 6,641 61.47% Non-Profit Private Workers 1,347 12.46% Local Government Workers 767 7.10% State Government Workers 532 4.93% Federal Government Workers 179 1.65% Self-Employed Workers 1,206 11.16% Unpaid Family Workers 133 1.23% 5085 NE 56th Ave, Portland, OR 97218 Sitewise Online Pop-Facts: Demographic Snapshot (Part 2) Pop-Facts: Demographic Snapshot (Part 2) 5085 NE 56th Ave, Portland, OR 97218 0 - 1 mi
5085 NE 56th Ave, Portland, OR 97218
2022 Est. Civ. Employed Pop 16+ by Occupation 10,805 Architect/Engineer 199 1.84% Arts/Entertainment/Sports 447 4.14% Building Grounds Maintenance 417 3.86% Business/Financial Operations 689 6.37% Community/Social Services 272 2.52% Computer/Mathematical 300 2.78% Construction/Extraction 421 3.90% Education/Training/Library 946 8.75% Farming/Fishing/Forestry 38 0.35% Food Prep/Serving 744 6.89% Healthcare Practitioner/Technician 683 6.32% Healthcare Support 404 3.74% Maintenance Repair 178 1.65% Legal 185 1.71% Life/Physical/Social Science 231 2.14% Management 1,135 10.51% Office/Admin. Support 1,038 9.61% Production 499 4.62% Protective Service 180 1.67% Sales/Related 1,031 9.54% Personal Care/Service 259 2.40% Transportation/Moving 507 4.69% 2022 Est. Pop 16+ by Occupation Classification 10,805 Blue Collar 1,605 14.86% White Collar 7,157 66.24% Service & Farm 2,042 18.90% 2022 Est. Workers Age 16+ by Transp. To Work 10,617 Drove Alone 6,052 57.01% Car Pooled 1,096 10.32% Public Transportation 1,218 11.47% Walked 381 3.59% Bicycle 734 6.91% Other Means 191 1.80% Worked at Home 944 8.89% 2022 Est. Workers Age 16+ by Travel Time to Work* Less than 15 minutes 1,720 15 to 29 Minutes 3,847 30 to 44 Minutes 2,611 45 to 59 Minutes 812 60 or more Minutes 720
Sitewise Online Pop-Facts:
Pop-Facts: Demographic Snapshot (Part 2) 5085 NE 56th Ave, Portland, OR 97218 0 - 1 mi
Demographic Snapshot (Part 2)
2022 Est. Avg. Travel Time to Work in Minutes* 30.00 2022 Est. Occupied Housing Units by Tenure 7,682 Owner-Occupied 4,954 64.49% Renter-Occupied 2,728 35.51% 2022 Occupied Housing Units: Avg. Length of Residence Owner-Occupied 12 Renter-Occupied 6 5085 NE 56th Ave, Portland, OR 97218 Sitewise Online Pop-Facts: Demographic Snapshot (Part 2) Pop-Facts: Demographic Snapshot (Part 2) 5085 NE 56th Ave, Portland, OR 97218 0 - 1 mi
2022 Est. Owner Occupied Housing Units by Value 4,954 Value Less than $20,000 112 2.26% Value $20,000 to $39,999 11 0.22% Value $40,000 to $59,999 22 0.45% Value $60,000 to $79,999 4 0.07% Value $80,000 to $99,999 1 0.01% Value $100,000 to $149,999 10 0.20% Value $150,000 to $199,999 22 0.44% Value $200,000 to $299,999 167 3.37% Value $300,000 to $399,999 730 14.73% Value $400,000 to $499,999 1,181 23.83% Value $500,000 to $749,999 1,786 36.06% Value $750,000 to $999,999 642 12.95% Value $1,000,000 to $1,499,999 177 3.58% Value $1,500,000 to $1,999,999 35 0.70% Value $2,000,000 or more 56 1.13% 2022 Est. Median All Owner-Occupied Housing Unit Value $530,640 2022 Est. Housing Units by Units in Structure 8,029 1 Unit Attached 132 1.65% 1 Unit Detached 5,886 73.31% 2 Units 171 2.13% 3 or 4 Units 371 4.63% 5 to 19 Units 776 9.67% 20 to 49 Units 270 3.36% 50 or More Units 72 0.90% Mobile Home or Trailer 310 3.86% Boat, RV, Van, etc. 41 0.51% Dominant structure type 1 Unit Detached 2022 Est. Housing Units by Year Structure Built 8,029 Housing Units Built 2014 or Later 756 9.42% Housing Units Built 2010 to 2013 80 1.00% Housing Units Built 2000 to 2009 742 9.24% Housing Units Built 1990 to 1999 462 5.76% Housing Units Built 1980 to 1989 201 2.50% Housing Units Built 1970 to 1979 796 9.92% Housing Units Built 1960 to 1969 508 6.33% Housing Units Built 1950 to 1959 824 10.27% Housing Units Built 1940 to 1949 1,174 14.62% Housing Units Built 1939 or Earlier 2,484 30.94% 2022 Est. Median Year Structure Built** 1954 5085 NE 56th Ave, Portland, OR 97218 Sitewise Online Pop-Facts: Demographic Snapshot (Part 2) Pop-Facts: Demographic Snapshot (Part 2) 5085 NE 56th Ave, Portland, OR 97218 0 - 1 mi
5085 NE 56th Ave, Portland, OR 97218 Sitewise Online
Pop-Facts: Demographic Snapshot (Part 2)
Pop-Facts: Demographic Snapshot (Part 2)
Dominant Year Structure Built
Copyright © Claritas, LLC 2022. All rights reserved.
* This row intentionally left blank. No Total Category.
**1939 will appear when at least half of the Housing Units in this reports area were built in 1939 or earlier.
1939 or Earlier
5085
- 1 mi
NE 56th Ave, Portland, OR 97218 0
5085 NE 56th Ave, Portland, OR 97218 Sitewise Online Pop-Facts: Census Demographic Overview (Part 1) Pop-Facts: Census Demographic Overview (Part 1) 5085 NE 56th Ave, Portland, OR 97218 0 - 1 mi Population 2027 Projection 19,996 2022 Estimate 19,338 2010 Census 17,924 2000 Census 17,479 Growth 2022-2027 3.40% Growth 2010-2022 7.89% Growth 2000-2010 2.55% 2010 Population by Single-Classification Race 17,924 White Alone 11,778 65.71% Black or African American Alone 2,340 13.06% American Indian and Alaska Native Alone 299 1.67% Asian Alone 955 5.33% Native Hawaiian and Other Pacific Islander Alone 67 0.37% Some Other Race Alone 1,607 8.97% Two or More Races 877 4.89% 2010 Population By Ethnicity 17,924 Not Hispanic or Latino 15,020 83.80% Hispanic or Latino 2,903 16.20% 2010 Hispanic or Latino by Single-Classification Race 2,903 White Alone 917 31.59% Black or African American Alone 56 1.92% American Indian and Alaska Native Alone 135 4.63% Asian Alone 13 0.45% Native Hawaiian and Other Pacific Islander Alone 3 0.10% Some Other Race Alone 1,568 54.00% Two or More Races 212 7.30% 2010 Population by Sex 17,924 Male 8,777 48.97% Female 9,146 51.03% Male/Female Ratio 0.96
Pop-Facts:
2010 Population by Age 17,924 Age 0 to 4 1,342 7.48% Age 5 to 9 1,192 6.65% Age 10 to 14 988 5.51% Age 15 to 17 605 3.38% Age 18 to 20 512 2.86% Age 21 to 24 745 4.16% Age 25 to 34 3,297 18.40% Age 35 to 44 3,110 17.35% Age 45 to 54 2,457 13.71% Age 55 to 64 2,104 11.74% Age 65 to 74 859 4.79% Age 75 to 84 460 2.57% Age 85 and over 252 1.40% Age 16 and over 14,172 79.07% Age 18 and over 13,797 76.97% Age 21 and over 13,284 74.12% Age 65 and over 1,571 8.76% 2010 Median Age 35.90 5085 NE 56th Ave, Portland, OR 97218 Sitewise Online
Census Demographic Overview (Part 1) Pop-Facts: Census Demographic Overview (Part 1) 5085 NE 56th Ave, Portland, OR 97218 0 - 1 mi
© Claritas, LLC 2022. All rights reserved.
2010 Male Population by Age 8,777 Age 0 to 4 663 7.56% Age 5 to 9 589 6.71% Age 10 to 14 529 6.02% Age 15 to 17 310 3.54% Age 18 to 20 280 3.19% Age 21 to 24 384 4.37% Age 25 to 34 1,581 18.02% Age 35 to 44 1,607 18.31% Age 45 to 54 1,170 13.33% Age 55 to 64 1,001 11.41% Age 65 to 74 403 4.59% Age 75 to 84 172 1.96% Age 85 and over 87 0.99% 2010 Median Age, Male 35.32 2010 Female Population by Age 9,146 Age 0 to 4 678 7.42% Age 5 to 9 603 6.59% Age 10 to 14 459 5.02% Age 15 to 17 295 3.22% Age 18 to 20 232 2.54% Age 21 to 24 361 3.95% Age 25 to 34 1,716 18.76% Age 35 to 44 1,502 16.43% Age 45 to 54 1,288 14.08% Age 55 to 64 1,102 12.05% Age 65 to 74 456 4.99% Age 75 to 84 288 3.15% Age 85 and over 165 1.80% 2010 Median Age, Female 36.52
5085 NE 56th Ave, Portland, OR 97218 Sitewise Online Pop-Facts: Census Demographic Overview (Part 1) Pop-Facts: Census Demographic Overview (Part 1) 5085 NE 56th Ave, Portland, OR 97218 0 - 1 mi
Copyright
5085 NE 56th Ave, Portland, OR 97218 Sitewise Online Pop-Facts: Census Demographic Overview (Part 2) Pop-Facts: Census Demographic Overview (Part 2) 5085 NE 56th Ave, Portland, OR 97218 0 - 1 mi Households 2027 Projection 7,968 2022 Estimate 7,682 2010 Census 7,040 2000 Census 6,661 Growth 2022-2027 3.72% Growth 2010-2022 9.12% Growth 2000-2010 5.69% 2010 Households by Household Type 7,040 Family Households 4,006 56.90% Non-family Households 3,034 43.10% 2010 Group Quarters Population 276 2010 Hispanic or Latino Households 678 9.63% 2010 Households by Household Size 7,040 1-person 2,001 28.42% 2-person 2,330 33.10% 3-person 1,173 16.66% 4-person 823 11.69% 5-person 380 5.40% 6-person 170 2.41% 7-or-more-person 163 2.31%
2010 Households by Type and Presence of Children 7,040 Married-Couple Family, own children 1,270 18.04% Male Householder, own children 153 2.17% Female Householder, own children 508 7.21% Married-Couple Family, no own children 1,499 21.29% Male Householder, no own children 203 2.89% Female Householder, no own children 373 5.30% Non-family Households 3,034 43.10% 2010 Households by Presence of People Under Age 18 7,040 HH with 1 or More People Under Age 18: 2,145 30.47% Households with No People Under Age 18: 4,895 69.53% HH with 1 or More People Under Age 18: 2,145 Married-Couple Family 1,328 61.91% Other Family, Male Householder 190 8.84% Other Family, Female Householder 588 27.41% Nonfamily, Male Householder 22 1.03% Nonfamily, Female Householder 17 0.81% Households with No People Under Age 18: 4,895 Married-Couple Family 1,441 29.44% Other Family, Male Householder 167 3.40% Other Family, Female Householder 293 5.98% Nonfamily, Male Householder 1,375 28.09% Nonfamily, Female Householder 1,619 33.08% 2010 Occupied Housing Units by Tenure 7,040 Owner-Occupied 4,547 64.59% Renter-Occupied 2,493 35.41% Copyright © Claritas,
5085 NE 56th Ave, Portland, OR 97218 Sitewise Online Pop-Facts: Census Demographic Overview (Part 2) Pop-Facts: Census Demographic Overview (Part 2) 5085 NE 56th Ave, Portland, OR 97218 0 - 1 mi
LLC 2022. All rights reserved.
5085 NE 56th Ave, Portland, OR 97218 Sitewise Online Retail Market Power Opportunity Gap Report By Retail Store Types Retail Market Power Opportunity Gap Report By Retail Store Types 5085 NE 56th Ave, Portland, OR 97218 0 - 1 mi 2022 Demand 2022 Supply Opportunity Gap/Surplus Total retail trade including food and drink (NAICS 44, 45 and 722) $402,848,578 $257,898,690 $144,949,887 Total retail trade (NAICS 44 and 45) $357,454,257 $213,755,427 $143,698,831 Motor vehicle and parts dealers (NAICS 441) $80,557,729 $59,694,906 $20,862,824 Automobile dealers (NAICS 4411) $67,538,163 $45,338,993 $22,199,169 New car dealers (NAICS 44111) $60,022,664 $34,300,531 $25,722,132 Used car dealers (NAICS 44112) $7,515,499 $11,038,462 -$3,522,962 Other motor vehicle dealers (NAICS 4412) $7,447,417 $6,526,668 $920,749 Recreational vehicle dealers (NAICS 44121) $2,953,163 $5,572,127 -$2,618,964 Motorcycle, boat, and other motor vehicle dealers (NAICS 44122) $4,494,254 $954,541 $3,539,713 Boat dealers (NAICS 441222) $1,758,188 $289,943 $1,468,245 Motorcycle, ATV, and all other motor vehicle dealers (NAICS 441228) $2,736,066 $664,598 $2,071,468 Automotive parts, accessories, and tire stores (NAICS 4413) $5,572,150 $7,829,245 -$2,257,095 Automotive parts and accessories stores (NAICS 44131) $3,523,300 $4,802,968 -$1,279,668 Tire dealers (NAICS 44132) $2,048,850 $3,026,277 -$977,427 Furniture and home furnishings stores (NAICS 442) $7,597,506 $2,053,327 $5,544,179 Furniture stores (NAICS 4421) $4,126,522 $1,727,458 $2,399,065 Home furnishings stores (NAICS 4422) $3,470,984 $325,869 $3,145,114 Floor covering stores (NAICS 44221) $1,692,826 $138,490 $1,554,335 Other home furnishings stores (NAICS 44229) $1,778,158 $187,379 $1,590,779 Window treatment stores (NAICS 442291) $ 88,576 $ 0 $ 88,576 All other home furnishings stores (NAICS 442299) $1,689,582 $187,379 $1,502,203 Electronics and appliance stores (NAICS 443) $4,716,545 $6,604,752 -$1,888,207 Household appliance stores (NAICS 443141) $1,125,456 $1,333,938 -$208,482 Electronics stores (NAICS 443142) $3,591,089 $5,270,814 -$1,679,725 Building material and garden equipment and supplies dealers (NAICS 444) $26,604,790 $13,815,970 $12,788,820 Building material and supplies dealers (NAICS 4441) $22,949,848 $11,793,943 $11,155,905 Home centers (NAICS 44411) $12,714,723 $11,089,047 $1,625,676 Paint and wallpaper stores (NAICS 44412) $779,861 $ 0 $779,861 Hardware stores (NAICS 44413) $2,028,090 $ 0 $2,028,090 Other building material dealers (NAICS 44419) $7,427,173 $704,896 $6,722,277 Lawn and garden equipment and supplies stores (NAICS 4442) $3,654,943 $2,022,027 $1,632,915 Outdoor power equipment stores (NAICS 44421) $746,203 $1,579,836 -$833,633 Nursery, garden center, and farm supply stores (NAICS 44422) $2,908,740 $442,191 $2,466,549 Food and beverage stores (NAICS 445) $53,274,418 $50,288,067 $2,986,351 Grocery stores (NAICS 4451) $47,165,160 $49,830,332 -$2,665,172 Supermarkets and other grocery (except convenience) stores (NAICS 44511) $45,234,107 $46,988,951 -$1,754,844 Convenience stores (NAICS 44512) $1,931,053 $2,841,381 -$910,328 Specialty food stores (NAICS 4452) $1,370,781 $ 91,732 $1,279,049
Meat markets (NAICS 44521) $414,497 $ 8,700 $405,797 Fish and seafood markets (NAICS 44522) $163,183 $ 8,424 $154,759 Fruit and vegetable markets (NAICS 44523) $284,273 $ 0 $284,273 Other specialty food stores (NAICS 44529) $508,829 $ 74,608 $434,221 Baked goods and confectionery and nut stores (NAICS 445291 + 445292) $269,886 $ 0 $269,886 All other specialty food stores (NAICS 445299) $238,943 $ 74,608 $164,335 Beer, wine, and liquor stores (NAICS 4453) $4,738,477 $366,003 $4,372,474 Health and personal care stores (NAICS 446) $20,752,307 $10,751,835 $10,000,473 Pharmacies and drug stores (NAICS 44611) $18,031,840 $10,635,510 $7,396,330 Cosmetics, beauty supplies, and perfume stores (NAICS 44612) $1,206,524 $ 0 $1,206,524 Optical goods stores (NAICS 44613) $553,165 $ 0 $553,165 Other health and personal care stores (NAICS 44619) $960,777 $116,324 $844,453 Food (health) supplement stores (NAICS 446191) $341,623 $ 0 $341,623 All other health and personal care stores (NAICS 446199) $619,154 $116,324 $502,830 Gasoline stations (NAICS 447) $28,060,488 $7,834,704 $20,225,784 Clothing and clothing accessories stores (NAICS 448) $14,261,668 $8,816,451 $5,445,217 Clothing stores (NAICS 4481) $9,323,806 $6,257,745 $3,066,061 Men's clothing stores (NAICS 44811) $433,310 $ 0 $433,310 Women's clothing stores (NAICS 44812) $1,660,205 $1,225,352 $434,853 Children's and infants' clothing stores (NAICS 44813) $298,232 $ 0 $298,232 Family clothing stores (NAICS 44814) $5,602,820 $4,662,468 $940,352 Clothing accessories stores (NAICS 44815) $466,497 $170,575 $295,922 Other clothing stores (NAICS 44819) $862,742 $199,349 $663,392 Shoe stores (NAICS 4482) $2,004,393 $247,756 $1,756,637 Jewelry, luggage, and leather goods stores (NAICS 4483) $2,933,470 $2,310,951 $622,519 Jewelry stores (NAICS 44831) $1,912,850 $ 72,161 $1,840,689 Luggage and leather goods stores (NAICS 44832) $1,020,620 $2,238,790 -$1,218,170 Sporting goods, hobby, musical instrument, and book stores (NAICS 451) $5,593,725 $6,082,204 -$488,480 Sporting goods, hobby, and musical instrument stores (NAICS 4511) $5,042,014 $6,026,291 -$984,278 Sporting goods stores (NAICS 45111) $3,700,552 $5,087,636 -$1,387,084 Hobby, toy, and game stores (NAICS 45112) $975,078 $151,510 $823,568 Sewing, needlework, and piece goods stores (NAICS 45113) $166,327 $244,241 -$77,914 Musical instrument and supplies stores (NAICS 45114) $200,056 $542,905 -$342,848 Book stores and news dealers (NAICS 4512) $551,711 $ 55,913 $495,798 Book stores (NAICS 451211) $513,189 $ 55,913 $457,276 News dealers and newsstands (NAICS 451212) $ 38,522 $ 0 $ 38,522 General merchandise stores (NAICS 452) $45,619,270 $13,515,867 $32,103,402 Department stores (NAICS 4522) $5,690,958 $ 0 $5,690,958 Other general merchandise stores (NAICS 4523) $39,928,311 $13,515,867 $26,412,444 Warehouse clubs and supercenters (NAICS 452311) $36,072,774 $13,515,867 $22,556,908 All other general merchandise stores (NAICS 452319) $3,855,536 $ 0 $3,855,536 5085 NE 56th Ave, Portland, OR 97218 Sitewise Online Retail Market Power Opportunity Gap Report By Retail Store Types Retail Market Power Opportunity Gap Report By Retail Store Types 5085 NE 56th Ave, Portland, OR 97218 0 - 1 mi 2022 Demand 2022 Supply Opportunity Gap/Surplus
* GAFO (General merchandise, Apparel, Furniture and Other) represents sales at stores that sell merchandise normally sold in department stores. This category is not included in Total Retail Sales Including Eating and Drinking Places.
Miscellaneous store retailers (NAICS 453) $7,918,746 $12,464,250 -$4,545,504 Florists (NAICS 4531) $368,479 $433,635 -$65,156 Office supplies, stationery, and gift stores (NAICS 4532) $1,732,281 $3,552,398 -$1,820,117 Office supplies and stationery stores (NAICS 45321) $737,091 $583,675 $153,416 Gift, novelty, and souvenir stores (NAICS 45322) $995,190 $2,968,723 -$1,973,533 Used merchandise stores (NAICS 4533) $1,141,520 $728,103 $413,417 Other miscellaneous store retailers (NAICS 4539) $4,676,467 $7,750,115 -$3,073,648 Pet and pet supplies stores (NAICS 45391) $1,388,334 $1,480,698 -$92,364 Art dealers (NAICS 45392) $761,822 $ 0 $761,822 Manufactured (mobile) home dealers (NAICS 45393) $502,215 $ 0 $502,215 All other miscellaneous store retailers (NAICS 45399) $2,024,096 $6,269,417 -$4,245,321 Tobacco stores (NAICS 453991) $555,464 $1,419,319 -$863,855 All other miscellaneous store retailers (except tobacco stores) (NAICS 453998) $1,468,632 $4,850,098 -$3,381,466 Non-store retailers (NAICS 454) $62,497,064 $21,833,095 $40,663,969 Electronic shopping and mail-order houses (NAICS 4541) $59,225,631 $21,833,095 $37,392,536 Vending machine operators (NAICS 4542) $440,685 $ 0 $440,685 Direct selling establishments (NAICS 4543) $2,830,749 $ 0 $2,830,749 Fuel dealers (NAICS 45431) $1,371,549 $ 0 $1,371,549 Other direct selling establishments (NAICS 45439) $1,459,200 $ 0 $1,459,200 Food services and drinking places (NAICS 722) $45,394,321 $44,143,263 $1,251,058 Special food services (NAICS 7223) $3,617,350 $1,570,541 $2,046,809 Food service contractors (NAICS 72231) $2,864,501 $868,636 $1,995,865 Caterers (NAICS 72232) $686,034 $492,790 $193,243 Mobile food services (NAICS 72233) $ 66,816 $209,115 -$142,299 Drinking places (alcoholic beverages) (NAICS 7224) $1,563,380 $4,074,615 -$2,511,235 Restaurants and other eating places (NAICS 7225) $40,213,590 $38,498,106 $1,715,484 Full-service restaurants (NAICS 722511) $20,272,260 $13,922,771 $6,349,490 Limited-service restaurants (NAICS 722513) $16,923,890 $18,474,054 -$1,550,163 Cafeterias, grill buffets, and buffets (NAICS 722514) $431,435 $ 0 $431,435 Snack and nonalcoholic beverage bars (NAICS 722515) $2,586,004 $6,101,282 -$3,515,278 GAFO* $77,790,446 $37,076,153 $40,714,292 General Merchandise Stores-452 $45,619,270 $13,515,867 $32,103,402 Clothing & Clothing Accessories Stores-448 $14,261,668 $8,816,451 $5,445,217 Furniture & Home Furnishings Stores-442 $7,597,506 $2,053,327 $5,544,179 Electronics & Appliance Stores-443 $4,716,545 $6,604,752 -$1,888,207 Sporting Goods, Hobby, Book, Music Stores-451 $5,593,725 $6,082,204 -$488,480 Office Supplies, Stationery, Gift Stores-4532 $1,732,281 $3,552,398 -$1,820,117
5085 NE 56th Ave, Portland, OR 97218 Sitewise Online Retail Market Power Opportunity Gap Report By Retail Store Types Retail Market Power Opportunity Gap Report By Retail Store Types 5085 NE 56th Ave, Portland, OR 97218 0 - 1 mi 2022 Demand 2022 Supply Opportunity Gap/Surplus
5085 NE 56th Ave, Portland, OR 97218
Sitewise Online
Retail Market Power Opportunity Gap Report By Retail Store Types
Retail Market Power Opportunity Gap Report
By Retail Store Types
Retail Market Power data is derived from two major sources of information. The demand data is derived from the Consumer Expenditure Survey (CE Survey or CEX), which is fielded by the U.S. Bureau of Labor Statistics (BLS). The supply data is derived from the Census of Retail Trade (CRT), which is made available by the U.S. Census. Additional data sources are incorporated to create both supply and demand estimates. The difference between demand and supply represents the opportunity gap or surplus available for each merchandise line in the specified reporting geography. When this difference is positive (demand is greater than the supply), there is an opportunity gap for that merchandise line; when the difference is negative (supply is greater than demand), there is a surplus.
Copyright © 2022 Environics Analytics. All rights reserved.
5085 NE 56th Ave, Portland, OR 97218 0 - 1 mi 2022 Demand 2022 Supply Opportunity Gap/Surplus


 Powered by Sitewise
Data Source: Kalibrate TrafficMetrix
Powered by Sitewise
Data Source: Kalibrate TrafficMetrix