COMMUNITY

Demographics
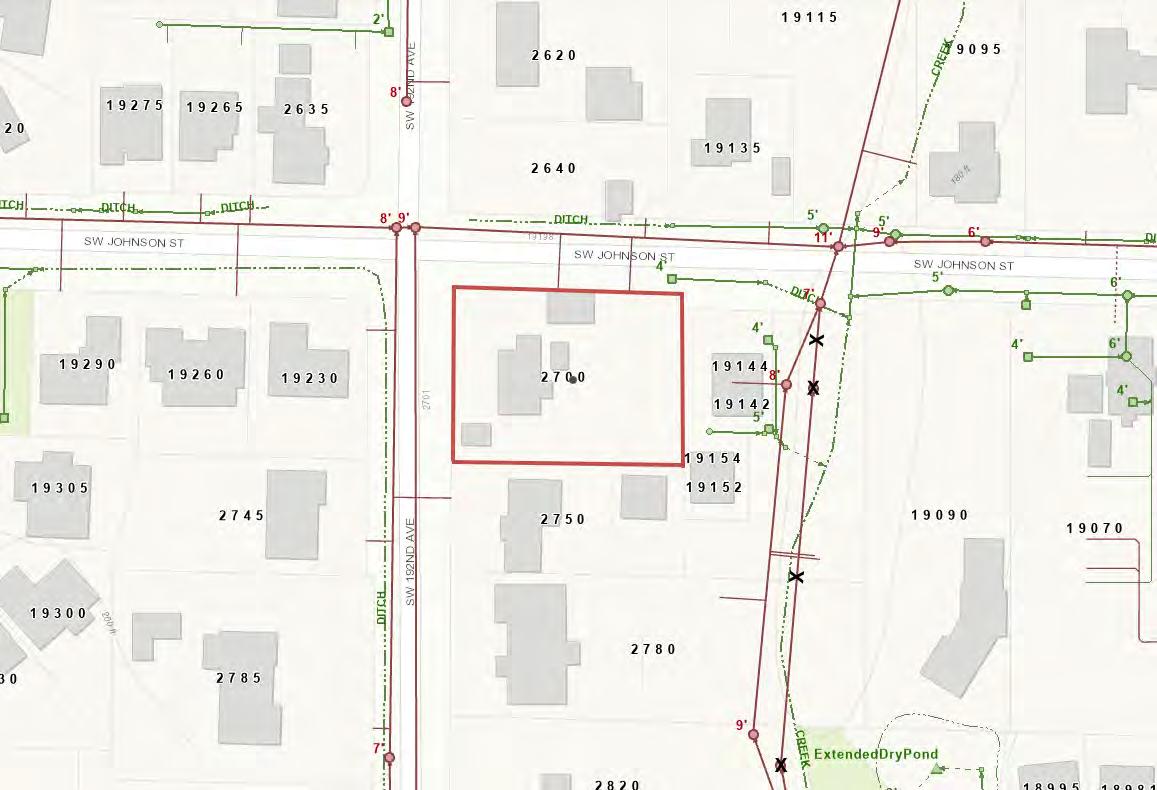
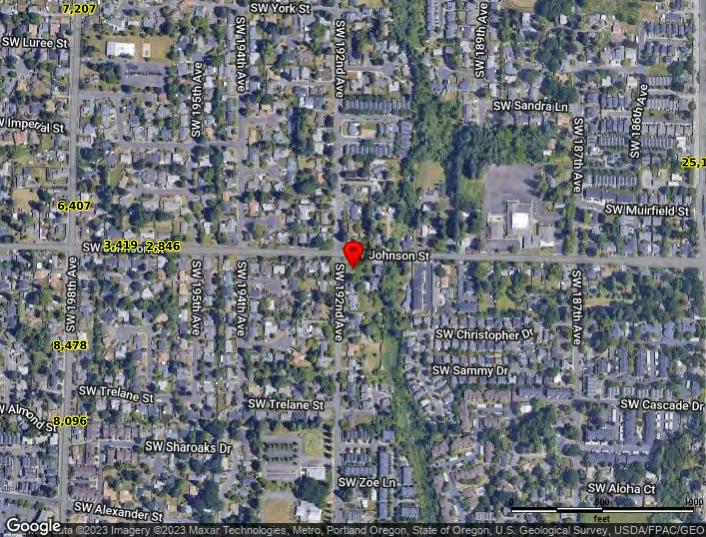
Traffic Counts
The information contained is provided by WFG’s Customer Service Department to our customers, and while deemed reliable, is not guaranteed.
INFORMATION
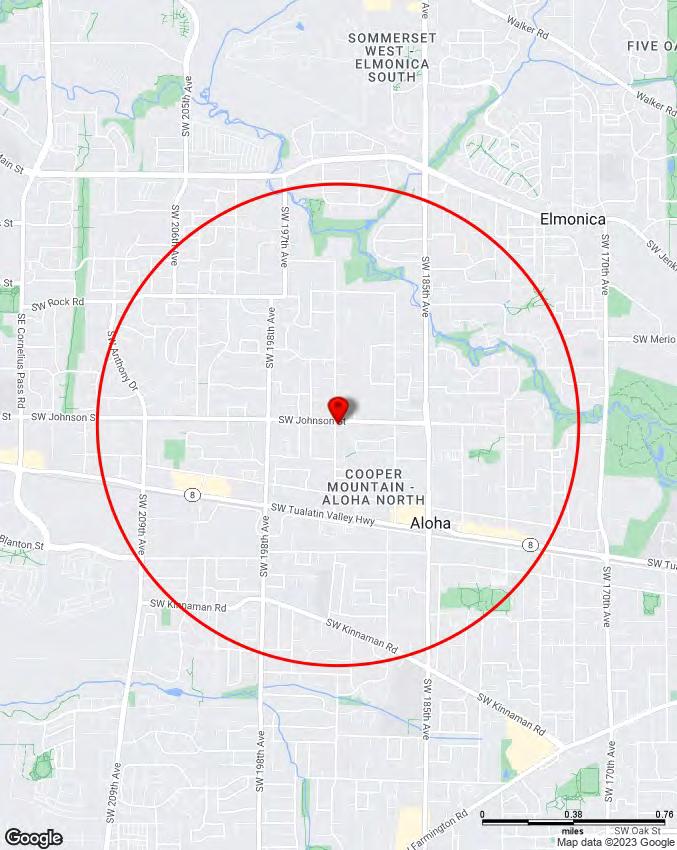
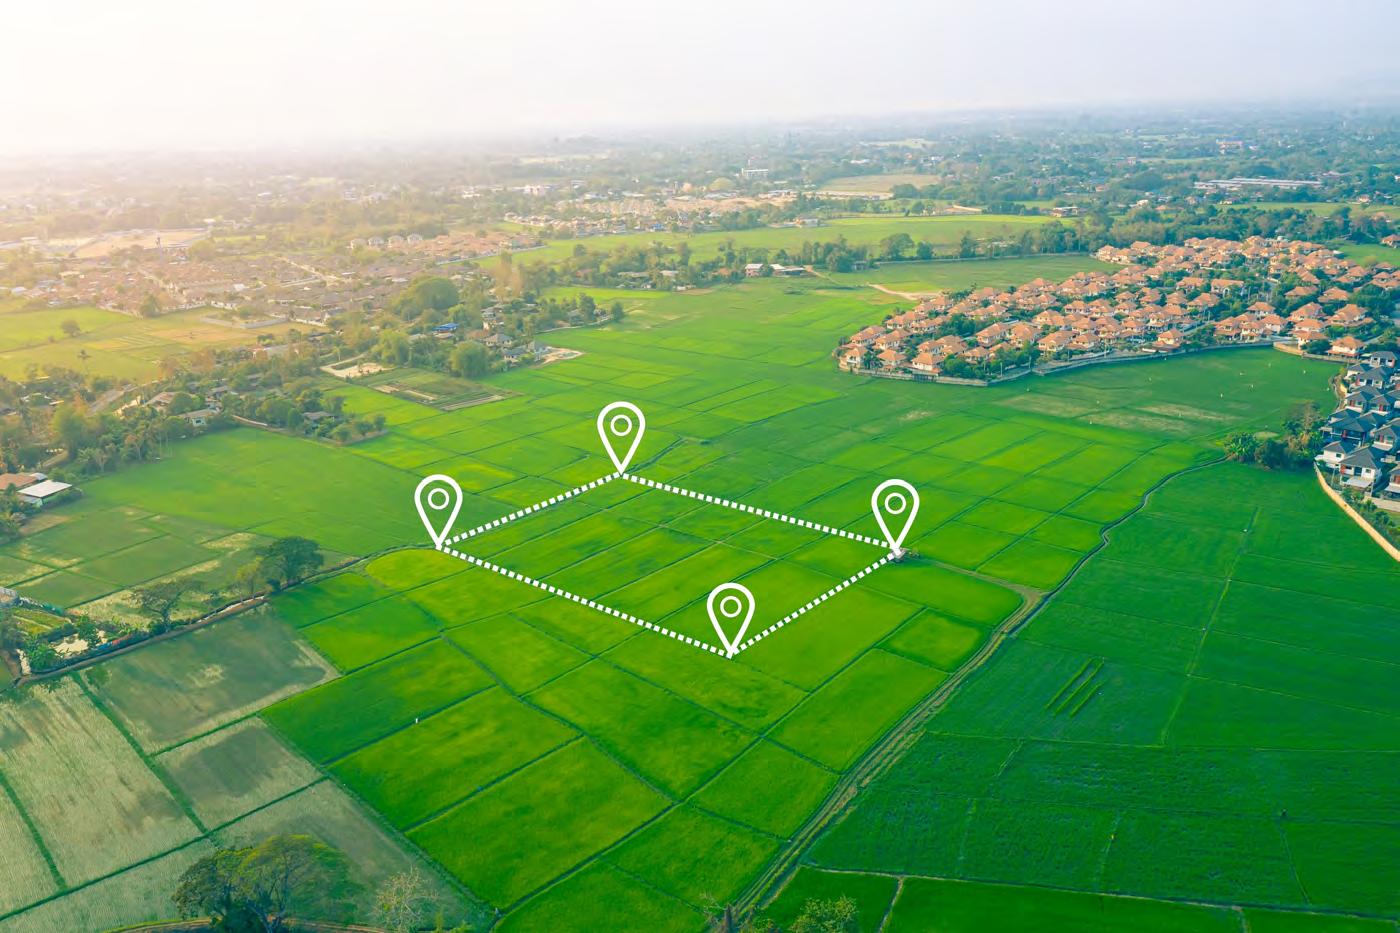
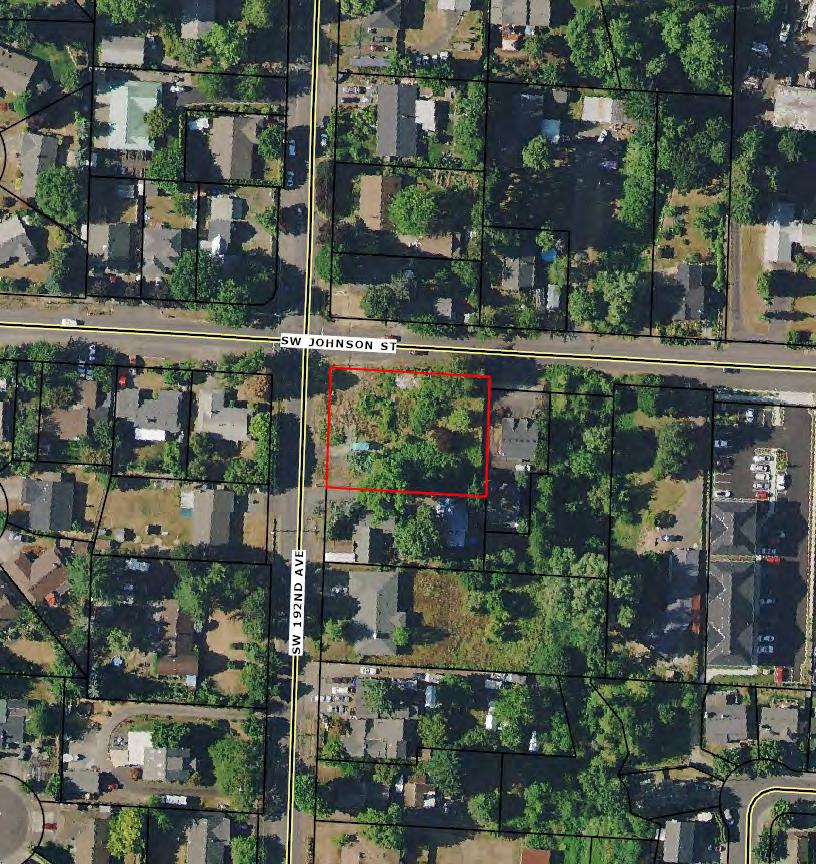
2700 SW 192nd Ave, Beaverton, OR 97006

Pop-Facts: Population Quick Facts 2700 SW 192nd Ave, Beaverton, OR 97006 0 - 1 mi Population 2027 Projection 23,697 2022 Estimate 22,609 2010 Census 19,666 2000 Census 16,672 Growth 2022-2027 4.81% Growth 2010-2022 14.96% Growth 2000-2010 17.96% 2022 Est. Population by Age 22,609 Age 0 to 4 1,546 6.84% Age 5 to 9 1,514 6.70% Age 10 to 14 1,571 6.95% Age 15 to 17 923 4.08% Age 18 to 20 831 3.67% Age 21 to 24 1,075 4.76% Age 25 to 34 3,467 15.34% Age 35 to 44 3,826 16.92% Age 45 to 54 3,025 13.38% Age 55 to 64 2,261 10.00% Age 65 to 74 1,692 7.48% Age 75 to 84 702 3.10% Age 85 and over 176 0.78% Age 16 and over 17,675 78.18% Age 18 and over 17,055 75.43% Age 21 and over 16,224 71.76% Age 65 and over 2,569 11.36% 2022 Est. Median Age 35.99 2022 Est. Average Age 36.44
2700 SW 192nd Ave, Beaverton, OR 97006 Sitewise Online Pop-Facts: Population Quick Facts
2022 Est. Population by Single-Classification Race 22,609 White Alone 13,392 59.23% Black or African American Alone 919 4.07% American Indian and Alaska Native Alone 256 1.13% Asian Alone 2,789 12.33% Native Hawaiian and Other Pacific Islander Alone 109 0.48% Some Other Race Alone 3,549 15.70% Two or More Races 1,595 7.05% 2022 Est. Population by Ethnicity (Hispanic or Latino) 22,609 Hispanic or Latino 6,399 28.30% Not Hispanic or Latino 16,210 71.70% 2022 Est. Population by Sex 22,609 Male 11,392 50.39% Female 11,217 49.61%
2700 SW 192nd Ave, Beaverton, OR 97006 Sitewise Online Pop-Facts: Population Quick Facts Pop-Facts: Population Quick Facts 2700 SW 192nd Ave, Beaverton, OR 97006 0 - 1 mi
Copyright © Claritas, LLC 2022. All rights reserved.
2700 SW 192nd Ave, Beaverton, OR 97006 Sitewise Online Pop-Facts: Household Quick Facts Pop-Facts: Household Quick Facts 2700 SW 192nd Ave, Beaverton, OR 97006 0 - 1 mi Households 2027 Projection 8,109 2022 Estimate 7,723 2010 Census 6,676 2000 Census 5,746 Growth 2022-2027 5.00% Growth 2010-2022 15.69% Growth 2000-2010 16.18% 2022 Est. Households by Household Income 7,723 Income Less than $15,000 444 5.74% Income $15,000 to $24,999 428 5.54% Income $25,000 to $34,999 464 6.01% Income $35,000 to $49,999 658 8.52% Income $50,000 to $74,999 1,383 17.91% Income $75,000 to $99,999 1,327 17.18% Income $100,000 to $124,999 1,024 13.26% Income $125,000 to $149,999 702 9.09% Income $150,000 to $199,999 728 9.43% Income $200,000 to $249,999 323 4.19% Income $250,000 to $499,999 196 2.54% Income $500,000 or more 45 0.58% 2022 Est. Average Household Income $98,687 2022 Est. Median Household Income $84,131 2022 Median HH Inc. by Single-Classification Race White Alone $83,470 Black or African American Alone $84,668 American Indian and Alaska Native Alone $77,837 Asian Alone $97,921 Native Hawaiian and Other Pacific Islander Alone $78,477 Some Other Race Alone $70,570 Two or More Races $97,948 Hispanic or Latino $72,608 Not Hispanic or Latino $87,996 2022 Est. Households by Household Type 7,723 Family Households 5,639 73.02% Nonfamily Households 2,084 26.98% 2022 Est. Group Quarters Population 190
2022 Est. Households by Household Size 7,723 1-person 1,440 18.65% 2-person 2,374 30.73% 3-person 1,508 19.53% 4-person 1,206 15.61% 5-person 655 8.48% 6-person 305 3.95% 7-or-more-person 235 3.04% 2022 Est. Average Household Size 2.90 2700 SW 192nd Ave,
Sitewise Online Pop-Facts: Household Quick Facts Pop-Facts: Household Quick Facts 2700 SW 192nd Ave, Beaverton, OR 97006 0 - 1 mi
Beaverton, OR 97006
© Claritas, LLC 2022. All rights reserved.
2022 Est. HHs by Type by Presence of Own Children 5,639 Married-Couple Family, own children 2,081 36.90% Married-Couple Family, no own children 2,032 36.04% Male Householder, own children 257 4.55% Male Householder, no own children 224 3.97% Female Householder, own children 695 12.32% Female Householder, no own children 351 6.22% Copyright
2700 SW 192nd Ave, Beaverton, OR 97006 Sitewise Online Pop-Facts: Household Quick Facts Pop-Facts: Household Quick Facts 2700 SW 192nd Ave, Beaverton, OR 97006 0 - 1 mi
2700 SW 192nd Ave, Beaverton, OR 97006 Sitewise Online
Pop-Facts: Demographic Snapshot (Part 1)
Pop-Facts: Demographic Snapshot (Part 1) 2700 SW 192nd Ave, Beaverton, OR 97006 0 - 1 mi Population 2027 Projection 23,697 2022 Estimate 22,609 2010 Census 19,666 2000 Census 16,672 Growth 2022-2027 4.81% Growth 2010-2022 14.96% Growth 2000-2010 17.96% 2022 Est. Population by Single-Classification Race 22,609 White Alone 13,392 59.23% Black or African American Alone 919 4.07% American Indian and Alaska Native Alone 256 1.13% Asian Alone 2,789 12.33% Native Hawaiian and Other Pacific Islander Alone 109 0.48% Some Other Race Alone 3,549 15.70% Two or More Races 1,595 7.05% 2022 Est. Population Hispanic or Latino by Origin 22,609 Not Hispanic or Latino 16,210 71.70% Hispanic or Latino 6,399 28.30% Hispanic or Latino by Origin 6,399 Mexican 5,156 80.57% Puerto Rican 104 1.63% Cuban 32 0.50% All Other Hispanic or Latino 1,107 17.29% 2022 Est. Hisp. or Latino Pop by Single-Classification Race 6,399 White Alone 2,206 34.48% Black or African American Alone 72 1.12% American Indian and Alaska Native Alone 107 1.67% Asian Alone 37 0.58% Native Hawaiian and Other Pacific Islander Alone 5 0.08% Some Other Race Alone 3,512 54.88% Two or More Races 460 7.19%
2022 Est. Pop by Race, Asian Alone, by Category 2,789 Chinese, except Taiwanese 211 7.55% Filipino 537 19.24% Japanese 277 9.92% Asian Indian 329 11.80% Korean 171 6.14% Vietnamese 671 24.07% Cambodian 214 7.68% Hmong 13 0.45% Laotian 61 2.19% Thai 0 0.00% All other Asian Races, including 2 or more 306 10.96% 2022 Est. Population by Ancestry 22,609 Arab 6 0.03% Czech 37 0.16% Danish 150 0.66% Dutch 216 0.95% English 1,355 5.99% French (except Basque) 431 1.91% French Canadian 251 1.11% German 2,390 10.57% Greek 21 0.09% Hungarian 84 0.37% Irish 1,362 6.02% Italian 457 2.02% Lithuanian 1 0.01% Norwegian 346 1.53% Polish 300 1.33% Portuguese 41 0.18% Russian 124 0.55% Scottish 270 1.19% Scotch-Irish 152 0.67% Slovak 19 0.09% Subsaharan African 536 2.37% Swedish 401 1.78% Swiss 54 0.24% Ukrainian 73 0.33% United States or American 689 3.05% Welsh 106 0.47% West Indian (except Hisp. groups) 19 0.09% Other Ancestries 9,780 43.26% Ancestry Unclassified 2,936 12.98% 2022 Est. Pop Age 5+ by Language Spoken At Home 21,063 Speak only English 14,743 69.99%
Pop-Facts: Demographic Snapshot (Part 1) 2700
Ave,
97006 0 - 1 mi
2700 SW 192nd Ave, Beaverton, OR 97006 Sitewise Online
Pop-Facts: Demographic Snapshot (Part 1)
SW 192nd
Beaverton, OR
Speak Asian or Pacific Island Language 1,378 6.54% Speak IndoEuropean Language 861 4.09% Speak Spanish 3,646 17.31% Speak Other Language 435 2.07% 2700 SW 192nd Ave, Beaverton, OR 97006 Sitewise Online Pop-Facts: Demographic Snapshot (Part 1) Pop-Facts: Demographic Snapshot (Part 1) 2700 SW 192nd Ave, Beaverton, OR 97006 0 - 1 mi
2022 Est. Population by Sex 22,609 Male 11,392 50.39% Female 11,217 49.61% 2022 Est. Population by Age 22,609 Age 0 to 4 1,546 6.84% Age 5 to 9 1,514 6.70% Age 10 to 14 1,571 6.95% Age 15 to 17 923 4.08% Age 18 to 20 831 3.67% Age 21 to 24 1,075 4.76% Age 25 to 34 3,467 15.34% Age 35 to 44 3,826 16.92% Age 45 to 54 3,025 13.38% Age 55 to 64 2,261 10.00% Age 65 to 74 1,692 7.48% Age 75 to 84 702 3.10% Age 85 and over 176 0.78% Age 16 and over 17,675 78.18% Age 18 and over 17,055 75.43% Age 21 and over 16,224 71.76% Age 65 and over 2,569 11.36% 2022 Est. Median Age 35.99 2022 Est. Average Age 36.44
2700 SW 192nd Ave, Beaverton, OR 97006 Sitewise Online
Pop-Facts:
2700
0 - 1 mi
Pop-Facts: Demographic Snapshot (Part 1)
Demographic Snapshot (Part 1)
SW 192nd Ave, Beaverton, OR 97006
Pop-Facts: Demographic Snapshot (Part 1)
2022 Est. Male Population by Age 11,392 Age 0 to 4 844 7.41% Age 5 to 9 779 6.84% Age 10 to 14 823 7.22% Age 15 to 17 475 4.17% Age 18 to 20 427 3.74% Age 21 to 24 537 4.71% Age 25 to 34 1,793 15.74% Age 35 to 44 1,929 16.94% Age 45 to 54 1,534 13.46% Age 55 to 64 1,117 9.81% Age 65 to 74 769 6.75% Age 75 to 84 300 2.64% Age 85 and over 65 0.57% 2022 Est. Median Age, Male 35.10 2022 Est. Average Age, Male 35.49 2022 Est. Female Population by Age 11,217 Age 0 to 4 702 6.26% Age 5 to 9 735 6.55% Age 10 to 14 748 6.67% Age 15 to 17 448 3.99% Age 18 to 20 404 3.60% Age 21 to 24 539 4.80% Age 25 to 34 1,675 14.93% Age 35 to 44 1,897 16.91% Age 45 to 54 1,491 13.29% Age 55 to 64 1,144 10.20% Age 65 to 74 923 8.23% Age 75 to 84 401 3.58% Age 85 and over 111 0.99% 2022 Est. Median Age, Female 36.89 2022 Est. Average Age, Female 37.40
2700 SW 192nd Ave, Beaverton, OR 97006 Sitewise Online
Pop-Facts: Demographic Snapshot (Part 1) 2700 SW 192nd Ave, Beaverton, OR 97006 0 - 1 mi
2022 Est. Pop Age 15+ by Marital Status 17,977 Total, Never Married 6,397 35.59% Males, Never Married 3,564 19.82% Females, Never Married 2,834 15.76% Married, Spouse present 7,720 42.94% Married, Spouse absent 835 4.65% Widowed 756 4.21% Males, Widowed 132 0.73% Females, Widowed 624 3.47% Divorced 2,268 12.62% Males, Divorced 1,011 5.62% Females, Divorced 1,258 7.00% 2022 Est. Pop Age 25+ by Edu. Attainment 15,149 Less than 9th grade 766 5.06% Some High School, no diploma 704 4.65% High School Graduate (or GED) 3,635 23.99% Some College, no degree 3,640 24.03% Associate Degree 1,674 11.05% Bachelor's Degree 3,281 21.66% Master's Degree 1,030 6.80% Professional School Degree 140 0.92% Doctorate Degree 279 1.84% 2022 Est. Pop. Age 25+ by Edu. Attain., Hisp./Lat. 3,358 No High School Diploma 812 24.19% High School Graduate 1,064 31.67% Some College or Associate's Degree 1,177 35.06% Bachelor's Degree or Higher 305 9.09% Copyright © Claritas, LLC 2022. All rights reserved. 2700 SW
Ave,
Sitewise Online Pop-Facts: Demographic Snapshot (Part 1) Pop-Facts: Demographic Snapshot (Part 1) 2700 SW 192nd Ave, Beaverton, OR 97006 0 - 1 mi
192nd
Beaverton, OR 97006
Online Pop-Facts: Demographic Snapshot
2) Pop-Facts: Demographic Snapshot (Part 2) 2700 SW 192nd Ave, Beaverton, OR 97006 0 - 1 mi Households 2027 Projection 8,109 2022 Estimate 7,723 2010 Census 6,676 2000 Census 5,746 Growth 2022-2027 5.00% Growth 2010-2022 15.69% Growth 2000-2010 16.18% 2022 Est. Households by Household Type 7,723 Family Households 5,639 73.02% Nonfamily Households 2,084 26.98% 2022 Est. Group Quarters Population 190 2022 HHs by Ethnicity: Hispanic/Latino 1,503 19.46% 2022 Est. Households by HH Income 7,723 Income < $15,000 444 5.74% Income $15,000 to $24,999 428 5.54% Income $25,000 to $34,999 464 6.01% Income $35,000 to $49,999 658 8.52% Income $50,000 to $74,999 1,383 17.91% Income $75,000 to $99,999 1,327 17.18% Income $100,000 to $124,999 1,024 13.26% Income $125,000 to $149,999 702 9.09% Income $150,000 to $199,999 728 9.43% Income $200,000 to $249,999 323 4.19% Income $250,000 to $499,999 196 2.54% Income $500,000+ 45 0.58% 2022 Est. Average Household Income $98,687 2022 Est. Median Household Income $84,131 2022 Median HH Income by Single-Class. Race or Ethn. White Alone $83,470 Black or African American Alone $84,668 American Indian and Alaska Native Alone $77,837 Asian Alone $97,921 Native Hawaiian and Other Pacific Islander Alone $78,477 Some Other Race Alone $70,570 Two or More Races $97,948 Hispanic or Latino $72,608
2700 SW 192nd Ave, Beaverton, OR 97006 Sitewise
(Part
Not Hispanic or Latino $87,996
2700 SW 192nd Ave, Beaverton, OR 97006 Sitewise Online
Pop-Facts: Demographic Snapshot (Part 2)
Pop-Facts: Demographic Snapshot (Part 2) 2700 SW 192nd Ave, Beaverton, OR 97006 0 - 1 mi
Pop-Facts: Demographic Snapshot (Part 2)
2022 Est. Family HH Type by Presence of Own Children 5,639 Married-Couple Family, own children 2,081 36.90% Married-Couple Family, no own children 2,032 36.04% Male Householder, own children 257 4.55% Male Householder, no own children 224 3.97% Female Householder, own children 695 12.32% Female Householder, no own children 351 6.22% 2022 Est. Households by Household Size 7,723 1-person 1,440 18.65% 2-person 2,374 30.73% 3-person 1,508 19.53% 4-person 1,206 15.61% 5-person 655 8.48% 6-person 305 3.95% 7-or-more-person 235 3.04% 2022 Est. Average Household Size 2.90 2022 Est. Households by Presence of People Under 18 7,723 Households with 1 or more People under Age 18 3,321 43.00% Households with No People under Age 18 4,402 57.00% Households with 1 or more People under Age 18 3,321 Married-Couple Family 2,190 65.95% Other Family, Male Householder 296 8.93% Other Family, Female Householder 774 23.31% Nonfamily, Male Householder 43 1.31% Nonfamily, Female Householder 17 0.51% Households with No People under Age 18 4,402 Married-Couple Family 1,922 43.66% Other Family, Male Householder 182 4.13% Other Family, Female Householder 275 6.24% Nonfamily, Male Householder 1,007 22.87% Nonfamily, Female Householder 1,017 23.09%
2700 SW 192nd Ave, Beaverton, OR 97006 Sitewise Online
2700
Ave,
0 - 1 mi
Pop-Facts: Demographic Snapshot (Part 2)
SW 192nd
Beaverton, OR 97006
2022 Est. Households by Number of Vehicles 7,723 No Vehicles 361 4.68% 1 Vehicle 2,526 32.70% 2 Vehicles 3,001 38.85% 3 Vehicles 1,168 15.12% 4 Vehicles 542 7.01% 5 or more Vehicles 126 1.64% 2022 Est. Average Number of Vehicles 1.93 Family Households 2027 Projection 5,919 2022 Estimate 5,639 2010 Census 4,883 2000 Census 4,294 Growth 2022-2027 4.96% Growth 2010-2022 15.48% Growth 2000-2010 13.72% 2022 Est. Families by Poverty Status 5,639 2022 Families at or Above Poverty 5,192 92.07% 2022 Families at or Above Poverty with Children 2,535 44.96% 2022 Families Below Poverty 447 7.93% 2022 Families Below Poverty with Children 382 6.77% 2022 Est. Pop Age 16+ by Employment Status 17,675 In Armed Forces 0 0.00% Civilian - Employed 11,855 67.07% Civilian - Unemployed 516 2.92% Not in Labor Force 5,304 30.01% 2022 Est. Civ. Employed Pop 16+ by Class of Worker 11,783 For-Profit Private Workers 8,717 73.98% Non-Profit Private Workers 925 7.85% Local Government Workers 688 5.84% State Government Workers 339 2.88% Federal Government Workers 180 1.53% Self-Employed Workers 928 7.88% Unpaid Family Workers 5 0.05%
Pop-Facts: Demographic
Pop-Facts: Demographic Snapshot (Part 2) 2700 SW 192nd Ave, Beaverton, OR 97006 0 - 1 mi
2700 SW 192nd Ave, Beaverton, OR 97006 Sitewise Online
Snapshot (Part 2)
2700 SW 192nd Ave, Beaverton, OR 97006
(Part 2)
2022 Est. Civ. Employed Pop 16+ by Occupation 11,783 Architect/Engineer 575 4.88% Arts/Entertainment/Sports 430 3.65% Building Grounds Maintenance 451 3.82% Business/Financial Operations 747 6.34% Community/Social Services 221 1.87% Computer/Mathematical 594 5.04% Construction/Extraction 467 3.97% Education/Training/Library 521 4.42% Farming/Fishing/Forestry 100 0.85% Food Prep/Serving 763 6.48% Healthcare Practitioner/Technician 456 3.87% Healthcare Support 512 4.34% Maintenance Repair 360 3.05% Legal 102 0.87% Life/Physical/Social Science 96 0.81% Management 1,040 8.83% Office/Admin. Support 1,189 10.09% Production 897 7.62% Protective Service 113 0.96% Sales/Related 986 8.37% Personal Care/Service 297 2.52% Transportation/Moving 866 7.35% 2022 Est. Pop 16+ by Occupation Classification 11,783 Blue Collar 2,591 21.99% White Collar 6,957 59.04% Service & Farm 2,235 18.97% 2022 Est. Workers Age 16+ by Transp. To Work 11,504 Drove Alone 8,480 73.71% Car Pooled 1,105 9.61% Public Transportation 941 8.18% Walked 190 1.65% Bicycle 66 0.57% Other Means 103 0.89% Worked at Home 619 5.38% 2022 Est. Workers Age 16+ by Travel Time to Work* Less than 15 minutes 2,904 15 to 29 Minutes 4,023 30 to 44 Minutes 2,141 45 to 59 Minutes 936 60 or more Minutes 872
Pop-Facts: Demographic Snapshot (Part 2) 2700 SW 192nd Ave, Beaverton, OR 97006 0 - 1 mi
Sitewise Online Pop-Facts: Demographic Snapshot
2022 Est. Avg. Travel Time to Work in Minutes* 28.64 2022 Est. Occupied Housing Units by Tenure 7,723 Owner-Occupied 4,824 62.46% Renter-Occupied 2,899 37.54% 2022 Occupied Housing Units: Avg. Length of Residence Owner-Occupied 11 Renter-Occupied 5 2700 SW 192nd Ave, Beaverton, OR 97006 Sitewise Online Pop-Facts: Demographic Snapshot (Part 2) Pop-Facts: Demographic Snapshot (Part 2) 2700 SW 192nd Ave, Beaverton, OR 97006 0 - 1 mi
2022 Est. Owner Occupied Housing Units by Value 4,824 Value Less than $20,000 16 0.33% Value $20,000 to $39,999 16 0.33% Value $40,000 to $59,999 36 0.75% Value $60,000 to $79,999 6 0.12% Value $80,000 to $99,999 24 0.50% Value $100,000 to $149,999 20 0.42% Value $150,000 to $199,999 37 0.78% Value $200,000 to $299,999 387 8.03% Value $300,000 to $399,999 1,536 31.83% Value $400,000 to $499,999 1,640 33.99% Value $500,000 to $749,999 891 18.48% Value $750,000 to $999,999 181 3.76% Value $1,000,000 to $1,499,999 31 0.63% Value $1,500,000 to $1,999,999 0 0.01% Value $2,000,000 or more 2 0.05% 2022 Est. Median All Owner-Occupied Housing Unit Value $420,367 2022 Est. Housing Units by Units in Structure 8,065 1 Unit Attached 801 9.93% 1 Unit Detached 5,562 68.97% 2 Units 57 0.71% 3 or 4 Units 293 3.63% 5 to 19 Units 884 10.96% 20 to 49 Units 135 1.68% 50 or More Units 218 2.70% Mobile Home or Trailer 114 1.41% Boat, RV, Van, etc. 0 0.00% Dominant structure type 1 Unit Detached 2022 Est. Housing Units by Year Structure Built 8,065 Housing Units Built 2014 or Later 1,155 14.32% Housing Units Built 2010 to 2013 208 2.58% Housing Units Built 2000 to 2009 1,252 15.52% Housing Units Built 1990 to 1999 1,103 13.68% Housing Units Built 1980 to 1989 1,057 13.11% Housing Units Built 1970 to 1979 2,251 27.92% Housing Units Built 1960 to 1969 466 5.78% Housing Units Built 1950 to 1959 320 3.97% Housing Units Built 1940 to 1949 146 1.81% Housing Units Built 1939 or Earlier 106 1.32% 2022 Est. Median Year Structure Built** 1987 Dominant Year Structure Built 1970 to 1979 2700 SW 192nd Ave,
Sitewise Online Pop-Facts: Demographic Snapshot (Part 2) Pop-Facts: Demographic Snapshot (Part 2) 2700 SW 192nd Ave, Beaverton, OR 97006 0 - 1 mi
Beaverton, OR 97006
2700 SW 192nd Ave, Beaverton, OR 97006 Sitewise Online
Pop-Facts: Demographic Snapshot (Part 2)
Pop-Facts: Demographic Snapshot (Part 2)
Copyright © Claritas, LLC 2022. All rights reserved.
* This row intentionally left blank. No Total Category.
**1939 will appear when at least half of the Housing Units in this reports area were built in 1939 or earlier.
2700 SW 192nd Ave, Beaverton, OR 97006 0 - 1 mi
Pop-Facts: Census Demographic Overview (Part 1) 2700 SW 192nd Ave, Beaverton, OR 97006 0 - 1 mi Population 2027 Projection 23,697 2022 Estimate 22,609 2010 Census 19,666 2000 Census 16,672 Growth 2022-2027 4.81% Growth 2010-2022 14.96% Growth 2000-2010 17.96% 2010 Population by Single-Classification Race 19,666 White Alone 13,433 68.30% Black or African American Alone 549 2.79% American Indian and Alaska Native Alone 219 1.11% Asian Alone 1,838 9.35% Native Hawaiian and Other Pacific Islander Alone 95 0.48% Some Other Race Alone 2,443 12.42% Two or More Races 1,090 5.54% 2010 Population By Ethnicity 19,666 Not Hispanic or Latino 15,056 76.56% Hispanic or Latino 4,610 23.44% 2010 Hispanic or Latino by Single-Classification Race 4,610 White Alone 1,685 36.55% Black or African American Alone 53 1.15% American Indian and Alaska Native Alone 85 1.84% Asian Alone 28 0.62% Native Hawaiian and Other Pacific Islander Alone 6 0.13% Some Other Race Alone 2,408 52.24% Two or More Races 345 7.48% 2010 Population by Sex 19,666 Male 9,821 49.94% Female 9,845 50.06% Male/Female Ratio 1.00
2700 SW 192nd Ave, Beaverton, OR 97006 Sitewise Online Pop-Facts: Census Demographic Overview (Part 1)
Sitewise Online
Pop-Facts: Census Demographic Overview (Part 1)
2010 Population by Age 19,666 Age 0 to 4 1,632 8.30% Age 5 to 9 1,584 8.05% Age 10 to 14 1,540 7.83% Age 15 to 17 868 4.41% Age 18 to 20 684 3.48% Age 21 to 24 976 4.96% Age 25 to 34 3,594 18.28% Age 35 to 44 2,979 15.15% Age 45 to 54 2,538 12.90% Age 55 to 64 1,938 9.86% Age 65 to 74 837 4.26% Age 75 to 84 375 1.91% Age 85 and over 122 0.62% Age 16 and over 14,595 74.22% Age 18 and over 14,043 71.41% Age 21 and over 13,359 67.93% Age 65 and over 1,334 6.78% 2010 Median Age 32.09
2700 SW 192nd Ave, Beaverton, OR 97006
Pop-Facts: Census Demographic
1) 2700 SW 192nd Ave, Beaverton, OR 97006 0 - 1 mi
Overview (Part
©
LLC 2022. All rights reserved.
2010 Male Population by Age 9,821 Age 0 to 4 886 9.02% Age 5 to 9 798 8.12% Age 10 to 14 770 7.84% Age 15 to 17 444 4.52% Age 18 to 20 368 3.75% Age 21 to 24 504 5.14% Age 25 to 34 1,768 18.00% Age 35 to 44 1,525 15.53% Age 45 to 54 1,267 12.90% Age 55 to 64 901 9.18% Age 65 to 74 387 3.94% Age 75 to 84 172 1.75% Age 85 and over 30 0.31% 2010 Median Age, Male 31.45 2010 Female Population by Age 9,845 Age 0 to 4 746 7.58% Age 5 to 9 786 7.99% Age 10 to 14 770 7.82% Age 15 to 17 424 4.31% Age 18 to 20 315 3.20% Age 21 to 24 472 4.79% Age 25 to 34 1,826 18.55% Age 35 to 44 1,454 14.77% Age 45 to 54 1,271 12.91% Age 55 to 64 1,037 10.53% Age 65 to 74 450 4.57% Age 75 to 84 203 2.07% Age 85 and over 91 0.93% 2010 Median Age, Female 32.72
Census Demographic
1) Pop-Facts: Census Demographic Overview (Part 1) 2700 SW 192nd Ave, Beaverton, OR 97006 0 - 1 mi
Copyright
Claritas,
2700 SW 192nd Ave, Beaverton, OR 97006 Sitewise Online Pop-Facts:
Overview (Part
Pop-Facts: Census Demographic Overview (Part 2)
2700 SW 192nd Ave, Beaverton, OR 97006 Sitewise Online
Pop-Facts: Census Demographic Overview (Part 2) 2700 SW 192nd Ave, Beaverton, OR 97006 0 - 1 mi Households 2027 Projection 8,109 2022 Estimate 7,723 2010 Census 6,676 2000 Census 5,746 Growth 2022-2027 5.00% Growth 2010-2022 15.69% Growth 2000-2010 16.18% 2010 Households by Household Type 6,676 Family Households 4,883 73.15% Non-family Households 1,792 26.85% 2010 Group Quarters Population 170 2010 Hispanic or Latino Households 1,025 15.36% 2010 Households by Household Size 6,676 1-person 1,219 18.25% 2-person 2,060 30.86% 3-person 1,296 19.42% 4-person 1,056 15.81% 5-person 576 8.62% 6-person 257 3.84% 7-or-more-person 213 3.19%
2010 Households by Type and Presence of Children 6,676 Married-Couple Family, own children 1,804 27.02% Male Householder, own children 221 3.31% Female Householder, own children 595 8.91% Married-Couple Family, no own children 1,770 26.52% Male Householder, no own children 193 2.89% Female Householder, no own children 301 4.51% Non-family Households 1,792 26.85% 2010 Households by Presence of People Under Age 18 6,676 HH with 1 or More People Under Age 18: 2,872 43.03% Households with No People Under Age 18: 3,803 56.97% HH with 1 or More People Under Age 18: 2,872 Married-Couple Family 1,901 66.19% Other Family, Male Householder 256 8.91% Other Family, Female Householder 663 23.09% Nonfamily, Male Householder 37 1.30% Nonfamily, Female Householder 15 0.52% Households with No People Under Age 18: 3,803 Married-Couple Family 1,673 43.98% Other Family, Male Householder 158 4.16% Other Family, Female Householder 232 6.10% Nonfamily, Male Householder 864 22.72% Nonfamily, Female Householder 876 23.04% 2010 Occupied Housing Units by Tenure 6,676 Owner-Occupied 4,193 62.81% Renter-Occupied 2,483 37.19%
Copyright © Claritas, LLC 2022. All rights reserved. Sitewise Online Pop-Facts: Census Demographic Overview (Part 2) Pop-Facts: Census Demographic Overview (Part 2) 2700 SW 192nd Ave, Beaverton, OR 97006 0 - 1 mi
2700
SW 192nd Ave, Beaverton, OR 97006
2700 SW 192nd Ave,
Sitewise Online Retail Market Power Opportunity Gap Report By Retail Store Types Retail Market Power Opportunity Gap Report By Retail Store Types 2700 SW 192nd Ave, Beaverton, OR 97006 0 - 1 mi 2022 Demand 2022 Supply Opportunity Gap/Surplus Total retail trade including food and drink (NAICS 44, 45 and 722) $436,070,607 $376,920,335 $59,150,271 Total retail trade (NAICS 44 and 45) $387,654,310 $345,106,244 $42,548,068 Motor vehicle and parts dealers (NAICS 441) $89,061,102 $90,612,300 -$1,551,198 Automobile dealers (NAICS 4411) $75,453,626 $61,116,893 $14,336,731 New car dealers (NAICS 44111) $67,041,562 $52,287,782 $14,753,779 Used car dealers (NAICS 44112) $8,412,064 $8,829,111 -$417,047 Other motor vehicle dealers (NAICS 4412) $7,650,191 $10,593,069 -$2,942,878 Recreational vehicle dealers (NAICS 44121) $2,952,328 $10,593,069 -$7,640,742 Motorcycle, boat, and other motor vehicle dealers (NAICS 44122) $4,697,864 $ 0 $4,697,864 Boat dealers (NAICS 441222) $1,764,910 $ 0 $1,764,910 Motorcycle, ATV, and all other motor vehicle dealers (NAICS 441228) $2,932,954 $ 0 $2,932,954 Automotive parts, accessories, and tire stores (NAICS 4413) $5,957,286 $18,902,337 -$12,945,050 Automotive parts and accessories stores (NAICS 44131) $3,766,269 $10,741,237 -$6,974,968 Tire dealers (NAICS 44132) $2,191,018 $8,161,100 -$5,970,082 Furniture and home furnishings stores (NAICS 442) $7,883,699 $3,251,713 $4,631,986 Furniture stores (NAICS 4421) $4,284,925 $1,533,039 $2,751,886 Home furnishings stores (NAICS 4422) $3,598,773 $1,718,674 $1,880,100 Floor covering stores (NAICS 44221) $1,726,652 $477,588 $1,249,064 Other home furnishings stores (NAICS 44229) $1,872,121 $1,241,086 $631,035 Window treatment stores (NAICS 442291) $ 94,583 $ 0 $ 94,583 All other home furnishings stores (NAICS 442299) $1,777,538 $1,241,086 $536,453 Electronics and appliance stores (NAICS 443) $5,110,883 $8,238,489 -$3,127,606 Household appliance stores (NAICS 443141) $1,226,517 $ 33,556 $1,192,961 Electronics stores (NAICS 443142) $3,884,366 $8,204,932 -$4,320,566 Building material and garden equipment and supplies dealers (NAICS 444) $27,090,545 $14,300,145 $12,790,400 Building material and supplies dealers (NAICS 4441) $23,285,945 $12,876,197 $10,409,748 Home centers (NAICS 44411) $12,934,967 $3,182,668 $9,752,299 Paint and wallpaper stores (NAICS 44412) $792,669 $ 40,532 $752,136 Hardware stores (NAICS 44413) $2,078,644 $3,167,521 -$1,088,877 Other building material dealers (NAICS 44419) $7,479,665 $6,485,476 $994,189 Lawn and garden equipment and supplies stores (NAICS 4442) $3,804,599 $1,423,948 $2,380,651 Outdoor power equipment stores (NAICS 44421) $771,933 $ 0 $771,933 Nursery, garden center, and farm supply stores (NAICS 44422) $3,032,667 $1,423,948 $1,608,719 Food and beverage stores (NAICS 445) $58,133,358 $53,474,125 $4,659,234 Grocery stores (NAICS 4451) $51,794,749 $53,474,125 -$1,679,376 Supermarkets and other grocery (except convenience) stores (NAICS 44511) $49,687,329 $51,473,850 -$1,786,521 Convenience stores (NAICS 44512) $2,107,419 $2,000,274 $107,144 Specialty food stores (NAICS 4452) $1,520,414 $ 0 $1,520,414
Beaverton, OR 97006
Meat markets (NAICS 44521) $459,920 $ 0 $459,920 Fish and seafood markets (NAICS 44522) $181,067 $ 0 $181,067 Fruit and vegetable markets (NAICS 44523) $314,762 $ 0 $314,762 Other specialty food stores (NAICS 44529) $564,664 $ 0 $564,664 Baked goods and confectionery and nut stores (NAICS 445291 + 445292) $299,758 $ 0 $299,758 All other specialty food stores (NAICS 445299) $264,906 $ 0 $264,906 Beer, wine, and liquor stores (NAICS 4453) $4,818,196 $ 0 $4,818,196 Health and personal care stores (NAICS 446) $21,902,340 $7,068,232 $14,834,108 Pharmacies and drug stores (NAICS 44611) $19,047,287 $7,068,232 $11,979,055 Cosmetics, beauty supplies, and perfume stores (NAICS 44612) $1,268,930 $ 0 $1,268,930 Optical goods stores (NAICS 44613) $572,623 $ 0 $572,623 Other health and personal care stores (NAICS 44619) $1,013,500 $ 0 $1,013,500 Food (health) supplement stores (NAICS 446191) $362,132 $ 0 $362,132 All other health and personal care stores (NAICS 446199) $651,368 $ 0 $651,368 Gasoline stations (NAICS 447) $31,550,886 $1,705,131 $29,845,754 Clothing and clothing accessories stores (NAICS 448) $15,518,343 $3,529,876 $11,988,466 Clothing stores (NAICS 4481) $10,146,234 $3,529,876 $6,616,358 Men's clothing stores (NAICS 44811) $462,771 $148,497 $314,274 Women's clothing stores (NAICS 44812) $1,761,702 $302,692 $1,459,010 Children's and infants' clothing stores (NAICS 44813) $396,215 $245,214 $151,001 Family clothing stores (NAICS 44814) $6,113,321 $1,952,058 $4,161,263 Clothing accessories stores (NAICS 44815) $491,708 $283,973 $207,735 Other clothing stores (NAICS 44819) $920,518 $597,442 $323,076 Shoe stores (NAICS 4482) $2,284,613 $ 0 $2,284,613 Jewelry, luggage, and leather goods stores (NAICS 4483) $3,087,495 $ 0 $3,087,495 Jewelry stores (NAICS 44831) $1,977,484 $ 0 $1,977,484 Luggage and leather goods stores (NAICS 44832) $1,110,011 $ 0 $1,110,011 Sporting goods, hobby, musical instrument, and book stores (NAICS 451) $6,214,194 $3,112,201 $3,101,993 Sporting goods, hobby, and musical instrument stores (NAICS 4511) $5,606,932 $3,112,201 $2,494,731 Sporting goods stores (NAICS 45111) $4,087,979 $2,633,005 $1,454,974 Hobby, toy, and game stores (NAICS 45112) $1,124,152 $479,196 $644,956 Sewing, needlework, and piece goods stores (NAICS 45113) $175,171 $ 0 $175,171 Musical instrument and supplies stores (NAICS 45114) $219,629 $ 0 $219,629 Book stores and news dealers (NAICS 4512) $607,262 $ 0 $607,262 Book stores (NAICS 451211) $564,746 $ 0 $564,746 News dealers and newsstands (NAICS 451212) $ 42,516 $ 0 $ 42,516 General merchandise stores (NAICS 452) $49,842,959 $14,209,992 $35,632,967 Department stores (NAICS 4522) $6,209,414 $ 0 $6,209,414 Other general merchandise stores (NAICS 4523) $43,633,545 $14,209,992 $29,423,553 Warehouse clubs and supercenters (NAICS 452311) $39,453,546 $14,032,007 $25,421,539 All other general merchandise stores (NAICS 452319) $4,179,999 $177,986 $4,002,013 2700 SW 192nd Ave, Beaverton, OR 97006 Sitewise Online Retail Market Power Opportunity Gap Report By Retail Store Types Retail Market Power Opportunity Gap Report By Retail Store Types 2700 SW 192nd Ave, Beaverton, OR 97006 0 - 1 mi 2022 Demand 2022 Supply Opportunity Gap/Surplus
SW 192nd Ave, Beaverton, OR 97006
* GAFO (General merchandise, Apparel, Furniture and Other) represents sales at stores that sell merchandise normally sold in department stores. This category is not included in Total Retail Sales Including Eating and Drinking Places.
Miscellaneous store retailers (NAICS 453) $8,461,097 $7,155,538 $1,305,559 Florists (NAICS 4531) $381,730 $ 0 $381,730 Office supplies, stationery, and gift stores (NAICS 4532) $1,889,065 $1,289,110 $599,956 Office supplies and stationery stores (NAICS 45321) $780,872 $ 0 $780,872 Gift, novelty, and souvenir stores (NAICS 45322) $1,108,194 $1,289,110 -$180,916 Used merchandise stores (NAICS 4533) $1,233,233 $646,145 $587,088 Other miscellaneous store retailers (NAICS 4539) $4,957,067 $5,220,282 -$263,215 Pet and pet supplies stores (NAICS 45391) $1,478,105 $1,771,994 -$293,889 Art dealers (NAICS 45392) $794,455 $ 3,999 $790,457 Manufactured (mobile) home dealers (NAICS 45393) $506,766 $ 3,637 $503,129 All other miscellaneous store retailers (NAICS 45399) $2,177,741 $3,440,653 -$1,262,912 Tobacco stores (NAICS 453991) $621,603 $1,230,812 -$609,209 All other miscellaneous store retailers (except tobacco stores) (NAICS 453998) $1,556,138 $2,209,841 -$653,703 Non-store retailers (NAICS 454) $66,884,905 $138,448,503 -$71,563,599 Electronic shopping and mail-order houses (NAICS 4541) $63,338,997 $138,448,503 -$75,109,507 Vending machine operators (NAICS 4542) $486,872 $ 0 $486,872 Direct selling establishments (NAICS 4543) $3,059,035 $ 0 $3,059,035 Fuel dealers (NAICS 45431) $1,489,033 $ 0 $1,489,033 Other direct selling establishments (NAICS 45439) $1,570,002 $ 0 $1,570,002 Food services and drinking places (NAICS 722) $48,416,296 $31,814,091 $16,602,206 Special food services (NAICS 7223) $3,873,777 $2,274,999 $1,598,778 Food service contractors (NAICS 72231) $3,062,688 $1,629,944 $1,432,744 Caterers (NAICS 72232) $739,010 $474,588 $264,422 Mobile food services (NAICS 72233) $ 72,079 $170,467 -$98,388 Drinking places (alcoholic beverages) (NAICS 7224) $1,534,752 $1,492,955 $ 41,796 Restaurants and other eating places (NAICS 7225) $43,007,768 $28,046,135 $14,961,632 Full-service restaurants (NAICS 722511) $21,466,660 $14,172,540 $7,294,120 Limited-service restaurants (NAICS 722513) $18,278,559 $12,116,899 $6,161,660 Cafeterias, grill buffets, and buffets (NAICS 722514) $465,933 $268,987 $196,946 Snack and nonalcoholic beverage bars (NAICS 722515) $2,796,616 $1,487,710 $1,308,906 GAFO* $84,571,966 $32,343,560 $52,228,406 General Merchandise Stores-452 $49,842,959 $14,209,992 $35,632,967 Clothing & Clothing Accessories Stores-448 $15,518,343 $3,529,876 $11,988,466 Furniture & Home Furnishings Stores-442 $7,883,699 $3,251,713 $4,631,986 Electronics & Appliance Stores-443 $5,110,883 $8,238,489 -$3,127,606 Sporting Goods, Hobby, Book, Music Stores-451 $6,214,194 $3,112,201 $3,101,993 Office Supplies, Stationery, Gift Stores-4532 $1,889,065 $1,289,110 $599,956
2700
Sitewise Online Retail Market Power Opportunity Gap Report By Retail Store Types Retail Market Power Opportunity Gap Report By Retail Store Types 2700 SW 192nd Ave, Beaverton, OR 97006 0 - 1 mi 2022 Demand 2022 Supply Opportunity Gap/Surplus
2700 SW 192nd Ave, Beaverton, OR 97006 Sitewise Online
Retail Market Power Opportunity Gap Report By Retail Store Types
Retail Market Power Opportunity Gap Report
By Retail Store Types
Retail Market Power data is derived from two major sources of information. The demand data is derived from the Consumer Expenditure Survey (CE Survey or CEX), which is fielded by the U.S. Bureau of Labor Statistics (BLS). The supply data is derived from the Census of Retail Trade (CRT), which is made available by the U.S. Census. Additional data sources are incorporated to create both supply and demand estimates. The difference between demand and supply represents the opportunity gap or surplus available for each merchandise line in the specified reporting geography. When this difference is positive (demand is greater than the supply), there is an opportunity gap for that merchandise line; when the difference is negative (supply is greater than demand), there is a surplus.
Copyright © 2022 Environics Analytics. All rights reserved.
2700 SW 192nd Ave, Beaverton, OR 97006 0 - 1 mi 2022 Demand 2022 Supply Opportunity Gap/Surplus


 Powered by Sitewise
Data Source: Kalibrate TrafficMetrix
Powered by Sitewise
Data Source: Kalibrate TrafficMetrix