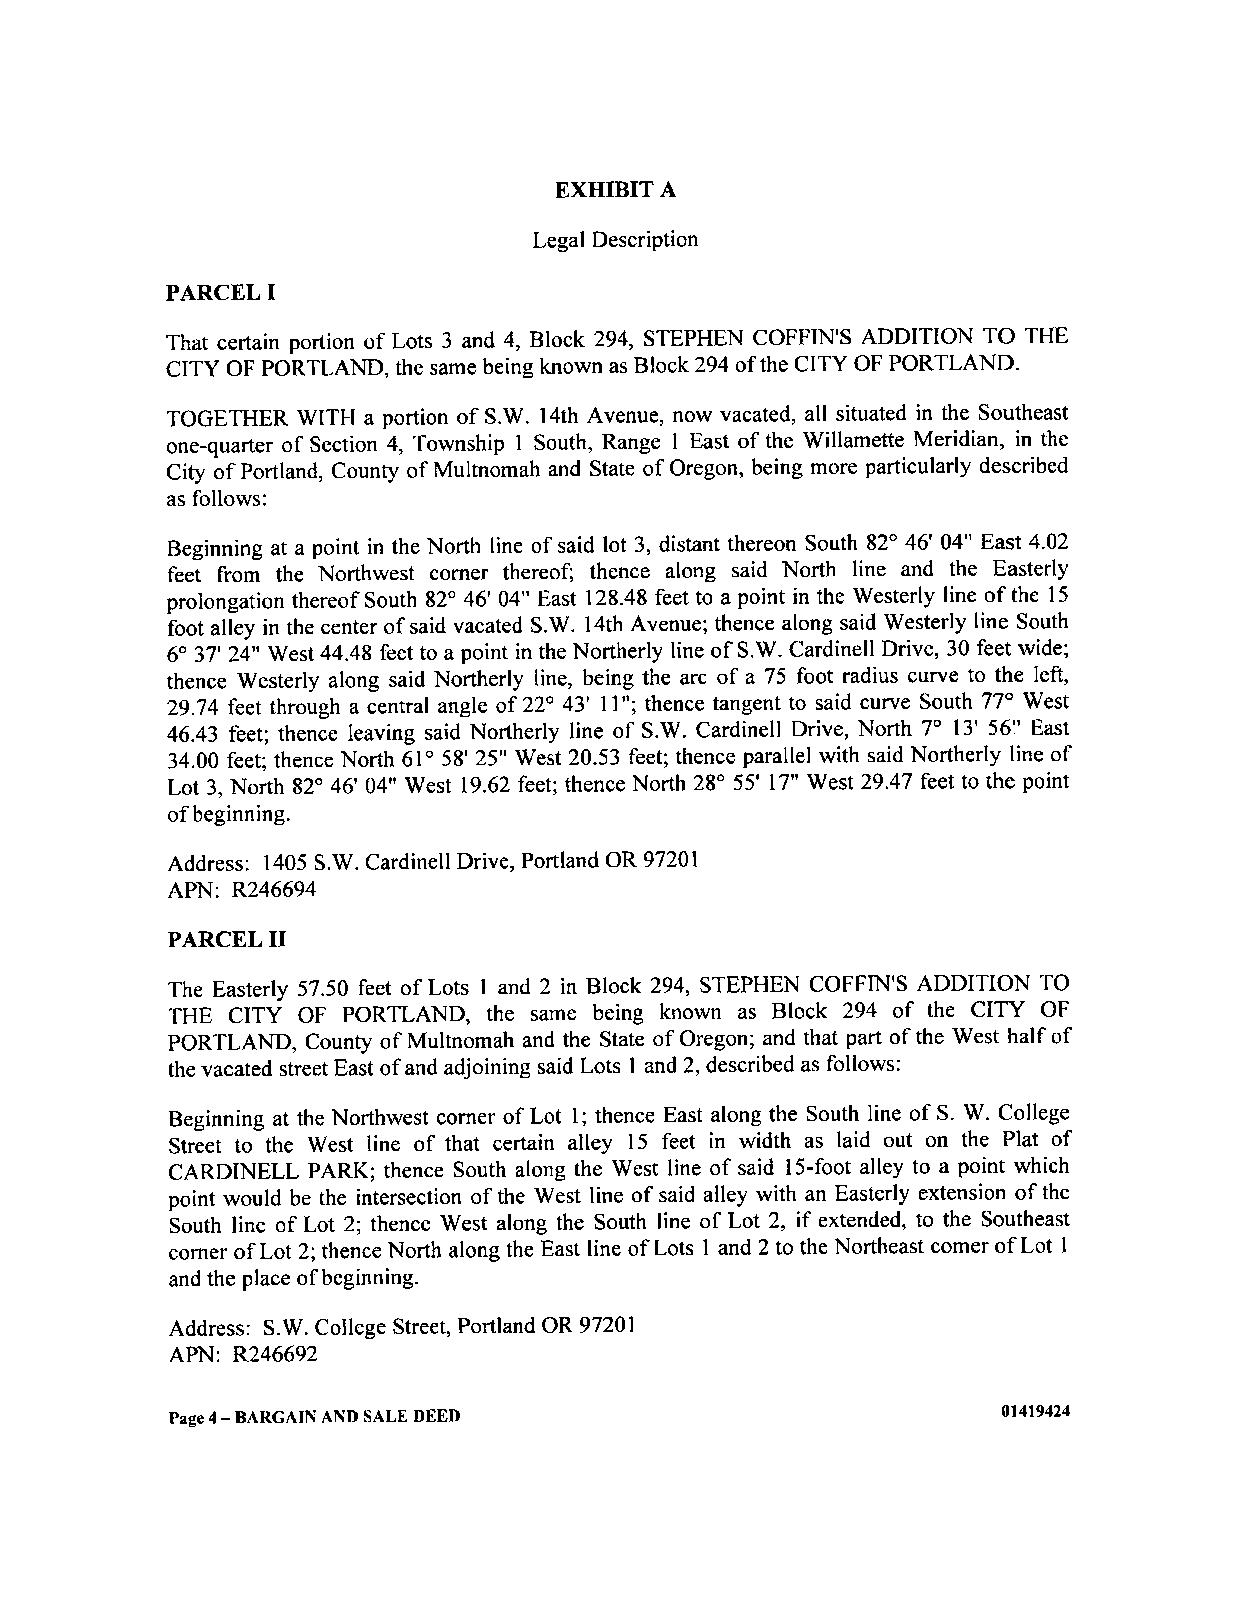
COMMUNITY

Demographics
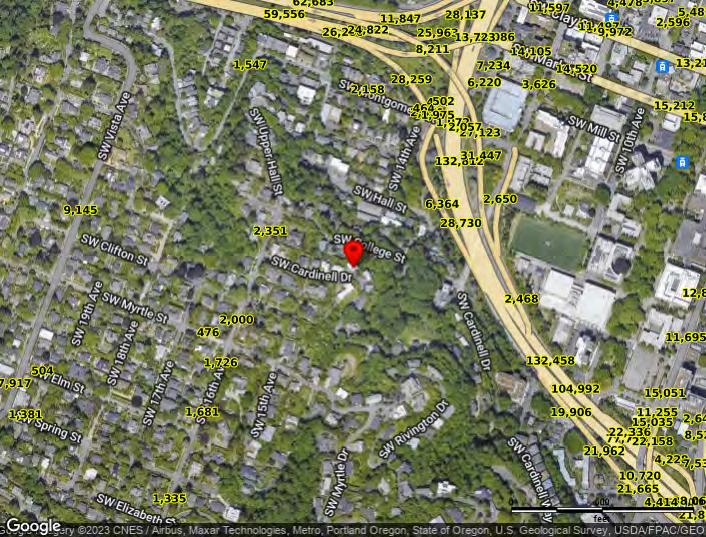
Traffic Counts
The information contained is provided by WFG’s Customer Service Department to our customers, and while deemed reliable, is not guaranteed.
INFORMATION

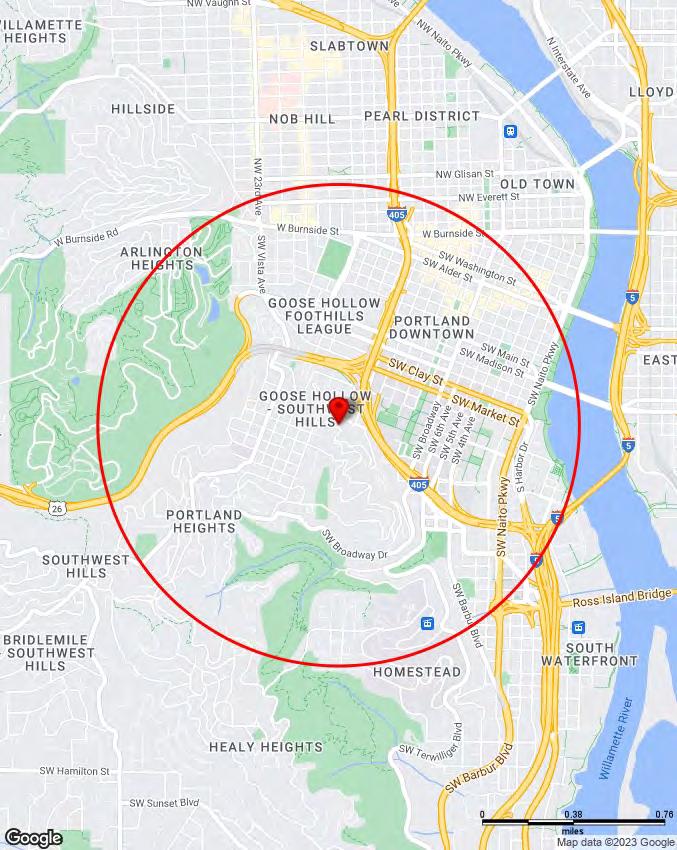
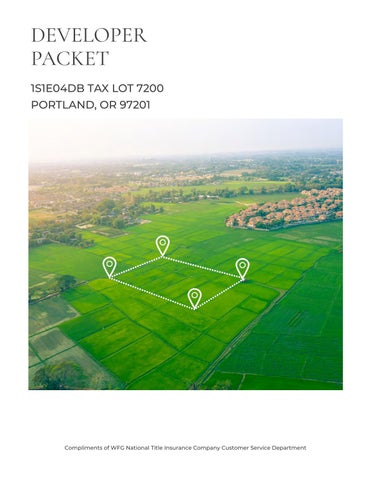
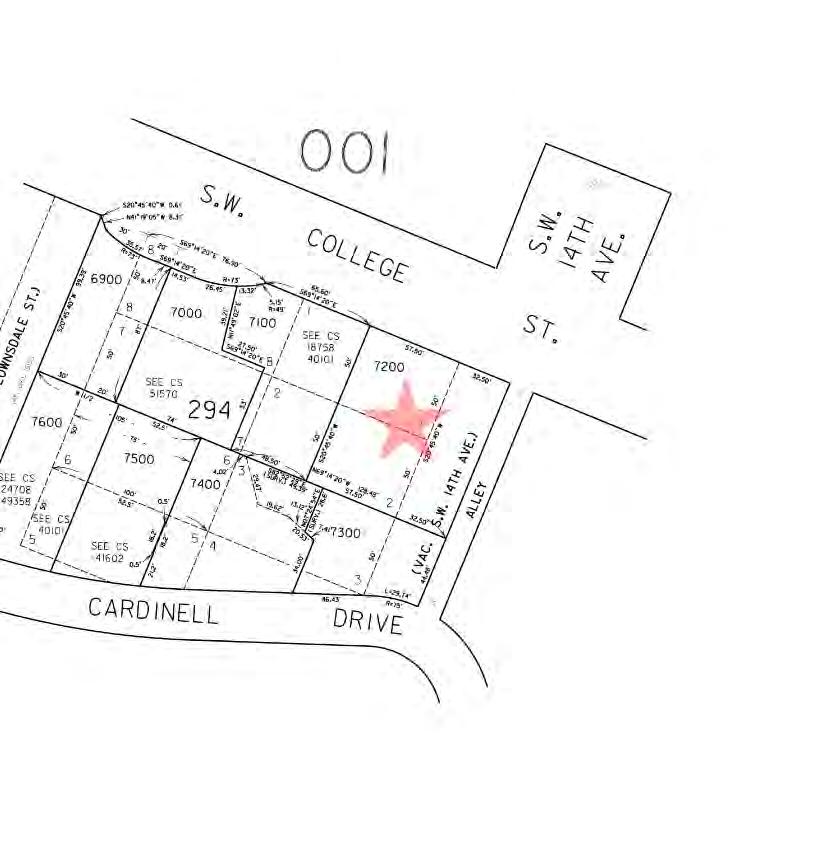
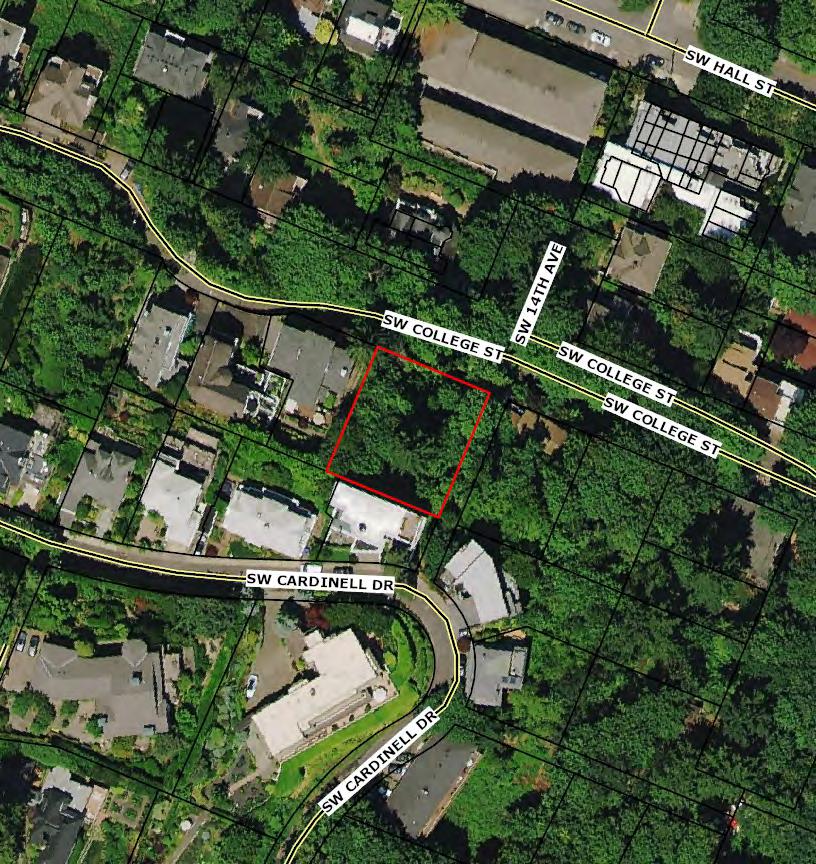
1S1E04DB07200
Pop-Facts: Population Quick Facts 1S1E04DB07200 0 - 1 mi Population 2027 Projection 32,178 2022 Estimate 30,866 2010 Census 27,314 2000 Census 22,662 Growth 2022-2027 4.25% Growth 2010-2022 13.00% Growth 2000-2010 20.53% 2022 Est. Population by Age 30,866 Age 0 to 4 513 1.66% Age 5 to 9 527 1.71% Age 10 to 14 526 1.70% Age 15 to 17 634 2.05% Age 18 to 20 1,559 5.05% Age 21 to 24 2,216 7.18% Age 25 to 34 7,120 23.07% Age 35 to 44 5,803 18.80% Age 45 to 54 3,945 12.78% Age 55 to 64 2,988 9.68% Age 65 to 74 2,870 9.30% Age 75 to 84 1,582 5.12% Age 85 and over 585 1.90% Age 16 and over 29,093 94.26% Age 18 and over 28,667 92.88% Age 21 and over 27,108 87.82% Age 65 and over 5,036 16.32% 2022 Est. Median Age 39.03 2022 Est. Average Age 42.17
1S1E04DB07200 Sitewise Online Pop-Facts: Population Quick Facts
2022 Est. Population by Single-Classification Race 30,866 White Alone 24,807 80.37% Black or African American Alone 747 2.42% American Indian and Alaska Native Alone 273 0.88% Asian Alone 2,906 9.42% Native Hawaiian and Other Pacific Islander Alone 72 0.23% Some Other Race Alone 417 1.35% Two or More Races 1,645 5.33% 2022 Est. Population by Ethnicity (Hispanic or Latino) 30,866 Hispanic or Latino 1,763 5.71% Not Hispanic or Latino 29,103 94.29% 2022 Est. Population by Sex 30,866 Male 16,675 54.03% Female 14,190 45.97%
1S1E04DB07200 Sitewise Online Pop-Facts: Population Quick Facts Pop-Facts: Population Quick Facts 1S1E04DB07200 0 - 1 mi
Copyright © Claritas, LLC 2022. All rights reserved.
1S1E04DB07200 Sitewise Online Pop-Facts: Household Quick Facts Pop-Facts: Household Quick Facts 1S1E04DB07200 0 - 1 mi Households 2027 Projection 18,808 2022 Estimate 18,026 2010 Census 15,953 2000 Census 14,269 Growth 2022-2027 4.34% Growth 2010-2022 12.99% Growth 2000-2010 11.80% 2022 Est. Households by Household Income 18,026 Income Less than $15,000 3,790 21.03% Income $15,000 to $24,999 1,373 7.62% Income $25,000 to $34,999 1,216 6.75% Income $35,000 to $49,999 1,703 9.45% Income $50,000 to $74,999 2,138 11.86% Income $75,000 to $99,999 1,664 9.23% Income $100,000 to $124,999 1,360 7.54% Income $125,000 to $149,999 999 5.54% Income $150,000 to $199,999 1,261 7.00% Income $200,000 to $249,999 710 3.94% Income $250,000 to $499,999 1,001 5.55% Income $500,000 or more 809 4.49% 2022 Est. Average Household Income $106,103 2022 Est. Median Household Income $60,872 2022 Median HH Inc. by Single-Classification Race White Alone $66,245 Black or African American Alone $14,084 American Indian and Alaska Native Alone $28,486 Asian Alone $42,468 Native Hawaiian and Other Pacific Islander Alone $65,999 Some Other Race Alone $14,010 Two or More Races $55,130 Hispanic or Latino $30,397 Not Hispanic or Latino $62,912 2022 Est. Households by Household Type 18,026 Family Households 3,883 21.54% Nonfamily Households 14,143 78.46% 2022 Est. Group Quarters Population 2,963
2022 Est. Households by Household Size 18,026 1-person 11,002 61.04% 2-person 5,273 29.25% 3-person 1,107 6.14% 4-person 466 2.58% 5-person 132 0.73% 6-person 36 0.20% 7-or-more-person 9 0.05% 2022 Est. Average Household Size 1.55 1S1E04DB07200 Sitewise Online Pop-Facts: Household Quick Facts Pop-Facts: Household Quick Facts 1S1E04DB07200 0 - 1 mi
2022 Est. HHs by Type by Presence of Own Children 3,883 Married-Couple Family, own children 769 19.80% Married-Couple Family, no own children 2,443 62.93% Male Householder, own children 88 2.26% Male Householder, no own children 181 4.67% Female Householder, own children 174 4.49% Female Householder, no own children 226 5.83% Copyright © Claritas, LLC 2022. All rights reserved. 1S1E04DB07200 Sitewise Online Pop-Facts: Household Quick Facts Pop-Facts: Household Quick Facts 1S1E04DB07200 0 - 1 mi
Pop-Facts: Demographic Snapshot
Pop-Facts: Demographic Snapshot (Part 1) 1S1E04DB07200 0 - 1 mi Population 2027 Projection 32,178 2022 Estimate 30,866 2010 Census 27,314 2000 Census 22,662 Growth 2022-2027 4.25% Growth 2010-2022 13.00% Growth 2000-2010 20.53% 2022 Est. Population by Single-Classification Race 30,866 White Alone 24,807 80.37% Black or African American Alone 747 2.42% American Indian and Alaska Native Alone 273 0.88% Asian Alone 2,906 9.42% Native Hawaiian and Other Pacific Islander Alone 72 0.23% Some Other Race Alone 417 1.35% Two or More Races 1,645 5.33% 2022 Est. Population Hispanic or Latino by Origin 30,866 Not Hispanic or Latino 29,103 94.29% Hispanic or Latino 1,763 5.71% Hispanic or Latino by Origin 1,763 Mexican 978 55.50% Puerto Rican 109 6.21% Cuban 87 4.91% All Other Hispanic or Latino 588 33.37% 2022 Est. Hisp. or Latino Pop by Single-Classification Race 1,763 White Alone 1,052 59.70% Black or African American Alone 55 3.11% American Indian and Alaska Native Alone 54 3.06% Asian Alone 25 1.40% Native Hawaiian and Other Pacific Islander Alone 7 0.38% Some Other Race Alone 334 18.97% Two or More Races 236 13.38%
1S1E04DB07200 Sitewise Online
(Part 1)
2022 Est. Pop by Race, Asian Alone, by Category 2,906 Chinese, except Taiwanese 1,133 39.00% Filipino 51 1.74% Japanese 190 6.54% Asian Indian 580 19.95% Korean 181 6.23% Vietnamese 269 9.24% Cambodian 18 0.63% Hmong 0 0.00% Laotian 5 0.17% Thai 249 8.57% All other Asian Races, including 2 or more 230 7.93% 2022 Est. Population by Ancestry 30,866 Arab 15 0.05% Czech 145 0.47% Danish 204 0.66% Dutch 352 1.14% English 2,459 7.97% French (except Basque) 810 2.62% French Canadian 127 0.41% German 3,433 11.12% Greek 186 0.60% Hungarian 149 0.48% Irish 2,804 9.09% Italian 1,149 3.72% Lithuanian 111 0.36% Norwegian 647 2.09% Polish 477 1.54% Portuguese 85 0.28% Russian 479 1.55% Scottish 779 2.52% Scotch-Irish 371 1.20% Slovak 40 0.13% Subsaharan African 121 0.39% Swedish 663 2.15% Swiss 140 0.45% Ukrainian 49 0.16% United States or American 685 2.22% Welsh 326 1.06% West Indian (except Hisp. groups) 24 0.08% Other Ancestries 10,681 34.60% Ancestry Unclassified 3,357 10.88% 2022 Est. Pop Age 5+ by Language Spoken At Home 30,353 Speak only English 25,130 82.79% Speak Asian or Pacific Island Language 2,025 6.67% 1S1E04DB07200 Sitewise Online Pop-Facts: Demographic Snapshot (Part 1) Pop-Facts: Demographic Snapshot (Part 1) 1S1E04DB07200 0 - 1 mi
Speak IndoEuropean Language 1,565 5.16% Speak Spanish 1,381 4.55% Speak Other Language 253 0.83% 1S1E04DB07200 Sitewise Online Pop-Facts: Demographic Snapshot (Part 1) Pop-Facts: Demographic Snapshot (Part 1) 1S1E04DB07200 0 - 1 mi
2022 Est. Population by Sex 30,866 Male 16,675 54.03% Female 14,190 45.97% 2022 Est. Population by Age 30,866 Age 0 to 4 513 1.66% Age 5 to 9 527 1.71% Age 10 to 14 526 1.70% Age 15 to 17 634 2.05% Age 18 to 20 1,559 5.05% Age 21 to 24 2,216 7.18% Age 25 to 34 7,120 23.07% Age 35 to 44 5,803 18.80% Age 45 to 54 3,945 12.78% Age 55 to 64 2,988 9.68% Age 65 to 74 2,870 9.30% Age 75 to 84 1,582 5.12% Age 85 and over 585 1.90% Age 16 and over 29,093 94.26% Age 18 and over 28,667 92.88% Age 21 and over 27,108 87.82% Age 65 and over 5,036 16.32% 2022 Est. Median Age 39.03 2022 Est. Average Age 42.17
Pop-Facts: Demographic Snapshot (Part 1) 1S1E04DB07200 0 - 1 mi
1S1E04DB07200 Sitewise Online Pop-Facts: Demographic Snapshot (Part 1)
2022 Est. Male Population by Age 16,675 Age 0 to 4 262 1.57% Age 5 to 9 265 1.59% Age 10 to 14 268 1.61% Age 15 to 17 286 1.71% Age 18 to 20 740 4.44% Age 21 to 24 1,096 6.57% Age 25 to 34 4,032 24.18% Age 35 to 44 3,067 18.39% Age 45 to 54 2,376 14.25% Age 55 to 64 1,803 10.81% Age 65 to 74 1,496 8.97% Age 75 to 84 759 4.55% Age 85 and over 225 1.35% 2022 Est. Median Age, Male 39.53 2022 Est. Average Age, Male 42.23 2022 Est. Female Population by Age 14,190 Age 0 to 4 251 1.77% Age 5 to 9 262 1.84% Age 10 to 14 258 1.82% Age 15 to 17 348 2.45% Age 18 to 20 819 5.77% Age 21 to 24 1,119 7.89% Age 25 to 34 3,089 21.76% Age 35 to 44 2,736 19.28% Age 45 to 54 1,568 11.05% Age 55 to 64 1,185 8.35% Age 65 to 74 1,374 9.68% Age 75 to 84 823 5.80% Age 85 and over 360 2.54% 2022 Est. Median Age, Female 38.47 2022 Est. Average Age, Female 42.08 1S1E04DB07200 Sitewise Online Pop-Facts: Demographic Snapshot (Part 1) Pop-Facts: Demographic Snapshot (Part 1) 1S1E04DB07200 0 - 1 mi
2022 Est. Pop Age 15+ by Marital Status 29,301 Total, Never Married 15,907 54.29% Males, Never Married 9,084 31.00% Females, Never Married 6,823 23.29% Married, Spouse present 7,558 25.80% Married, Spouse absent 1,203 4.11% Widowed 968 3.30% Males, Widowed 261 0.89% Females, Widowed 707 2.41% Divorced 3,664 12.50% Males, Divorced 2,003 6.84% Females, Divorced 1,661 5.67% 2022 Est. Pop Age 25+ by Edu. Attainment 24,892 Less than 9th grade 553 2.22% Some High School, no diploma 473 1.90% High School Graduate (or GED) 2,326 9.34% Some College, no degree 4,252 17.08% Associate Degree 1,467 5.89% Bachelor's Degree 8,408 33.78% Master's Degree 4,312 17.32% Professional School Degree 1,620 6.51% Doctorate Degree 1,482 5.95% 2022 Est. Pop. Age 25+ by Edu. Attain., Hisp./Lat. 1,288 No High School Diploma 131 10.13% High School Graduate 173 13.44% Some College or Associate's Degree 549 42.61% Bachelor's Degree or Higher 436 33.82% Copyright © Claritas, LLC 2022. All rights reserved. 1S1E04DB07200 Sitewise Online Pop-Facts: Demographic Snapshot (Part 1) Pop-Facts: Demographic Snapshot (Part 1) 1S1E04DB07200 0 - 1 mi
1S1E04DB07200 Sitewise Online Pop-Facts: Demographic Snapshot (Part 2) Pop-Facts: Demographic Snapshot (Part 2) 1S1E04DB07200 0 - 1 mi Households 2027 Projection 18,808 2022 Estimate 18,026 2010 Census 15,953 2000 Census 14,269 Growth 2022-2027 4.34% Growth 2010-2022 12.99% Growth 2000-2010 11.80% 2022 Est. Households by Household Type 18,026 Family Households 3,883 21.54% Nonfamily Households 14,143 78.46% 2022 Est. Group Quarters Population 2,963 2022 HHs by Ethnicity: Hispanic/Latino 895 4.96% 2022 Est. Households by HH Income 18,026 Income < $15,000 3,790 21.03% Income $15,000 to $24,999 1,373 7.62% Income $25,000 to $34,999 1,216 6.75% Income $35,000 to $49,999 1,703 9.45% Income $50,000 to $74,999 2,138 11.86% Income $75,000 to $99,999 1,664 9.23% Income $100,000 to $124,999 1,360 7.54% Income $125,000 to $149,999 999 5.54% Income $150,000 to $199,999 1,261 7.00% Income $200,000 to $249,999 710 3.94% Income $250,000 to $499,999 1,001 5.55% Income $500,000+ 809 4.49% 2022 Est. Average Household Income $106,103 2022 Est. Median Household Income $60,872 2022 Median HH Income by Single-Class. Race or Ethn. White Alone $66,245 Black or African American Alone $14,084 American Indian and Alaska Native Alone $28,486 Asian Alone $42,468 Native Hawaiian and Other Pacific Islander Alone $65,999 Some Other Race Alone $14,010 Two or More Races $55,130 Hispanic or Latino $30,397 Not Hispanic or Latino $62,912
1S1E04DB07200 Sitewise Online Pop-Facts: Demographic Snapshot (Part 2) Pop-Facts: Demographic Snapshot (Part 2) 1S1E04DB07200 0 - 1 mi
2022 Est. Family HH Type by Presence of Own Children 3,883 Married-Couple Family, own children 769 19.80% Married-Couple Family, no own children 2,443 62.93% Male Householder, own children 88 2.26% Male Householder, no own children 181 4.67% Female Householder, own children 174 4.49% Female Householder, no own children 226 5.83% 2022 Est. Households by Household Size 18,026 1-person 11,002 61.04% 2-person 5,273 29.25% 3-person 1,107 6.14% 4-person 466 2.58% 5-person 132 0.73% 6-person 36 0.20% 7-or-more-person 9 0.05% 2022 Est. Average Household Size 1.55 2022 Est. Households by Presence of People Under 18 18,026 Households with 1 or more People under Age 18 1,085 6.02% Households with No People under Age 18 16,941 93.98% Households with 1 or more People under Age 18 1,085 Married-Couple Family 775 71.44% Other Family, Male Householder 94 8.69% Other Family, Female Householder 189 17.44% Nonfamily, Male Householder 16 1.49% Nonfamily, Female Householder 10 0.93% Households with No People under Age 18 16,941 Married-Couple Family 2,436 14.38% Other Family, Male Householder 173 1.02% Other Family, Female Householder 214 1.26% Nonfamily, Male Householder 7,851 46.34% Nonfamily, Female Householder 6,267 36.99% 1S1E04DB07200 Sitewise Online Pop-Facts: Demographic Snapshot (Part 2) Pop-Facts: Demographic Snapshot (Part 2) 1S1E04DB07200 0 - 1 mi
2022 Est. Households by Number of Vehicles 18,026 No Vehicles 7,723 42.85% 1 Vehicle 6,989 38.77% 2 Vehicles 2,628 14.58% 3 Vehicles 509 2.83% 4 Vehicles 54 0.30% 5 or more Vehicles 122 0.68% 2022 Est. Average Number of Vehicles 0.81 Family Households 2027 Projection 4,046 2022 Estimate 3,883 2010 Census 3,452 2000 Census 2,917 Growth 2022-2027 4.22% Growth 2010-2022 12.47% Growth 2000-2010 18.36% 2022 Est. Families by Poverty Status 3,883 2022 Families at or Above Poverty 3,718 95.76% 2022 Families at or Above Poverty with Children 936 24.10% 2022 Families Below Poverty 165 4.24% 2022 Families Below Poverty with Children 63 1.63% 2022 Est. Pop Age 16+ by Employment Status 29,093 In Armed Forces 0 0.00% Civilian - Employed 17,251 59.29% Civilian - Unemployed 1,045 3.59% Not in Labor Force 10,798 37.12% 2022 Est. Civ. Employed Pop 16+ by Class of Worker 16,858 For-Profit Private Workers 10,976 65.11% Non-Profit Private Workers 1,842 10.93% Local Government Workers 756 4.49% State Government Workers 1,310 7.77% Federal Government Workers 293 1.74% Self-Employed Workers 1,667 9.89% Unpaid Family Workers 14 0.08% 1S1E04DB07200 Sitewise Online Pop-Facts: Demographic Snapshot (Part 2) Pop-Facts: Demographic Snapshot (Part 2) 1S1E04DB07200 0 - 1 mi
2022 Est. Civ. Employed Pop 16+ by Occupation 16,858 Architect/Engineer 638 3.79% Arts/Entertainment/Sports 791 4.69% Building Grounds Maintenance 211 1.25% Business/Financial Operations 1,492 8.85% Community/Social Services 346 2.05% Computer/Mathematical 1,234 7.32% Construction/Extraction 243 1.44% Education/Training/Library 1,255 7.44% Farming/Fishing/Forestry 38 0.23% Food Prep/Serving 1,134 6.73% Healthcare Practitioner/Technician 1,121 6.65% Healthcare Support 402 2.39% Maintenance Repair 168 1.00% Legal 290 1.72% Life/Physical/Social Science 558 3.31% Management 2,189 12.98% Office/Admin. Support 1,828 10.84% Production 294 1.74% Protective Service 149 0.88% Sales/Related 1,679 9.96% Personal Care/Service 315 1.87% Transportation/Moving 481 2.86% 2022 Est. Pop 16+ by Occupation Classification 16,858 Blue Collar 1,187 7.04% White Collar 13,421 79.61% Service & Farm 2,250 13.35% 2022 Est. Workers Age 16+ by Transp. To Work 16,614 Drove Alone 5,672 34.14% Car Pooled 514 3.09% Public Transportation 3,429 20.64% Walked 4,601 27.69% Bicycle 589 3.54% Other Means 251 1.51% Worked at Home 1,559 9.38% 2022 Est. Workers Age 16+ by Travel Time to Work* Less than 15 minutes 4,490 15 to 29 Minutes 6,495 30 to 44 Minutes 2,816 45 to 59 Minutes 845 60 or more Minutes 514 2022 Est. Avg. Travel Time to Work in Minutes* 24.20 1S1E04DB07200 Sitewise Online Pop-Facts: Demographic Snapshot (Part 2) Pop-Facts: Demographic Snapshot (Part 2) 1S1E04DB07200 0 - 1 mi
2022 Est. Occupied Housing Units by Tenure 18,026 Owner-Occupied 4,175 23.16% Renter-Occupied 13,851 76.84% 2022 Occupied Housing Units: Avg. Length of Residence Owner-Occupied 10 Renter-Occupied 5 1S1E04DB07200 Sitewise Online Pop-Facts: Demographic Snapshot (Part 2) Pop-Facts: Demographic Snapshot (Part 2) 1S1E04DB07200 0 - 1 mi
2022 Est. Owner Occupied Housing Units by Value 4,175 Value Less than $20,000 23 0.55% Value $20,000 to $39,999 0 0.01% Value $40,000 to $59,999 0 0.01% Value $60,000 to $79,999 1 0.03% Value $80,000 to $99,999 0 0.00% Value $100,000 to $149,999 14 0.34% Value $150,000 to $199,999 13 0.31% Value $200,000 to $299,999 93 2.23% Value $300,000 to $399,999 368 8.81% Value $400,000 to $499,999 544 13.04% Value $500,000 to $749,999 984 23.57% Value $750,000 to $999,999 814 19.49% Value $1,000,000 to $1,499,999 781 18.71% Value $1,500,000 to $1,999,999 319 7.64% Value $2,000,000 or more 219 5.25% 2022 Est. Median All Owner-Occupied Housing Unit Value $764,199 2022 Est. Housing Units by Units in Structure 20,051 1 Unit Attached 412 2.06% 1 Unit Detached 2,349 11.71% 2 Units 327 1.63% 3 or 4 Units 353 1.76% 5 to 19 Units 1,807 9.01% 20 to 49 Units 3,762 18.76% 50 or More Units 11,019 54.96% Mobile Home or Trailer 22 0.11% Boat, RV, Van, etc. 0 0.00% Dominant structure type 50 or More Units 2022 Est. Housing Units by Year Structure Built 20,051 Housing Units Built 2014 or Later 2,339 11.67% Housing Units Built 2010 to 2013 529 2.64% Housing Units Built 2000 to 2009 3,016 15.04% Housing Units Built 1990 to 1999 2,173 10.84% Housing Units Built 1980 to 1989 1,495 7.46% Housing Units Built 1970 to 1979 1,257 6.27% Housing Units Built 1960 to 1969 1,677 8.36% Housing Units Built 1950 to 1959 1,441 7.19% Housing Units Built 1940 to 1949 852 4.25% Housing Units Built 1939 or Earlier 5,272 26.29% 2022 Est. Median Year Structure Built** 1976 Dominant Year Structure Built 1939 or Earlier 1S1E04DB07200 Sitewise Online Pop-Facts: Demographic Snapshot (Part 2) Pop-Facts: Demographic Snapshot (Part 2) 1S1E04DB07200 0 - 1 mi
Copyright © Claritas, LLC 2022. All rights reserved.
* This row intentionally left blank. No Total Category.
**1939 will appear when at least half of the Housing Units in this reports area were built in 1939 or earlier.
1S1E04DB07200 Sitewise Online Pop-Facts: Demographic Snapshot (Part 2) Pop-Facts: Demographic Snapshot (Part 2) 1S1E04DB07200 0 - 1 mi
1S1E04DB07200 Sitewise Online Pop-Facts: Census Demographic Overview (Part 1) Pop-Facts: Census Demographic Overview (Part 1) 1S1E04DB07200 0 - 1 mi Population 2027 Projection 32,178 2022 Estimate 30,866 2010 Census 27,314 2000 Census 22,662 Growth 2022-2027 4.25% Growth 2010-2022 13.00% Growth 2000-2010 20.53% 2010 Population by Single-Classification Race 27,314 White Alone 22,442 82.16% Black or African American Alone 812 2.97% American Indian and Alaska Native Alone 254 0.93% Asian Alone 2,189 8.02% Native Hawaiian and Other Pacific Islander Alone 61 0.22% Some Other Race Alone 395 1.45% Two or More Races 1,161 4.25% 2010 Population By Ethnicity 27,314 Not Hispanic or Latino 25,850 94.64% Hispanic or Latino 1,464 5.36% 2010 Hispanic or Latino by Single-Classification Race 1,464 White Alone 849 57.97% Black or African American Alone 46 3.11% American Indian and Alaska Native Alone 45 3.10% Asian Alone 18 1.21% Native Hawaiian and Other Pacific Islander Alone 7 0.45% Some Other Race Alone 326 22.27% Two or More Races 174 11.90% 2010 Population by Sex 27,314 Male 14,793 54.16% Female 12,522 45.84% Male/Female Ratio 1.18
2010 Population by Age 27,314 Age 0 to 4 510 1.87% Age 5 to 9 432 1.58% Age 10 to 14 376 1.38% Age 15 to 17 263 0.96% Age 18 to 20 2,174 7.96% Age 21 to 24 3,885 14.22% Age 25 to 34 6,904 25.28% Age 35 to 44 3,225 11.81% Age 45 to 54 2,869 10.50% Age 55 to 64 3,274 11.99% Age 65 to 74 1,783 6.53% Age 75 to 84 1,099 4.02% Age 85 and over 521 1.91% Age 16 and over 25,927 94.92% Age 18 and over 25,733 94.21% Age 21 and over 23,559 86.25% Age 65 and over 3,403 12.46% 2010 Median Age 33.72
Sitewise Online Pop-Facts: Census Demographic Overview (Part 1) Pop-Facts: Census Demographic Overview (Part 1) 1S1E04DB07200 0 - 1 mi
1S1E04DB07200
Copyright © Claritas, LLC 2022. All rights reserved.
2010 Male Population by Age 14,793 Age 0 to 4 265 1.79% Age 5 to 9 198 1.34% Age 10 to 14 178 1.20% Age 15 to 17 134 0.90% Age 18 to 20 985 6.66% Age 21 to 24 1,930 13.05% Age 25 to 34 3,902 26.38% Age 35 to 44 1,954 13.21% Age 45 to 54 1,765 11.93% Age 55 to 64 1,857 12.55% Age 65 to 74 943 6.37% Age 75 to 84 507 3.43% Age 85 and over 175 1.18% 2010 Median Age, Male 34.50 2010 Female Population by Age 12,522 Age 0 to 4 245 1.96% Age 5 to 9 233 1.86% Age 10 to 14 198 1.58% Age 15 to 17 130 1.04% Age 18 to 20 1,189 9.50% Age 21 to 24 1,954 15.61% Age 25 to 34 3,002 23.97% Age 35 to 44 1,271 10.15% Age 45 to 54 1,103 8.81% Age 55 to 64 1,417 11.32% Age 65 to 74 840 6.71% Age 75 to 84 592 4.73% Age 85 and over 346 2.76% 2010 Median Age, Female 32.70
1S1E04DB07200 Sitewise Online Pop-Facts: Census Demographic Overview (Part 1) Pop-Facts: Census Demographic Overview (Part 1) 1S1E04DB07200 0 - 1 mi
1S1E04DB07200 Sitewise Online Pop-Facts: Census Demographic Overview (Part 2) Pop-Facts: Census Demographic Overview (Part 2) 1S1E04DB07200 0 - 1 mi Households 2027 Projection 18,808 2022 Estimate 18,026 2010 Census 15,953 2000 Census 14,269 Growth 2022-2027 4.34% Growth 2010-2022 12.99% Growth 2000-2010 11.80% 2010 Households by Household Type 15,953 Family Households 3,452 21.64% Non-family Households 12,501 78.36% 2010 Group Quarters Population 3,013 2010 Hispanic or Latino Households 736 4.62% 2010 Households by Household Size 15,953 1-person 9,897 62.04% 2-person 4,700 29.46% 3-person 809 5.07% 4-person 400 2.51% 5-person 104 0.65% 6-person 35 0.22% 7-or-more-person 8 0.05%
2010 Households by Type and Presence of Children 15,953 Married-Couple Family, own children 692 4.34% Male Householder, own children 78 0.49% Female Householder, own children 159 1.00% Married-Couple Family, no own children 2,170 13.60% Male Householder, no own children 156 0.98% Female Householder, no own children 197 1.23% Non-family Households 12,501 78.36% 2010 Households by Presence of People Under Age 18 15,953 HH with 1 or More People Under Age 18: 972 6.09% Households with No People Under Age 18: 14,981 93.91% HH with 1 or More People Under Age 18: 972 Married-Couple Family 697 71.70% Other Family, Male Householder 83 8.58% Other Family, Female Householder 169 17.38% Nonfamily, Male Householder 15 1.51% Nonfamily, Female Householder 8 0.83% Households with No People Under Age 18: 14,981 Married-Couple Family 2,165 14.45% Other Family, Male Householder 151 1.01% Other Family, Female Householder 187 1.25% Nonfamily, Male Householder 6,932 46.27% Nonfamily, Female Householder 5,546 37.02% 2010 Occupied Housing Units by Tenure 15,953 Owner-Occupied 3,732 23.39% Renter-Occupied 12,222 76.61% Copyright © Claritas, LLC 2022. All rights reserved. 1S1E04DB07200 Sitewise Online Pop-Facts: Census Demographic Overview (Part 2) Pop-Facts: Census Demographic Overview (Part 2) 1S1E04DB07200 0 - 1 mi
Sitewise Online Retail Market Power Opportunity Gap Report By Retail Store Types Retail Market Power Opportunity Gap Report By Retail Store Types 1S1E04DB07200 0 - 1 mi 2022 Demand 2022 Supply Opportunity Gap/Surplus Total retail trade including food and drink (NAICS 44, 45 and 722) $877,002,599 $1,324,420,870 -$447,418,274 Total retail trade (NAICS 44 and 45) $769,413,579 $1,031,142,808 -$261,729,236 Motor vehicle and parts dealers (NAICS 441) $170,632,809 $88,406,187 $82,226,622 Automobile dealers (NAICS 4411) $144,204,312 $63,239,007 $80,965,305 New car dealers (NAICS 44111) $128,147,612 $62,599,111 $65,548,502 Used car dealers (NAICS 44112) $16,056,700 $639,896 $15,416,804 Other motor vehicle dealers (NAICS 4412) $14,723,951 $14,719,684 $ 4,267 Recreational vehicle dealers (NAICS 44121) $5,694,434 $7,560,862 -$1,866,428 Motorcycle, boat, and other motor vehicle dealers (NAICS 44122) $9,029,517 $7,158,821 $1,870,696 Boat dealers (NAICS 441222) $3,399,353 $2,222,184 $1,177,169 Motorcycle, ATV, and all other motor vehicle dealers (NAICS 441228) $5,630,164 $4,936,637 $693,527 Automotive parts, accessories, and tire stores (NAICS 4413) $11,704,547 $10,447,497 $1,257,051 Automotive parts and accessories stores (NAICS 44131) $7,401,509 $7,571,270 -$169,760 Tire dealers (NAICS 44132) $4,303,038 $2,876,227 $1,426,811 Furniture and home furnishings stores (NAICS 442) $16,823,942 $43,000,038 -$26,176,095 Furniture stores (NAICS 4421) $9,135,695 $25,058,811 -$15,923,116 Home furnishings stores (NAICS 4422) $7,688,247 $17,941,227 -$10,252,980 Floor covering stores (NAICS 44221) $3,789,183 $9,078,595 -$5,289,412 Other home furnishings stores (NAICS 44229) $3,899,064 $8,862,631 -$4,963,567 Window treatment stores (NAICS 442291) $193,949 $ 11,956 $181,993 All other home furnishings stores (NAICS 442299) $3,705,115 $8,850,676 -$5,145,560 Electronics and appliance stores (NAICS 443) $10,119,139 $39,805,298 -$29,686,160 Household appliance stores (NAICS 443141) $2,311,891 $7,887,115 -$5,575,225 Electronics stores (NAICS 443142) $7,807,248 $31,918,183 -$24,110,934 Building material and garden equipment and supplies dealers (NAICS 444) $54,847,146 $73,628,301 -$18,781,156 Building material and supplies dealers (NAICS 4441) $47,291,033 $68,325,446 -$21,034,413 Home centers (NAICS 44411) $26,246,813 $38,608,604 -$12,361,790 Paint and wallpaper stores (NAICS 44412) $1,608,471 $3,943,137 -$2,334,665 Hardware stores (NAICS 44413) $4,261,613 $3,037,051 $1,224,562 Other building material dealers (NAICS 44419) $15,174,136 $22,736,654 -$7,562,518 Lawn and garden equipment and supplies stores (NAICS 4442) $7,556,113 $5,302,855 $2,253,257 Outdoor power equipment stores (NAICS 44421) $1,528,640 $816,988 $711,652 Nursery, garden center, and farm supply stores (NAICS 44422) $6,027,473 $4,485,867 $1,541,606 Food and beverage stores (NAICS 445) $115,723,715 $195,206,073 -$79,482,362 Grocery stores (NAICS 4451) $101,613,353 $161,647,996 -$60,034,644 Supermarkets and other grocery (except convenience) stores (NAICS 44511) $97,238,102 $136,663,172 -$39,425,070 Convenience stores (NAICS 44512) $4,375,251 $24,984,826 -$20,609,574 Specialty food stores (NAICS 4452) $2,921,535 $11,204,482 -$8,282,948
1S1E04DB07200
Meat markets (NAICS 44521) $883,835 $3,126,426 -$2,242,591 Fish and seafood markets (NAICS 44522) $348,145 $2,680,555 -$2,332,410 Fruit and vegetable markets (NAICS 44523) $605,334 $1,374,968 -$769,634 Other specialty food stores (NAICS 44529) $1,084,221 $4,022,533 -$2,938,313 Baked goods and confectionery and nut stores (NAICS 445291 + 445292) $573,856 $715,597 -$141,741 All other specialty food stores (NAICS 445299) $510,364 $3,306,936 -$2,796,572 Beer, wine, and liquor stores (NAICS 4453) $11,188,828 $22,353,594 -$11,164,766 Health and personal care stores (NAICS 446) $45,350,757 $67,851,884 -$22,501,127 Pharmacies and drug stores (NAICS 44611) $39,451,871 $43,705,467 -$4,253,595 Cosmetics, beauty supplies, and perfume stores (NAICS 44612) $2,631,300 $7,911,517 -$5,280,216 Optical goods stores (NAICS 44613) $1,175,143 $4,145,255 -$2,970,112 Other health and personal care stores (NAICS 44619) $2,092,442 $12,089,645 -$9,997,203 Food (health) supplement stores (NAICS 446191) $742,636 $5,861,004 -$5,118,368 All other health and personal care stores (NAICS 446199) $1,349,806 $6,228,641 -$4,878,835 Gasoline stations (NAICS 447) $61,478,866 $28,389,745 $33,089,121 Clothing and clothing accessories stores (NAICS 448) $31,235,972 $124,070,281 -$92,834,310 Clothing stores (NAICS 4481) $20,366,577 $72,643,021 -$52,276,444 Men's clothing stores (NAICS 44811) $1,018,169 $1,277,024 -$258,855 Women's clothing stores (NAICS 44812) $3,733,273 $17,268,054 -$13,534,782 Children's and infants' clothing stores (NAICS 44813) $401,867 $894,752 -$492,885 Family clothing stores (NAICS 44814) $12,200,465 $46,541,686 -$34,341,221 Clothing accessories stores (NAICS 44815) $1,074,314 $1,970,105 -$895,791 Other clothing stores (NAICS 44819) $1,938,489 $4,691,400 -$2,752,911 Shoe stores (NAICS 4482) $4,109,535 $11,372,287 -$7,262,752 Jewelry, luggage, and leather goods stores (NAICS 4483) $6,759,860 $40,054,973 -$33,295,113 Jewelry stores (NAICS 44831) $4,488,016 $24,515,623 -$20,027,608 Luggage and leather goods stores (NAICS 44832) $2,271,844 $15,539,349 -$13,267,505 Sporting goods, hobby, musical instrument, and book stores (NAICS 451) $11,874,119 $39,411,653 -$27,537,534 Sporting goods, hobby, and musical instrument stores (NAICS 4511) $10,680,994 $31,406,670 -$20,725,675 Sporting goods stores (NAICS 45111) $8,029,002 $22,035,279 -$14,006,278 Hobby, toy, and game stores (NAICS 45112) $1,872,361 $6,418,985 -$4,546,623 Sewing, needlework, and piece goods stores (NAICS 45113) $333,973 $757,740 -$423,768 Musical instrument and supplies stores (NAICS 45114) $445,659 $2,194,666 -$1,749,007 Book stores and news dealers (NAICS 4512) $1,193,125 $8,004,983 -$6,811,858 Book stores (NAICS 451211) $1,109,728 $6,629,037 -$5,519,309 News dealers and newsstands (NAICS 451212) $ 83,397 $1,375,945 -$1,292,548 General merchandise stores (NAICS 452) $98,160,197 $150,799,611 -$52,639,414 Department stores (NAICS 4522) $12,180,555 $16,903,603 -$4,723,047 Other general merchandise stores (NAICS 4523) $85,979,644 $133,896,009 -$47,916,366 Warehouse clubs and supercenters (NAICS 452311) $77,724,851 $133,747,857 -$56,023,007 All other general merchandise stores (NAICS 452319) $8,254,792 $148,152 $8,106,640 1S1E04DB07200 Sitewise Online Retail Market Power Opportunity Gap Report By Retail Store Types Retail Market Power Opportunity Gap Report By Retail Store Types 1S1E04DB07200 0 - 1 mi 2022 Demand 2022 Supply Opportunity Gap/Surplus
1S1E04DB07200
* GAFO (General merchandise, Apparel, Furniture and Other) represents sales at stores that sell merchandise normally sold in department stores. This category is not included in Total Retail Sales Including Eating and Drinking Places.
Miscellaneous store retailers (NAICS 453) $17,496,374 $52,885,051 -$35,388,677 Florists (NAICS 4531) $757,467 $3,931,714 -$3,174,248 Office supplies, stationery, and gift stores (NAICS 4532) $3,686,423 $15,031,057 -$11,344,633 Office supplies and stationery stores (NAICS 45321) $1,609,244 $5,863,921 -$4,254,677 Gift, novelty, and souvenir stores (NAICS 45322) $2,077,180 $9,167,136 -$7,089,956 Used merchandise stores (NAICS 4533) $2,488,970 $7,871,341 -$5,382,371 Other miscellaneous store retailers (NAICS 4539) $10,563,515 $26,050,939 -$15,487,424 Pet and pet supplies stores (NAICS 45391) $3,224,461 $9,117,108 -$5,892,647 Art dealers (NAICS 45392) $1,738,999 $222,419 $1,516,580 Manufactured (mobile) home dealers (NAICS 45393) $974,311 $ 89,235 $885,075 All other miscellaneous store retailers (NAICS 45399) $4,625,743 $16,622,176 -$11,996,433 Tobacco stores (NAICS 453991) $1,467,785 $2,619,963 -$1,152,178 All other miscellaneous store retailers (except tobacco stores) (NAICS 453998) $3,157,958 $14,002,213 -$10,844,255 Non-store retailers (NAICS 454) $135,670,541 $127,688,685 $7,981,856 Electronic shopping and mail-order houses (NAICS 4541) $128,617,593 $123,959,622 $4,657,972 Vending machine operators (NAICS 4542) $956,108 $882,286 $ 73,822 Direct selling establishments (NAICS 4543) $6,096,841 $2,846,778 $3,250,063 Fuel dealers (NAICS 45431) $2,930,516 $312,696 $2,617,820 Other direct selling establishments (NAICS 45439) $3,166,325 $2,534,082 $632,244 Food services and drinking places (NAICS 722) $107,589,019 $293,278,062 -$185,689,036 Special food services (NAICS 7223) $8,525,594 $26,833,386 -$18,307,793 Food service contractors (NAICS 72231) $6,766,316 $19,911,569 -$13,145,252 Caterers (NAICS 72232) $1,603,680 $5,890,266 -$4,286,587 Mobile food services (NAICS 72233) $155,597 $1,031,550 -$875,953 Drinking places (alcoholic beverages) (NAICS 7224) $4,109,667 $19,399,123 -$15,289,457 Restaurants and other eating places (NAICS 7225) $94,953,759 $247,045,552 -$152,091,791 Full-service restaurants (NAICS 722511) $48,523,384 $158,690,761 -$110,167,377 Limited-service restaurants (NAICS 722513) $39,420,381 $33,854,660 $5,565,721 Cafeterias, grill buffets, and buffets (NAICS 722514) $1,005,105 $1,982,552 -$977,446 Snack and nonalcoholic beverage bars (NAICS 722515) $6,004,888 $52,517,580 -$46,512,692 GAFO* $168,217,056 $397,101,913 -$228,884,858 General Merchandise Stores-452 $98,160,197 $150,799,611 -$52,639,414 Clothing & Clothing Accessories Stores-448 $31,235,972 $124,070,281 -$92,834,310 Furniture & Home Furnishings Stores-442 $16,823,942 $43,000,038 -$26,176,095 Electronics & Appliance Stores-443 $10,119,139 $39,805,298 -$29,686,160 Sporting Goods, Hobby, Book, Music Stores-451 $11,874,119 $39,411,653 -$27,537,534 Office Supplies, Stationery, Gift Stores-4532 $3,686,423 $15,031,057 -$11,344,633
Sitewise Online Retail Market Power Opportunity Gap Report By Retail Store Types Retail Market Power Opportunity Gap Report By Retail Store Types 1S1E04DB07200 0 - 1 mi 2022 Demand 2022 Supply Opportunity Gap/Surplus
Retail Market Power Opportunity Gap Report By Retail Store Types
Retail Market Power data is derived from two major sources of information. The demand data is derived from the Consumer Expenditure Survey (CE Survey or CEX), which is fielded by the U.S. Bureau of Labor Statistics (BLS). The supply data is derived from the Census of Retail Trade (CRT), which is made available by the U.S. Census. Additional data sources are incorporated to create both supply and demand estimates. The difference between demand and supply represents the opportunity gap or surplus available for each merchandise line in the specified reporting geography. When this difference is positive (demand is greater than the supply), there is an opportunity gap for that merchandise line; when the difference is negative (supply is greater than demand), there is a surplus.
Copyright © 2022 Environics Analytics. All rights reserved.
1S1E04DB07200 Sitewise Online
1S1E04DB07200 0 - 1 mi 2022 Demand 2022 Supply Opportunity Gap/Surplus
Retail Market Power Opportunity Gap Report By Retail Store Types


 Powered by Sitewise
Data Source: Kalibrate TrafficMetrix
Powered by Sitewise
Data Source: Kalibrate TrafficMetrix