ZONING
Detailed Zoning Information
CC (Central Commercial Zone)

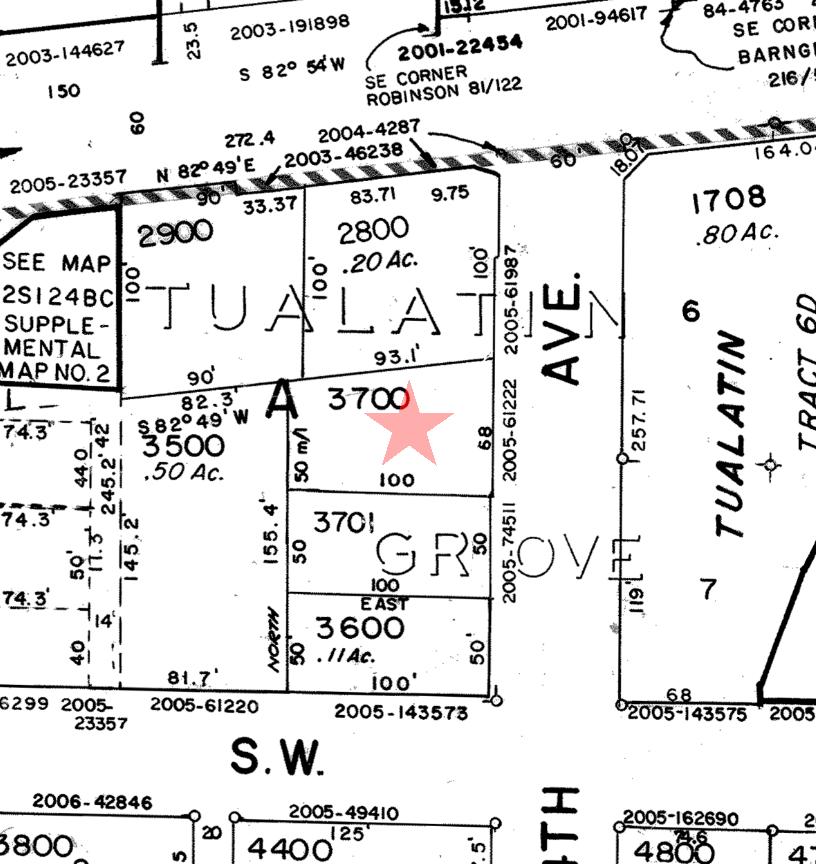
Zoning Map
Community Jurisdiction
The information contained is provided by WFG’s Customer Service Department to our customers, and while deemed reliable, is not guaranteed.
DETAILS
TDC 53 100 - Purpose
The purpose of this district is to provide areas of the City that are suitable for a full range of retail, professional and service uses of the kind usually found in downtown areas patronized by pedestrians. The district also provides areas suitable for civic, social and cultural functions serving the general community
TDC 53.200. - Use Categories.
Use Categories Table 53-1 lists use categories Permitted Outright (P) or Conditionally Permitted (C) in the CC zone. Use categories may also be designated as Limited (L) and subject to the limitations listed in Table 53-1 and restrictions identified in TDC 53.210. Limitations may restrict the specific type of use, location, size, or other characteristics of the use category Use categories which are not listed are prohibited within the zone, except for uses which are found by the City Manager or appointee to be of a similar character and to meet the purpose of this zone, as provided in TDC 31 070
Overlay Zones. Additional uses may be allowed in a particular overlay zone. See the overlay zone Chapters for additional uses
Table 53-1
Use Categories in the CC Zone
USE CATEGORY STATUS LIMITATIONS AND CODE REFERENCES
RESIDENTIAL USE CATEGORIES
Residential Accessory Uses P (L)
COMMERCIAL USE CATEGORIES
Commercial Lodging P
Permitted uses limited to Family Child Care Home subject to ORS 329A.440.
(1) (2)
CHAPTER 53 - CENTRAL COMMERCIAL ZONE (CC)
Commercial Recreation P (L)
Permitted uses limited to:
• Amusement enterprise, including pool hall, bowling alley, dance hall or skating rink;
• Private meeting hall, club or lodge hall, or fraternal organizations; and
• Health studio. Commercial Parking P
Durable Goods Sales P (L)
Permitted uses limited to:
• Furniture store, including antiques and second-hand furniture; and
• Appliance store, subject to TDC 53.210(2).
INSTITUTIONAL USE CATEGORIES
Conditional use permit required for veterinary clinic.
Memorial Planning and Products Center (as de�ned in TDC 39.115) not permitted. All other uses permitted outright.
All uses subject to TDC 53.210(4).
Eating and Drinking Establishments P
restrictions
Overlay Zone
Medical O�ce P O�ce P
Sales and Services P/C
Some
in the Central Tualatin
see TDC Chapter 58.
Retail
Assembly Facilities C
Permitted uses limited to business college.
All other use are conditional uses.
INFRASTRUCTURE
Permitted uses limited to sewer and water pump stations and pressure reading stations.
Conditional uses limited to utility substations.
Conditional uses limited to publicly- and privately-operated ambulance facilities.
All other uses permitted outright.
Permitted uses limited to:
• Wireless Communication Facility
Attached; and
• Wireless Communication Facility, located within 300 feet of the centerline of I-5.
P/C
Colleges, Universities and Private Career Schools
(L)
Community Services P Schools C
AND UTILITIES USE CATEGORIES Basic Utilities P/C (L)
Greenways and Natural Areas P Parks and Open Space P Public Safety Facilities P/C (L)
Transportation Facilities P Wireless
Facilities P(L)
Communication
TDC 53 210 - Additional Limitations on Uses
Appliance Stores Incidental repair of appliances is permitted as an accessory use
Veterinary Clinic. Veterinary clinics may be permitted as a conditional use if treatment is limited to small animals
Outdoor Uses. All uses must be conducted wholly within a completely enclosed building, except off-street parking and loading, Basic Utilities, Wireless Communication Facilities, outdoor play areas of child day care centers, as required by state day care certification standards, and as provided in (a) (c), below.
Outside storage or sales requires a conditional use permit.
Outdoor sales, as defined in TDC 31.060 and as provided for in TDC 34.011, are permitted as a temporary use.
Portable collection facilities as an accessory use require a conditional use permit, and are subject to the following standards:
The facility must be sited such that it is either adjacent to existing vegetation or in a location where vegetation can be installed to enhance the appearance of the facility;
If vegetation is not already in place, landscaping, as approved through the Architectural Review process, must be installed adjacent to the location of the portable collection facility;
Items must not be stored outside the facility, except for temporary storage of oversized goods;
Oversized goods stored outside must be collected daily and removed from the premises or stored inside the portable collection facility; and
Adequate receptacle must be provided for items dropped off during times the facility is not attended.
TDC 53.300.
- Development Standards.
Development standards in the CC zone are listed in Table 53-2. Additional standards may apply to some uses and situations, see TDC 53 310
Table 53-2
Development Standards in the CC Zone
STANDARD
REQUIREMENT LIMITATIONS AND CODE REFERENCES
(1) (2) (3) (a) (b) (c) (i) (ii) (iii) (iv) (v)
MINIMUM LOT SIZE
All Uses
MINIMUM LOT WIDTH
10,000 square feet
Minimum Average Lot Width 75 feet
When lot has frontage on public street or is located on a cul-de-sac street, minimum lot width at the street must be 40 feet.
Infrastructure and Utilities Uses
Flag Lots
MINIMUM SETBACKS
Front
0 20 feet
As determined through the Subdivision, Partition, or Lot Line Adjustment process
Must be su�cient to comply with minimum access requirements of TDC 73C.
Side and Rear
0 - 20 feet
Determined through Architectural Review Process. Buildings over 45 feet in height are subject to TDC 53.410(1).
Residential garage doors facing public street must be set back 20 feet from public right-of-way.
Determined through Architectural Review Process.
Rear 0 - 15 feet
Determined through Architectural Review Process.
Corner Lots 0 - 20 feet along each frontage
Must be a su�cient distance to provide adequate sight distance for vehicular and pedestrian tra�c at an intersection, as determined through the Architectural Review process.
Parking and Vehicle Circulation Areas
5 feet
Fences 5 feet
MAXIMUM STRUCTURE HEIGHT
All Uses 45 feet
Except as approved through Architectural Review process.
From public right-of-way.
Flagpoles may extend up to 100 feet.
Height bonus available in limited locations, see TDC 53.410(1).
TDC 53.310. - Additional Development Standards.
(1) (a) (b)
Height Bonus. In the CC zone, north of SW Boones Ferry Road and south of the Tualatin River, the maximum height for a structure is 125 feet, when approved with a conditional use permit and subject to the following setback requirements:
Frontyard. Any structure south of Hedges Creek must comply with the CC District setbacks and any structure north of Hedges Creek must comply with the TDC Chapter 72 setbacks for Hedges Creek.
Sideyard The minimum side yard setback is:
(i) (ii) (iii)
For structures 45 feet or less in height, zero to 15 feet as determined through the Architectural Review process;
For structures greater than 45 feet, but less than 84 feet, the side yard setback must be 30 feet for that portion of the structure greater than 45 feet and less than 84 feet in height; and
For structures greater than 84 feet but less than or equal to 125 feet in height, the side yard setback must be 45 feet for that portion of the building greater than 84 feet in height
(Ord. 1414-18, 12-10-18)

G IP MF CC CC CG CO MG ML RH RH RH/HR RL RL RML SW NYBERG ST S W TUALATIN RD S W M A R T I N A Z Z I VA E SW 89TH AVE S W NYB E RG ST SW SENECA ST T U A L A T I N C O M M O N S E N T R SW BARNGROVER WAY SW OLD TUALATIN SHERWOOD RD SW M O H A V E C T SW BOONES FERRY RD SW S E NE CA S T S W 8 6 T H A V E SW C HEROKEE ST SW CHIN OOK ST S W 8 4 T H A V E SW TUALATIN SHERWOOD RD N Y B E R G R I V E R S M A I N E N T R S W 8 9 T H A V E SW TONKA ST SW SW E E K DR This map s a copy of public record and s provided solely for nform ation purposes W FG National Tit e assumes no liab ity for variations, f any, in d mens ons, area or location of the prem ises or the locat on of mprovements Customer Serv ice D epartment 12909 SW 68th Parkway, Suite 350 Portl and, OR 97223 (503) 603-1700 cs@w fgnationaltitle.com 0 190 380 95 Fee t
Subject Property Tax Lots Commercial Indust rial Multi Family Park s & O pen Spaces Single Family ²
Zoni ng
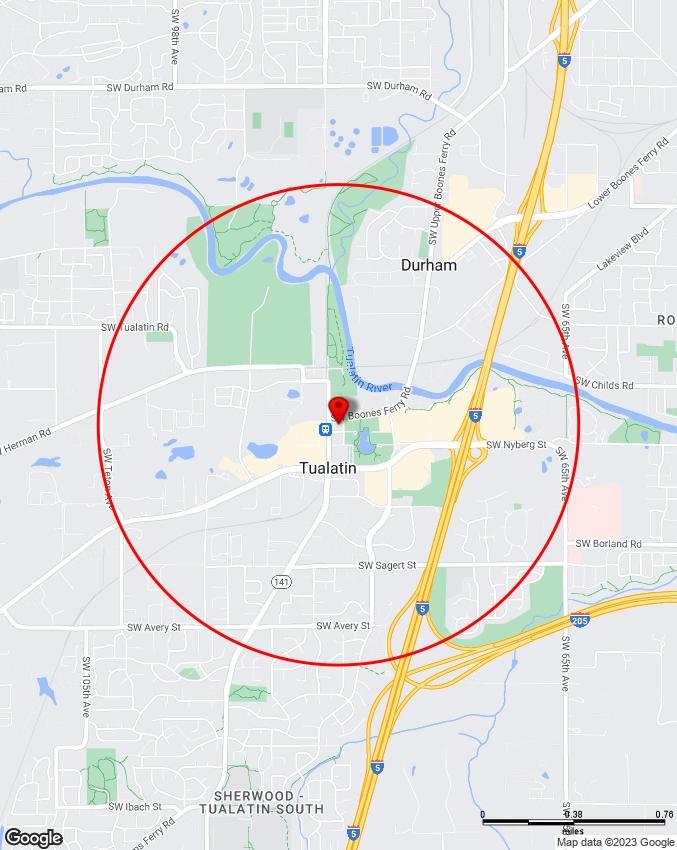
COMMUNITY
INFORMATION
Demographics
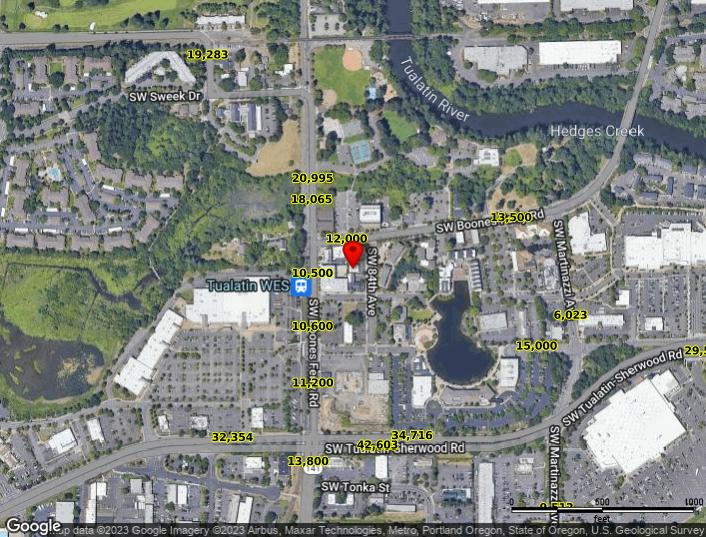
Traffic Counts
The information contained is provided by WFG’s Customer Service Department to our customers, and while deemed reliable, is not guaranteed.
18847 SW 84th Ave, Tualatin, OR 97062

18847 SW 84th Ave, Tualatin, OR 97062 Sitewise Online Pop-Facts: Population Quick Facts Pop-Facts: Population Quick Facts 18847 SW 84th Ave, Tualatin, OR 97062 0 - 1 mi Population 2027 Projection 14,042 2022 Estimate 13,432 2010 Census 11,627 2000 Census 11,048 Growth 2022-2027 4.54% Growth 2010-2022 15.53% Growth 2000-2010 5.24% 2022 Est. Population by Age 13,432 Age 0 to 4 921 6.86% Age 5 to 9 814 6.06% Age 10 to 14 839 6.25% Age 15 to 17 502 3.74% Age 18 to 20 461 3.43% Age 21 to 24 631 4.70% Age 25 to 34 2,248 16.74% Age 35 to 44 2,378 17.71% Age 45 to 54 1,764 13.14% Age 55 to 64 1,360 10.13% Age 65 to 74 1,015 7.55% Age 75 to 84 405 3.01% Age 85 and over 91 0.68% Age 16 and over 10,693 79.61% Age 18 and over 10,355 77.09% Age 21 and over 9,893 73.66% Age 65 and over 1,511 11.25% 2022 Est. Median Age 36.25 2022 Est. Average Age 36.75
2022 Est. Population by Single-Classification Race 13,432 White Alone 8,951 66.64% Black or African American Alone 243 1.81% American Indian and Alaska Native Alone 132 0.98% Asian Alone 412 3.07% Native Hawaiian and Other Pacific Islander Alone 269 2.00% Some Other Race Alone 2,778 20.68% Two or More Races 648 4.82% 2022 Est. Population by Ethnicity (Hispanic or Latino) 13,432 Hispanic or Latino 4,047 30.13% Not Hispanic or Latino 9,385 69.87% 2022 Est. Population by Sex 13,432 Male 6,738 50.17% Female 6,694 49.83%
18847 SW 84th Ave, Tualatin, OR 97062 Sitewise Online Pop-Facts: Population Quick Facts Pop-Facts: Population Quick Facts 18847 SW 84th Ave, Tualatin, OR 97062 0 - 1 mi
Copyright © Claritas, LLC 2022. All rights reserved.
18847 SW 84th Ave, Tualatin, OR 97062 Sitewise Online Pop-Facts: Household Quick Facts Pop-Facts: Household Quick Facts 18847 SW 84th Ave, Tualatin, OR 97062 0 - 1 mi Households 2027 Projection 5,937 2022 Estimate 5,674 2010 Census 4,809 2000 Census 4,497 Growth 2022-2027 4.64% Growth 2010-2022 17.98% Growth 2000-2010 6.95% 2022 Est. Households by Household Income 5,674 Income Less than $15,000 499 8.80% Income $15,000 to $24,999 445 7.84% Income $25,000 to $34,999 469 8.27% Income $35,000 to $49,999 787 13.87% Income $50,000 to $74,999 931 16.41% Income $75,000 to $99,999 800 14.10% Income $100,000 to $124,999 580 10.22% Income $125,000 to $149,999 374 6.60% Income $150,000 to $199,999 386 6.80% Income $200,000 to $249,999 186 3.28% Income $250,000 to $499,999 152 2.68% Income $500,000 or more 63 1.12% 2022 Est. Average Household Income $ 88,504 2022 Est. Median Household Income $ 67,085 2022 Median HH Inc. by Single-Classification Race White Alone $ 64,532 Black or African American Alone $ 61,572 American Indian and Alaska Native Alone $ 44,580 Asian Alone $ 76,269 Native Hawaiian and Other Pacific Islander Alone $ 96,380 Some Other Race Alone $ 73,515 Two or More Races $ 48,710 Hispanic or Latino $ 53,145 Not Hispanic or Latino $ 70,705 2022 Est. Households by Household Type 5,674 Family Households 3,142 55.37% Nonfamily Households 2,532 44.63% 2022 Est. Group Quarters Population 17
2022 Est. Households by Household Size 5,674 1-person 1,940 34.19% 2-person 1,736 30.59% 3-person 871 15.35% 4-person 617 10.87% 5-person 302 5.32% 6-person 127 2.23% 7-or-more-person 82 1.44% 2022 Est. Average Household Size 2.36 18847 SW 84th Ave, Tualatin, OR 97062 Sitewise Online Pop-Facts: Household Quick Facts Pop-Facts: Household Quick Facts 18847 SW 84th Ave, Tualatin, OR 97062 0 - 1 mi
2022 Est. HHs by Type by Presence of Own Children 3,142 Married-Couple Family, own children 986 31.37% Married-Couple Family, no own children 1,075 34.20% Male Householder, own children 183 5.82% Male Householder, no own children 125 3.98% Female Householder, own children 513 16.33% Female Householder, no own children 260 8.29% Copyright © Claritas, LLC 2022. All rights reserved. 18847 SW 84th Ave, Tualatin, OR 97062 Sitewise Online Pop-Facts: Household Quick Facts Pop-Facts: Household Quick Facts 18847 SW 84th Ave, Tualatin, OR 97062 0 - 1 mi
18847 SW 84th Ave, Tualatin, OR 97062 Sitewise Online Pop-Facts: Demographic Snapshot (Part 1) Pop-Facts: Demographic Snapshot (Part 1) 18847 SW 84th Ave, Tualatin, OR 97062 0 - 1 mi Population 2027 Projection 14,042 2022 Estimate 13,432 2010 Census 11,627 2000 Census 11,048 Growth 2022-2027 4.54% Growth 2010-2022 15.53% Growth 2000-2010 5.24% 2022 Est. Population by Single-Classification Race 13,432 White Alone 8,951 66.64% Black or African American Alone 243 1.81% American Indian and Alaska Native Alone 132 0.98% Asian Alone 412 3.07% Native Hawaiian and Other Pacific Islander Alone 269 2.00% Some Other Race Alone 2,778 20.68% Two or More Races 648 4.82% 2022 Est. Population Hispanic or Latino by Origin 13,432 Not Hispanic or Latino 9,385 69.87% Hispanic or Latino 4,047 30.13% Hispanic or Latino by Origin 4,047 Mexican 3,588 88.65% Puerto Rican 46 1.14% Cuban 12 0.30% All Other Hispanic or Latino 401 9.91% 2022 Est. Hisp. or Latino Pop by Single-Classification Race 4,047 White Alone 960 23.72% Black or African American Alone 19 0.48% American Indian and Alaska Native Alone 33 0.81% Asian Alone 2 0.05% Native Hawaiian and Other Pacific Islander Alone 15 0.36% Some Other Race Alone 2,758 68.15% Two or More Races 260 6.43%
2022 Est. Pop by Race, Asian Alone, by Category 412 Chinese, except Taiwanese 70 16.92% Filipino 125 30.28% Japanese 36 8.76% Asian Indian 59 14.42% Korean 28 6.89% Vietnamese 17 4.09% Cambodian 0 0.00% Hmong 10 2.33% Laotian 3 0.70% Thai 0 0.00% All other Asian Races, including 2 or more 64 15.62% 2022 Est. Population by Ancestry 13,432 Arab 6 0.04% Czech 55 0.41% Danish 134 1.00% Dutch 138 1.03% English 796 5.92% French (except Basque) 310 2.30% French Canadian 37 0.28% German 1,420 10.57% Greek 20 0.15% Hungarian 15 0.11% Irish 1,023 7.62% Italian 381 2.84% Lithuanian 7 0.05% Norwegian 324 2.41% Polish 110 0.82% Portuguese 46 0.35% Russian 55 0.41% Scottish 231 1.72% Scotch-Irish 118 0.88% Slovak 19 0.14% Subsaharan African 109 0.81% Swedish 185 1.38% Swiss 155 1.15% Ukrainian 38 0.28% United States or American 299 2.23% Welsh 63 0.47% West Indian (except Hisp. groups) 0 0.00% Other Ancestries 5,808 43.24% Ancestry Unclassified 1,530 11.39% 2022 Est. Pop Age 5+ by Language Spoken At Home 12,511 Speak only English 9,287 74.23% 18847 SW 84th Ave, Tualatin, OR 97062 Sitewise Online Pop-Facts: Demographic Snapshot (Part 1) Pop-Facts: Demographic Snapshot (Part 1) 18847 SW 84th Ave, Tualatin, OR 97062 0 - 1 mi
Speak Asian or Pacific Island Language 459 3.67% Speak IndoEuropean Language 234 1.87% Speak Spanish 2,413 19.28% Speak Other Language 118 0.94% 18847 SW 84th Ave, Tualatin, OR 97062 Sitewise Online Pop-Facts: Demographic Snapshot (Part 1) Pop-Facts: Demographic Snapshot (Part 1) 18847 SW 84th Ave, Tualatin, OR 97062 0 - 1 mi
2022 Est. Population by Sex 13,432 Male 6,738 50.17% Female 6,694 49.83% 2022 Est. Population by Age 13,432 Age 0 to 4 921 6.86% Age 5 to 9 814 6.06% Age 10 to 14 839 6.25% Age 15 to 17 502 3.74% Age 18 to 20 461 3.43% Age 21 to 24 631 4.70% Age 25 to 34 2,248 16.74% Age 35 to 44 2,378 17.71% Age 45 to 54 1,764 13.14% Age 55 to 64 1,360 10.13% Age 65 to 74 1,015 7.55% Age 75 to 84 405 3.01% Age 85 and over 91 0.68% Age 16 and over 10,693 79.61% Age 18 and over 10,355 77.09% Age 21 and over 9,893 73.66% Age 65 and over 1,511 11.25% 2022 Est. Median Age 36.25 2022 Est. Average Age 36.75
18847
SW 84th Ave, Tualatin, OR 97062 Sitewise Online
Pop-Facts:
18847
0 - 1 mi
Pop-Facts: Demographic Snapshot (Part 1)
Demographic Snapshot (Part 1)
SW 84th Ave, Tualatin, OR 97062
2022 Est. Male Population by Age 6,738 Age 0 to 4 483 7.17% Age 5 to 9 423 6.28% Age 10 to 14 429 6.37% Age 15 to 17 252 3.74% Age 18 to 20 228 3.38% Age 21 to 24 290 4.31% Age 25 to 34 1,171 17.37% Age 35 to 44 1,218 18.08% Age 45 to 54 907 13.46% Age 55 to 64 670 9.95% Age 65 to 74 457 6.79% Age 75 to 84 176 2.61% Age 85 and over 32 0.48% 2022 Est. Median Age, Male 35.76 2022 Est. Average Age, Male 36.06 2022 Est. Female Population by Age 6,694 Age 0 to 4 438 6.55% Age 5 to 9 391 5.84% Age 10 to 14 410 6.13% Age 15 to 17 250 3.73% Age 18 to 20 234 3.49% Age 21 to 24 341 5.10% Age 25 to 34 1,078 16.10% Age 35 to 44 1,160 17.33% Age 45 to 54 857 12.81% Age 55 to 64 690 10.31% Age 65 to 74 557 8.33% Age 75 to 84 229 3.42% Age 85 and over 59 0.88% 2022 Est. Median Age, Female 36.77 2022 Est. Average Age, Female 37.47 18847 SW 84th Ave, Tualatin, OR 97062 Sitewise Online Pop-Facts: Demographic Snapshot (Part 1) Pop-Facts: Demographic Snapshot (Part 1) 18847 SW 84th Ave, Tualatin, OR 97062 0 - 1 mi
2022 Est. Pop Age 15+ by Marital Status 10,857 Total, Never Married 4,483 41.30% Males, Never Married 2,302 21.20% Females, Never Married 2,182 20.09% Married, Spouse present 4,073 37.52% Married, Spouse absent 458 4.22% Widowed 252 2.32% Males, Widowed 101 0.93% Females, Widowed 151 1.39% Divorced 1,590 14.64% Males, Divorced 554 5.10% Females, Divorced 1,036 9.54% 2022 Est. Pop Age 25+ by Edu. Attainment 9,262 Less than 9th grade 336 3.62% Some High School, no diploma 297 3.21% High School Graduate (or GED) 1,846 19.93% Some College, no degree 2,610 28.18% Associate Degree 847 9.15% Bachelor's Degree 2,193 23.68% Master's Degree 786 8.49% Professional School Degree 186 2.01% Doctorate Degree 160 1.73% 2022 Est. Pop. Age 25+ by Edu. Attain., Hisp./Lat. 2,202 No High School Diploma 479 21.77% High School Graduate 875 39.75% Some College or Associate's Degree 571 25.92% Bachelor's Degree or Higher 277 12.56% Copyright © Claritas, LLC 2022. All rights reserved. 18847 SW 84th Ave, Tualatin, OR 97062 Sitewise Online Pop-Facts: Demographic Snapshot (Part 1) Pop-Facts: Demographic Snapshot (Part 1) 18847 SW 84th Ave, Tualatin, OR 97062 0 - 1 mi
18847 SW 84th Ave, Tualatin, OR 97062 Sitewise Online Pop-Facts: Demographic Snapshot (Part 2) Pop-Facts: Demographic Snapshot (Part 2) 18847 SW 84th Ave, Tualatin, OR 97062 0 - 1 mi Households 2027 Projection 5,937 2022 Estimate 5,674 2010 Census 4,809 2000 Census 4,497 Growth 2022-2027 4.64% Growth 2010-2022 17.98% Growth 2000-2010 6.95% 2022 Est. Households by Household Type 5,674 Family Households 3,142 55.37% Nonfamily Households 2,532 44.63% 2022 Est. Group Quarters Population 17 2022 HHs by Ethnicity: Hispanic/Latino 1,101 19.41% 2022 Est. Households by HH Income 5,674 Income < $15,000 499 8.80% Income $15,000 to $24,999 445 7.84% Income $25,000 to $34,999 469 8.27% Income $35,000 to $49,999 787 13.87% Income $50,000 to $74,999 931 16.41% Income $75,000 to $99,999 800 14.10% Income $100,000 to $124,999 580 10.22% Income $125,000 to $149,999 374 6.60% Income $150,000 to $199,999 386 6.80% Income $200,000 to $249,999 186 3.28% Income $250,000 to $499,999 152 2.68% Income $500,000+ 63 1.12% 2022 Est. Average Household Income $ 88,504 2022 Est. Median Household Income $ 67,085 2022 Median HH Income by Single-Class. Race or Ethn. White Alone $ 64,532 Black or African American Alone $ 61,572 American Indian and Alaska Native Alone $ 44,580 Asian Alone $ 76,269 Native Hawaiian and Other Pacific Islander Alone $ 96,380 Some Other Race Alone $ 73,515 Two or More Races $ 48,710 Hispanic or Latino $ 53,145
Not Hispanic or Latino $ 70,705
Pop-Facts:
18847
Tualatin,
0 - 1 mi
18847 SW 84th Ave, Tualatin, OR 97062 Sitewise Online Pop-Facts: Demographic Snapshot (Part 2)
Demographic Snapshot (Part 2)
SW 84th Ave,
OR 97062
2022 Est. Family HH Type by Presence of Own Children 3,142 Married-Couple Family, own children 986 31.37% Married-Couple Family, no own children 1,075 34.20% Male Householder, own children 183 5.82% Male Householder, no own children 125 3.98% Female Householder, own children 513 16.33% Female Householder, no own children 260 8.29% 2022 Est. Households by Household Size 5,674 1-person 1,940 34.19% 2-person 1,736 30.59% 3-person 871 15.35% 4-person 617 10.87% 5-person 302 5.32% 6-person 127 2.23% 7-or-more-person 82 1.44% 2022 Est. Average Household Size 2.36 2022 Est. Households by Presence of People Under 18 5,674 Households with 1 or more People under Age 18 1,819 32.06% Households with No People under Age 18 3,855 67.94% Households with 1 or more People under Age 18 1,819 Married-Couple Family 1,027 56.44% Other Family, Male Householder 204 11.21% Other Family, Female Householder 565 31.08% Nonfamily, Male Householder 16 0.85% Nonfamily, Female Householder 8 0.42% Households with No People under Age 18 3,855 Married-Couple Family 1,034 26.82% Other Family, Male Householder 110 2.84% Other Family, Female Householder 205 5.32% Nonfamily, Male Householder 1,262 32.73% Nonfamily, Female Householder 1,245 32.29% 18847 SW 84th Ave, Tualatin, OR 97062 Sitewise Online Pop-Facts: Demographic Snapshot (Part 2) Pop-Facts: Demographic Snapshot (Part 2) 18847 SW 84th Ave, Tualatin, OR 97062 0 - 1 mi
2022 Est. Households by Number of Vehicles 5,674 No Vehicles 429 7.57% 1 Vehicle 2,534 44.65% 2 Vehicles 1,923 33.89% 3 Vehicles 606 10.69% 4 Vehicles 158 2.78% 5 or more Vehicles 24 0.42% 2022 Est. Average Number of Vehicles 1.59 Family Households 2027 Projection 3,277 2022 Estimate 3,142 2010 Census 2,758 2000 Census 2,607 Growth 2022-2027 4.30% Growth 2010-2022 13.93% Growth 2000-2010 5.77% 2022 Est. Families by Poverty Status 3,142 2022 Families at or Above Poverty 2,737 87.11% 2022 Families at or Above Poverty with Children 1,231 39.19% 2022 Families Below Poverty 405 12.89% 2022 Families Below Poverty with Children 373 11.89% 2022 Est. Pop Age 16+ by Employment Status 10,693 In Armed Forces 1 0.01% Civilian - Employed 7,677 71.80% Civilian - Unemployed 246 2.30% Not in Labor Force 2,768 25.89% 2022 Est. Civ. Employed Pop 16+ by Class of Worker 7,472 For-Profit Private Workers 5,967 79.86% Non-Profit Private Workers 416 5.57% Local Government Workers 325 4.35% State Government Workers 142 1.90% Federal Government Workers 43 0.57% Self-Employed Workers 572 7.66% Unpaid Family Workers 6 0.08% 18847 SW 84th Ave, Tualatin, OR 97062 Sitewise Online Pop-Facts: Demographic Snapshot (Part 2) Pop-Facts: Demographic Snapshot (Part 2) 18847 SW 84th Ave, Tualatin, OR 97062 0 - 1 mi
2022 Est. Civ. Employed Pop 16+ by Occupation 7,472 Architect/Engineer 205 2.75% Arts/Entertainment/Sports 107 1.43% Building Grounds Maintenance 289 3.86% Business/Financial Operations 395 5.29% Community/Social Services 79 1.06% Computer/Mathematical 198 2.64% Construction/Extraction 260 3.48% Education/Training/Library 452 6.05% Farming/Fishing/Forestry 33 0.44% Food Prep/Serving 552 7.39% Healthcare Practitioner/Technician 291 3.90% Healthcare Support 349 4.66% Maintenance Repair 127 1.70% Legal 46 0.62% Life/Physical/Social Science 48 0.64% Management 671 8.98% Office/Admin. Support 962 12.88% Production 433 5.80% Protective Service 55 0.74% Sales/Related 806 10.79% Personal Care/Service 264 3.54% Transportation/Moving 848 11.36% 2022 Est. Pop 16+ by Occupation Classification 7,472 Blue Collar 1,669 22.34% White Collar 4,261 57.03% Service & Farm 1,542 20.64% 2022 Est. Workers Age 16+ by Transp. To Work 7,373 Drove Alone 5,554 75.33% Car Pooled 723 9.81% Public Transportation 374 5.08% Walked 236 3.20% Bicycle 32 0.43% Other Means 66 0.89% Worked at Home 388 5.26% 2022 Est. Workers Age 16+ by Travel Time to Work* Less than 15 minutes 2,801 15 to 29 Minutes 2,207 30 to 44 Minutes 1,241 45 to 59 Minutes 439 60 or more Minutes 275 18847
Pop-Facts: Demographic Snapshot (Part 2) 18847 SW 84th Ave, Tualatin, OR 97062 0 - 1 mi
SW 84th Ave, Tualatin, OR 97062 Sitewise Online Pop-Facts: Demographic Snapshot (Part 2)
2022 Est. Avg. Travel Time to Work in Minutes* 23.24 2022 Est. Occupied Housing Units by Tenure 5,674 Owner-Occupied 1,870 32.96% Renter-Occupied 3,804 67.04% 2022 Occupied Housing Units: Avg. Length of Residence Owner-Occupied 12 Renter-Occupied 6 18847 SW 84th Ave, Tualatin, OR 97062 Sitewise Online Pop-Facts: Demographic Snapshot (Part 2) Pop-Facts: Demographic Snapshot (Part 2) 18847 SW 84th Ave, Tualatin, OR 97062 0 - 1 mi
2022 Est. Owner Occupied Housing Units by Value 1,870 Value Less than $20,000 4 0.20% Value $20,000 to $39,999 14 0.75% Value $40,000 to $59,999 17 0.93% Value $60,000 to $79,999 17 0.93% Value $80,000 to $99,999 22 1.15% Value $100,000 to $149,999 24 1.29% Value $150,000 to $199,999 78 4.20% Value $200,000 to $299,999 174 9.31% Value $300,000 to $399,999 287 15.35% Value $400,000 to $499,999 383 20.49% Value $500,000 to $749,999 569 30.40% Value $750,000 to $999,999 224 11.97% Value $1,000,000 to $1,499,999 53 2.83% Value $1,500,000 to $1,999,999 4 0.22% Value $2,000,000 or more 0 0.00% 2022 Est. Median All Owner-Occupied Housing Unit Value $ 477,651 2022 Est. Housing Units by Units in Structure 5,973 1 Unit Attached 663 11.10% 1 Unit Detached 1,533 25.67% 2 Units 130 2.17% 3 or 4 Units 448 7.49% 5 to 19 Units 1,649 27.60% 20 to 49 Units 235 3.94% 50 or More Units 1,288 21.56% Mobile Home or Trailer 28 0.46% Boat, RV, Van, etc. 0 0.00% Dominant structure type 5 to 19 units 2022 Est. Housing Units by Year Structure Built 5,973 Housing Units Built 2014 or Later 835 13.99% Housing Units Built 2010 to 2013 55 0.91% Housing Units Built 2000 to 2009 480 8.03% Housing Units Built 1990 to 1999 1,619 27.11% Housing Units Built 1980 to 1989 1,112 18.61% Housing Units Built 1970 to 1979 1,586 26.56% Housing Units Built 1960 to 1969 187 3.13% Housing Units Built 1950 to 1959 31 0.52% Housing Units Built 1940 to 1949 26 0.43% Housing Units Built 1939 or Earlier 42 0.70% 2022 Est. Median Year Structure Built** 1990 Dominant Year Structure Built 1990 to 1999 18847 SW 84th Ave, Tualatin, OR 97062
Online Pop-Facts: Demographic Snapshot (Part 2) Pop-Facts: Demographic Snapshot (Part 2) 18847 SW 84th Ave, Tualatin, OR 97062 0 - 1 mi
Sitewise
18847 SW 84th Ave, Tualatin, OR 97062
Sitewise Online
Pop-Facts: Demographic Snapshot (Part 2)
Pop-Facts: Demographic Snapshot (Part 2)
Copyright © Claritas, LLC 2022. All rights reserved.
* This row intentionally left blank. No Total Category.
**1939 will appear when at least half of the Housing Units in this reports area were built in 1939 or earlier.
18847 SW 84th Ave, Tualatin, OR 97062 0 - 1 mi
18847 SW 84th Ave, Tualatin, OR 97062 Sitewise Online Pop-Facts: Census Demographic Overview (Part 1) Pop-Facts: Census Demographic Overview (Part 1) 18847 SW 84th Ave, Tualatin, OR 97062 0 - 1 mi Population 2027 Projection 14,042 2022 Estimate 13,432 2010 Census 11,627 2000 Census 11,048 Growth 2022-2027 4.54% Growth 2010-2022 15.53% Growth 2000-2010 5.24% 2010 Population by Single-Classification Race 11,627 White Alone 8,488 73.00% Black or African American Alone 182 1.56% American Indian and Alaska Native Alone 110 0.94% Asian Alone 297 2.55% Native Hawaiian and Other Pacific Islander Alone 184 1.58% Some Other Race Alone 1,870 16.08% Two or More Races 497 4.27% 2010 Population By Ethnicity 11,627 Not Hispanic or Latino 8,455 72.72% Hispanic or Latino 3,171 27.28% 2010 Hispanic or Latino by Single-Classification Race 3,171 White Alone 1,062 33.47% Black or African American Alone 14 0.44% American Indian and Alaska Native Alone 29 0.91% Asian Alone 1 0.03% Native Hawaiian and Other Pacific Islander Alone 11 0.34% Some Other Race Alone 1,852 58.40% Two or More Races 203 6.41% 2010 Population by Sex 11,627 Male 5,756 49.51% Female 5,870 50.49% Male/Female Ratio 0.98
Pop-Facts:
2010 Population by Age 11,627 Age 0 to 4 956 8.22% Age 5 to 9 825 7.10% Age 10 to 14 792 6.81% Age 15 to 17 398 3.42% Age 18 to 20 431 3.71% Age 21 to 24 833 7.16% Age 25 to 34 2,428 20.88% Age 35 to 44 1,721 14.80% Age 45 to 54 1,417 12.18% Age 55 to 64 1,096 9.43% Age 65 to 74 480 4.13% Age 75 to 84 187 1.61% Age 85 and over 64 0.55% Age 16 and over 8,919 76.71% Age 18 and over 8,656 74.45% Age 21 and over 8,225 70.74% Age 65 and over 730 6.28% 2010 Median Age 31.50 18847 SW 84th Ave, Tualatin, OR 97062 Sitewise Online
Census Demographic Overview (Part 1)
Census Demographic Overview (Part 1) 18847 SW 84th Ave, Tualatin, OR 97062 0 - 1 mi
Pop-Facts:
2010 Male Population by Age 5,756 Age 0 to 4 494 8.59% Age 5 to 9 434 7.54% Age 10 to 14 396 6.89% Age 15 to 17 196 3.40% Age 18 to 20 236 4.10% Age 21 to 24 383 6.66% Age 25 to 34 1,205 20.93% Age 35 to 44 895 15.55% Age 45 to 54 702 12.19% Age 55 to 64 504 8.76% Age 65 to 74 217 3.78% Age 75 to 84 74 1.29% Age 85 and over 19 0.33% 2010 Median Age, Male 31.13 2010 Female Population by Age 5,870 Age 0 to 4 462 7.86% Age 5 to 9 391 6.66% Age 10 to 14 396 6.74% Age 15 to 17 202 3.44% Age 18 to 20 195 3.33% Age 21 to 24 449 7.66% Age 25 to 34 1,224 20.84% Age 35 to 44 826 14.06% Age 45 to 54 715 12.18% Age 55 to 64 592 10.08% Age 65 to 74 262 4.47% Age 75 to 84 113 1.92% Age 85 and over 44 0.76% 2010 Median Age, Female 31.87 Copyright © Claritas,
18847 SW 84th Ave, Tualatin, OR 97062 Sitewise Online Pop-Facts: Census Demographic Overview (Part 1) Pop-Facts: Census Demographic Overview (Part 1) 18847 SW 84th Ave, Tualatin, OR 97062 0 - 1 mi
LLC 2022. All rights reserved.
18847 SW 84th Ave, Tualatin, OR 97062 Sitewise Online Pop-Facts: Census Demographic Overview (Part 2) Pop-Facts: Census Demographic Overview (Part 2) 18847 SW 84th Ave, Tualatin, OR 97062 0 - 1 mi Households 2027 Projection 5,937 2022 Estimate 5,674 2010 Census 4,809 2000 Census 4,497 Growth 2022-2027 4.64% Growth 2010-2022 17.98% Growth 2000-2010 6.95% 2010 Households by Household Type 4,809 Family Households 2,758 57.34% Non-family Households 2,052 42.66% 2010 Group Quarters Population 16 2010 Hispanic or Latino Households 825 17.15% 2010 Households by Household Size 4,809 1-person 1,531 31.84% 2-person 1,516 31.53% 3-person 748 15.54% 4-person 568 11.81% 5-person 269 5.59% 6-person 112 2.33% 7-or-more-person 65 1.36%
2010 Households by Type and Presence of Children 4,809 Married-Couple Family, own children 873 18.14% Male Householder, own children 161 3.35% Female Householder, own children 449 9.33% Married-Couple Family, no own children 931 19.36% Male Householder, no own children 112 2.32% Female Householder, no own children 233 4.84% Non-family Households 2,052 42.66% 2010 Households by Presence of People Under Age 18 4,809 HH with 1 or More People Under Age 18: 1,609 33.46% Households with No People Under Age 18: 3,200 66.54% HH with 1 or More People Under Age 18: 1,609 Married-Couple Family 910 56.53% Other Family, Male Householder 179 11.15% Other Family, Female Householder 499 31.01% Nonfamily, Male Householder 14 0.84% Nonfamily, Female Householder 8 0.48% Households with No People Under Age 18: 3,200 Married-Couple Family 894 27.93% Other Family, Male Householder 93 2.91% Other Family, Female Householder 183 5.71% Nonfamily, Male Householder 1,008 31.51% Nonfamily, Female Householder 1,022 31.94% 2010 Occupied Housing Units by Tenure 4,809 Owner-Occupied 1,666 34.63% Renter-Occupied 3,144 65.37% Copyright © Claritas, LLC 2022. All rights reserved. 18847 SW 84th Ave, Tualatin, OR 97062 Sitewise Online Pop-Facts: Census Demographic Overview (Part 2) Pop-Facts: Census Demographic Overview (Part 2) 18847 SW 84th Ave, Tualatin, OR 97062 0 - 1 mi
18847 SW 84th Ave, Tualatin, OR 97062 Sitewise Online Retail Market Power Opportunity Gap Report By Retail Store Types Retail Market Power Opportunity Gap Report By Retail Store Types 18847 SW 84th Ave, Tualatin, OR 97062 0 - 1 mi 2022 Demand 2022 Supply Opportunity Gap/Surplus Total retail trade including food and drink (NAICS 44, 45 and 722) $ 226,474,633 $ 660,169,241 - $ 433,694,621 Total retail trade (NAICS 44 and 45) $ 201,163,029 $ 589,393,155 - $ 388,230,121 Motor vehicle and parts dealers (NAICS 441) $ 45,785,889 $ 51,605,912 - $ 5,820,022 Automobile dealers (NAICS 4411) $ 38,723,931 $ 26,389,880 $ 12,334,052 New car dealers (NAICS 44111) $ 34,413,834 $ 22,656,318 $ 11,757,517 Used car dealers (NAICS 44112) $ 4,310,097 $ 3,733,562 $ 576,535 Other motor vehicle dealers (NAICS 4412) $ 3,896,955 $ 12,291,411 - $ 8,394,456 Recreational vehicle dealers (NAICS 44121) $ 1,502,004 $ 7,896,447 - $ 6,394,443 Motorcycle, boat, and other motor vehicle dealers (NAICS 44122) $ 2,394,951 $ 4,394,964 - $ 2,000,012 Boat dealers (NAICS 441222) $ 896,772 $ 0 $ 896,772 Motorcycle, ATV, and all other motor vehicle dealers (NAICS 441228) $ 1,498,179 $ 4,394,964 - $ 2,896,785 Automotive parts, accessories, and tire stores (NAICS 4413) $ 3,165,003 $ 12,924,622 - $ 9,759,619 Automotive parts and accessories stores (NAICS 44131) $ 2,000,581 $ 6,750,165 - $ 4,749,584 Tire dealers (NAICS 44132) $ 1,164,422 $ 6,174,457 - $ 5,010,035 Furniture and home furnishings stores (NAICS 442) $ 4,011,902 $ 28,356,922 - $ 24,345,020 Furniture stores (NAICS 4421) $ 2,175,427 $ 9,217,867 - $ 7,042,440 Home furnishings stores (NAICS 4422) $ 1,836,476 $ 19,139,055 - $ 17,302,580 Floor covering stores (NAICS 44221) $ 881,415 $ 6,944,536 - $ 6,063,121 Other home furnishings stores (NAICS 44229) $ 955,061 $ 12,194,520 - $ 11,239,458 Window treatment stores (NAICS 442291) $ 48,606 $ 0 $ 48,606 All other home furnishings stores (NAICS 442299) $ 906,455 $ 12,194,520 - $ 11,288,064 Electronics and appliance stores (NAICS 443) $ 2,640,044 $ 19,017,042 - $ 16,376,997 Household appliance stores (NAICS 443141) $ 630,061 $ 2,968,353 - $ 2,338,293 Electronics stores (NAICS 443142) $ 2,009,983 $ 16,048,688 - $ 14,038,705 Building material and garden equipment and supplies dealers (NAICS 444) $ 14,006,442 $ 56,900,044 - $ 42,893,602 Building material and supplies dealers (NAICS 4441) $ 12,058,042 $ 55,543,027 - $ 43,484,986 Home centers (NAICS 44411) $ 6,689,905 $ 19,900,993 - $ 13,211,088 Paint and wallpaper stores (NAICS 44412) $ 409,921 $ 1,378,359 - $ 968,437 Hardware stores (NAICS 44413) $ 1,072,204 $ 4,255,114 - $ 3,182,911 Other building material dealers (NAICS 44419) $ 3,886,012 $ 30,008,561 - $ 26,122,549 Lawn and garden equipment and supplies stores (NAICS 4442) $ 1,948,400 $ 1,357,017 $ 591,383 Outdoor power equipment stores (NAICS 44421) $ 394,060 $ 0 $ 394,060 Nursery, garden center, and farm supply stores (NAICS 44422) $ 1,554,340 $ 1,357,017 $ 197,323 Food and beverage stores (NAICS 445) $ 30,301,317 $ 71,555,816 - $ 41,254,499 Grocery stores (NAICS 4451) $ 26,952,543 $ 58,720,009 - $ 31,767,467 Supermarkets and other grocery (except convenience) stores (NAICS 44511) $ 25,828,693 $ 52,998,553 - $ 27,169,860 Convenience stores (NAICS 44512) $ 1,123,850 $ 5,721,456 - $ 4,597,607 Specialty food stores (NAICS 4452) $ 787,231 $ 5,262,501 - $ 4,475,270
Meat markets (NAICS 44521) $ 238,232 $ 14,597 $ 223,635 Fish and seafood markets (NAICS 44522) $ 93,772 $ 9,746 $ 84,026 Fruit and vegetable markets (NAICS 44523) $ 162,960 $ 1,181,785 - $ 1,018,825 Other specialty food stores (NAICS 44529) $ 292,267 $ 4,056,373 - $ 3,764,106 Baked goods and confectionery and nut stores (NAICS 445291 + 445292) $ 155,087 $ 760,597 - $ 605,510 All other specialty food stores (NAICS 445299) $ 137,181 $ 3,295,776 - $ 3,158,596 Beer, wine, and liquor stores (NAICS 4453) $ 2,561,543 $ 7,573,306 - $ 5,011,763 Health and personal care stores (NAICS 446) $ 11,533,844 $ 30,665,843 - $ 19,132,000 Pharmacies and drug stores (NAICS 44611) $ 10,035,261 $ 17,811,602 - $ 7,776,342 Cosmetics, beauty supplies, and perfume stores (NAICS 44612) $ 667,493 $ 9,040,375 - $ 8,372,882 Optical goods stores (NAICS 44613) $ 298,464 $ 1,728,811 - $ 1,430,347 Other health and personal care stores (NAICS 44619) $ 532,627 $ 2,085,055 - $ 1,552,429 Food (health) supplement stores (NAICS 446191) $ 190,004 $ 411,720 - $ 221,716 All other health and personal care stores (NAICS 446199) $ 342,622 $ 1,673,335 - $ 1,330,713 Gasoline stations (NAICS 447) $ 16,864,616 $ 32,108,289 - $ 15,243,673 Clothing and clothing accessories stores (NAICS 448) $ 7,991,884 $ 47,775,002 - $ 39,783,119 Clothing stores (NAICS 4481) $ 5,218,325 $ 34,795,310 - $ 29,576,985 Men's clothing stores (NAICS 44811) $ 243,372 $ 707,425 - $ 464,053 Women's clothing stores (NAICS 44812) $ 920,079 $ 3,949,684 - $ 3,029,605 Children's and infants' clothing stores (NAICS 44813) $ 179,256 $ 1,332,053 - $ 1,152,797 Family clothing stores (NAICS 44814) $ 3,139,522 $ 26,861,957 - $ 23,722,435 Clothing accessories stores (NAICS 44815) $ 257,747 $ 599,738 - $ 341,990 Other clothing stores (NAICS 44819) $ 478,347 $ 1,344,453 - $ 866,105 Shoe stores (NAICS 4482) $ 1,159,515 $ 7,904,256 - $ 6,744,742 Jewelry, luggage, and leather goods stores (NAICS 4483) $ 1,614,045 $ 5,075,437 - $ 3,461,392 Jewelry stores (NAICS 44831) $ 1,037,692 $ 1,719,850 - $ 682,158 Luggage and leather goods stores (NAICS 44832) $ 576,353 $ 3,355,587 - $ 2,779,234 Sporting goods, hobby, musical instrument, and book stores (NAICS 451) $ 3,118,314 $ 15,220,286 - $ 12,101,972 Sporting goods, hobby, and musical instrument stores (NAICS 4511) $ 2,810,598 $ 13,402,375 - $ 10,591,777 Sporting goods stores (NAICS 45111) $ 2,054,118 $ 10,595,437 - $ 8,541,319 Hobby, toy, and game stores (NAICS 45112) $ 548,450 $ 2,241,933 - $ 1,693,482 Sewing, needlework, and piece goods stores (NAICS 45113) $ 90,018 $ 186,782 - $ 96,764 Musical instrument and supplies stores (NAICS 45114) $ 118,012 $ 378,224 - $ 260,212 Book stores and news dealers (NAICS 4512) $ 307,716 $ 1,817,911 - $ 1,510,195 Book stores (NAICS 451211) $ 285,721 $ 1,817,911 - $ 1,532,190 News dealers and newsstands (NAICS 451212) $ 21,995 $ 0 $ 21,995 General merchandise stores (NAICS 452) $ 25,861,609 $ 138,336,254 - $ 112,474,645 Department stores (NAICS 4522) $ 3,185,829 $ 0 $ 3,185,829 Other general merchandise stores (NAICS 4523) $ 22,675,780 $ 138,336,254 - $ 115,660,477 Warehouse clubs and supercenters (NAICS 452311) $ 20,517,178 $ 137,189,216 - $ 116,672,038 All other general merchandise stores (NAICS 452319) $ 2,158,602 $ 1,147,038 $ 1,011,564 18847 SW 84th Ave, Tualatin, OR 97062 Sitewise Online Retail Market Power Opportunity Gap Report By Retail Store Types Retail Market Power Opportunity Gap Report By Retail Store Types 18847 SW 84th Ave, Tualatin, OR 97062 0 - 1 mi 2022 Demand 2022 Supply Opportunity Gap/Surplus
Ave, Tualatin, OR 97062
* GAFO (General merchandise, Apparel, Furniture and Other) represents sales at stores that sell merchandise normally sold in department stores. This category is not included in Total Retail Sales Including Eating and Drinking Places.
Miscellaneous store retailers (NAICS 453) $ 4,409,199 $ 15,350,319 - $ 10,941,120 Florists (NAICS 4531) $ 194,772 $ 454,482 - $ 259,710 Office supplies, stationery, and gift stores (NAICS 4532) $ 953,801 $ 4,545,544 - $ 3,591,743 Office supplies and stationery stores (NAICS 45321) $ 400,315 $ 2,083,198 - $ 1,682,883 Gift, novelty, and souvenir stores (NAICS 45322) $ 553,485 $ 2,462,346 - $ 1,908,860 Used merchandise stores (NAICS 4533) $ 631,210 $ 2,143,365 - $ 1,512,155 Other miscellaneous store retailers (NAICS 4539) $ 2,629,417 $ 8,206,928 - $ 5,577,511 Pet and pet supplies stores (NAICS 45391) $ 791,844 $ 5,961,306 - $ 5,169,462 Art dealers (NAICS 45392) $ 410,540 $ 14,839 $ 395,701 Manufactured (mobile) home dealers (NAICS 45393) $ 258,133 $ 3,125 $ 255,008 All other miscellaneous store retailers (NAICS 45399) $ 1,168,900 $ 2,227,658 - $ 1,058,758 Tobacco stores (NAICS 453991) $ 371,722 $ 1,152,301 - $ 780,579 All other miscellaneous store retailers (except tobacco stores) (NAICS 453998) $ 797,178 $ 1,075,358 - $ 278,179 Non-store retailers (NAICS 454) $ 34,637,968 $ 82,501,424 - $ 47,863,455 Electronic shopping and mail-order houses (NAICS 4541) $ 32,789,940 $ 79,827,790 - $ 47,037,850 Vending machine operators (NAICS 4542) $ 252,396 $ 299,433 - $ 47,037 Direct selling establishments (NAICS 4543) $ 1,595,632 $ 2,374,201 - $ 778,569 Fuel dealers (NAICS 45431) $ 783,786 $ 28,022 $ 755,764 Other direct selling establishments (NAICS 45439) $ 811,846 $ 2,346,180 - $ 1,534,333 Food services and drinking places (NAICS 722) $ 25,311,604 $ 70,776,086 - $ 45,464,483 Special food services (NAICS 7223) $ 2,022,500 $ 2,034,363 - $ 11,863 Food service contractors (NAICS 72231) $ 1,599,892 $ 1,192,956 $ 406,935 Caterers (NAICS 72232) $ 385,065 $ 708,164 - $ 323,100 Mobile food services (NAICS 72233) $ 37,544 $ 133,243 - $ 95,698 Drinking places (alcoholic beverages) (NAICS 7224) $ 825,933 $ 2,847,733 - $ 2,021,801 Restaurants and other eating places (NAICS 7225) $ 22,463,171 $ 65,893,990 - $ 43,430,820 Full-service restaurants (NAICS 722511) $ 11,249,310 $ 35,743,963 - $ 24,494,653 Limited-service restaurants (NAICS 722513) $ 9,515,822 $ 17,100,955 - $ 7,585,133 Cafeterias, grill buffets, and buffets (NAICS 722514) $ 242,568 $ 1,523,160 - $ 1,280,593 Snack and nonalcoholic beverage bars (NAICS 722515) $ 1,455,472 $ 11,525,911 - $ 10,070,440 GAFO* $ 43,624,707 $ 248,710,051 - $ 205,085,344 General Merchandise Stores-452 $ 25,861,609 $ 138,336,254 - $ 112,474,645 Clothing & Clothing Accessories Stores-448 $ 7,991,884 $ 47,775,002 - $ 39,783,119 Furniture & Home Furnishings Stores-442 $ 4,011,902 $ 28,356,922 - $ 24,345,020 Electronics & Appliance Stores-443 $ 2,640,044 $ 19,017,042 - $ 16,376,997 Sporting Goods, Hobby, Book, Music Stores-451 $ 3,118,314 $ 15,220,286 - $ 12,101,972 Office Supplies, Stationery, Gift Stores-4532 $ 953,801 $ 4,545,544 - $ 3,591,743
18847 SW 84th
Sitewise Online Retail Market Power Opportunity Gap Report By Retail Store Types Retail Market Power Opportunity Gap Report By Retail Store Types 18847 SW 84th Ave, Tualatin, OR 97062 0 - 1 mi 2022 Demand 2022 Supply Opportunity Gap/Surplus
18847 SW 84th Ave, Tualatin, OR 97062
Sitewise Online
Retail Market Power Opportunity Gap Report By Retail Store Types
Retail Market Power Opportunity Gap Report By
Retail Market Power data is derived from two major sources of information. The demand data is derived from the Consumer Expenditure Survey (CE Survey or CEX), which is fielded by the U.S. Bureau of Labor Statistics (BLS). The supply data is derived from the Census of Retail Trade (CRT), which is made available by the U.S. Census. Additional data sources are incorporated to create both supply and demand estimates. The difference between demand and supply represents the opportunity gap or surplus available for each merchandise line in the specified reporting geography. When this difference is positive (demand is greater than the supply), there is an opportunity gap for that merchandise line; when the difference is negative (supply is greater than demand), there is a surplus.
Copyright © 2022 Environics Analytics. All rights reserved.
18847 SW 84th Ave, Tualatin, OR 97062 0 - 1 mi 2022 Demand 2022 Supply Opportunity Gap/Surplus
Retail Store Types


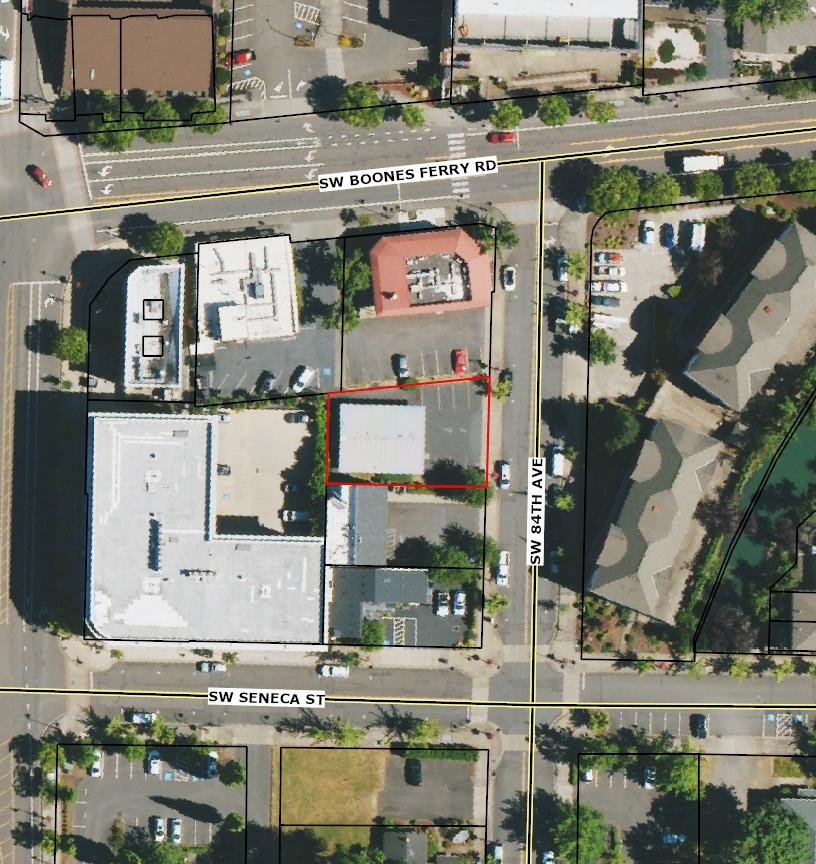 AerialMap