ZONING
Detailed Zoning Information
R-2 (Multi-Family Dwelling District)
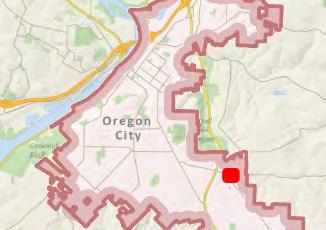
Zoning Map
Community Jurisdiction
The information contained is provided by WFG’s Customer Service Department to our customers, and while deemed reliable, is not guaranteed.

DETAILS
Oregon City Municipal Code Chapter 17.18 – R-2 Multi-Family Dwelling District
17.18.010 Designated.
The purpose of this residential district is designed for multi-family residential units on lot sizes of approximately two thousand square feet per dwelling. (Prior code §11-3-7(part))
17.18.020 Permitted Uses.
Permitted uses in the R-2 district are:
A. Residential units, multi-family;
B. Parks, playgrounds, playfields and community or neighborhood centers;
C. Home occupations;
D. Temporary real estate offices in model homes located on and limited to sales of real estate on a single piece of platted property upon which new residential buildings are being constructed;
E. Accessory buildings;
F. Family day care provider, subject to the provisions of Section 17.54.050. (Prior code §11-37(A)); and
G. Management and associated offices and building necessary for the operations of a multifamily residential development.
H. Residential care facility per ORS 443.400;
I. Transportation facilities
17.18.030 Conditional Uses.
The following conditional uses are permitted in this district when authorized and in accordance with the standards contained in Chapter 17.56:
A. Golf courses, except miniature golf courses, driving ranges or similar commercial enterprises;
B. Bed and breakfast inns / boarding houses;
C. Cemeteries, crematories, mausoleums and columbariums;
D. Child care centers and nursery schools;
E Emergency service facilities (police and fire), excluding correctional facilities;
F. Private and/or public educational or training facilities
G. Public utilities, including sub-stations (such as buildings, plants and other structures);
H. Religious institutions;
I. Assisted living facilities; nursing homes and group homes for over 15 patients
J. Live/work units
17.18.035 Pre-Existing Industrial Use
Tax Lot 11200, located on Clackamas County Map #32E16BA has a special provision to permit the current industrial use and the existing incidental sale of the products created and associated with the current industrial use on the site. This property may only maintain and expand the
Oregon City Municipal Code – Effective August 16, 2013 1
current use, which are the manufacturing of aluminum boats and the fabrication of radio and satellite equipment, internet and data systems and antennas.
17.18.040 Dimensional Standards.
Dimensional standards in the R-2 district are:
A. Minimum lot area: 2,000 square feet per unit.
B. Minimum lot width, fifty feet;
C. Minimum lot depth, seventy-five feet;
D. Maximum building height, four stories, not to exceed fifty-five feet;
E. Minimum required setbacks:
1.Front yard, five feet minimum setback (May be reduced to zero through Site Plan and Design Review)
2. Side yard, five feet minimum setback,
3. Corner side yard, ten feet minimum setback,
4. Rear yard, ten feet minimum setback,
5. Buffer Area. If a multi-family residential unit in this district abuts R-10, R-8, or R-6 use, there shall be required a landscaped yard of ten feet on the side abutting the adjacent zone in order to provide a buffer area and landscaping thereof shall be subject to site plan review. The Community Development Director may waive any of the foregoing requirements if it is found that the requirement is unnecessary on a case-by-case basis.
6. Attached and detached garages, twenty feet minimum setback from the public right-ofway where access is taken, except for alleys. Detached gages on an alley shall be setback a minimum of five feet.
F. Design criteria: See Site Plan and Design Review requirements in Section 17.62 and 17.52
Oregon City Municipal Code – Effective August 16, 2013 2

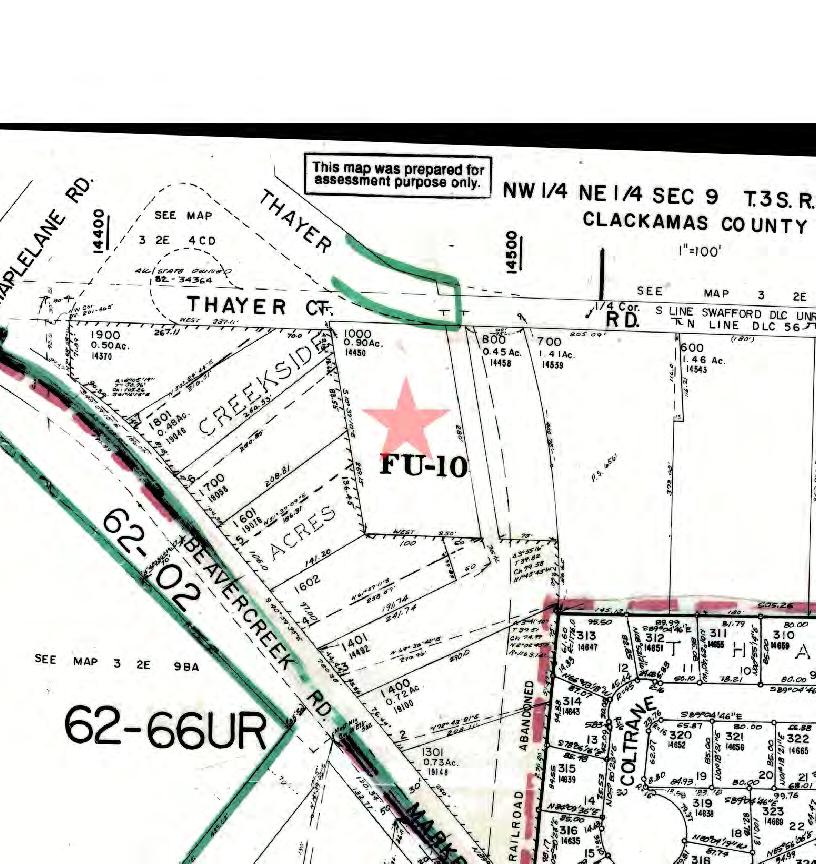
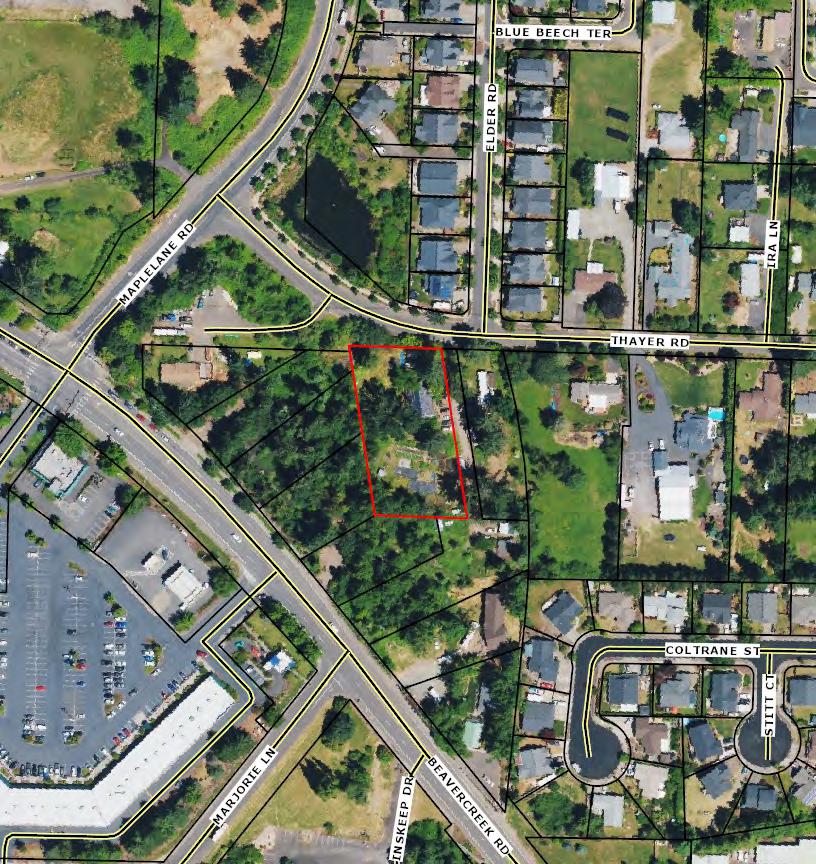
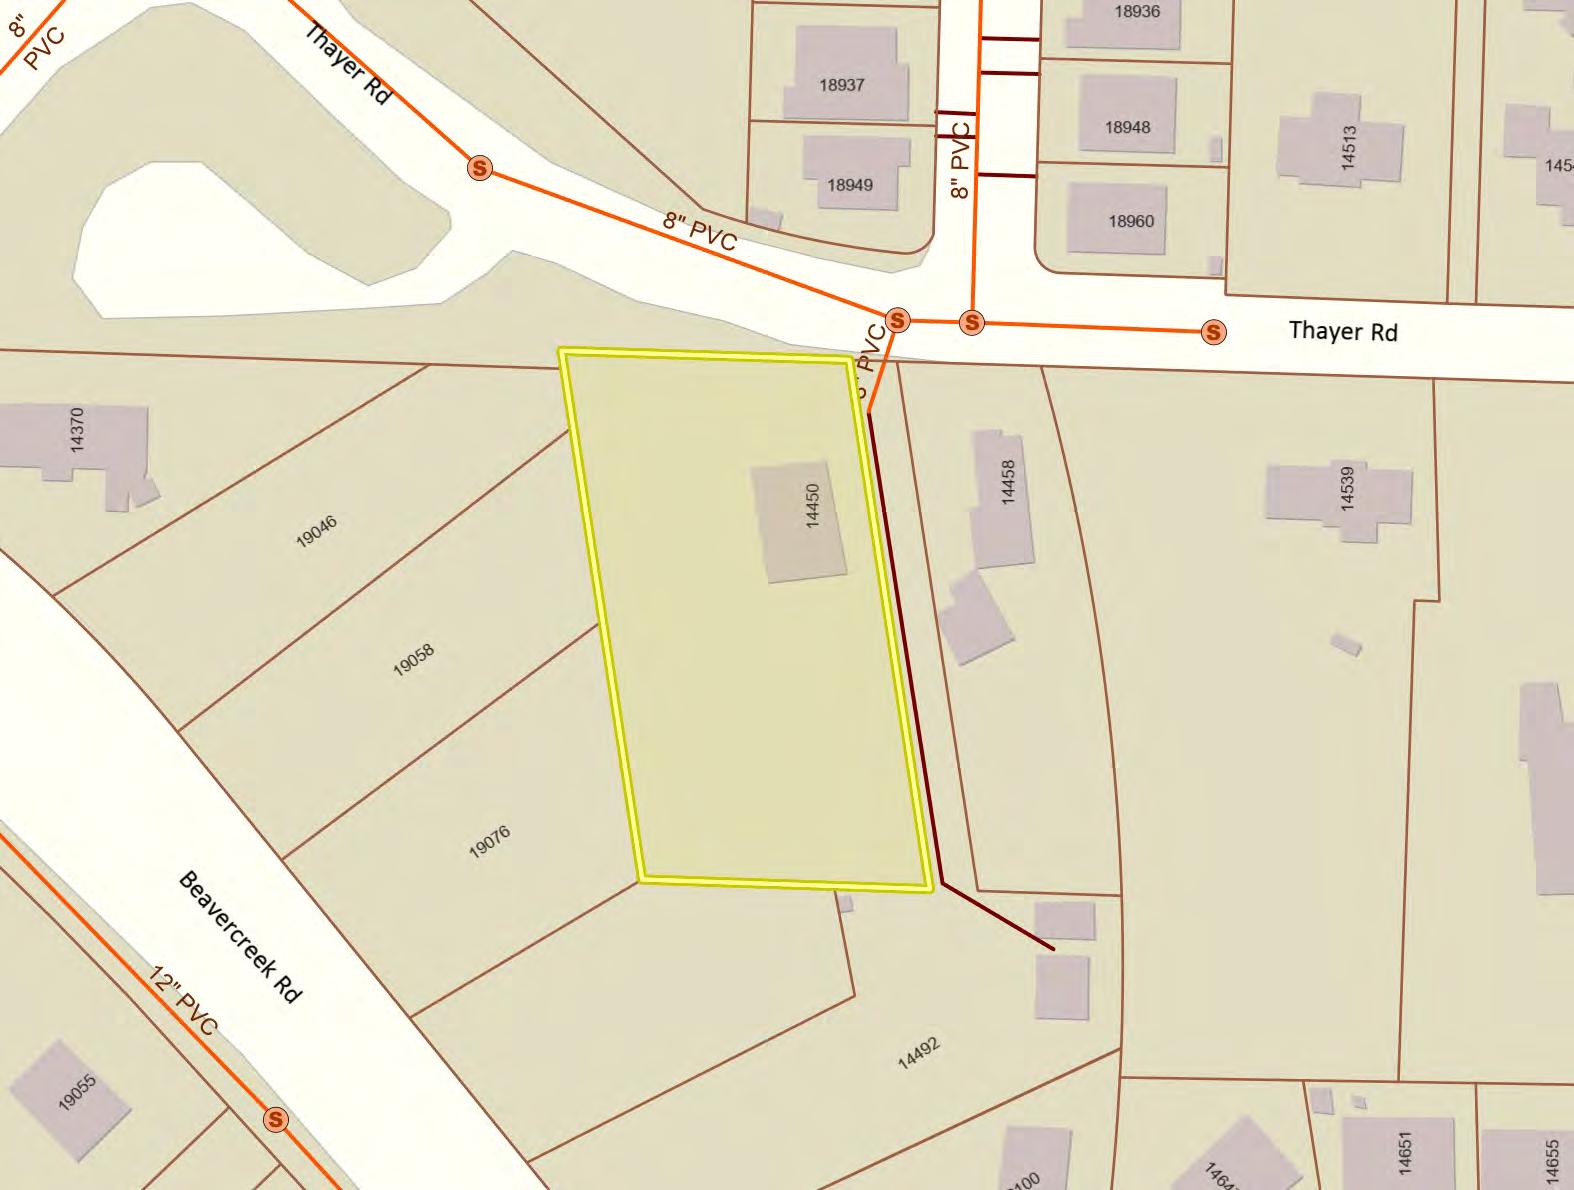
FU10 FU10 RRFF5 RRFF5 C CI GI I MUC2 MUC2 R10 R2 R2 R2 R2 R3.5 R6 R6 R6 R8 NUTMEG LN THAYER RD SUGARPINE ST TANOAK WAY S THAYER RD MAPLE L A N E DR MARJORIE LN BLUE B LOSSOM W AY CO LTRA NE ST BEAVERCREEKRD W ALNUTGROVE W AY STITT CT HWY 213 L O D G E P O L E W A Y SOURWOOD ST BLUE BEECH TER WYNTON DR SHAGBARK WAY SASSAFRAS WAY R O L L I N S S T E L D E R R D YELLOWWOOD RD EFFINGER WAY SMAPLELANE CT MILES ST A U T U M N C R E S T P L RIVER BIRCH PL BEAVERCREEKRD CLAIRMONT DR IRA LN CATALPA WAY HWY 213 SB HWY 213 NB MAPLELANECT INSKEEP DR This map is a copy of public record and is provided solely for information purposes. WFG National Title assumes no liability for variations, if any, in dimensions, area or location of the premises or the location of improvements. Customer Service Department 12909 SW 68th Parkway, Suite 350 Portland, OR 97223 (503) 603-1700 cs@wfgnationaltitle.com 0 190 380 95 Feet
Subject Property Tax Lots Commercial Industrial Multi Family Mixed Use Residential PF Rural Single Family ²
Zoning
Objectid: 98482
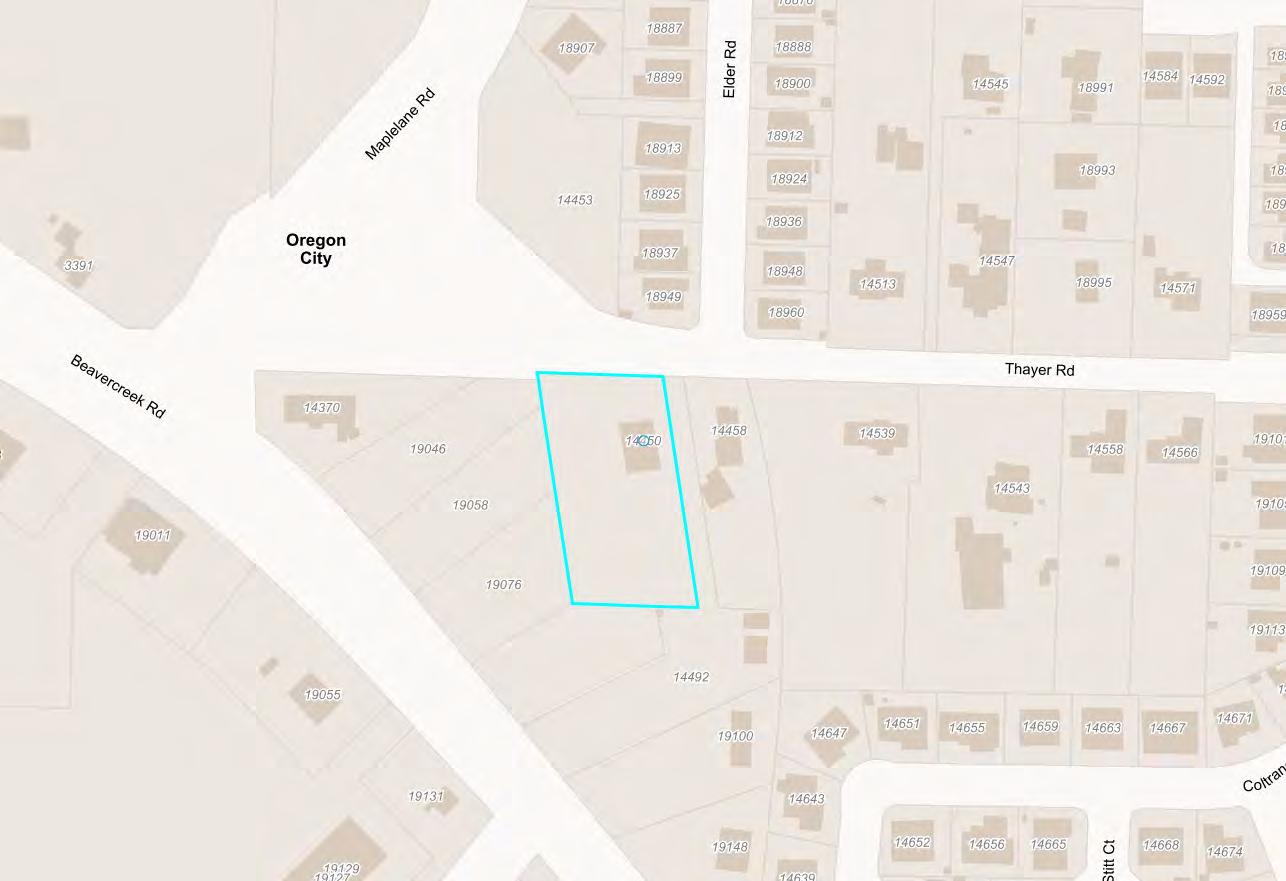
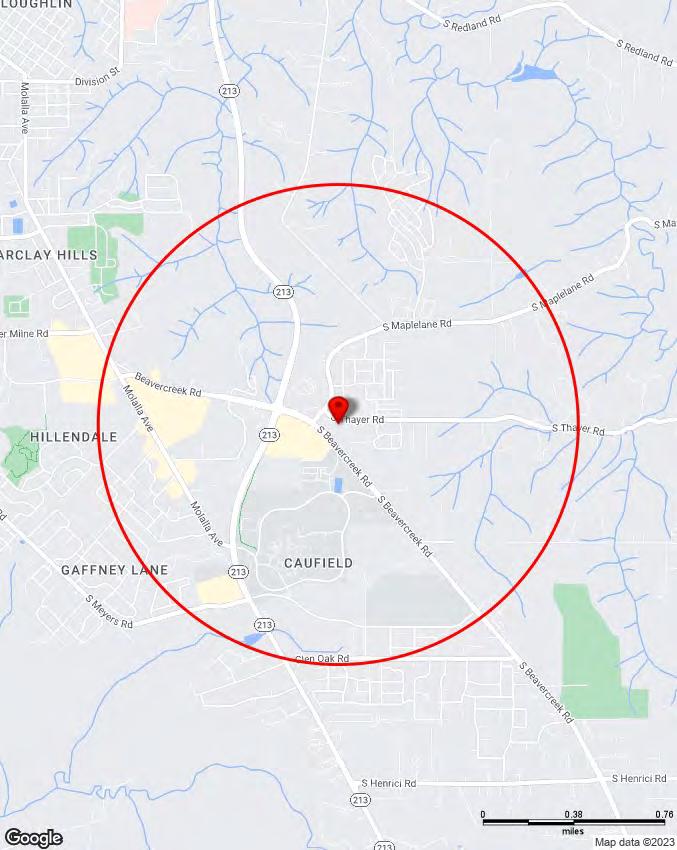
PrimaryAddress: 14450 SThayer Rd, Oregon City, 97045
Jurisdiction: Oregon City (https://www.orcity.org)
Map Number: 32E09AB
Taxlot Number: 32E09AB01000
Parcel Number: 00869199
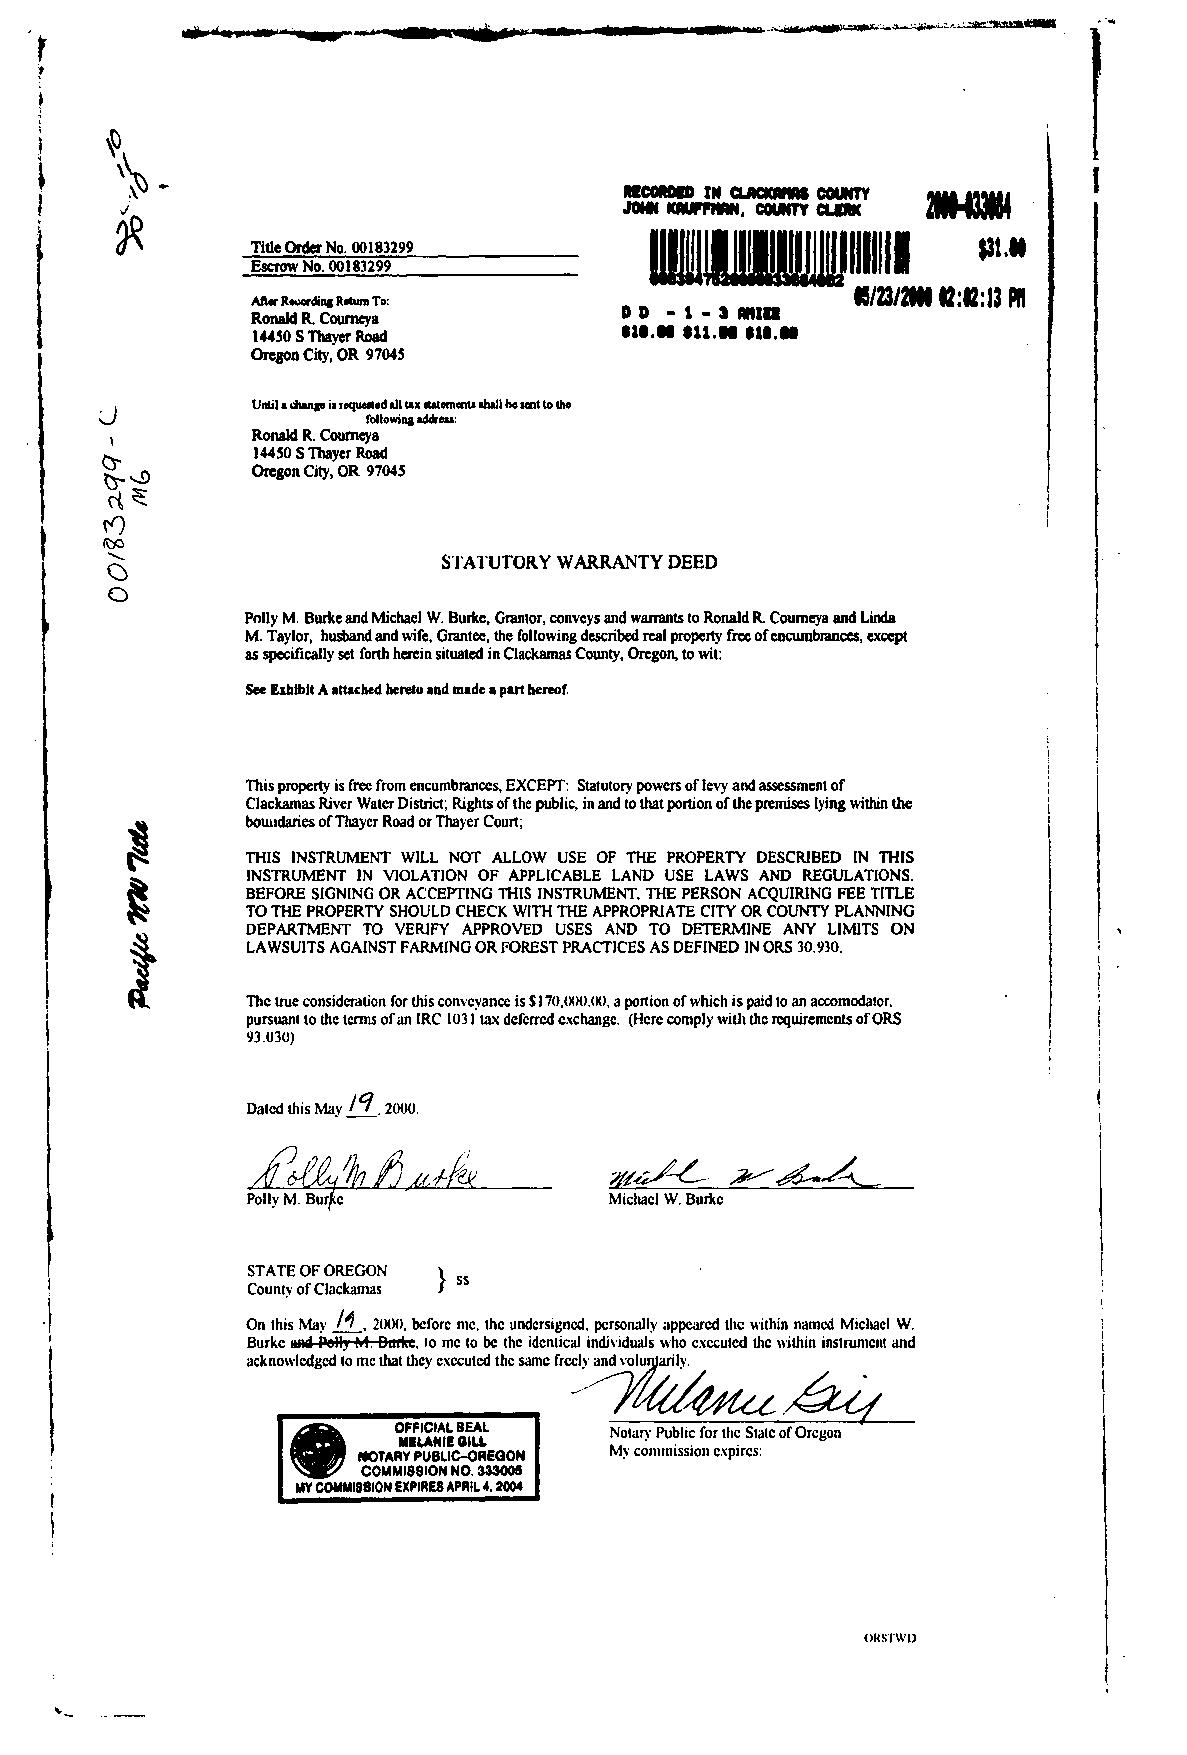
Document Number: 2000-033084
Census Tract: 023001
Landclass: 101
Assessment
EstimatedAcres: 0.94
CurrentYearAssessed Value: $178,355.00
Market Building Value: $98,680.00
Market Land Value: $345,277.00
Market Total Value: $443,957.00
Sale Price: $170,000.00
Doc Date: 05/23/2000
Doc Type: M
Taxcode: 062064
Schools
Elementary School
Redland Elementary (https://www.redlandschool.org/)
Oregon City
18131 S Redland Rd, Oregon City, 97045 503-785-8500
Middle School
Tumwata Middle (https://www.tumwatamiddleschool.org/)
Oregon City
14133 S Donovan Rd, Oregon City, 97045 503-785-8300
High School
Oregon City High (https://www.ochspioneers.org/)
Oregon City
19761 S Beavercreek Rd, Oregon City, 97045 503-785-8900
Public Safety
Nearest Fire Station
Hilltop Station #16
19340 MolallaAve, Oregon City 97045
Clackamas RFPD #1
Nearest Police Station
Oregon City Police
Zoning & Development
Designation: Contact City
Urban Growth Boundary: METRO UGB
Voting
Voting Precincts: 606
State House District: 40
State Senate District: 20
Congressional District: 5
Utilities & Districts
Community Planning Organization
City
Sanitary Hauler
Oregon City Garbage Co. (https://clackamas.us/recycling/garbage/company.html)
School District
Oregon City (http://www.orecity.k12.or.us)
Sewer District
Tri-City Service District (https://www.clackamas.us/wes)
Water District
Clackamas River Water (http://www.crwater.com)
Environmental & Hazards
Flood
Likely not in a flood zone.
Wildfire
Your risk may be the lowest.
Earthquake Hazard
Your risk may be the lowest.
Soils
8B - Bornstedt Silt Loam, 0To 8 Percent Slopes
Approximate Elevation
388.00 ft
North Folk Dam Failure
Most likely not at risk of flooding due to dam failure
River Mill Dam Failure
Most likely not at risk of flooding due to dam failure
Timothy Dam Failure
Most likely not at risk of flooding due to dam failure
Parks
Nearby
Barclay Hills Park (http://www.orcity.org/parksandrecreation/barclay-hills-park)
13571 Barclay Hills Dr, Oregon City
1.30 miles
Hillendale Park (http://www.orcity.org/parksandrecreation/hillendale-park)
19260 Clairmont Way, Oregon City
1.34 miles
Singer Creek Park (http://www.orcity.org/parksandrecreation/singer-creek-park)
130 LinnAve, Oregon City
1.92 miles
Stafford Park (http://www.orcity.org/parksandrecreation/stafford-park)
569 Holmes Ln, Oregon City
1.68 miles
Wesley Lynn Park (http://www.orcity.org/parksandrecreation/wesley-lynn-park)
12901 Frontier Pkwy, Oregon City
1.77 miles
Documents
Surveyor Documents
Survey - SN2051 (https://cmap.clackamas.us/survey/PSImages/3S2E/09/PS2051.tif)
Survey - SN2052 (https://cmap.clackamas.us/survey/PSImages/3S2E/09/PS2052.JPG)
Assessor Documents
Taxmap - 3S2E09AB (https://cmap.clackamas.us/taxmap/03_3s2e09ab.pdf)
District Maps
State House District (https://dochub.clackamas.us/documents/drupal/572da18f-832b-4f1e-af51275c45f44fe7)
COMMUNITY
Demographics
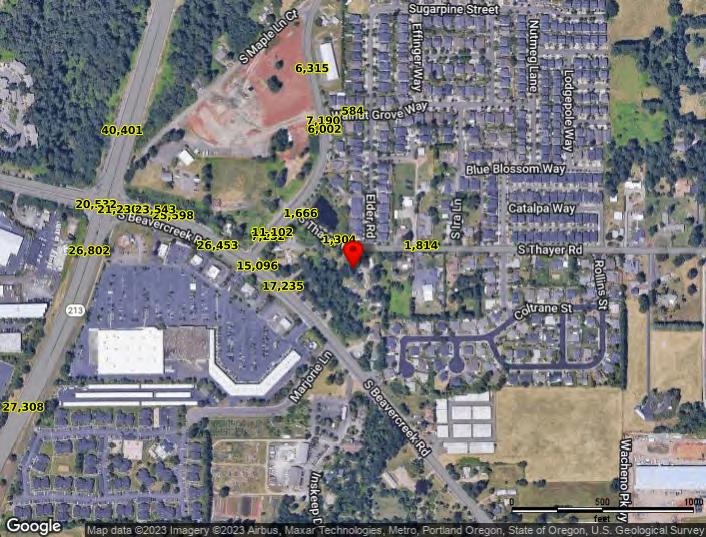
Traffic Counts
The information contained is provided by WFG’s Customer Service Department to our customers, and while deemed reliable, is not guaranteed.
INFORMATION

14450 S Thayer
Rd, Oregon City, OR 97045
S Thayer Rd,
Sitewise Online Pop-Facts: Population Quick Facts Pop-Facts: Population Quick Facts 14450 S Thayer Rd, Oregon City, OR 97045 0 - 1 mi Population 2027 Projection 7,461 2022 Estimate 7,012 2010 Census 5,805 2000 Census 3,717 Growth 2022-2027 6.40% Growth 2010-2022 20.80% Growth 2000-2010 56.14% 2022 Est. Population by Age 7,012 Age 0 to 4 397 5.66% Age 5 to 9 435 6.20% Age 10 to 14 474 6.76% Age 15 to 17 280 3.99% Age 18 to 20 249 3.55% Age 21 to 24 322 4.60% Age 25 to 34 921 13.14% Age 35 to 44 1,028 14.66% Age 45 to 54 939 13.40% Age 55 to 64 802 11.43% Age 65 to 74 719 10.26% Age 75 to 84 314 4.47% Age 85 and over 131 1.87% Age 16 and over 5,614 80.07% Age 18 and over 5,426 77.39% Age 21 and over 5,177 73.84% Age 65 and over 1,165 16.61% 2022 Est. Median Age 39.16 2022 Est. Average Age 39.60
14450
Oregon City, OR 97045
2022 Est. Population by Single-Classification Race 7,012 White Alone 6,184 88.19% Black or African American Alone 66 0.94% American Indian and Alaska Native Alone 66 0.95% Asian Alone 176 2.51% Native Hawaiian and Other Pacific Islander Alone 15 0.21% Some Other Race Alone 239 3.41% Two or More Races 265 3.78% 2022 Est. Population by Ethnicity (Hispanic or Latino) 7,012 Hispanic or Latino 766 10.93% Not Hispanic or Latino 6,246 89.07% 2022 Est. Population by Sex 7,012 Male 3,432 48.94% Female 3,580 51.06%
14450 S Thayer Rd, Oregon City, OR 97045 Sitewise Online Pop-Facts: Population Quick Facts Pop-Facts: Population Quick Facts 14450 S Thayer Rd, Oregon City, OR 97045 0 - 1 mi
Copyright © Claritas, LLC 2022. All rights reserved.
14450 S Thayer Rd, Oregon City, OR 97045 Sitewise Online Pop-Facts: Household Quick Facts Pop-Facts: Household Quick Facts 14450 S Thayer Rd, Oregon City, OR 97045 0 - 1 mi Households 2027 Projection 2,814 2022 Estimate 2,649 2010 Census 2,214 2000 Census 1,357 Growth 2022-2027 6.24% Growth 2010-2022 19.63% Growth 2000-2010 63.23% 2022 Est. Households by Household Income 2,649 Income Less than $15,000 151 5.71% Income $15,000 to $24,999 80 3.01% Income $25,000 to $34,999 152 5.72% Income $35,000 to $49,999 346 13.05% Income $50,000 to $74,999 517 19.52% Income $75,000 to $99,999 419 15.80% Income $100,000 to $124,999 267 10.10% Income $125,000 to $149,999 219 8.26% Income $150,000 to $199,999 289 10.90% Income $200,000 to $249,999 114 4.29% Income $250,000 to $499,999 74 2.78% Income $500,000 or more 23 0.86% 2022 Est. Average Household Income $100,302 2022 Est. Median Household Income $79,725 2022 Median HH Inc. by Single-Classification Race White Alone $79,569 Black or African American Alone $30,636 American Indian and Alaska Native Alone $62,266 Asian Alone $96,287 Native Hawaiian and Other Pacific Islander Alone $194,348 Some Other Race Alone $53,270 Two or More Races $131,202 Hispanic or Latino $48,208 Not Hispanic or Latino $81,925 2022 Est. Households by Household Type 2,649 Family Households 1,836 69.32% Nonfamily Households 813 30.68% 2022 Est. Group Quarters Population 95
2022 Est. Households by Household Size 2,649 1-person 640 24.14% 2-person 849 32.06% 3-person 471 17.79% 4-person 394 14.87% 5-person 179 6.76% 6-person 74 2.79% 7-or-more-person 42 1.60% 2022 Est. Average Household Size 2.61 14450 S Thayer Rd, Oregon City, OR 97045 Sitewise Online Pop-Facts: Household Quick Facts Pop-Facts: Household Quick Facts 14450 S Thayer Rd, Oregon City, OR 97045 0 - 1 mi
2022 Est. HHs by Type by Presence of Own Children 1,836 Married-Couple Family, own children 589 32.08% Married-Couple Family, no own children 783 42.63% Male Householder, own children 82 4.47% Male Householder, no own children 59 3.24% Female Householder, own children 195 10.60% Female Householder, no own children 128 6.98% Copyright © Claritas, LLC 2022. All rights reserved. 14450 S Thayer Rd, Oregon City, OR 97045 Sitewise Online Pop-Facts: Household Quick Facts Pop-Facts: Household Quick Facts 14450 S Thayer Rd, Oregon City, OR 97045 0 - 1 mi
Demographic
Pop-Facts: Demographic Snapshot (Part 1) 14450 S Thayer Rd, Oregon City, OR 97045 0 - 1 mi Population 2027 Projection 7,461 2022 Estimate 7,012 2010 Census 5,805 2000 Census 3,717 Growth 2022-2027 6.40% Growth 2010-2022 20.80% Growth 2000-2010 56.14% 2022 Est. Population by Single-Classification Race 7,012 White Alone 6,184 88.19% Black or African American Alone 66 0.94% American Indian and Alaska Native Alone 66 0.95% Asian Alone 176 2.51% Native Hawaiian and Other Pacific Islander Alone 15 0.21% Some Other Race Alone 239 3.41% Two or More Races 265 3.78% 2022 Est. Population Hispanic or Latino by Origin 7,012 Not Hispanic or Latino 6,246 89.07% Hispanic or Latino 766 10.93% Hispanic or Latino by Origin 766 Mexican 598 78.05% Puerto Rican 18 2.38% Cuban 5 0.71% All Other Hispanic or Latino 145 18.86% 2022 Est. Hisp. or Latino Pop by Single-Classification Race 766 White Alone 442 57.66% Black or African American Alone 5 0.66% American Indian and Alaska Native Alone 19 2.52% Asian Alone 1 0.07% Native Hawaiian and Other Pacific Islander Alone 1 0.11% Some Other Race Alone 236 30.77% Two or More Races 63 8.21%
14450 S Thayer Rd, Oregon City, OR 97045 Sitewise Online Pop-Facts:
Snapshot (Part 1)
2022 Est. Pop by Race, Asian Alone, by Category 176 Chinese, except Taiwanese 5 2.93% Filipino 73 41.21% Japanese 1 0.47% Asian Indian 18 10.08% Korean 49 28.08% Vietnamese 15 8.42% Cambodian 0 0.00% Hmong 0 0.00% Laotian 0 0.00% Thai 0 0.00% All other Asian Races, including 2 or more 16 8.80% 2022 Est. Population by Ancestry 7,012 Arab 7 0.09% Czech 1 0.01% Danish 41 0.58% Dutch 78 1.12% English 619 8.82% French (except Basque) 123 1.76% French Canadian 59 0.85% German 1,105 15.76% Greek 29 0.42% Hungarian 15 0.21% Irish 479 6.84% Italian 196 2.79% Lithuanian 2 0.03% Norwegian 231 3.30% Polish 49 0.69% Portuguese 112 1.60% Russian 20 0.28% Scottish 224 3.19% Scotch-Irish 40 0.57% Slovak 2 0.03% Subsaharan African 4 0.06% Swedish 128 1.82% Swiss 18 0.26% Ukrainian 92 1.31% United States or American 342 4.88% Welsh 60 0.86% West Indian (except Hisp. groups) 0 0.00% Other Ancestries 1,707 24.35% Ancestry Unclassified 1,228 17.52% 2022 Est. Pop Age 5+ by Language Spoken At Home 6,615
Sitewise Online Pop-Facts: Demographic Snapshot (Part 1) Pop-Facts: Demographic Snapshot (Part 1) 14450 S Thayer Rd, Oregon City, OR 97045 0 - 1 mi
14450 S Thayer Rd, Oregon City, OR 97045
Speak only English 6,130 92.67% Speak Asian or Pacific Island Language 56 0.84% Speak IndoEuropean Language 214 3.23% Speak Spanish 191 2.88% Speak Other Language 25 0.37% 14450 S Thayer Rd, Oregon City, OR 97045 Sitewise Online Pop-Facts: Demographic Snapshot (Part 1) Pop-Facts: Demographic Snapshot (Part 1) 14450 S Thayer Rd, Oregon City, OR 97045 0 - 1 mi
2022 Est. Population by Sex 7,012 Male 3,432 48.94% Female 3,580 51.06% 2022 Est. Population by Age 7,012 Age 0 to 4 397 5.66% Age 5 to 9 435 6.20% Age 10 to 14 474 6.76% Age 15 to 17 280 3.99% Age 18 to 20 249 3.55% Age 21 to 24 322 4.60% Age 25 to 34 921 13.14% Age 35 to 44 1,028 14.66% Age 45 to 54 939 13.40% Age 55 to 64 802 11.43% Age 65 to 74 719 10.26% Age 75 to 84 314 4.47% Age 85 and over 131 1.87% Age 16 and over 5,614 80.07% Age 18 and over 5,426 77.39% Age 21 and over 5,177 73.84% Age 65 and over 1,165 16.61% 2022 Est. Median Age 39.16 2022 Est. Average Age 39.60
Pop-Facts: Demographic Snapshot (Part 1) 14450 S Thayer Rd, Oregon City, OR 97045 0 - 1 mi
14450 S Thayer Rd, Oregon City, OR 97045 Sitewise Online Pop-Facts: Demographic Snapshot (Part 1)
2022 Est. Male Population by Age 3,432 Age 0 to 4 201 5.87% Age 5 to 9 222 6.47% Age 10 to 14 245 7.14% Age 15 to 17 146 4.26% Age 18 to 20 132 3.85% Age 21 to 24 170 4.94% Age 25 to 34 465 13.56% Age 35 to 44 498 14.51% Age 45 to 54 463 13.49% Age 55 to 64 377 10.97% Age 65 to 74 330 9.62% Age 75 to 84 139 4.05% Age 85 and over 43 1.25% 2022 Est. Median Age, Male 37.69 2022 Est. Average Age, Male 38.37 2022 Est. Female Population by Age 3,580 Age 0 to 4 196 5.47% Age 5 to 9 213 5.94% Age 10 to 14 229 6.39% Age 15 to 17 134 3.73% Age 18 to 20 117 3.26% Age 21 to 24 153 4.27% Age 25 to 34 456 12.74% Age 35 to 44 530 14.80% Age 45 to 54 476 13.30% Age 55 to 64 425 11.88% Age 65 to 74 389 10.87% Age 75 to 84 175 4.88% Age 85 and over 88 2.47% 2022 Est. Median Age, Female 40.54 2022 Est. Average Age, Female 40.81 14450 S Thayer Rd, Oregon City, OR 97045 Sitewise Online Pop-Facts: Demographic Snapshot (Part 1) Pop-Facts: Demographic Snapshot (Part 1) 14450 S Thayer Rd, Oregon City, OR 97045 0 - 1 mi
2022 Est. Pop Age 15+ by Marital Status 5,706 Total, Never Married 1,667 29.21% Males, Never Married 923 16.18% Females, Never Married 744 13.04% Married, Spouse present 2,808 49.22% Married, Spouse absent 159 2.78% Widowed 353 6.19% Males, Widowed 21 0.37% Females, Widowed 332 5.82% Divorced 719 12.60% Males, Divorced 323 5.67% Females, Divorced 395 6.93% 2022 Est. Pop Age 25+ by Edu. Attainment 4,855 Less than 9th grade 89 1.84% Some High School, no diploma 202 4.16% High School Graduate (or GED) 1,280 26.35% Some College, no degree 1,419 29.23% Associate Degree 599 12.33% Bachelor's Degree 978 20.14% Master's Degree 208 4.29% Professional School Degree 29 0.59% Doctorate Degree 52 1.07% 2022 Est. Pop. Age 25+ by Edu. Attain., Hisp./Lat. 389 No High School Diploma 159 40.80% High School Graduate 147 37.90% Some College or Associate's Degree 61 15.64% Bachelor's Degree or Higher 22 5.67% Copyright © Claritas, LLC 2022. All rights reserved. 14450 S Thayer Rd, Oregon City, OR 97045 Sitewise Online Pop-Facts: Demographic Snapshot (Part 1) Pop-Facts: Demographic Snapshot (Part 1) 14450 S Thayer Rd, Oregon City, OR 97045 0 - 1 mi
14450 S Thayer Rd, Oregon City, OR 97045 Sitewise Online Pop-Facts: Demographic Snapshot (Part 2) Pop-Facts: Demographic Snapshot (Part 2) 14450 S Thayer Rd, Oregon City, OR 97045 0 - 1 mi Households 2027 Projection 2,814 2022 Estimate 2,649 2010 Census 2,214 2000 Census 1,357 Growth 2022-2027 6.24% Growth 2010-2022 19.63% Growth 2000-2010 63.23% 2022 Est. Households by Household Type 2,649 Family Households 1,836 69.32% Nonfamily Households 813 30.68% 2022 Est. Group Quarters Population 95 2022 HHs by Ethnicity: Hispanic/Latino 187 7.07% 2022 Est. Households by HH Income 2,649 Income < $15,000 151 5.71% Income $15,000 to $24,999 80 3.01% Income $25,000 to $34,999 152 5.72% Income $35,000 to $49,999 346 13.05% Income $50,000 to $74,999 517 19.52% Income $75,000 to $99,999 419 15.80% Income $100,000 to $124,999 267 10.10% Income $125,000 to $149,999 219 8.26% Income $150,000 to $199,999 289 10.90% Income $200,000 to $249,999 114 4.29% Income $250,000 to $499,999 74 2.78% Income $500,000+ 23 0.86% 2022 Est. Average Household Income $100,302 2022 Est. Median Household Income $79,725 2022 Median HH Income by Single-Class. Race or Ethn. White Alone $79,569 Black or African American Alone $30,636 American Indian and Alaska Native Alone $62,266 Asian Alone $96,287 Native Hawaiian and Other Pacific Islander Alone $194,348 Some Other Race Alone $53,270 Two or More Races $131,202
Hispanic or Latino $48,208 Not Hispanic or Latino $81,925
Sitewise Online Pop-Facts: Demographic Snapshot (Part 2) Pop-Facts: Demographic Snapshot (Part 2) 14450 S Thayer Rd, Oregon City, OR 97045 0 - 1 mi
14450 S Thayer Rd, Oregon City, OR 97045
2022 Est. Family HH Type by Presence of Own Children 1,836 Married-Couple Family, own children 589 32.08% Married-Couple Family, no own children 783 42.63% Male Householder, own children 82 4.47% Male Householder, no own children 59 3.24% Female Householder, own children 195 10.60% Female Householder, no own children 128 6.98% 2022 Est. Households by Household Size 2,649 1-person 640 24.14% 2-person 849 32.06% 3-person 471 17.79% 4-person 394 14.87% 5-person 179 6.76% 6-person 74 2.79% 7-or-more-person 42 1.60% 2022 Est. Average Household Size 2.61 2022 Est. Households by Presence of People Under 18 2,649 Households with 1 or more People under Age 18 947 35.74% Households with No People under Age 18 1,702 64.26% Households with 1 or more People under Age 18 947 Married-Couple Family 626 66.11% Other Family, Male Householder 94 9.91% Other Family, Female Householder 213 22.52% Nonfamily, Male Householder 9 0.96% Nonfamily, Female Householder 5 0.50% Households with No People under Age 18 1,702 Married-Couple Family 746 43.83% Other Family, Male Householder 48 2.81% Other Family, Female Householder 109 6.42% Nonfamily, Male Householder 321 18.87% Nonfamily, Female Householder 478 28.08%
Pop-Facts: Demographic
2) Pop-Facts: Demographic Snapshot (Part 2) 14450 S Thayer Rd, Oregon City, OR 97045 0 - 1 mi
14450 S Thayer Rd, Oregon City, OR 97045
Sitewise Online
Snapshot (Part
2022 Est. Households by Number of Vehicles 2,649 No Vehicles 131 4.93% 1 Vehicle 683 25.77% 2 Vehicles 1,036 39.10% 3 Vehicles 597 22.54% 4 Vehicles 113 4.25% 5 or more Vehicles 90 3.42% 2022 Est. Average Number of Vehicles 2.09 Family Households 2027 Projection 1,953 2022 Estimate 1,836 2010 Census 1,529 2000 Census 1,010 Growth 2022-2027 6.34% Growth 2010-2022 20.09% Growth 2000-2010 51.45% 2022 Est. Families by Poverty Status 1,836 2022 Families at or Above Poverty 1,784 97.18% 2022 Families at or Above Poverty with Children 883 48.08% 2022 Families Below Poverty 52 2.82% 2022 Families Below Poverty with Children 36 1.97% 2022 Est. Pop Age 16+ by Employment Status 5,614 In Armed Forces 0 0.00% Civilian - Employed 3,433 61.15% Civilian - Unemployed 192 3.42% Not in Labor Force 1,989 35.43% 2022 Est. Civ. Employed Pop 16+ by Class of Worker 3,461 For-Profit Private Workers 2,311 66.79% Non-Profit Private Workers 268 7.75% Local Government Workers 330 9.53% State Government Workers 131 3.79% Federal Government Workers 40 1.17% Self-Employed Workers 360 10.40% Unpaid Family Workers 20 0.57% 14450 S Thayer Rd, Oregon City, OR 97045 Sitewise Online Pop-Facts: Demographic Snapshot (Part 2) Pop-Facts: Demographic Snapshot (Part 2) 14450 S Thayer Rd, Oregon City, OR 97045 0 - 1 mi
2022 Est. Civ. Employed Pop 16+ by Occupation 3,461 Architect/Engineer 28 0.80% Arts/Entertainment/Sports 39 1.13% Building Grounds Maintenance 120 3.48% Business/Financial Operations 158 4.56% Community/Social Services 78 2.24% Computer/Mathematical 72 2.08% Construction/Extraction 117 3.37% Education/Training/Library 219 6.31% Farming/Fishing/Forestry 34 0.99% Food Prep/Serving 176 5.10% Healthcare Practitioner/Technician 144 4.17% Healthcare Support 101 2.92% Maintenance Repair 125 3.61% Legal 19 0.56% Life/Physical/Social Science 9 0.26% Management 379 10.96% Office/Admin. Support 490 14.15% Production 200 5.78% Protective Service 85 2.47% Sales/Related 368 10.62% Personal Care/Service 81 2.35% Transportation/Moving 418 12.08% 2022 Est. Pop 16+ by Occupation Classification 3,461 Blue Collar 860 24.85% White Collar 2,002 57.85% Service & Farm 599 17.30% 2022 Est. Workers Age 16+ by Transp. To Work 3,418 Drove Alone 2,650 77.52% Car Pooled 345 10.08% Public Transportation 71 2.08% Walked 80 2.33% Bicycle 3 0.09% Other Means 68 1.99% Worked at Home 202 5.90% 2022 Est. Workers Age 16+ by Travel Time to Work* Less than 15 minutes 494 15 to 29 Minutes 1,074 30 to 44 Minutes 958 45 to 59 Minutes 443 60 or more Minutes 277 14450 S Thayer Rd, Oregon City, OR 97045 Sitewise Online Pop-Facts: Demographic Snapshot (Part 2) Pop-Facts: Demographic Snapshot (Part 2) 14450 S Thayer Rd, Oregon City, OR 97045 0 - 1 mi
2022 Est. Avg. Travel Time to Work in Minutes* 32.76 2022 Est. Occupied Housing Units by Tenure 2,649 Owner-Occupied 1,770 66.81% Renter-Occupied 879 33.19% 2022 Occupied Housing Units: Avg. Length of Residence Owner-Occupied 10 Renter-Occupied 5 14450 S Thayer Rd, Oregon City, OR 97045 Sitewise Online Pop-Facts: Demographic Snapshot (Part 2) Pop-Facts: Demographic Snapshot (Part 2) 14450 S Thayer Rd, Oregon City, OR 97045 0 - 1 mi
2022 Est. Owner Occupied Housing Units by Value 1,770 Value Less than $20,000 12 0.68% Value $20,000 to $39,999 32 1.79% Value $40,000 to $59,999 60 3.42% Value $60,000 to $79,999 19 1.10% Value $80,000 to $99,999 18 1.04% Value $100,000 to $149,999 22 1.27% Value $150,000 to $199,999 5 0.31% Value $200,000 to $299,999 56 3.17% Value $300,000 to $399,999 322 18.22% Value $400,000 to $499,999 490 27.68% Value $500,000 to $749,999 521 29.42% Value $750,000 to $999,999 150 8.48% Value $1,000,000 to $1,499,999 49 2.78% Value $1,500,000 to $1,999,999 7 0.41% Value $2,000,000 or more 4 0.24% 2022 Est. Median All Owner-Occupied Housing Unit Value $468,688 2022 Est. Housing Units by Units in Structure 2,937 1 Unit Attached 285 9.69% 1 Unit Detached 1,632 55.54% 2 Units 38 1.31% 3 or 4 Units 134 4.57% 5 to 19 Units 353 12.01% 20 to 49 Units 40 1.37% 50 or More Units 199 6.78% Mobile Home or Trailer 254 8.66% Boat, RV, Van, etc. 2 0.07% Dominant structure type 1 Unit Detached 2022 Est. Housing Units by Year Structure Built 2,937 Housing Units Built 2014 or Later 471 16.02% Housing Units Built 2010 to 2013 162 5.51% Housing Units Built 2000 to 2009 476 16.22% Housing Units Built 1990 to 1999 764 26.02% Housing Units Built 1980 to 1989 182 6.20% Housing Units Built 1970 to 1979 587 19.97% Housing Units Built 1960 to 1969 140 4.77% Housing Units Built 1950 to 1959 64 2.16% Housing Units Built 1940 to 1949 20 0.69% Housing Units Built 1939 or Earlier 72 2.44% 2022 Est. Median Year Structure Built** 1995 14450 S Thayer Rd, Oregon City, OR 97045 Sitewise Online Pop-Facts: Demographic Snapshot (Part 2) Pop-Facts: Demographic Snapshot (Part 2) 14450 S Thayer Rd, Oregon City, OR 97045 0 - 1 mi
14450 S Thayer Rd, Oregon City, OR 97045 Sitewise Online
Pop-Facts: Demographic Snapshot (Part 2)
Pop-Facts: Demographic Snapshot (Part 2)
Dominant Year Structure Built
Copyright © Claritas, LLC 2022. All rights reserved.
* This row intentionally left blank. No Total Category.
**1939 will appear when at least half of the Housing Units in this reports area were built in 1939 or earlier.
1990 to 1999
14450
0 - 1 mi
S Thayer Rd, Oregon City, OR 97045
14450 S Thayer Rd, Oregon City, OR 97045 Sitewise Online Pop-Facts: Census Demographic Overview (Part 1) Pop-Facts: Census Demographic Overview (Part 1) 14450 S Thayer Rd, Oregon City, OR 97045 0 - 1 mi Population 2027 Projection 7,461 2022 Estimate 7,012 2010 Census 5,805 2000 Census 3,717 Growth 2022-2027 6.40% Growth 2010-2022 20.80% Growth 2000-2010 56.14% 2010 Population by Single-Classification Race 5,805 White Alone 5,273 90.84% Black or African American Alone 36 0.61% American Indian and Alaska Native Alone 48 0.83% Asian Alone 109 1.89% Native Hawaiian and Other Pacific Islander Alone 11 0.18% Some Other Race Alone 154 2.66% Two or More Races 173 2.99% 2010 Population By Ethnicity 5,805 Not Hispanic or Latino 5,335 91.91% Hispanic or Latino 470 8.09% 2010 Hispanic or Latino by Single-Classification Race 470 White Alone 262 55.85% Black or African American Alone 4 0.77% American Indian and Alaska Native Alone 12 2.49% Asian Alone 0 0.08% Native Hawaiian and Other Pacific Islander Alone 0 0.09% Some Other Race Alone 151 32.06% Two or More Races 41 8.66% 2010 Population by Sex 5,805 Male 2,822 48.61% Female 2,983 51.39% Male/Female Ratio 0.95
2010 Population by Age 5,805 Age 0 to 4 376 6.47% Age 5 to 9 392 6.75% Age 10 to 14 425 7.32% Age 15 to 17 269 4.63% Age 18 to 20 260 4.48% Age 21 to 24 272 4.68% Age 25 to 34 745 12.84% Age 35 to 44 826 14.22% Age 45 to 54 795 13.70% Age 55 to 64 715 12.31% Age 65 to 74 384 6.61% Age 75 to 84 230 3.96% Age 85 and over 118 2.03% Age 16 and over 4,526 77.98% Age 18 and over 4,343 74.83% Age 21 and over 4,084 70.35% Age 65 and over 731 12.60% 2010 Median Age 36.99 14450 S Thayer Rd, Oregon City, OR 97045 Sitewise Online Pop-Facts: Census Demographic Overview (Part 1) Pop-Facts: Census Demographic Overview (Part 1) 14450 S Thayer Rd, Oregon City, OR 97045 0 - 1 mi
2010 Male Population by Age 2,822 Age 0 to 4 198 7.01% Age 5 to 9 202 7.14% Age 10 to 14 212 7.53% Age 15 to 17 133 4.73% Age 18 to 20 136 4.81% Age 21 to 24 142 5.03% Age 25 to 34 372 13.19% Age 35 to 44 406 14.37% Age 45 to 54 385 13.65% Age 55 to 64 332 11.77% Age 65 to 74 173 6.13% Age 75 to 84 99 3.50% Age 85 and over 33 1.15% 2010 Median Age, Male 35.39 2010 Female Population by Age 2,983 Age 0 to 4 178 5.95% Age 5 to 9 190 6.38% Age 10 to 14 212 7.12% Age 15 to 17 135 4.54% Age 18 to 20 124 4.16% Age 21 to 24 130 4.35% Age 25 to 34 373 12.51% Age 35 to 44 420 14.08% Age 45 to 54 410 13.75% Age 55 to 64 383 12.83% Age 65 to 74 211 7.07% Age 75 to 84 131 4.40% Age 85 and over 85 2.85% 2010 Median Age, Female 38.53
14450 S Thayer Rd, Oregon City, OR 97045 Sitewise Online Pop-Facts: Census Demographic Overview (Part 1) Pop-Facts: Census Demographic Overview (Part 1) 14450 S Thayer Rd, Oregon City, OR 97045 0 - 1 mi
Copyright
© Claritas, LLC 2022. All rights reserved.
14450 S Thayer Rd, Oregon City, OR 97045 Sitewise Online Pop-Facts: Census Demographic Overview (Part 2) Pop-Facts: Census Demographic Overview (Part 2) 14450 S Thayer Rd, Oregon City, OR 97045 0 - 1 mi Households 2027 Projection 2,814 2022 Estimate 2,649 2010 Census 2,214 2000 Census 1,357 Growth 2022-2027 6.24% Growth 2010-2022 19.63% Growth 2000-2010 63.23% 2010 Households by Household Type 2,214 Family Households 1,529 69.06% Non-family Households 685 30.94% 2010 Group Quarters Population 89 2010 Hispanic or Latino Households 113 5.09% 2010 Households by Household Size 2,214 1-person 536 24.21% 2-person 730 32.97% 3-person 378 17.05% 4-person 344 15.52% 5-person 138 6.24% 6-person 55 2.50% 7-or-more-person 33 1.51%
2010 Households by Type and Presence of Children 2,214 Married-Couple Family, own children 488 22.06% Male Householder, own children 68 3.09% Female Householder, own children 160 7.24% Married-Couple Family, no own children 656 29.64% Male Householder, no own children 49 2.23% Female Householder, no own children 106 4.80% Non-family Households 685 30.94% 2010 Households by Presence of People Under Age 18 2,214 HH with 1 or More People Under Age 18: 786 35.49% Households with No People Under Age 18: 1,428 64.51% HH with 1 or More People Under Age 18: 786 Married-Couple Family 521 66.28% Other Family, Male Householder 78 9.90% Other Family, Female Householder 176 22.37% Nonfamily, Male Householder 7 0.94% Nonfamily, Female Householder 4 0.52% Households with No People Under Age 18: 1,428 Married-Couple Family 624 43.67% Other Family, Male Householder 40 2.79% Other Family, Female Householder 91 6.37% Nonfamily, Male Householder 270 18.92% Nonfamily, Female Householder 404 28.25% 2010 Occupied Housing Units by Tenure 2,214 Owner-Occupied 1,475 66.64% Renter-Occupied 739 33.36% Copyright © Claritas,
14450 S Thayer Rd, Oregon City, OR 97045 Sitewise Online Pop-Facts: Census Demographic Overview (Part 2) Pop-Facts: Census Demographic Overview (Part 2) 14450 S Thayer Rd, Oregon City, OR 97045 0 - 1 mi
LLC 2022. All rights reserved.
14450 S Thayer Rd, Oregon City, OR 97045 Sitewise Online Retail Market Power Opportunity Gap Report By Retail Store Types Retail Market Power Opportunity Gap Report By Retail Store Types 14450 S Thayer Rd, Oregon City, OR 97045 0 - 1 mi 2022 Demand 2022 Supply Opportunity Gap/Surplus Total retail trade including food and drink (NAICS 44, 45 and 722) $100,395,985 $130,834,196 -$30,438,211 Total retail trade (NAICS 44 and 45) $89,598,037 $108,564,008 -$18,965,970 Motor vehicle and parts dealers (NAICS 441) $20,340,209 $12,782,656 $7,557,553 Automobile dealers (NAICS 4411) $17,133,388 $9,164,817 $7,968,570 New car dealers (NAICS 44111) $15,225,875 $7,650,418 $7,575,457 Used car dealers (NAICS 44112) $1,907,513 $1,514,399 $393,113 Other motor vehicle dealers (NAICS 4412) $1,810,635 $945,392 $865,242 Recreational vehicle dealers (NAICS 44121) $709,215 $777,667 -$68,452 Motorcycle, boat, and other motor vehicle dealers (NAICS 44122) $1,101,419 $167,725 $933,694 Boat dealers (NAICS 441222) $422,633 $ 0 $422,633 Motorcycle, ATV, and all other motor vehicle dealers (NAICS 441228) $678,786 $167,725 $511,061 Automotive parts, accessories, and tire stores (NAICS 4413) $1,396,186 $2,672,446 -$1,276,260 Automotive parts and accessories stores (NAICS 44131) $882,771 $2,174,142 -$1,291,370 Tire dealers (NAICS 44132) $513,415 $498,305 $ 15,111 Furniture and home furnishings stores (NAICS 442) $1,830,344 $2,928,557 -$1,098,213 Furniture stores (NAICS 4421) $996,363 $1,461,539 -$465,176 Home furnishings stores (NAICS 4422) $833,981 $1,467,018 -$633,037 Floor covering stores (NAICS 44221) $399,693 $728,532 -$328,839 Other home furnishings stores (NAICS 44229) $434,287 $738,485 -$304,198 Window treatment stores (NAICS 442291) $ 21,925 $ 0 $ 21,925 All other home furnishings stores (NAICS 442299) $412,363 $738,485 -$326,123 Electronics and appliance stores (NAICS 443) $1,179,887 $1,326,463 -$146,575 Household appliance stores (NAICS 443141) $285,980 $ 25,759 $260,221 Electronics stores (NAICS 443142) $893,907 $1,300,704 -$406,797 Building material and garden equipment and supplies dealers (NAICS 444) $6,627,536 $20,312,044 -$13,684,507 Building material and supplies dealers (NAICS 4441) $5,713,748 $19,398,979 -$13,685,232 Home centers (NAICS 44411) $3,163,083 $12,862,696 -$9,699,612 Paint and wallpaper stores (NAICS 44412) $194,007 $810,144 -$616,137 Hardware stores (NAICS 44413) $502,023 $163,068 $338,955 Other building material dealers (NAICS 44419) $1,854,635 $5,563,072 -$3,708,437 Lawn and garden equipment and supplies stores (NAICS 4442) $913,788 $913,064 $ 723 Outdoor power equipment stores (NAICS 44421) $186,566 $185,896 $ 670 Nursery, garden center, and farm supply stores (NAICS 44422) $727,222 $727,168 $ 54 Food and beverage stores (NAICS 445) $13,411,991 $29,702,324 -$16,290,334 Grocery stores (NAICS 4451) $11,942,439 $29,101,775 -$17,159,335 Supermarkets and other grocery (except convenience) stores (NAICS 44511) $11,459,188 $28,496,939 -$17,037,751 Convenience stores (NAICS 44512) $483,251 $604,837 -$121,585 Specialty food stores (NAICS 4452) $349,251 $331,095 $ 18,156
Meat markets (NAICS 44521) $105,630 $ 11,274 $ 94,355 Fish and seafood markets (NAICS 44522) $ 41,567 $ 4,182 $ 37,385 Fruit and vegetable markets (NAICS 44523) $ 72,407 $ 11,509 $ 60,898 Other specialty food stores (NAICS 44529) $129,647 $304,130 -$174,483 Baked goods and confectionery and nut stores (NAICS 445291 + 445292) $ 68,837 $ 39,973 $ 28,864 All other specialty food stores (NAICS 445299) $ 60,810 $264,157 -$203,346 Beer, wine, and liquor stores (NAICS 4453) $1,120,301 $269,454 $850,847 Health and personal care stores (NAICS 446) $5,218,388 $8,682,640 -$3,464,252 Pharmacies and drug stores (NAICS 44611) $4,532,087 $4,599,041 -$66,954 Cosmetics, beauty supplies, and perfume stores (NAICS 44612) $303,142 $2,847,478 -$2,544,336 Optical goods stores (NAICS 44613) $141,571 $152,662 -$11,091 Other health and personal care stores (NAICS 44619) $241,588 $1,083,458 -$841,870 Food (health) supplement stores (NAICS 446191) $ 85,989 $709,012 -$623,023 All other health and personal care stores (NAICS 446199) $155,599 $374,446 -$218,847 Gasoline stations (NAICS 447) $7,131,368 $4,030,668 $3,100,700 Clothing and clothing accessories stores (NAICS 448) $3,497,911 $2,405,799 $1,092,113 Clothing stores (NAICS 4481) $2,294,129 $1,466,176 $827,953 Men's clothing stores (NAICS 44811) $104,054 $ 3,060 $100,994 Women's clothing stores (NAICS 44812) $402,650 $ 2,383 $400,267 Children's and infants' clothing stores (NAICS 44813) $ 85,034 $ 272 $ 84,762 Family clothing stores (NAICS 44814) $1,381,061 $1,453,015 -$71,955 Clothing accessories stores (NAICS 44815) $112,005 $ 1,473 $110,531 Other clothing stores (NAICS 44819) $209,325 $ 5,972 $203,353 Shoe stores (NAICS 4482) $503,213 $215,625 $287,588 Jewelry, luggage, and leather goods stores (NAICS 4483) $700,569 $723,997 -$23,428 Jewelry stores (NAICS 44831) $451,345 $570,822 -$119,477 Luggage and leather goods stores (NAICS 44832) $249,224 $153,176 $ 96,049 Sporting goods, hobby, musical instrument, and book stores (NAICS 451) $1,389,390 $2,204,916 -$815,526 Sporting goods, hobby, and musical instrument stores (NAICS 4511) $1,253,085 $2,063,700 -$810,614 Sporting goods stores (NAICS 45111) $906,432 $1,033,133 -$126,701 Hobby, toy, and game stores (NAICS 45112) $252,599 $539,185 -$286,586 Sewing, needlework, and piece goods stores (NAICS 45113) $ 42,743 $277,761 -$235,018 Musical instrument and supplies stores (NAICS 45114) $ 51,312 $213,621 -$162,310 Book stores and news dealers (NAICS 4512) $136,305 $141,216 -$ 4,912 Book stores (NAICS 451211) $126,603 $141,216 -$14,613 News dealers and newsstands (NAICS 451212) $ 9,701 $ 0 $ 9,701 General merchandise stores (NAICS 452) $11,489,224 $11,267,584 $221,640 Department stores (NAICS 4522) $1,420,512 $3,108,670 -$1,688,157 Other general merchandise stores (NAICS 4523) $10,068,711 $8,158,914 $1,909,797 Warehouse clubs and supercenters (NAICS 452311) $9,100,935 $8,027,018 $1,073,917 All other general merchandise stores (NAICS 452319) $967,776 $131,897 $835,880 14450 S Thayer Rd, Oregon City, OR 97045 Sitewise Online Retail Market Power Opportunity Gap Report By Retail Store Types Retail Market Power Opportunity Gap Report By Retail Store Types 14450 S Thayer Rd, Oregon City, OR 97045 0 - 1 mi 2022 Demand 2022 Supply Opportunity Gap/Surplus
* GAFO (General merchandise, Apparel, Furniture and Other) represents sales at stores that sell merchandise normally sold in department stores. This category is not included in Total Retail Sales Including Eating and Drinking Places.
Miscellaneous store retailers (NAICS 453) $1,947,142 $3,272,189 -$1,325,048 Florists (NAICS 4531) $ 92,141 $143,126 -$50,986 Office supplies, stationery, and gift stores (NAICS 4532) $429,148 $324,686 $104,462 Office supplies and stationery stores (NAICS 45321) $179,904 $188,314 -$ 8,409 Gift, novelty, and souvenir stores (NAICS 45322) $249,244 $136,372 $112,871 Used merchandise stores (NAICS 4533) $281,447 $1,961,280 -$1,679,833 Other miscellaneous store retailers (NAICS 4539) $1,144,406 $843,097 $301,309 Pet and pet supplies stores (NAICS 45391) $337,702 $491,761 -$154,059 Art dealers (NAICS 45392) $181,944 $ 0 $181,944 Manufactured (mobile) home dealers (NAICS 45393) $121,595 $ 62,795 $ 58,800 All other miscellaneous store retailers (NAICS 45399) $503,165 $288,541 $214,624 Tobacco stores (NAICS 453991) $140,453 $186,227 -$45,774 All other miscellaneous store retailers (except tobacco stores) (NAICS 453998) $362,711 $102,313 $260,398 Non-store retailers (NAICS 454) $15,534,647 $9,648,170 $5,886,477 Electronic shopping and mail-order houses (NAICS 4541) $14,707,420 $7,743,800 $6,963,621 Vending machine operators (NAICS 4542) $111,172 $683,820 -$572,647 Direct selling establishments (NAICS 4543) $716,054 $1,220,551 -$504,496 Fuel dealers (NAICS 45431) $352,187 $169,996 $182,191 Other direct selling establishments (NAICS 45439) $363,868 $1,050,555 -$686,687 Food services and drinking places (NAICS 722) $10,797,948 $22,270,187 -$11,472,239 Special food services (NAICS 7223) $864,160 $612,799 $251,361 Food service contractors (NAICS 72231) $683,154 $ 87,534 $595,619 Caterers (NAICS 72232) $164,903 $525,265 -$360,361 Mobile food services (NAICS 72233) $ 16,103 $ 0 $ 16,103 Drinking places (alcoholic beverages) (NAICS 7224) $340,826 $761,695 -$420,869 Restaurants and other eating places (NAICS 7225) $9,592,962 $20,895,693 -$11,302,731 Full-service restaurants (NAICS 722511) $4,785,390 $10,244,320 -$5,458,930 Limited-service restaurants (NAICS 722513) $4,078,981 $8,266,063 -$4,187,081 Cafeterias, grill buffets, and buffets (NAICS 722514) $103,971 $236,590 -$132,619 Snack and nonalcoholic beverage bars (NAICS 722515) $624,620 $2,148,720 -$1,524,100 GAFO* $19,387,186 $20,133,642 -$746,457 General Merchandise Stores-452 $11,489,224 $11,267,584 $221,640 Clothing & Clothing Accessories Stores-448 $3,497,911 $2,405,799 $1,092,113 Furniture & Home Furnishings Stores-442 $1,830,344 $2,928,557 -$1,098,213 Electronics & Appliance Stores-443 $1,179,887 $1,326,463 -$146,575 Sporting Goods, Hobby, Book, Music Stores-451 $1,389,390 $2,204,916 -$815,526 Office Supplies, Stationery, Gift Stores-4532 $429,148 $324,686 $104,462
14450 S Thayer Rd, Oregon City, OR 97045 Sitewise Online Retail Market Power Opportunity Gap Report By Retail Store Types Retail Market Power Opportunity Gap Report By Retail Store Types 14450 S Thayer Rd, Oregon City, OR 97045 0 - 1 mi 2022 Demand 2022 Supply Opportunity Gap/Surplus
14450 S Thayer Rd, Oregon City, OR 97045
Sitewise Online
Retail Market Power Opportunity Gap Report By Retail Store Types
Retail Market Power Opportunity Gap Report By
Retail Store Types
Retail Market Power data is derived from two major sources of information. The demand data is derived from the Consumer Expenditure Survey (CE Survey or CEX), which is fielded by the U.S. Bureau of Labor Statistics (BLS). The supply data is derived from the Census of Retail Trade (CRT), which is made available by the U.S. Census. Additional data sources are incorporated to create both supply and demand estimates. The difference between demand and supply represents the opportunity gap or surplus available for each merchandise line in the specified reporting geography. When this difference is positive (demand is greater than the supply), there is an opportunity gap for that merchandise line; when the difference is negative (supply is greater than demand), there is a surplus.
Copyright © 2022 Environics Analytics. All rights reserved.
14450 S Thayer Rd, Oregon City, OR 97045 0 - 1 mi 2022 Demand 2022 Supply Opportunity Gap/Surplus


 Powered by Sitewise
Data Source: Kalibrate TrafficMetrix
Powered by Sitewise
Data Source: Kalibrate TrafficMetrix