COMMUNITY

Demographics
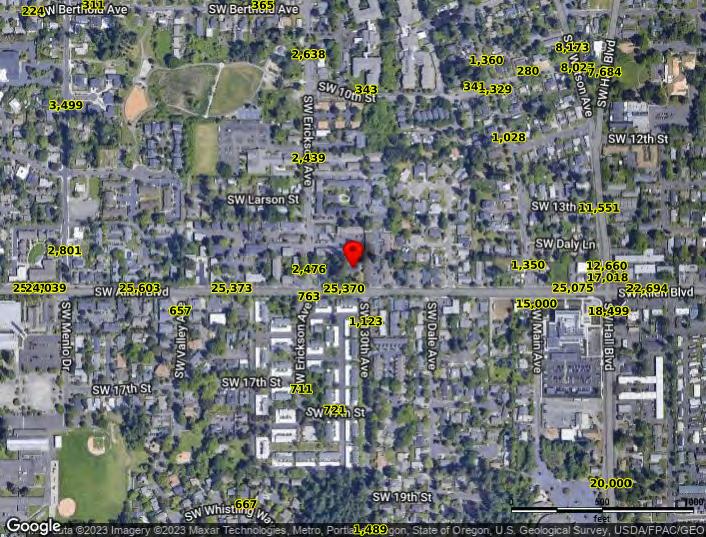
Traffic Counts
The information contained is provided by WFG’s Customer Service Department to our customers, and while deemed reliable, is not guaranteed.
INFORMATION

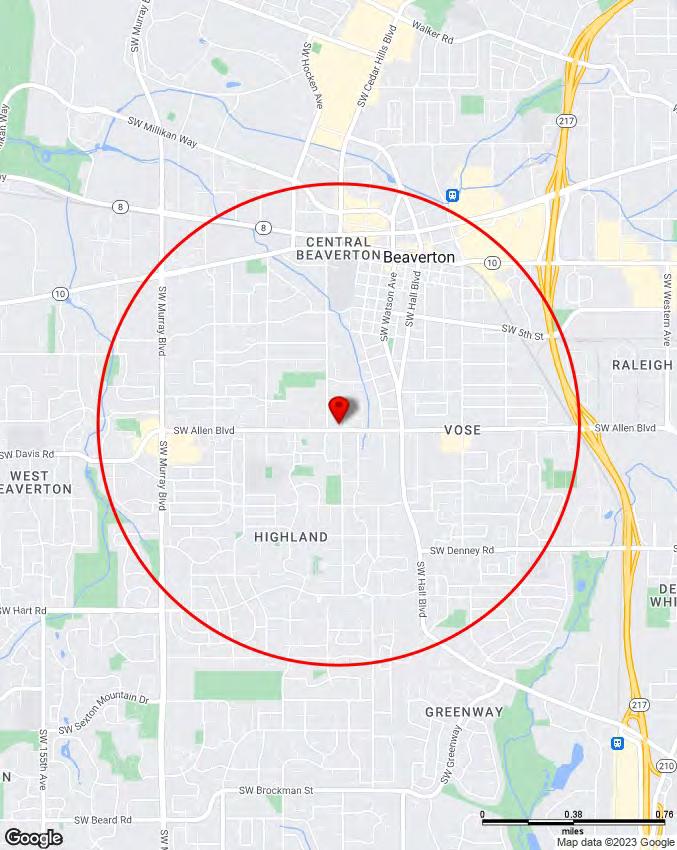
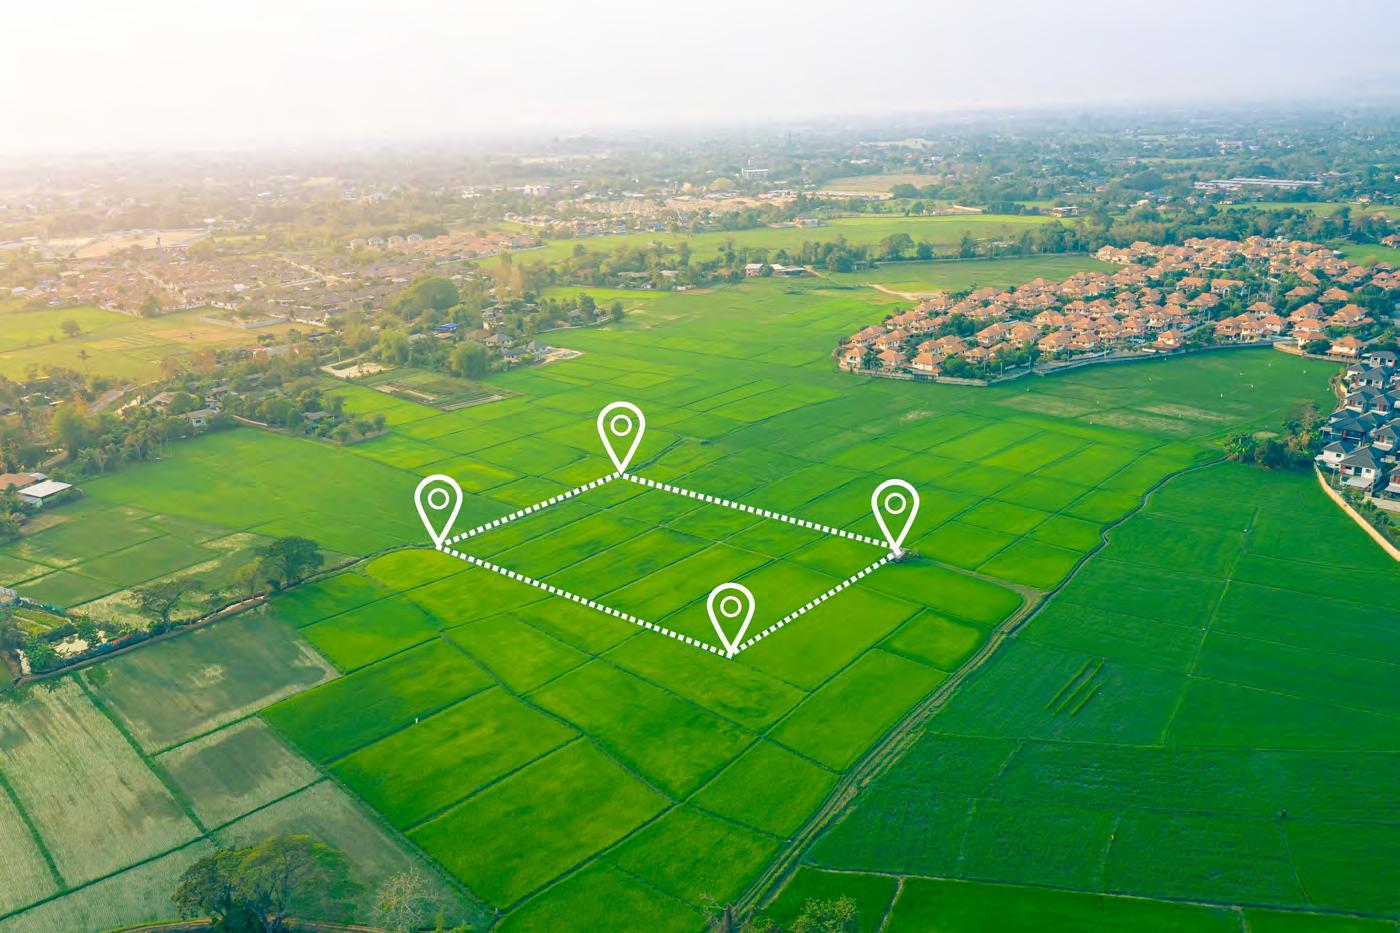
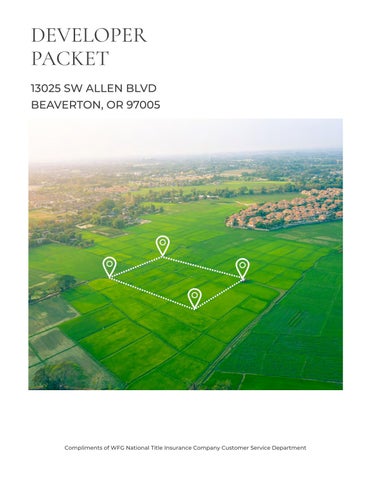
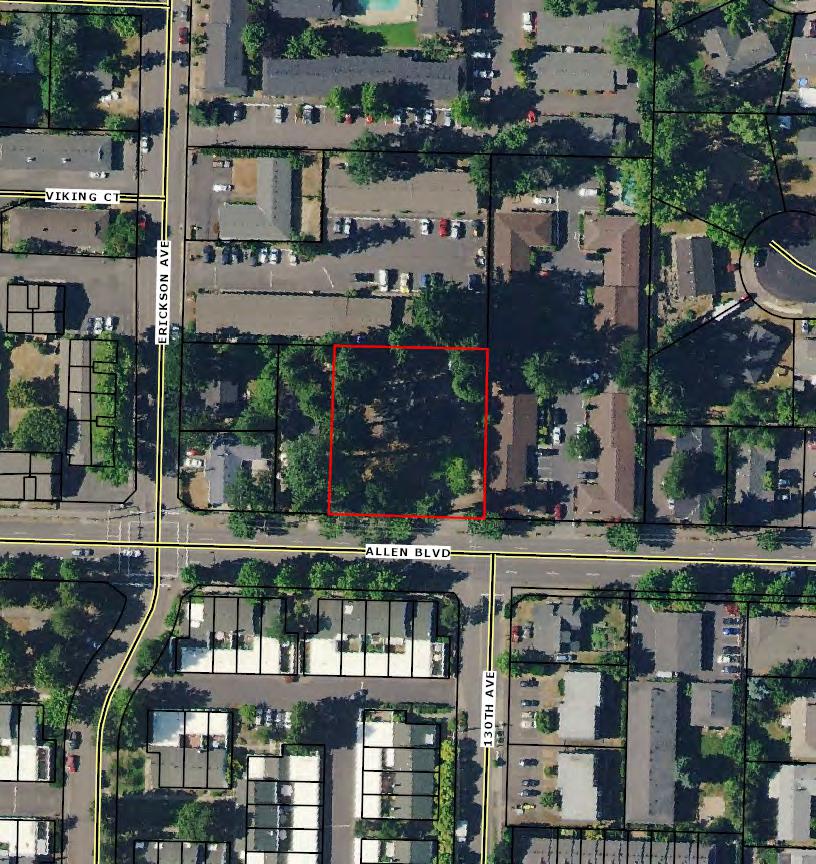
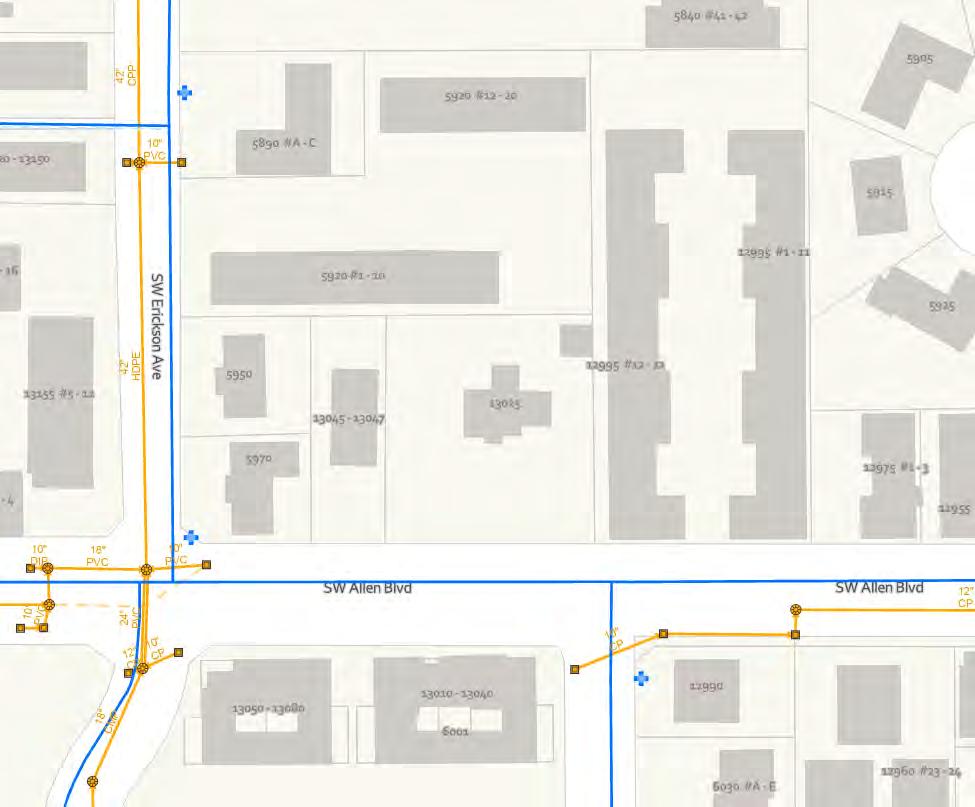
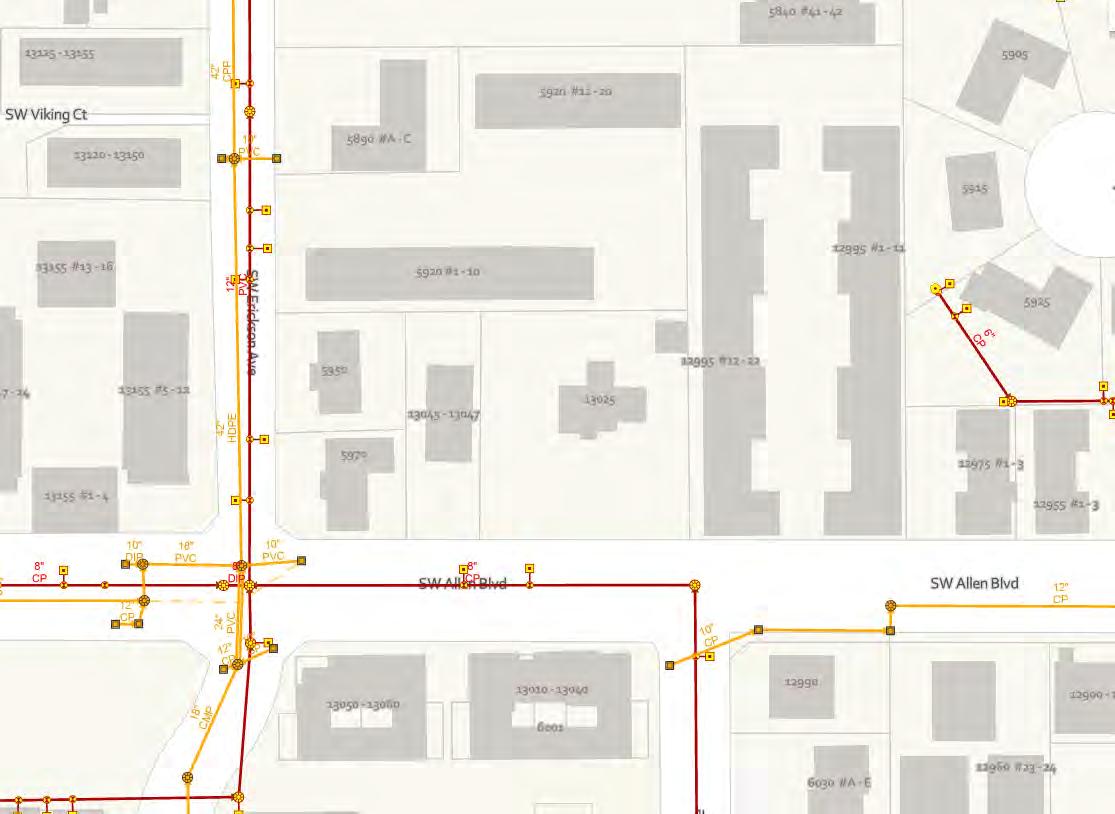
13025 SW Allen Blvd, Beaverton,
OR 97005
Sitewise Online Pop-Facts: Population Quick Facts Pop-Facts: Population Quick Facts 13025 SW Allen Blvd, Beaverton, OR 97005 0 - 1 mi Population 2027 Projection 24,089 2022 Estimate 23,346 2010 Census 21,546 2000 Census 20,609 Growth 2022-2027 3.18% Growth 2010-2022 8.36% Growth 2000-2010 4.54% 2022 Est. Population by Age 23,346 Age 0 to 4 1,514 6.49% Age 5 to 9 1,466 6.28% Age 10 to 14 1,577 6.75% Age 15 to 17 858 3.67% Age 18 to 20 739 3.17% Age 21 to 24 897 3.84% Age 25 to 34 3,252 13.93% Age 35 to 44 3,994 17.11% Age 45 to 54 2,926 12.54% Age 55 to 64 2,343 10.04% Age 65 to 74 1,939 8.31% Age 75 to 84 1,157 4.96% Age 85 and over 682 2.92% Age 16 and over 18,509 79.28% Age 18 and over 17,931 76.81% Age 21 and over 17,192 73.64% Age 65 and over 3,779 16.19% 2022 Est. Median Age 38.43 2022 Est. Average Age 39.25
13025 SW Allen Blvd, Beaverton, OR 97005
2022 Est. Population by Single-Classification Race 23,346 White Alone 14,780 63.31% Black or African American Alone 968 4.15% American Indian and Alaska Native Alone 238 1.02% Asian Alone 1,539 6.59% Native Hawaiian and Other Pacific Islander Alone 111 0.48% Some Other Race Alone 4,518 19.35% Two or More Races 1,192 5.10% 2022 Est. Population by Ethnicity (Hispanic or Latino) 23,346 Hispanic or Latino 7,548 32.33% Not Hispanic or Latino 15,798 67.67% 2022 Est. Population by Sex 23,346 Male 11,438 48.99% Female 11,908 51.01%
13025 SW Allen Blvd, Beaverton, OR 97005 Sitewise Online Pop-Facts: Population Quick Facts Pop-Facts: Population Quick Facts 13025 SW Allen Blvd, Beaverton, OR 97005 0 - 1 mi
Copyright © Claritas, LLC 2022. All rights reserved.
13025 SW Allen Blvd, Beaverton, OR 97005 Sitewise Online Pop-Facts: Household Quick Facts Pop-Facts: Household Quick Facts 13025 SW Allen Blvd, Beaverton, OR 97005 0 - 1 mi Households 2027 Projection 9,987 2022 Estimate 9,639 2010 Census 8,760 2000 Census 8,497 Growth 2022-2027 3.61% Growth 2010-2022 10.04% Growth 2000-2010 3.10% 2022 Est. Households by Household Income 9,639 Income Less than $15,000 887 9.20% Income $15,000 to $24,999 779 8.09% Income $25,000 to $34,999 792 8.21% Income $35,000 to $49,999 1,236 12.82% Income $50,000 to $74,999 1,575 16.34% Income $75,000 to $99,999 1,331 13.81% Income $100,000 to $124,999 985 10.22% Income $125,000 to $149,999 592 6.14% Income $150,000 to $199,999 780 8.09% Income $200,000 to $249,999 427 4.43% Income $250,000 to $499,999 199 2.07% Income $500,000 or more 55 0.57% 2022 Est. Average Household Income $86,872 2022 Est. Median Household Income $67,861 2022 Median HH Inc. by Single-Classification Race White Alone $70,939 Black or African American Alone $73,599 American Indian and Alaska Native Alone $43,410 Asian Alone $61,189 Native Hawaiian and Other Pacific Islander Alone $141,625 Some Other Race Alone $58,778 Two or More Races $67,555 Hispanic or Latino $49,355 Not Hispanic or Latino $75,227 2022 Est. Households by Household Type 9,639 Family Households 5,479 56.84% Nonfamily Households 4,160 43.16% 2022 Est. Group Quarters Population 416
2022 Est. Households by Household Size 9,639 1-person 3,322 34.46% 2-person 2,871 29.78% 3-person 1,413 14.65% 4-person 1,070 11.10% 5-person 555 5.76% 6-person 246 2.55% 7-or-more-person 163 1.69% 2022 Est. Average Household Size 2.38 13025 SW
Sitewise Online Pop-Facts: Household Quick Facts Pop-Facts: Household Quick Facts 13025 SW Allen Blvd, Beaverton, OR 97005 0 - 1 mi
Allen Blvd, Beaverton, OR 97005
© Claritas, LLC 2022. All rights reserved.
2022 Est. HHs by Type by Presence of Own Children 5,479 Married-Couple Family, own children 1,760 32.13% Married-Couple Family, no own children 1,988 36.29% Male Householder, own children 258 4.72% Male Householder, no own children 259 4.73% Female Householder, own children 730 13.33% Female Householder, no own children 483 8.81%
13025 SW Allen
Sitewise Online Pop-Facts: Household Quick Facts Pop-Facts: Household Quick Facts 13025 SW Allen Blvd, Beaverton, OR 97005 0 - 1 mi
Copyright
Blvd, Beaverton, OR 97005
Pop-Facts:
13025 SW Allen Blvd, Beaverton, OR 97005
Sitewise Online
Pop-Facts: Demographic Snapshot (Part 1) 13025 SW Allen Blvd, Beaverton, OR 97005 0 - 1 mi Population 2027 Projection 24,089 2022 Estimate 23,346 2010 Census 21,546 2000 Census 20,609 Growth 2022-2027 3.18% Growth 2010-2022 8.36% Growth 2000-2010 4.54% 2022 Est. Population by Single-Classification Race 23,346 White Alone 14,780 63.31% Black or African American Alone 968 4.15% American Indian and Alaska Native Alone 238 1.02% Asian Alone 1,539 6.59% Native Hawaiian and Other Pacific Islander Alone 111 0.48% Some Other Race Alone 4,518 19.35% Two or More Races 1,192 5.10% 2022 Est. Population Hispanic or Latino by Origin 23,346 Not Hispanic or Latino 15,798 67.67% Hispanic or Latino 7,548 32.33% Hispanic or Latino by Origin 7,548 Mexican 5,893 78.08% Puerto Rican 76 1.00% Cuban 72 0.95% All Other Hispanic or Latino 1,507 19.96% 2022 Est. Hisp. or Latino Pop by Single-Classification Race 7,548 White Alone 2,560 33.91% Black or African American Alone 51 0.68% American Indian and Alaska Native Alone 101 1.33% Asian Alone 20 0.26% Native Hawaiian and Other Pacific Islander Alone 3 0.04% Some Other Race Alone 4,466 59.17% Two or More Races 347 4.60%
Demographic Snapshot (Part 1)
2022 Est. Pop by Race, Asian Alone, by Category 1,539 Chinese, except Taiwanese 314 20.38% Filipino 320 20.80% Japanese 151 9.82% Asian Indian 126 8.21% Korean 232 15.09% Vietnamese 188 12.25% Cambodian 37 2.40% Hmong 1 0.06% Laotian 38 2.46% Thai 84 5.47% All other Asian Races, including 2 or more 47 3.07% 2022 Est. Population by Ancestry 23,346 Arab 19 0.08% Czech 57 0.24% Danish 81 0.35% Dutch 287 1.23% English 1,408 6.03% French (except Basque) 353 1.51% French Canadian 172 0.74% German 2,165 9.27% Greek 124 0.53% Hungarian 77 0.33% Irish 1,785 7.65% Italian 512 2.19% Lithuanian 25 0.11% Norwegian 709 3.04% Polish 322 1.38% Portuguese 61 0.26% Russian 82 0.35% Scottish 501 2.15% Scotch-Irish 180 0.77% Slovak 19 0.08% Subsaharan African 248 1.06% Swedish 368 1.58% Swiss 67 0.29% Ukrainian 91 0.39% United States or American 725 3.11% Welsh 178 0.76% West Indian (except Hisp. groups) 0 0.00% Other Ancestries 9,992 42.80% Ancestry Unclassified 2,738 11.73% 2022 Est. Pop Age 5+ by Language Spoken At Home 21,832
Pop-Facts:
Pop-Facts: Demographic Snapshot (Part 1) 13025 SW Allen Blvd, Beaverton, OR 97005 0 - 1 mi
13025 SW Allen Blvd, Beaverton, OR 97005 Sitewise Online
Demographic Snapshot (Part 1)
Speak only English 14,460 66.23% Speak Asian or Pacific Island Language 1,012 4.64% Speak IndoEuropean Language 799 3.66% Speak Spanish 5,233 23.97% Speak Other Language 328 1.50% 13025 SW Allen Blvd, Beaverton, OR 97005 Sitewise Online Pop-Facts: Demographic Snapshot (Part 1) Pop-Facts: Demographic Snapshot (Part 1) 13025 SW Allen Blvd, Beaverton, OR 97005 0 - 1 mi
2022 Est. Population by Sex 23,346 Male 11,438 48.99% Female 11,908 51.01% 2022 Est. Population by Age 23,346 Age 0 to 4 1,514 6.49% Age 5 to 9 1,466 6.28% Age 10 to 14 1,577 6.75% Age 15 to 17 858 3.67% Age 18 to 20 739 3.17% Age 21 to 24 897 3.84% Age 25 to 34 3,252 13.93% Age 35 to 44 3,994 17.11% Age 45 to 54 2,926 12.54% Age 55 to 64 2,343 10.04% Age 65 to 74 1,939 8.31% Age 75 to 84 1,157 4.96% Age 85 and over 682 2.92% Age 16 and over 18,509 79.28% Age 18 and over 17,931 76.81% Age 21 and over 17,192 73.64% Age 65 and over 3,779 16.19% 2022 Est. Median Age 38.43 2022 Est. Average Age 39.25
13025 SW Allen Blvd, Beaverton, OR 97005 Sitewise Online
Pop-Facts:
13025
0 - 1 mi
Pop-Facts: Demographic Snapshot (Part 1)
Demographic Snapshot (Part 1)
SW Allen Blvd, Beaverton, OR 97005
2022 Est. Male Population by Age 11,438 Age 0 to 4 729 6.38% Age 5 to 9 752 6.57% Age 10 to 14 809 7.07% Age 15 to 17 443 3.87% Age 18 to 20 389 3.40% Age 21 to 24 479 4.19% Age 25 to 34 1,661 14.52% Age 35 to 44 2,072 18.12% Age 45 to 54 1,507 13.18% Age 55 to 64 1,142 9.98% Age 65 to 74 847 7.40% Age 75 to 84 424 3.71% Age 85 and over 183 1.60% 2022 Est. Median Age, Male 37.21 2022 Est. Average Age, Male 37.52 2022 Est. Female Population by Age 11,908 Age 0 to 4 785 6.59% Age 5 to 9 714 6.00% Age 10 to 14 768 6.45% Age 15 to 17 415 3.48% Age 18 to 20 350 2.94% Age 21 to 24 418 3.51% Age 25 to 34 1,591 13.36% Age 35 to 44 1,922 16.14% Age 45 to 54 1,419 11.92% Age 55 to 64 1,201 10.09% Age 65 to 74 1,093 9.17% Age 75 to 84 733 6.16% Age 85 and over 499 4.19% 2022 Est. Median Age, Female 39.75 2022 Est. Average Age, Female 40.92
13025 SW Allen Blvd, Beaverton, OR 97005 Sitewise Online
Pop-Facts: Demographic Snapshot (Part 1) 13025 SW Allen Blvd, Beaverton, OR 97005 0 - 1 mi
Pop-Facts: Demographic Snapshot (Part 1)
2022 Est. Pop Age 15+ by Marital Status 18,789 Total, Never Married 6,819 36.29% Males, Never Married 3,875 20.62% Females, Never Married 2,944 15.67% Married, Spouse present 7,827 41.66% Married, Spouse absent 906 4.82% Widowed 881 4.69% Males, Widowed 148 0.79% Females, Widowed 733 3.90% Divorced 2,356 12.54% Males, Divorced 818 4.35% Females, Divorced 1,539 8.19% 2022 Est. Pop Age 25+ by Edu. Attainment 16,295 Less than 9th grade 1,300 7.98% Some High School, no diploma 1,003 6.16% High School Graduate (or GED) 3,480 21.35% Some College, no degree 3,774 23.16% Associate Degree 1,264 7.76% Bachelor's Degree 3,823 23.46% Master's Degree 1,080 6.63% Professional School Degree 364 2.23% Doctorate Degree 208 1.27% 2022 Est. Pop. Age 25+ by Edu. Attain., Hisp./Lat. 4,043 No High School Diploma 1,884 46.60% High School Graduate 1,114 27.56% Some College or Associate's Degree 675 16.69% Bachelor's Degree or Higher 370 9.14% Copyright © Claritas, LLC 2022. All rights reserved.
97005 Sitewise Online Pop-Facts: Demographic Snapshot (Part 1) Pop-Facts: Demographic Snapshot (Part 1) 13025 SW Allen Blvd, Beaverton, OR 97005 0 - 1 mi
13025 SW Allen Blvd, Beaverton, OR
13025 SW Allen
Sitewise Online Pop-Facts: Demographic Snapshot (Part 2) Pop-Facts: Demographic Snapshot (Part 2) 13025 SW Allen Blvd, Beaverton, OR 97005 0 - 1 mi Households 2027 Projection 9,987 2022 Estimate 9,639 2010 Census 8,760 2000 Census 8,497 Growth 2022-2027 3.61% Growth 2010-2022 10.04% Growth 2000-2010 3.10% 2022 Est. Households by Household Type 9,639 Family Households 5,479 56.84% Nonfamily Households 4,160 43.16% 2022 Est. Group Quarters Population 416 2022 HHs by Ethnicity: Hispanic/Latino 2,016 20.92% 2022 Est. Households by HH Income 9,639 Income < $15,000 887 9.20% Income $15,000 to $24,999 779 8.09% Income $25,000 to $34,999 792 8.21% Income $35,000 to $49,999 1,236 12.82% Income $50,000 to $74,999 1,575 16.34% Income $75,000 to $99,999 1,331 13.81% Income $100,000 to $124,999 985 10.22% Income $125,000 to $149,999 592 6.14% Income $150,000 to $199,999 780 8.09% Income $200,000 to $249,999 427 4.43% Income $250,000 to $499,999 199 2.07% Income $500,000+ 55 0.57% 2022 Est. Average Household Income $86,872 2022 Est. Median Household Income $67,861 2022 Median HH Income by Single-Class. Race or Ethn. White Alone $70,939 Black or African American Alone $73,599 American Indian and Alaska Native Alone $43,410 Asian Alone $61,189 Native Hawaiian and Other Pacific Islander Alone $141,625 Some Other Race Alone $58,778 Two or More Races $67,555 Hispanic or Latino $49,355
Blvd, Beaverton, OR 97005
13025 SW Allen Blvd, Beaverton, OR 97005 Sitewise Online
Pop-Facts: Demographic Snapshot (Part 2)
Pop-Facts: Demographic Snapshot (Part 2)
13025 SW Allen Blvd, Beaverton, OR 97005 0 - 1 mi
Not Hispanic or Latino $75,227
Pop-Facts: Demographic Snapshot (Part 2)
2022 Est. Family HH Type by Presence of Own Children 5,479 Married-Couple Family, own children 1,760 32.13% Married-Couple Family, no own children 1,988 36.29% Male Householder, own children 258 4.72% Male Householder, no own children 259 4.73% Female Householder, own children 730 13.33% Female Householder, no own children 483 8.81% 2022 Est. Households by Household Size 9,639 1-person 3,322 34.46% 2-person 2,871 29.78% 3-person 1,413 14.65% 4-person 1,070 11.10% 5-person 555 5.76% 6-person 246 2.55% 7-or-more-person 163 1.69% 2022 Est. Average Household Size 2.38 2022 Est. Households by Presence of People Under 18 9,639 Households with 1 or more People under Age 18 2,990 31.02% Households with No People under Age 18 6,649 68.98% Households with 1 or more People under Age 18 2,990 Married-Couple Family 1,824 60.99% Other Family, Male Householder 308 10.32% Other Family, Female Householder 814 27.21% Nonfamily, Male Householder 35 1.17% Nonfamily, Female Householder 9 0.31% Households with No People under Age 18 6,649 Married-Couple Family 1,927 28.98% Other Family, Male Householder 211 3.17% Other Family, Female Householder 398 5.98% Nonfamily, Male Householder 1,739 26.15% Nonfamily, Female Householder 2,375 35.72%
13025 SW Allen Blvd, Beaverton, OR 97005 Sitewise Online
Pop-Facts:
13025
0 - 1 mi
Demographic Snapshot (Part 2)
SW Allen Blvd, Beaverton, OR 97005
2022 Est. Households by Number of Vehicles 9,639 No Vehicles 1,100 11.41% 1 Vehicle 3,961 41.10% 2 Vehicles 3,142 32.60% 3 Vehicles 944 9.79% 4 Vehicles 381 3.96% 5 or more Vehicles 111 1.16% 2022 Est. Average Number of Vehicles 1.58 Family Households 2027 Projection 5,670 2022 Estimate 5,479 2010 Census 4,996 2000 Census 4,838 Growth 2022-2027 3.49% Growth 2010-2022 9.66% Growth 2000-2010 3.27% 2022 Est. Families by Poverty Status 5,479 2022 Families at or Above Poverty 4,954 90.43% 2022 Families at or Above Poverty with Children 1,957 35.72% 2022 Families Below Poverty 524 9.57% 2022 Families Below Poverty with Children 428 7.82% 2022 Est. Pop Age 16+ by Employment Status 18,509 In Armed Forces 474 2.56% Civilian - Employed 11,592 62.63% Civilian - Unemployed 709 3.83% Not in Labor Force 5,734 30.98% 2022 Est. Civ. Employed Pop 16+ by Class of Worker 11,778 For-Profit Private Workers 8,840 75.05% Non-Profit Private Workers 996 8.46% Local Government Workers 471 4.00% State Government Workers 289 2.45% Federal Government Workers 139 1.18% Self-Employed Workers 1,040 8.83% Unpaid Family Workers 4 0.03%
Pop-Facts: Demographic
(Part 2) Pop-Facts: Demographic Snapshot (Part 2) 13025 SW Allen Blvd, Beaverton, OR 97005 0 - 1 mi
13025 SW Allen Blvd, Beaverton, OR 97005 Sitewise Online
Snapshot
2022 Est. Civ. Employed Pop 16+ by Occupation 11,778 Architect/Engineer 254 2.16% Arts/Entertainment/Sports 343 2.91% Building Grounds Maintenance 612 5.19% Business/Financial Operations 743 6.31% Community/Social Services 238 2.02% Computer/Mathematical 538 4.57% Construction/Extraction 724 6.14% Education/Training/Library 536 4.55% Farming/Fishing/Forestry 50 0.42% Food Prep/Serving 918 7.79% Healthcare Practitioner/Technician 451 3.83% Healthcare Support 458 3.89% Maintenance Repair 266 2.26% Legal 72 0.61% Life/Physical/Social Science 75 0.63% Management 1,017 8.63% Office/Admin. Support 1,434 12.17% Production 570 4.84% Protective Service 62 0.53% Sales/Related 1,146 9.73% Personal Care/Service 395 3.35% Transportation/Moving 878 7.45% 2022 Est. Pop 16+ by Occupation Classification 11,778 Blue Collar 2,438 20.70% White Collar 6,846 58.13% Service & Farm 2,494 21.18% 2022 Est. Workers Age 16+ by Transp. To Work 11,882 Drove Alone 7,498 63.10% Car Pooled 1,421 11.96% Public Transportation 1,348 11.34% Walked 423 3.56% Bicycle 305 2.57% Other Means 218 1.84% Worked at Home 668 5.62% 2022 Est. Workers Age 16+ by Travel Time to Work* Less than 15 minutes 2,632 15 to 29 Minutes 4,300 30 to 44 Minutes 2,648 45 to 59 Minutes 759 60 or more Minutes 922
Pop-Facts: Demographic Snapshot (Part 2) 13025 SW Allen Blvd, Beaverton, OR 97005 0 - 1 mi
13025 SW Allen Blvd, Beaverton, OR 97005
Sitewise Online Pop-Facts:
Demographic Snapshot (Part 2)
2022 Est. Avg. Travel Time to Work in Minutes* 28.74 2022 Est. Occupied Housing Units by Tenure 9,639 Owner-Occupied 4,248 44.07% Renter-Occupied 5,391 55.93% 2022 Occupied Housing Units: Avg. Length of Residence Owner-Occupied 13 Renter-Occupied 6 13025 SW Allen Blvd, Beaverton, OR 97005 Sitewise Online Pop-Facts: Demographic Snapshot (Part 2) Pop-Facts: Demographic Snapshot (Part 2) 13025 SW Allen Blvd, Beaverton, OR 97005 0 - 1 mi
2022 Est. Owner Occupied Housing Units by Value 4,248 Value Less than $20,000 50 1.18% Value $20,000 to $39,999 57 1.34% Value $40,000 to $59,999 2 0.04% Value $60,000 to $79,999 14 0.34% Value $80,000 to $99,999 28 0.65% Value $100,000 to $149,999 56 1.33% Value $150,000 to $199,999 89 2.09% Value $200,000 to $299,999 238 5.61% Value $300,000 to $399,999 1,044 24.57% Value $400,000 to $499,999 1,231 28.98% Value $500,000 to $749,999 1,074 25.28% Value $750,000 to $999,999 297 6.99% Value $1,000,000 to $1,499,999 25 0.59% Value $1,500,000 to $1,999,999 7 0.17% Value $2,000,000 or more 36 0.86% 2022 Est. Median All Owner-Occupied Housing Unit Value $444,379 2022 Est. Housing Units by Units in Structure 10,172 1 Unit Attached 1,171 11.51% 1 Unit Detached 3,965 38.98% 2 Units 485 4.76% 3 or 4 Units 1,119 11.01% 5 to 19 Units 1,701 16.73% 20 to 49 Units 765 7.52% 50 or More Units 816 8.02% Mobile Home or Trailer 139 1.36% Boat, RV, Van, etc. 11 0.11% Dominant structure type 1 Unit Detached 2022 Est. Housing Units by Year Structure Built 10,172 Housing Units Built 2014 or Later 849 8.34% Housing Units Built 2010 to 2013 203 2.00% Housing Units Built 2000 to 2009 291 2.86% Housing Units Built 1990 to 1999 840 8.25% Housing Units Built 1980 to 1989 1,193 11.72% Housing Units Built 1970 to 1979 3,251 31.96% Housing Units Built 1960 to 1969 1,780 17.50% Housing Units Built 1950 to 1959 1,013 9.95% Housing Units Built 1940 to 1949 513 5.05% Housing Units Built 1939 or Earlier 239 2.35% 2022 Est. Median Year Structure Built** 1975 Dominant Year Structure Built 1970 to 1979 13025 SW Allen Blvd, Beaverton, OR 97005 Sitewise Online Pop-Facts: Demographic Snapshot (Part 2) Pop-Facts: Demographic Snapshot (Part 2) 13025 SW Allen Blvd, Beaverton, OR 97005 0 - 1 mi
13025 SW Allen Blvd, Beaverton, OR 97005 Sitewise Online
Pop-Facts: Demographic Snapshot (Part 2)
Pop-Facts: Demographic Snapshot (Part 2)
Copyright © Claritas, LLC 2022. All rights reserved.
* This row intentionally left blank. No Total Category.
**1939 will appear when at least half of the Housing Units in this reports area were built in 1939 or earlier.
13025 SW Allen Blvd, Beaverton, OR 97005 0 - 1 mi
13025 SW Allen Blvd, Beaverton, OR 97005 Sitewise Online Pop-Facts: Census Demographic Overview (Part 1) Pop-Facts: Census Demographic Overview (Part 1) 13025 SW Allen Blvd, Beaverton, OR 97005 0 - 1 mi Population 2027 Projection 24,089 2022 Estimate 23,346 2010 Census 21,546 2000 Census 20,609 Growth 2022-2027 3.18% Growth 2010-2022 8.36% Growth 2000-2010 4.54% 2010 Population by Single-Classification Race 21,546 White Alone 15,019 69.71% Black or African American Alone 643 2.98% American Indian and Alaska Native Alone 208 0.97% Asian Alone 1,177 5.46% Native Hawaiian and Other Pacific Islander Alone 113 0.52% Some Other Race Alone 3,409 15.82% Two or More Races 976 4.53% 2010 Population By Ethnicity 21,546 Not Hispanic or Latino 15,430 71.62% Hispanic or Latino 6,115 28.38% 2010 Hispanic or Latino by Single-Classification Race 6,115 White Alone 2,292 37.48% Black or African American Alone 47 0.77% American Indian and Alaska Native Alone 90 1.47% Asian Alone 16 0.27% Native Hawaiian and Other Pacific Islander Alone 4 0.06% Some Other Race Alone 3,366 55.04% Two or More Races 300 4.91% 2010 Population by Sex 21,546 Male 10,413 48.33% Female 11,133 51.67% Male/Female Ratio 0.94
Pop-Facts: Census Demographic Overview (Part 1)
2010 Population by Age 21,546 Age 0 to 4 1,748 8.11% Age 5 to 9 1,389 6.45% Age 10 to 14 1,227 5.70% Age 15 to 17 750 3.48% Age 18 to 20 724 3.36% Age 21 to 24 1,185 5.50% Age 25 to 34 3,729 17.31% Age 35 to 44 3,012 13.98% Age 45 to 54 2,648 12.29% Age 55 to 64 2,212 10.26% Age 65 to 74 1,327 6.16% Age 75 to 84 919 4.26% Age 85 and over 677 3.14% Age 16 and over 16,906 78.47% Age 18 and over 16,432 76.26% Age 21 and over 15,708 72.91% Age 65 and over 2,922 13.56% 2010 Median Age 35.07
13025 SW Allen Blvd, Beaverton, OR 97005 Sitewise
Online
Pop-Facts: Census Demographic Overview (Part 1) 13025 SW Allen Blvd, Beaverton, OR 97005 0 - 1 mi
© Claritas, LLC 2022. All rights reserved.
2010 Male Population by Age 10,413 Age 0 to 4 879 8.44% Age 5 to 9 714 6.86% Age 10 to 14 650 6.24% Age 15 to 17 358 3.44% Age 18 to 20 379 3.64% Age 21 to 24 613 5.88% Age 25 to 34 1,900 18.25% Age 35 to 44 1,587 15.24% Age 45 to 54 1,300 12.48% Age 55 to 64 1,005 9.66% Age 65 to 74 545 5.23% Age 75 to 84 314 3.02% Age 85 and over 169 1.62% 2010 Median Age, Male 33.49 2010 Female Population by Age 11,133 Age 0 to 4 869 7.80% Age 5 to 9 675 6.06% Age 10 to 14 577 5.19% Age 15 to 17 392 3.52% Age 18 to 20 345 3.10% Age 21 to 24 572 5.14% Age 25 to 34 1,829 16.43% Age 35 to 44 1,425 12.80% Age 45 to 54 1,348 12.11% Age 55 to 64 1,206 10.83% Age 65 to 74 782 7.02% Age 75 to 84 605 5.43% Age 85 and over 508 4.56% 2010 Median Age, Female 37.16
13025 SW Allen Blvd, Beaverton, OR 97005 Sitewise Online Pop-Facts: Census Demographic Overview (Part 1) Pop-Facts: Census Demographic Overview (Part 1) 13025 SW Allen Blvd, Beaverton, OR 97005 0 - 1 mi
Copyright
13025 SW
Sitewise Online Pop-Facts: Census Demographic Overview (Part 2) Pop-Facts: Census Demographic Overview (Part 2) 13025 SW Allen Blvd, Beaverton, OR 97005 0 - 1 mi Households 2027 Projection 9,987 2022 Estimate 9,639 2010 Census 8,760 2000 Census 8,497 Growth 2022-2027 3.61% Growth 2010-2022 10.04% Growth 2000-2010 3.10% 2010 Households by Household Type 8,760 Family Households 4,996 57.04% Non-family Households 3,764 42.96% 2010 Group Quarters Population 380 2010 Hispanic or Latino Households 1,562 17.84% 2010 Households by Household Size 8,760 1-person 2,925 33.39% 2-person 2,636 30.09% 3-person 1,276 14.57% 4-person 1,002 11.44% 5-person 532 6.07% 6-person 220 2.52% 7-or-more-person 168 1.92%
Allen Blvd, Beaverton, OR 97005
2010 Households by Type and Presence of Children 8,760 Married-Couple Family, own children 1,612 18.40% Male Householder, own children 238 2.71% Female Householder, own children 660 7.53% Married-Couple Family, no own children 1,816 20.73% Male Householder, no own children 233 2.66% Female Householder, no own children 438 4.99% Non-family Households 3,764 42.96% 2010 Households by Presence of People Under Age 18 8,760 HH with 1 or More People Under Age 18: 2,732 31.19% Households with No People Under Age 18: 6,028 68.81% HH with 1 or More People Under Age 18: 2,732 Married-Couple Family 1,672 61.19% Other Family, Male Householder 282 10.31% Other Family, Female Householder 737 26.97% Nonfamily, Male Householder 33 1.20% Nonfamily, Female Householder 9 0.34% Households with No People Under Age 18: 6,028 Married-Couple Family 1,756 29.13% Other Family, Male Householder 189 3.14% Other Family, Female Householder 361 5.99% Nonfamily, Male Householder 1,579 26.20% Nonfamily, Female Householder 2,142 35.54% 2010 Occupied Housing Units by Tenure 8,760 Owner-Occupied 3,888 44.38% Renter-Occupied 4,872 55.62% Copyright
13025 SW Allen Blvd,
Sitewise Online Pop-Facts: Census Demographic Overview (Part 2) Pop-Facts: Census Demographic Overview (Part 2) 13025 SW Allen Blvd, Beaverton, OR 97005 0 - 1 mi
© Claritas, LLC 2022. All rights reserved.
Beaverton, OR 97005
13025 SW Allen Blvd, Beaverton, OR 97005 Sitewise Online Retail Market Power Opportunity Gap Report By Retail Store Types Retail Market Power Opportunity Gap Report By Retail Store Types 13025 SW Allen Blvd, Beaverton, OR 97005 0 - 1 mi 2022 Demand 2022 Supply Opportunity Gap/Surplus Total retail trade including food and drink (NAICS 44, 45 and 722) $425,156,019 $636,335,217 -$211,179,195 Total retail trade (NAICS 44 and 45) $378,582,828 $578,129,851 -$199,547,024 Motor vehicle and parts dealers (NAICS 441) $84,720,840 $149,247,271 -$64,526,431 Automobile dealers (NAICS 4411) $71,522,352 $142,418,485 -$70,896,133 New car dealers (NAICS 44111) $63,567,327 $135,486,286 -$71,918,959 Used car dealers (NAICS 44112) $7,955,026 $6,932,199 $1,022,827 Other motor vehicle dealers (NAICS 4412) $7,261,698 $6,105,826 $1,155,872 Recreational vehicle dealers (NAICS 44121) $2,806,998 $2,361,970 $445,028 Motorcycle, boat, and other motor vehicle dealers (NAICS 44122) $4,454,700 $3,743,857 $710,843 Boat dealers (NAICS 441222) $1,675,473 $ 0 $1,675,473 Motorcycle, ATV, and all other motor vehicle dealers (NAICS 441228) $2,779,227 $3,743,857 -$964,629 Automotive parts, accessories, and tire stores (NAICS 4413) $5,936,790 $722,960 $5,213,830 Automotive parts and accessories stores (NAICS 44131) $3,753,217 $558,833 $3,194,384 Tire dealers (NAICS 44132) $2,183,573 $164,127 $2,019,445 Furniture and home furnishings stores (NAICS 442) $7,572,540 $16,507,494 -$8,934,955 Furniture stores (NAICS 4421) $4,096,499 $3,464,210 $632,290 Home furnishings stores (NAICS 4422) $3,476,040 $13,043,285 -$9,567,244 Floor covering stores (NAICS 44221) $1,671,905 $4,747,383 -$3,075,478 Other home furnishings stores (NAICS 44229) $1,804,136 $8,295,902 -$6,491,766 Window treatment stores (NAICS 442291) $ 92,607 $144,245 -$51,639 All other home furnishings stores (NAICS 442299) $1,711,529 $8,151,657 -$6,440,127 Electronics and appliance stores (NAICS 443) $4,967,454 $22,985,947 -$18,018,493 Household appliance stores (NAICS 443141) $1,190,215 $5,465,388 -$4,275,173 Electronics stores (NAICS 443142) $3,777,239 $17,520,559 -$13,743,320 Building material and garden equipment and supplies dealers (NAICS 444) $27,485,763 $31,996,445 -$4,510,681 Building material and supplies dealers (NAICS 4441) $23,727,949 $31,377,408 -$7,649,459 Home centers (NAICS 44411) $13,125,690 $11,629,671 $1,496,019 Paint and wallpaper stores (NAICS 44412) $804,711 $493,259 $311,452 Hardware stores (NAICS 44413) $2,082,071 $1,069,999 $1,012,071 Other building material dealers (NAICS 44419) $7,715,477 $18,184,478 -$10,469,001 Lawn and garden equipment and supplies stores (NAICS 4442) $3,757,814 $619,037 $3,138,776 Outdoor power equipment stores (NAICS 44421) $763,062 $ 0 $763,062 Nursery, garden center, and farm supply stores (NAICS 44422) $2,994,752 $619,037 $2,375,715 Food and beverage stores (NAICS 445) $57,265,481 $66,779,239 -$9,513,757 Grocery stores (NAICS 4451) $50,981,865 $64,280,679 -$13,298,813 Supermarkets and other grocery (except convenience) stores (NAICS 44511) $48,886,362 $55,761,846 -$6,875,485 Convenience stores (NAICS 44512) $2,095,505 $8,518,832 -$6,423,327 Specialty food stores (NAICS 4452) $1,488,687 $1,163,040 $325,647
Meat markets (NAICS 44521) $450,473 $154,432 $296,041 Fish and seafood markets (NAICS 44522) $177,278 $ 19,337 $157,941 Fruit and vegetable markets (NAICS 44523) $308,397 $ 91,899 $216,499 Other specialty food stores (NAICS 44529) $552,539 $897,373 -$344,834 Baked goods and confectionery and nut stores (NAICS 445291 + 445292) $293,284 $299,090 -$ 5,806 All other specialty food stores (NAICS 445299) $259,255 $598,283 -$339,027 Beer, wine, and liquor stores (NAICS 4453) $4,794,928 $1,335,520 $3,459,409 Health and personal care stores (NAICS 446) $22,465,289 $15,617,119 $6,848,169 Pharmacies and drug stores (NAICS 44611) $19,528,027 $9,592,175 $9,935,852 Cosmetics, beauty supplies, and perfume stores (NAICS 44612) $1,305,205 $3,181,960 -$1,876,755 Optical goods stores (NAICS 44613) $592,424 $1,180,799 -$588,375 Other health and personal care stores (NAICS 44619) $1,039,632 $1,662,185 -$622,553 Food (health) supplement stores (NAICS 446191) $369,635 $1,441,039 -$1,071,404 All other health and personal care stores (NAICS 446199) $669,998 $221,146 $448,852 Gasoline stations (NAICS 447) $30,697,177 $12,092,020 $18,605,157 Clothing and clothing accessories stores (NAICS 448) $14,748,997 $23,068,508 -$8,319,512 Clothing stores (NAICS 4481) $9,655,009 $15,580,310 -$5,925,301 Men's clothing stores (NAICS 44811) $445,000 $247,769 $197,231 Women's clothing stores (NAICS 44812) $1,710,458 $2,330,909 -$620,451 Children's and infants' clothing stores (NAICS 44813) $327,737 $858,420 -$530,682 Family clothing stores (NAICS 44814) $5,807,087 $9,804,157 -$3,997,070 Clothing accessories stores (NAICS 44815) $476,588 $1,785,636 -$1,309,047 Other clothing stores (NAICS 44819) $888,137 $553,419 $334,718 Shoe stores (NAICS 4482) $2,119,854 $3,853,068 -$1,733,213 Jewelry, luggage, and leather goods stores (NAICS 4483) $2,974,134 $3,635,131 -$660,997 Jewelry stores (NAICS 44831) $1,914,966 $1,407,633 $507,334 Luggage and leather goods stores (NAICS 44832) $1,059,167 $2,227,498 -$1,168,331 Sporting goods, hobby, musical instrument, and book stores (NAICS 451) $5,808,356 $11,770,434 -$5,962,078 Sporting goods, hobby, and musical instrument stores (NAICS 4511) $5,237,795 $10,386,070 -$5,148,274 Sporting goods stores (NAICS 45111) $3,806,093 $6,207,956 -$2,401,862 Hobby, toy, and game stores (NAICS 45112) $1,029,680 $2,685,823 -$1,656,142 Sewing, needlework, and piece goods stores (NAICS 45113) $176,050 $990,177 -$814,127 Musical instrument and supplies stores (NAICS 45114) $225,972 $502,115 -$276,143 Book stores and news dealers (NAICS 4512) $570,561 $1,384,365 -$813,804 Book stores (NAICS 451211) $529,270 $1,384,365 -$855,094 News dealers and newsstands (NAICS 451212) $ 41,290 $ 0 $ 41,290 General merchandise stores (NAICS 452) $48,830,404 $94,378,818 -$45,548,415 Department stores (NAICS 4522) $5,978,821 $1,856,145 $4,122,676 Other general merchandise stores (NAICS 4523) $42,851,583 $92,522,673 -$49,671,091 Warehouse clubs and supercenters (NAICS 452311) $38,761,865 $91,800,585 -$53,038,719 All other general merchandise stores (NAICS 452319) $4,089,717 $722,089 $3,367,628 13025 SW Allen Blvd, Beaverton, OR 97005 Sitewise Online Retail Market Power Opportunity Gap Report By Retail Store Types Retail Market Power Opportunity Gap Report By Retail Store Types 13025 SW Allen Blvd, Beaverton, OR 97005 0 - 1 mi 2022 Demand 2022 Supply Opportunity Gap/Surplus
* GAFO (General merchandise, Apparel, Furniture and Other) represents sales at stores that sell merchandise normally sold in department stores. This category is not included in Total Retail Sales Including Eating and Drinking Places.
Miscellaneous store retailers (NAICS 453) $8,236,583 $17,662,559 -$9,425,976 Florists (NAICS 4531) $377,085 $363,459 $ 13,626 Office supplies, stationery, and gift stores (NAICS 4532) $1,781,791 $2,602,767 -$820,976 Office supplies and stationery stores (NAICS 45321) $746,975 $771,252 -$24,277 Gift, novelty, and souvenir stores (NAICS 45322) $1,034,817 $1,831,515 -$796,698 Used merchandise stores (NAICS 4533) $1,180,743 $4,455,195 -$3,274,452 Other miscellaneous store retailers (NAICS 4539) $4,896,964 $10,241,139 -$5,344,175 Pet and pet supplies stores (NAICS 45391) $1,478,094 $5,104,845 -$3,626,751 Art dealers (NAICS 45392) $762,666 $ 29,764 $732,902 Manufactured (mobile) home dealers (NAICS 45393) $484,420 $1,234,695 -$750,275 All other miscellaneous store retailers (NAICS 45399) $2,171,785 $3,871,835 -$1,700,050 Tobacco stores (NAICS 453991) $658,668 $2,091,423 -$1,432,755 All other miscellaneous store retailers (except tobacco stores) (NAICS 453998) $1,513,117 $1,780,412 -$267,295 Non-store retailers (NAICS 454) $65,783,944 $116,023,994 -$50,240,052 Electronic shopping and mail-order houses (NAICS 4541) $62,256,782 $116,023,994 -$53,767,209 Vending machine operators (NAICS 4542) $474,782 $ 0 $474,782 Direct selling establishments (NAICS 4543) $3,052,381 $ 0 $3,052,381 Fuel dealers (NAICS 45431) $1,510,918 $ 0 $1,510,918 Other direct selling establishments (NAICS 45439) $1,541,463 $ 0 $1,541,463 Food services and drinking places (NAICS 722) $46,573,190 $58,205,368 -$11,632,177 Special food services (NAICS 7223) $3,722,659 $1,221,133 $2,501,526 Food service contractors (NAICS 72231) $2,944,407 $938,845 $2,005,562 Caterers (NAICS 72232) $709,042 $ 0 $709,042 Mobile food services (NAICS 72233) $ 69,209 $282,288 -$213,079 Drinking places (alcoholic beverages) (NAICS 7224) $1,510,145 $3,963,112 -$2,452,967 Restaurants and other eating places (NAICS 7225) $41,340,386 $53,021,123 -$11,680,736 Full-service restaurants (NAICS 722511) $20,686,536 $26,283,216 -$5,596,680 Limited-service restaurants (NAICS 722513) $17,524,569 $17,912,961 -$388,393 Cafeterias, grill buffets, and buffets (NAICS 722514) $446,700 $1,093,924 -$647,224 Snack and nonalcoholic beverage bars (NAICS 722515) $2,682,581 $7,731,021 -$5,048,440 GAFO* $81,929,533 $168,713,805 -$86,784,273 General Merchandise Stores-452 $48,830,404 $94,378,818 -$45,548,415 Clothing & Clothing Accessories Stores-448 $14,748,997 $23,068,508 -$8,319,512 Furniture & Home Furnishings Stores-442 $7,572,540 $16,507,494 -$8,934,955 Electronics & Appliance Stores-443 $4,967,454 $22,985,947 -$18,018,493 Sporting Goods, Hobby, Book, Music Stores-451 $5,808,356 $11,770,434 -$5,962,078 Office Supplies, Stationery, Gift Stores-4532 $1,781,791 $2,602,767 -$820,976
13025 SW Allen Blvd,
Sitewise Online Retail Market Power Opportunity Gap Report By Retail Store Types Retail Market Power Opportunity Gap Report By Retail Store Types 13025 SW Allen Blvd, Beaverton, OR 97005 0 - 1 mi 2022 Demand 2022 Supply Opportunity Gap/Surplus
Beaverton, OR 97005
13025 SW Allen Blvd, Beaverton, OR 97005 Sitewise Online
Retail Market Power Opportunity Gap Report By Retail Store Types
Retail Market Power Opportunity Gap Report
By Retail Store Types
Retail Market Power data is derived from two major sources of information. The demand data is derived from the Consumer Expenditure Survey (CE Survey or CEX), which is fielded by the U.S. Bureau of Labor Statistics (BLS). The supply data is derived from the Census of Retail Trade (CRT), which is made available by the U.S. Census. Additional data sources are incorporated to create both supply and demand estimates. The difference between demand and supply represents the opportunity gap or surplus available for each merchandise line in the specified reporting geography. When this difference is positive (demand is greater than the supply), there is an opportunity gap for that merchandise line; when the difference is negative (supply is greater than demand), there is a surplus.
Copyright © 2022 Environics Analytics. All rights reserved.
13025 SW Allen Blvd, Beaverton, OR 97005 0 - 1 mi 2022 Demand 2022 Supply Opportunity Gap/Surplus


 Powered by Sitewise
Data Source: Kalibrate TrafficMetrix
Powered by Sitewise
Data Source: Kalibrate TrafficMetrix