Vol-5 Issue-2 2019
IJARIIE-ISSN(O)-2395-4396
Generation of Short Duration Isohyetal Maps For Raichur District Karnataka 1
Mohammed Badiuddin Parvez, 2M .Inayathulla
1. Research Scholar, Department of Civil Engineering ,UVCE, Bangalore University, Bangalore ,Karnataka, India. 2. Professor, Department of Civil Engineering ,UVCE, Bangalore University, Bangalore ,Karnataka, India. ABSTRACT Estimation of rainfall intensity is often needed for the planning of hydraulic and water resources engineering management structures. Everyone knows that it rains, runoff is generated for a design purpose we should know how much depth often it rains on our project location. In raichur district log normal distribution is used to estimate the rainfall depth using 25 raingauge stations with nineteen years of rainfall data and isohyetal maps were generated for duration of 5,10,15,30,60,120,720 and 1440 minutes of different return period.
Key words: Isohyetal Maps, Log Normal Distribution, Rainfall Duration, Return Period, Rainfall Depth INTRODUCTION The rainfall IDF relationship in one of the most basic and important tools in water resource engineering to assess the risk and vulnerability of water resource structure as well as for planning, design and operation. Short-duration rainfall intensity statistics is often used for sizing and design of hydrological structures to structurally accommodate and carry water runoff from small catchments. Building roof rain loads and drainage systems, road culverts, and municipal storm sewer systems are examples where rainfall intensity is important. The isohyetal maps are helpful in estimating the rainfall depth for any location in the study area considered more easily and faster without having to go through the rigor of fitting probability distribution models all over again. These are very useful for design and planning purposes. The scope of this study was to predict rainfall depth for the stations using the data of 1998 to 2016 spread in Raichur District by using Log Normal distribution and Develop Isohyetal Maps of different duration and return period.
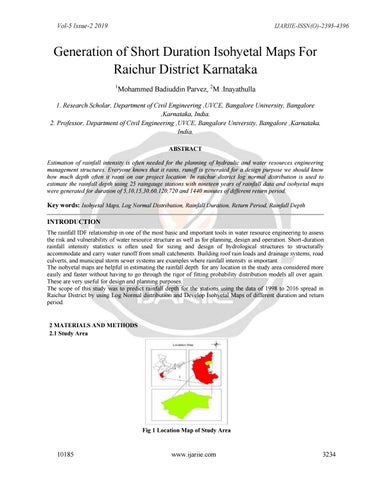
2 MATERIALS AND METHODS 2.1 Study Area
Fig 1 Location Map of Study Area
10185
www.ijariie.com
3234