National Truck Rates Outlook

With TL macro-market trends remaining steady, the outlook on when the market could change remains the same. Forecasters, such as FTR, are expecting the TL market to remain shipper friendly until late Q2 or early Q3 of 2024. There’s expected volatility toward the end of the year, with peak season, but it should adjust back shortly after.


TRUCKLOAD UPDATE $207$206$2.08$2.06 DRY VAN MAY JUN JUL $265 $2.51$260$253 MAY JUN JUL FLATBED $2.46$2.46$2.48$2.43 REEFER MAY JUN JUL
August 2023 MODE Insight AUG est AUG est AUG est
Current Market


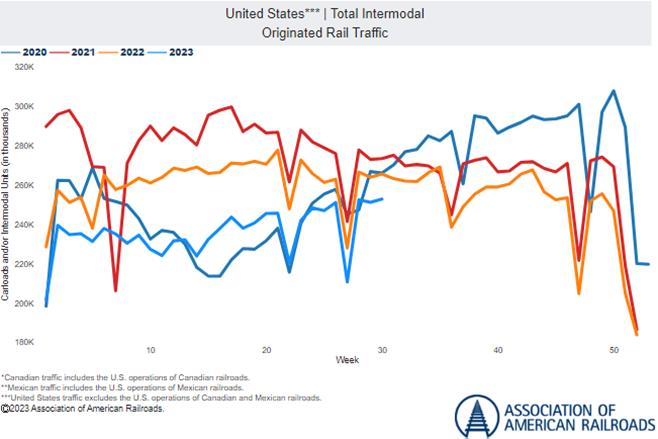
U.S. Class I railways showed lower results for the second quarter than last year, and the challenging intermodal sector was one factor that affected the numbers. Union Pacific reported a 20% drop in intermodal revenue, while revenue per carload fell 14%. Norfolk Southern’s intermodal shipment count was down 9%, year over year, and intermodal revenue per carload contracted 15.7%. CSX saw its operating income shrink from $1.7B a year ago to $1 48B, partly due to the drop in intermodal volumes The largest container provider JB Hunt had an operating income per load down 24% in the second quarter, with approximately 18% of the company’s intermodal containers idle during the period.
Per the Intermodal Association of North America (IANA), the slower economic conditions are hindering domestic output and containerized imports. Both wholesale and retail inventories are still at “relatively high levels” meaning there is little need to move additional goods. Plus, truckers have increased their hiring to add more tractor and trailer capacity, which is creating a competitive environment where truckers are siphoning off traditional intermodal moves. Looking toward the remainder of the year, “Slower year-over-year demand for goods and a competitive freight environment have taken its toll for a second quarter,” IANA President and CEO Joni Casey said “On the other hand, the numbers suggest a later peak this year and an improved picture for the second half of 2023.”
Intermodal volumes remain expected to follow 2019 levels for the rest of 2023, which is a substantial decrease from the previous three years. Currently, peak season surcharges are not anticipated from any intermodal carriers or railroads.

INTERMODAL August 2023 MODE Insight
Yellow Closing Down After 99 Years of Service
Effective July 30, 2023, almost a century after it was founded, the nation’s third-largest LTL provider, Yellow, has ceased all operations. After what can simply be categorized as a roller coaster of a ride over the last 15-20 years, and

of course, on the heels of the most recent and very public, challenging and unsuccessful negotiation process with the IBT (International Brotherhood of Teamsters), Yellow has filed Chapter 11 bankruptcy.
Union negotiations ultimately stalled over a Yellow company initiative called “One Yellow,” where Yellow was attempting to modernize its network operations across the various Yellow brands (New Penn, Reddaway, Holland and YRC). While most heavy users of Yellow's service started repositioning those volumes with other LTL providers several weeks ago, we are currently experiencing some aftermath associated with significant capacity within the market now being gone Rates, capacity and service are all being impacted
LTL Market Changing Rapidly


Capacity and Service:
We are seeing select carriers, mainly national/super regional, reporting heavy increases in daily tonnage and shipment counts because of Yellow's bankruptcy. Yellow controlled ~8%-10% of the North America LTL market, and it is largely believed there is enough available capacity within the existing marketplace to absorb the share of volume once held by Yellow companies. This is, however, still creating capacity challenges throughout the market, and heavily affected carriers are restricting capacity by customer and location. While existing customers are getting “first rights” to available capacity, we also see limitations being imposed around how much capacity will be made available to each. We expect capacity to loosen and spread over time, especially as carriers make pricing adjustments.

LTL
August 2023 MODE Insight
Capacity and Service (cont.):

Everyone should be prepared to experience some hiccups and delays in service as carriers react to new volumes flowing into their networks. Market-based congestion throughout North America is likely, and immediate pressure within the West Coast, Northeast and Midwest markets is expected to be the most challenging short term. Within the last few weeks, some national/super regional carriers have recently communicated market-based service delays and embargoes It is recommended that you stay in close communication with your partner carriers and prepare accordingly for service delays in affected markets. Long term, service is expected to return to normal levels, as many top LTL carriers are investing their CAPEX to increase throughput in a meaningful way.
Rates:
LTL rates are expected to increase as carriers look to rationalize their networks with the additional volume opportunities and will remain at an equitable positioning on less-than-desirable freight profiles and head haul lanes. Overall, we expect the LTL market will see transactional rates increase high single to low double digits rather immediately Yellow customers who relied upon them in a meaningful way – i e , all or most of their business – are going to likely pay double that range, depending on the circumstances. Next up, carriers will turn attention to contract/CSP business that operates poorly and also start making adjustments to accessorials that drive the business profiles of most interest.
MODE Can Help
MODE has an expansive selection of LTL carriers throughout North America and has helped hundreds of customers adjust their capacity strategy to best ensure their cargo is picked up and delivered on time and intact. For assistance with your supply chain challenges, be sure to reach out to your MODE agent or visit https://www.modeglobal.com/contact/.


LTL UPDATE August 2023 MODE Insight
Key Market Themes


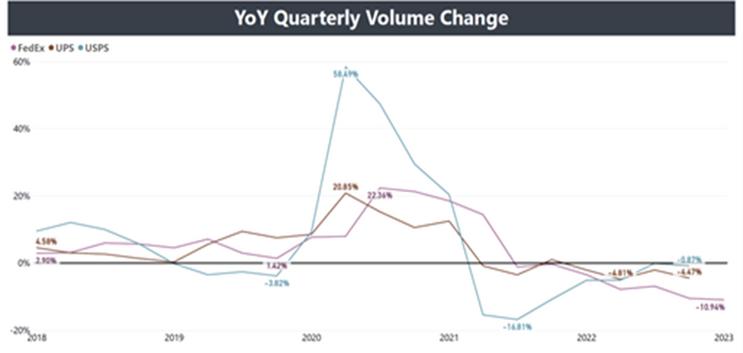
UPS Strike: UPS and the International Brotherhood of Teamsters, the union representing about 330,000 UPS employees in the U.S., have reached a tentative collective bargaining agreement.
“Together we reached a win-win-win agreement on the issues that are important to Teamsters leadership, our employees and to UPS and our customers,” said Carol Tomé, UPS chief executive officer. “This agreement continues to reward UPS’s full- and part-time employees with industry-leading pay and benefits while retaining the flexibility we need to stay competitive, serve our customers and keep our business strong.”
The five-year agreement covers U.S. Teamsters-represented employees in small-package roles and is subject to voting and ratification by union members. The new agreement will increase driver pay to $170,000 in total compensation by the end of the 5 years employment agreement.
Impact: UPS will be forced to increase rates due to the additional expense. UPS has been delivering packages since 1907 and typically averages a lower cost per shipment than FedEx. FedEx opened for business in 1971 and has been gaining ground on UPS every year since. This will be another step in the right direction to level the playing field.
Multi-carrier Options: A shift is taking place in what carriers define as an ideal customer. FedEx made a huge investment back 2021 shifting away from USPS for smaller home delivery shipments. They appear to be shifting away from the smaller packages and putting their focus back on shipments five pounds and over. USPS just announced a new Ground Advantage service. This is the first time USPS has marketed a service that makes them price competitive on shipments above three pounds. Negotiations are changing as well. Shippers that utilize lightweight service offerings should no longer look at UPS and FedEx as congruent comparisons Both carriers appear to be diverging to some extent in pricing for this service area. Instead, shippers should consider viewing contract negotiations as UPS versus FedEx plus one. Adding an additional carrier to handle lightweight volume (e.g., 0-3 lbs.) can take pressure off FedEx to offer discounts on volume unappealing to its operation. Moreover, adding carriers bolsters future leverage in contract negations and allows diversification outside of a single-source solution offered via UPS. Our main carrier will continue to be FedEx, but as previously announced, we’re adding USPS and regional carriers to help diversify our options

PARCEL
August 2023 MODE Insight
Key Market Themes in August

Capacity: Blank sailings increase in July after a 4-month decline which is removing significant capacity from the container trade
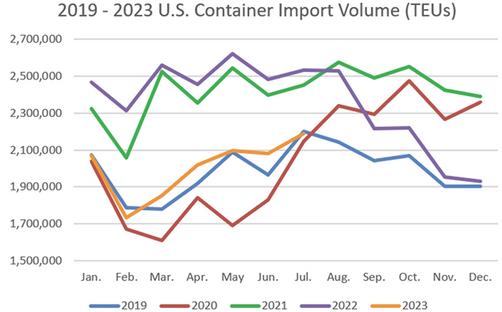
Demand: July container import arrivals at U.S. ports up slightly versus June but still tracking at about the same pre-pandemic levels of 2019
Rates: With more constraints on capacity (blank sailings) carriers have pushed spot rates up multiple times in July and into August
Operational: Canada ILWU drama continues with rejection, then acceptance of labor deal
Blank Sailings and Lost Capacity Fueling Rate Hikes
Vessel utilization in the transpacific trade have increased over the past several weeks, based on increased blank sailings and also diverted booking volumes away from Canada west coast port to avoid delays of the labor situation.
Blank sailings in July represented more than 268,000 TEU of lost capacity. This is an increase of nearly 90,000 TEU over June. Space on most Trans-Pacific services is very tight, and BCO allocations are being restricted to allow higher allocation for FAK and spot-revenues.
Significant Rate Hikes in the Trans-Pacific Trade


All the major rate index services have tracked the recent spot rate increases seen in the transpacific trade. They have reported increases in the past five straight weeks. Analysts say Trans-Pacific spot rate increases are due to carrier capacity management and a modest mid-summer increase in cargo demand.
The Freightos Baltic Daily Index graph below shows rates in the China-West Coast trade up 43% since June 30. The China-East Coast index was up 25% since June 30.

August 2023 MODE Insight
INTERNATIONAL
Trans-Atlantic Trade Now Seeing Rate Erosion
Rates in the Europe trade have been steady and much higher for months longer than in the Trans-Pacific trade, but it appears that is now shifting. Spot pricing in the Europe-U.S. trade has been slowly slipping all year, but a sharper drop can be seen since early summer. Rates are now down about 33% below 2019 levels (purple line) and 19% below 2018 levels (yellow line).
Rate Forecast

Carriers in the Trans-Pacific trade have increased rates three times from July to August, with another GRI effective the week of August 14-18. Most analysts say there is a direct correlation between the sharp increase in blank sailings in the Trans-Pacific in June/July and the subsequent increase in spot rates. However, additional rate increases may be ineffective, especially if volumes do not increase going into Q4 and new vessel orders, which are coming into market at the end of August/beginning of September, further increase capacity. It is quite possible to even see losses to the gains made in late July.

U.S. Import Volumes Continue to Track with 2019 Levels

From a pure numbers perspective, U.S. imports are down YoY more than 14%. But that is compared to the unprecedented COVID year volumes, which is an anomaly to say the least. Ultimately, import volumes are mostly unchanged versus pre-pandemic levels.The volume of containerized imports to the U.S. is relatively normal and healthy. For the first half of 2023, the graph shows a very similar tracking in the 2019 and 2023 volumes. The 2023 numbers are actually up 1 7% compared to 2019 Without a heavy peak season this year, Q4 volumes will be something to watch as it relates to the 2019 comparison.

INTERNATIONAL UPDATE August 2023 MODE Insight


