


The OTRI, which measures carrier tender rejections across some of the largest TMS providers in the transportation industry, has dropped to near 2023 levels. The extreme weather event in January caused a temporary spike that carried into early February, but has since normalized. Projections are for OTRI levels to follow similar trends to 2023 levels for the remainder of Q2.
 Source: sonar surf
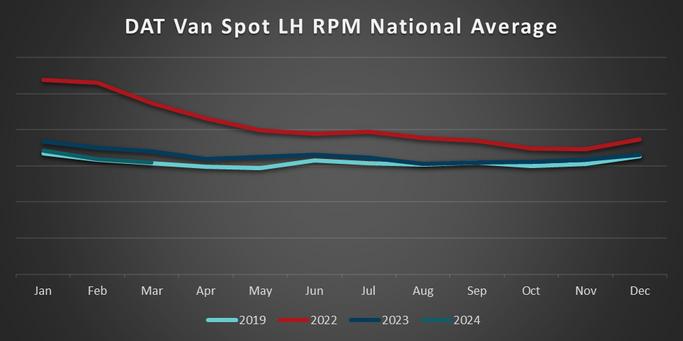
Another indicator on the current state of the TL market is the DAT Spot National Rate Per Mile Linehaul Average. This average has closely followed 2019 levels through Q1. Projections are for this to remain similar for Q2 until produce season causes the typical seasonal spike around May. Unfortunately, this is not a good outlook for many asset-based carriers as the prices of equipment, parts and maintenance have increased substantially since 2019.


The rate outlook for the remainder of Q1, and all Q2, are still projected to underperform 2023 YoY. That being said, FTR is optimistic of recent economic data and has updated projections for the flip in the TL market to move up from September to August. We will continue to monitor this and keep a close eye on when the market begins to flip.
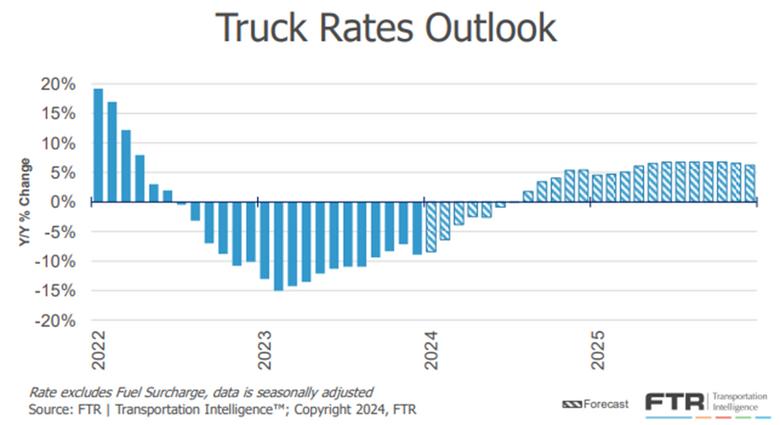
Source: ftrintel com
Spot rates continue slow-season slide


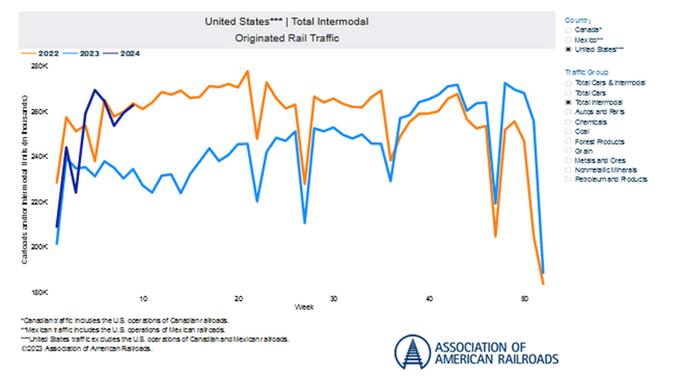
Union Pacific (UP) will launch domestic intermodal service between its Inland Empire terminal in California and its Global 2 terminal in Chicago on April 1. UP is offering priority service with four-day transit times eastbound and sixday transit times westbound, and standard service featuring six-day transit times. The services will run daily. The service between the Inland Empire and both Global 2 and Global 4 will be available to all domestic container shippers.
Additionally, Union Pacific has added Dallas and Phoenix to the lanes it is serving with on-dock international intermodal service from Houston. In cooperation with Port Houston, ocean carriers and Beneficial Cargo Owners (BCO) have access to rail service between Barbours Cut Container Terminal at Port Houston and 11 key Union Pacific-served markets. UP opened the Phoenix intermodal terminal earlier this month. Last May, UP stated new service at Barbours Cut would provide customers direct rail access to Denver, Salt Lake City, Oakland, Los Angeles and El Paso.
Norfolk Southern and Florida East Coast Railway (FEC) announced an expansion of their international and domestic interline services The Florida Express service creates a two-way transportation solution for customers moving goods between South Florida and Charlotte, North Carolina. The new service offering builds upon the partnership between the two railroads, which continues to allow customers to unlock new supply chain pathways. The partnership relies on a steel wheel interchange in Jacksonville, operating in both directions and expanding services for customers accessing global markets through South Florida.
J.B. Hunt Transport Services announced it has entered a long-term intermodal deal with Walmart that includes volume and capacity commitments. As part of the deal, J.B. Hunt will acquire Walmart’s intermodal assets. The multi-year deal expands an existing relationship between the two Northwest Arkansas companies, with J B Hunt buying Walmart’s intermodal containers and chassis Neither the size of the fleets nor the purchase price has been disclosed at this time.


With the end of Q1 2024 within reach, we’ve experienced a consistent theme that we expect to continue through the end of the month and into Q2: Volumes and demand are soft, prices are on the rise and LTL carrier service continues to expand and improve. As carriers continue to invest big CAPEX dollars in 2024 toward increasing their door counts and volumetric throughput, you can expect them to leverage those efforts, in addition to improvements with their service product, to further rationalize rate increases throughout the year to partially offset those investments
The United States ISM Purchasing Managers Index (PMI) fell to 47.8 in February from 49.1 in January, well below market expectations of 49.5, leading us into the 16th consecutive month of declines in U.S. manufacturing activity. From this perspective, remaining short-term optimism regarding meaningful recovery within the sector for the first quarter of 2024 has dissipated.
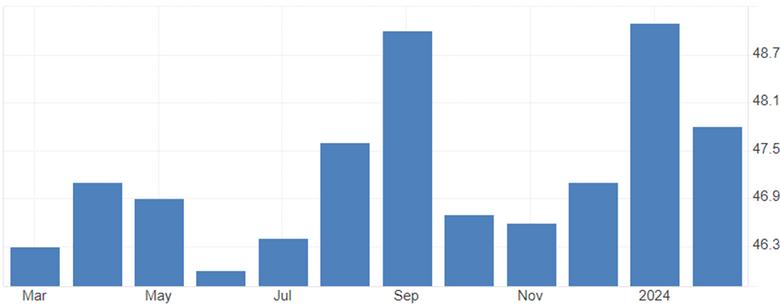
Source: Trading Economics & Institute for Supply Management
Consistent with last month’s update, and although we’ve observed back-to-back months with positive YoY expansion in the segment, the industrial sector for January 2024 came in .03% above January 2023, which is below the forecasted 1.2% and is still lagging well behind historical averages. Considering up to ~70% of an LTL carriers’ volumes can be attributed to this sector and demand softness continuing in many other areas, expect carrier capacity to be available during March, and service on the rise as we round out Q1 2024


United States Industrial Production:

Source: Federal Reserve and Trading Economics
Pricing continues to be rather stable in the LTL market. Based upon mid-quarter carrier updates on revenue per hundred weight (CWT or Yield), rates are still increasing. Notwithstanding impacts associated with weight per shipment and fuel, ODFL reported a 3.7% increase in revenue per hundred weight through the first two months of 2024, and ABF reported an approximate 13% increase YoY for both January and February. While most public carriers do not provide mid-quarter CWT figures, ODFL’s figures are believed to be in line with most other carrier efforts Addtionally, gains from ABF suggest that they are now rightsizing the profitability on the transactional business they secured following the Yellow closure, as their results outpace their peers thus far Furthermore, after fuel-aided declines through Q4 2024, we are seeing the PPI for Long Haul LTL trending upward to just over 408 for January 2024; which is .7% higher than January 2023’s index of ~405 and 2.5% higher than the December 2024 index of ~398.

Source: U S Bureau of Labor Statistics


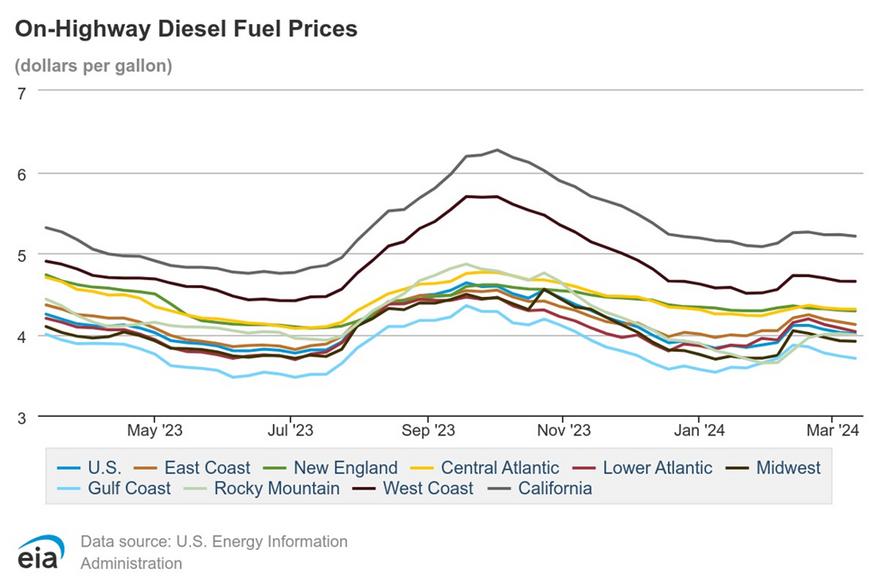
After four consecutive months of declines to the U.S. National average cost per gallon for on-highway diesel, February 2024’s monthly average per gallon came in at $4.044, which is $.19 higher than January 2024’s average per gallon of $3.854. While the streak of month-over-month declines in price per gallon has ended, we start March off with back-to-back weeks of declines, and currently, sit at $4.004 per gallon to start the second week of the month.


General Insights:

Record quarterly U.S. e-commerce sales reached $324.82 billion in Q4 2023, although growth slowed compared to previous quarters.
E-commerce sales consistently outpaced total retail sales throughout 2023
Recent federal approvals are improving the landscape for drone delivery in the U S , leading to expansion by major companies like Walmart and Amazon.
Challenges for widespread drone delivery adoption include regulatory hurdles, cost-effectiveness and technological limitations, although efforts are underway to address these concerns.
USPS:
Ground Advantage, launched in July, is gaining market adoption, indicating a positive response.
Q1 saw a 5.1% increase in package shipping segment volume and a 2.7% rise in revenue.
FedEx:
Barclays analyst suggests potential for improved profitability by losing or renegotiating USPS contract FedEx Express volume declined 18% year-over-year due to changes in USPS contract terms and USPS shift to focus on ground advantage service.
UPS:
Plans to reduce headcount by 12,000 employees in 2024, following a 43,000 reduction over three years, reflecting an almost 8% reduction from pandemic-driven highs and increased union contract costs. Initiating layoffs and facility closures in California, Ohio and Pennsylvania as part of network restructuring.
Amazon:
Introducing four new features to AWS Supply Chain to streamline operations and support supply chain processes
The new features include Supply Planning, N-Tier Visibility, Sustainability and Amazon Q, providing functionalities like demand forecasting, collaboration with suppliers, sustainability data management and AI-powered risk assessment.
Walmart:
Achieved a 20% reduction in last-mile delivery costs over the past year.
Store-fulfilled delivery sales nearly tripled over two years, exceeding $1 billion per month.
Target:
Launching Target Circle 360 membership program offering unlimited free same-day delivery for orders $35 and up and free two-day shipping

Expanding delivery volume from brick-and-mortar stores, with over 3,900 stores offering same-day delivery.


Rates: Carriers seemingly avoiding the expected post-Chinese New Year rate collapse (so far)
Supply: Capacity stabilizing as carriers prepare for service deployment adjustments and routings
Demand: February import container volumes down from January but well above 2023 volumes
Operational: Impacts of Panama Canal / Red Sea disruption perhaps not as significant as predicted
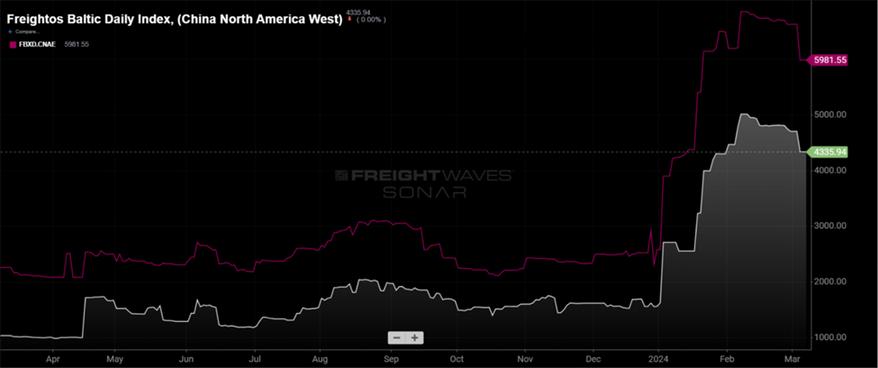
Although rates have dropped in the post-Chinese New Year (CNY) period, it was expected that perhaps the collapse in spot rates would be more pronounced. There is still a clear opinion that spot rates have hit their peak.
With fairly moderate demand coming out of CNY, the Transpacific import rate index from China to the U.S. West Coast fell by 7 8%, which is the lowest level in over a month The overall index from China to the U S East Coast dropped by 9 7% All the major indices seem to agree that Transpacific spot rates have declined but it is perhaps less severe that was expected.
As ocean carriers begin their annal BCO contract negotiations, they are balancing the above-mentioned declines in spot rates while trying to keep FAK rate levels stable and well above spot rates. Carriers will be very cautious not to allow their FAK rates to decline too much in order to present a position of strength as annual bid and contract season begins.


Carriers entered 2024 facing what looked like a year or two of significant overcapacity because of new vessel deliveries from orders they placed three years ago when cargo volumes were increasing at double-digit rates But with the Red Sea crisis and the resulting longer transits, the overcapacity they feared would develop has allowed carriers to meet current demand for capacity on their Asia-Europe, Asia-Mediterranean and Asia-U.S. East Coast services.
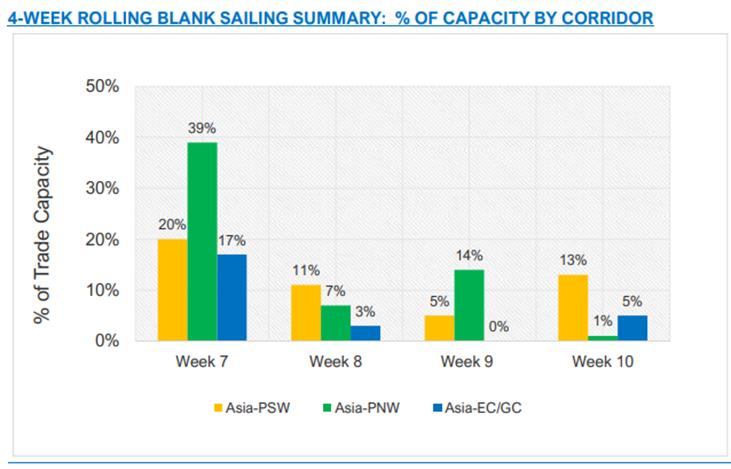
As mentioned in previous updates, the ocean carriers closed out Q4 2023 and moved into 2024 with a very aggressive plan to use blank sailings as a way to manipulate capacity trying to keep spot rates at the higher levels from last year. As seen in the below graph, the forward outlook for blank sailings (voided capacity) is decreasing fairly consistently. With the notable global disruptions happening now, it appears that carriers are reducing the number of blank sailings and adjusting to longer transits and actually utilizing their available capacity more effectively
 Source: M+R Spedag Group


The Febru 2024 ll U S i i volumes d higher whe
Because o month-ove degree. Ho given the p year (early One other numbers a pandemic January’s i was still si February 2022.
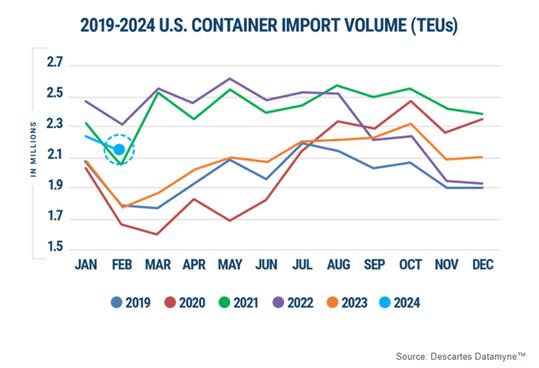

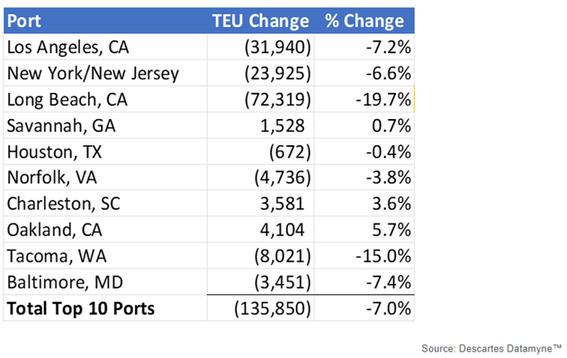
For the top 10 U.S. ports, container import volume in February 2
January 20 experience from Janua Angeles an significant



As carriers emerge from the quiet period following the holiday in Asia, vessel positioning as well as container stocks have seemingly improved, and there is now a belief that the Red Sea disruption and subsequent re-routing of services around the Cape of Good Hope is not having as significant an effect on either capacity or equipment circulation as initially thought.
There is not much change in the Panama Canal situation as the drought continues to affect traffic flow. The number of transit slots increased slightly in January and February but was still well below normal operating slot levels. The attacks on shipping in the Red Sea by rebels have diverted cargo that would traditionally move through the Suez Canal.
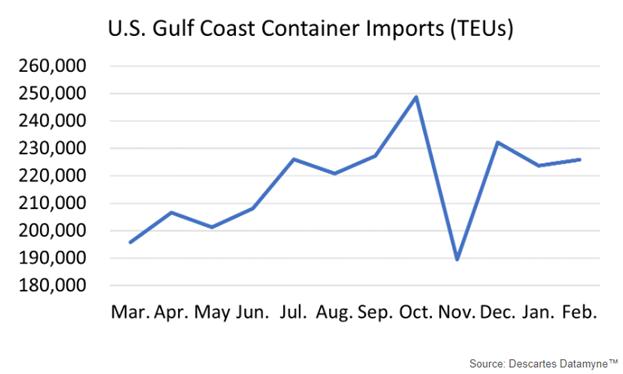
Despite ongoing capacity constraints at the Panama Canal, volume at Gulf Coast ports remains stable and, considering that February was a shorter month, performed better than either of the other two coasts. February Gulf Coast container import volumes were up 1.0%.
Slightly lower East Coast port volume in February 2024 versus January 2024 translated into lower port transit time delays despite continued reductions in traffic through the Panama Canal and avoidance of the Suez Canal. More stable volumes at Gulf Coast ports also shortened delays, as port transit times decreased by ~2 days.


There is no crystal ball, but rates will likely continue a steady but measured decline through much of March. With improved load factors in late February, and while rates will continue settling, it is now less likely we will see the huge decrease that tends to follow the CNY holiday.
We know that carriers will now be entering a period when contract negotiations begin, and pricing actions will be more deliberate and not widespread. While rates are unlikely to increase in March, it is not impossible to rule out some increases in April, especially as carriers seek more leverage in contract negotiations.
Until then, carriers will try to hold spot-rates as much as possible, but upcoming BCO contract negotiations and the potential for weaker load-factors in March may weigh further on spot rates. Early-/mid-March will also have the highest capacity per week deployed on the trades since December, when spot rates weakened under the excess capacity.
Carriers at the moment are just trying to maintain rates at higher levels while still negotiating individual strategic spot rates several hundred dollars lower, and we expect this trend to continue through March.
As announced in our last issue, Maersk and Hapag-Lloyd became the first to announce their new alliance, Gemini Cooperation, set to roll out in February of 2025. They have aligned in their goals of increased service reliability by using a hub and spoke network to differentiate themselves from the market. From the major hubs, they will look to run efficient regional services that only call two to three terminals in most major markets.
As the first domino fell, the Ocean Alliance, made of CMA CGM, Cosco Shipping, Evergreen and OOCL, responded quickly and announced that they have extended their relationship through 2030 and beyond. They are still positioning themselves to have a significant number of loops to call major ports direct with more than 40 services.
This leaves the open question marks for the remainder of major global carriers, MSC, ONE, Yang Ming, Hyundai Merchant Marine and Zim. There is a lot of speculation in the market that MSC is considering venturing out on its own with the largest fleet and a significant orderbook to compete against its competitors. We will continue to monitor and update on the situation as more dominoes fall.


