




The Outbound Tender Rejections Index (OTRI) exhibited moderately elevated levels on a year-over-year basis. While these levels exceed those observed in 2019 and 2024, they remain compressed relative to bull market conditions.
The OTRI will serve as a leading indicator of the impacts from the English Language Proficiency requirements that recently took effect FreightWaves estimates this regulation could affect approximately 10% of over-theroad (OTR) driver capacity Should the labor force contract by this magnitude, it could serve as the catalyst to rebalance supply and demand dynamics and initiate recovery from the multi-year freight recession.
DAT's National Van Spot Linehaul RPM declined 1% year-over-year in June, marking the first month year-to-date with a yearover-year decrease in linehaul rates.
Additionally, lower fuel prices contributed to a further all-in RPM decline of 1.5% yearover-year, representing the third consecutive month at this level of decline.
Under normal circumstances, this would indicate that the market should closely track last year's trends for the next quarter; however, the key variable remains the enforcement rigor of the English Language Proficiency (ELP) requirements. If carriers reduce their non-English speaking driver pool by a substantial percentage, it could directly impact spot market volumes and increase rate volatility.


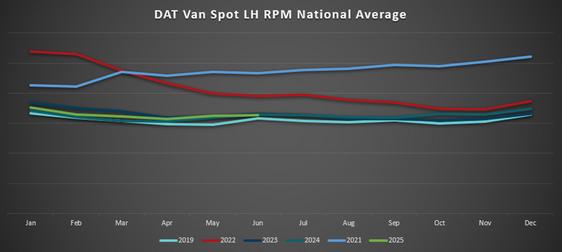

FTR Intelligence continues to forecast a stable market environment for the remainder of 2025 Linehaul rate growth is still anticipated but at a slower pace than previously expected With fuel surcharges trending downward, any gains in base rates may be neutralized, keeping all-in RPM levels flat or slightly below prior year comparisons
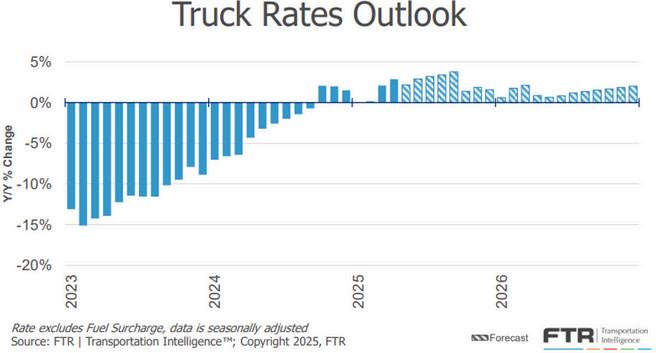
Source: ftrintel.com
National Spot Rates
Rates get a bump heading into the holiday
$1.96
Source: DAT com/trendlines


Union Pacific (UP) has revised their seal requirements for $100K coverage regarding tin and plastic seals as a result of customer feedback and internal discussion.
UP will continue to provide up to $100K liability coverage for use of plastic and tin seals in the event of cargo theft.
UP continues to encourage the industry and our customers to adopt more protective seals such as cables, bolts and padlocks to help safeguard their shipments Requirements for the rest of the Union Pacific High Value Program remain unchanged and will remain effective July 1, 2025.
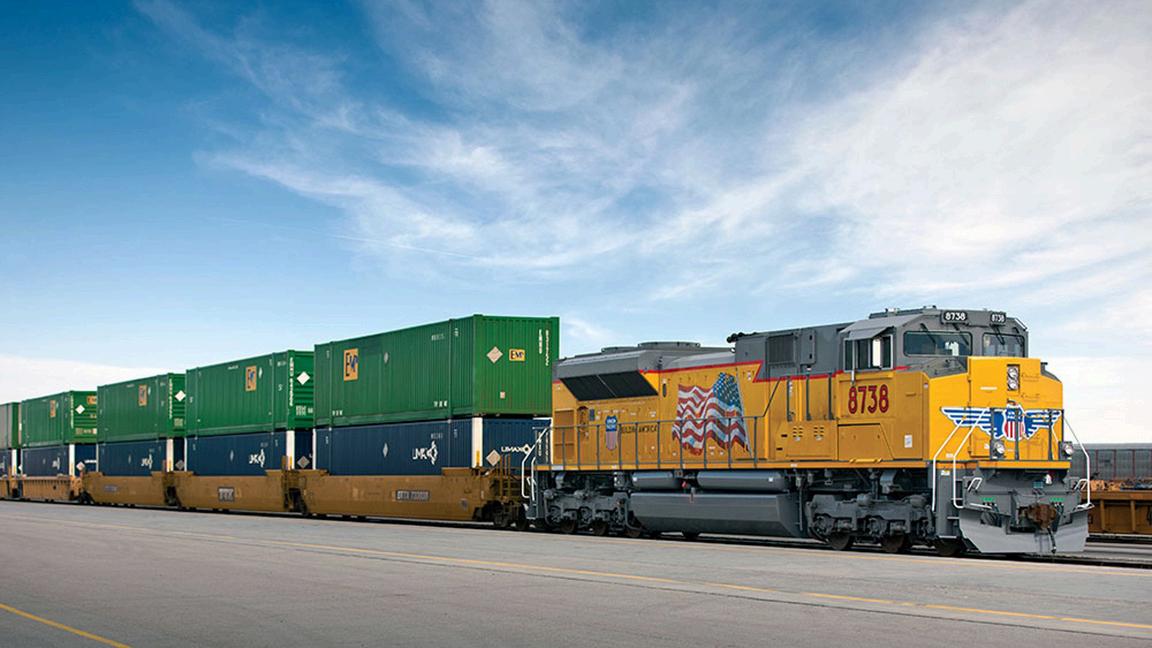

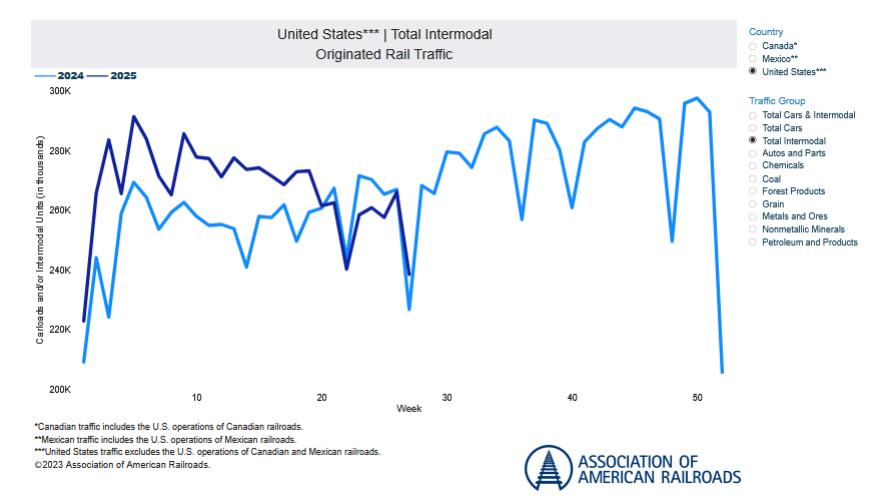
Intermodal rates have been increasing by around 2.1% in 2025, and 2026 intermodal rates are expected to see similar increases. 2025 intermodal contract rates have remained higher than spot rates, with OTR capacity being plentiful and intermodal dray, equipment and gate reservations remaining abundant in all metro areas.
Intermodal Peak season traditionally begins late in August or September for California-originated shipments. While J.B. Hunt has declared Southern California peak early this year, other intermodal providers have not yet given an indicator of declaring a peak season. The MODE Global Intermodal team will closely monitor the situation and keep all parties informed as news develops.


Here are links to some top stories in the industry for you to check out:
NMFTA Readies
Density-Based Freight Class Update for July 19
Estes Eyes 14,000
Doors in 2026
After Buying
Yellow Terminals
U.S. shippers ride ebb and flow of Mexican crossborder freight demand
XPO rating cut by S&P, agency cites continuing weak freight market
As we get into July, the LTL industry is holding steady and adjusting to the usual ups and downs of the market. Freight volumes remain strong, supported by sustained e-commerce momentum and a consistent rebound in industrial production, particularly in the automotive and construction sectors Seasonal shipping tied to retail backto-school and early holiday inventory movements has also begun to influence volume patterns, prompting carriers to fine-tune capacity planning strategies
The ongoing consolidation trend is maintaining its pace, with carriers seeking strategic acquisitions to expand terminal footprints, optimize regional coverage and gain competitive pricing leverage. Notably, midsize regional players are increasingly becoming acquisition targets as larger carriers look to streamline operations and fill geographic gaps.
July also sees continued attention on the NMFTA classification reform, with industry stakeholders closely monitoring its potential implementation timeline. As carriers and shippers prepare for the changes, many are accelerating their shift toward dimensional pricing models and more data-driven freight auditing practices. This is fostering a more transparent pricing environment while encouraging the adoption of digital tools that enhance shipment visibility and billing accuracy.
Technology investment remains a key focus. Carriers are advancing digital freight platforms, predictive analytics and AI-powered route optimization to drive efficiency and differentiate service offerings. Sustainability is another growing priority, with more fleets piloting electric or alternative fuel trucks, especially in urban delivery zones where regulatory pressure and customer demand for greener logistics are intensifying
While inflation and labor availability still pose challenges, the industry outlook for July remains cautiously optimistic. Carriers are leaning into strategic adaptability balancing capacity, cost control and customer service as they position themselves for a strong close to Q3 and continued resilience through the second half of the year.

The $66 billion less-than-truckload (LTL) market is primed for what one leading analyst calls a ‘turbulent year.’
“It’s going to be a roller-coaster,” says Satish Jindel, principal of SJ Consulting, a leading trucking data and advisory firm. “And that’s because our economy is on a roller coaster due to the tariffs.”
According to Jindel, that forecast holds for the rest of 2025 and into next year, “I see a very uncertain environment for the carriers In transportation, carriers have no influence on demand The only thing they have control over in terms of capacity is supply ”
That supply includes not just the number of trucks and drivers, but also terminals A handful of the leading LTL carriers notably, Estes Express, FedEx Freight and Saia scooped up roughly 100 old Yellow terminals when it went out of business two years ago.
Combined revenue of the top 25 LTL carriers dropped 1.3% to $48.2 billion in 2024, according to figures supplied by SJ Consulting. The major difference between LTL and truckload freight is market share. The largest LTL carrier has almost a 10% market share, compared with TL, where the largest carrier, Knight-Swift, barely has 1% share. Another factor affecting pricing in the LTL market is the major changes coming to freight classifications under the National Motor Freight Classification (NMFC).
“The timing of the NMFC changes is awful,” says Jindel. At the start, NMFC is changing only about one-fourth of all commodities. “They should postpone it until next July and make it for all commodities. It’s a wasted effort in this market. Any carrier that pushes for dimension pricing now is half-baked and poorly timed.”
If they don’t, adds Jindel, expect the list of LTL carrier bankruptcies to grow even further Already in this century, grand old names such as Central Freight Lines, New England Motor Freight, Lakewood, Consolidated Freightways, A-P-A Transport and scores of others have disappeared For further details, you can refer to the original article

The ISM Manufacturing PMI edged up to 49 in June 2025 from 48.5 in May, compared to forecasts of 48.8, signaling economic activity in the manufacturing sector contracted for the fourth consecutive month. However, the rate of contraction slowed, amid a rebound in production (50.3 vs. 45.4) and improvements in inventories (49.2 vs. 46.7). On the other hand, new orders (46.4 vs. 47.6), employment (45 vs. 46.8) and backlog of orders (44.3 vs. 47.1) contracted at a faster pace. Also, inflationary pressures increased slightly (69.7 vs. 69.4) and tariffinduced pricing growth accelerated. Meanwhile, the Supplier Deliveries Index (54.2 vs. 56.1) indicated slower deliveries but improved performance, indicating that the delays in clearing goods through ports of entry are largely complete.

Source: Trading Economics & Federal Reserve
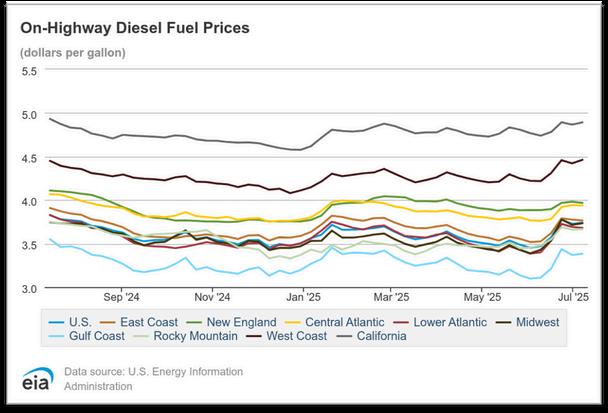
The U.S. national average cost per gallon for on-highway diesel in June 2025 came in at $3 60, which is $0 10 (2 9%) higher than May’s $3 50 average June 2024’s average was approximately $3 72, making June 2025 about 3 3% lower year-overyear. As of the first week of July, the national average has ticked up to $3.739 per gallon.


Rates: As quickly as rates moved higher in May/June, they are now falling back at a similar pace.
Capacity: Plenty of capacity available but corrections are likely coming; spot rates weaken and load factors drop moving into July
Volumes: Slowing now after shippers rushed to get volumes moving ahead of tariff pause deadlines.
Port Operations: Initial surge of June arrivals at U.S. ports handled without significant delays or congestion.

As of the end of June, Asia-to-U.S. West Coast rates have fallen back to late-April levels as moderate demand, extra loader capacity and new ocean services have absorbed much of the demand surge in June Despite capacity increases, rates moving into July are roughly 40-50% lower than their peak on June 1 Ocean carriers underestimated both the depth and length of the demand surge following the 90-day tariff truce announced in May
Ocean carriers mostly failed in their attempt to implement the planned July 1 general rate increase in the eastbound trans-Pacific, with vessel capacity well above forward demand. Additionally, carriers have also dropped plans to impose a peak season surcharge (PSS) on fixed-rate contracts to the U.S. West Coast.

Moving into July, the Platts index is reporting rates from North Asia to the West Coast at $2,200 per FEU as of July 1, down 15% from the previous week. Rates to the East Coast were $4,300 per FEU, 12% lower.

As an aggregate, the general consensus is that most imports from Asia are moving at $4,400 to $4,500 per FEU to the East Coast and $2,400 to $2,500 per FEU to the West Coast moving into the first week of July. Some analysts report that shippers may be able to secure even lower prices from certain carriers Some carriers are quoting sub-$4,000-per-FEU spot/FAK rates to the East Coast and sub-$2,000 per FEU to the West Coast in specific circumstances
Freightos reported that between late May and mid-June, rates for Asia to North America West Coast containers surged by over $3,000 per FEU, or 115%; however, by the start of July, a combination of demand and capacity issues caused a sharp decline in the average rate to $3,388 per FEU, which is 43% below June’s peak, though still 22% higher than late May.
East Coast rates saw a similar but less dramatic trend. East Coast rates increased 80% from late May to mid-June, reaching about $7,200 per FEU, but fell 15% by the end of June. These substantial drops in rates, occurring early in the typical peak season, have carriers seriously reconsidering their current capacity position, with the potential of reductions in the near term.

In June, total U.S. container imports rose to 2,217,675 TEUs, up 1 8% from May but 3 5% below June 2024 levels The increase marks a stabilization in import activity after May’s substantial decline and perhaps shows that U.S. importers are adapting their supply chains to the ongoing trade volatility. U.S. imports from China increased slightly, up 0.4% from May, but were down 28.3% year-over-year, continuing the steep drop that began in May due to elevated tariffs.

However, U S containerized imports from the top 10 countries of origin declined 10 5% year-over-year, driven most notably by a 28 7% drop in volumes from China, equal to a loss of 257,003 TEUs At the same time, several Southeast Asian countries posted strong gains: Vietnam imports increased 27 6% year-over-year, while Indonesia jumped 57.5% and Thailand increased 15.6%.
China’s overall share of total U.S. container imports hit a four-year low in June of 28.8%, reflecting the sustained impact of elevated tariffs.
Year-over-year data reinforces the ongoing adjustment of global sourcing networks as U.S. importers diversify suppliers. As import volumes from Southeast Asia rise and volumes from China decline, these year-over-year trends signal a clear shift in trade flows based on the evolving political and economic pressures.
The top import products from China in June, Furniture & Bedding and Plastics, saw some significant year-over-year volume declines, with furniture down 36.9% and plastics down 17.6% versus June 2024. Other higher volume products such as Electric Machinery; Toys, Games & Sporting Goods; and Vehicles (HS-87) also saw year-over-year decreases of 33.7%, 27.1% and 31.7%, respectively. Even top categories like Textiles and Apparel & Footwear saw decreases of 18-29%
These declines likely illustrate the impact of U S trade policy While importers try to adjust their supply chains as tariff impacts persist and sourcing diversification continues, China’s share of U S imports may remain under pressure through 2025. More pressure could be expected with the tariff pause potentially triggering a second wave of cost increases ahead of the August 10 expiration of the U.S.-China trade truce.

With most ocean carriers pushing additional capacity into the Asia to U.S. trade starting in May, available capacity has been abundant through June and into July. The deployment of extra loaders and the addition of some new services has more than covered the predicted demand surge caused by the tariff truce. The perception of plentiful vessel capacity for the next few months has also significantly reduced importer concerns about securing space this summer or as we move to some type of peak season. How long it will last is a bigger question.
The below data from maritime visibility provider eeSea shows that the recent influx of vessel capacity by trans-Pacific carriers has brought total capacity to 1 57 million TEUs in July, the highest for any month since 2021
An estimated 8.6% of that capacity is potentially set to be blanked. In August, the total capacity is scheduled to slip to 1.48 million TEUs, with 7.7% of the capacity scheduled to be blanked. Even with the blank sailings, the total capacity offered in the eastbound trans-Pacific will be almost 20% higher in July 2025 than July 2024 and 10.6% higher in August year-over-year.
However, carriers are now signaling pulling back on the deployment of tonnage from Asia to the U.S. for at least August because of the stop-and-start import demand caused by tariff uncertainty. The fear is that if demand drops quickly in August due to tariff issues, the carriers will be left with excess/idle capacity and the high likelihood of a rate collapse.
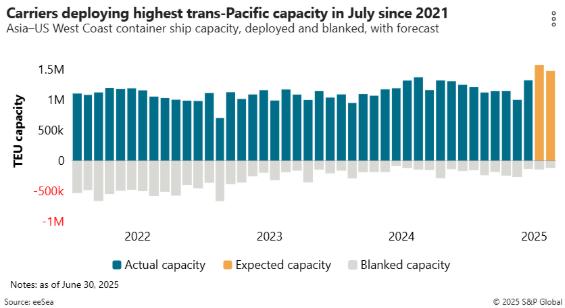
Carriers are set to deploy 6.2% less overall tonnage from Asia to the U.S. West Coast in August compared to July, equating to 90,000 TEUs of capacity. Comparatively, ocean capacity from Asia to U.S. East and Gulf coasts should be reduced by only 1.7%.

The initial wave of import container volumes in June at U S West Coast ports of Los Angeles/Long Beach, which has not been seen since the COVID era, has been handled and processed with very few delays over the average/normal dwell times Additionally, no major congestion, shortages of chassis or yard capacity has been reported
U.S. port transit time delays decreased in June, dropping from a total of 54 4 to 44 0 days across major g improve days) an previou day, wh gains.
East and stable. S all poste York/N
MONTHLY AVERAGE TRANSIT DELAYS (IN DAYS) FOR THE TOP 10 PORTS (APR. 2025 – JUN. 2025)


After the tariff roller coaster to start Q2, the Trump administration has announced a new round of potential reciprocal tariffs starting on August 1. The countries impacted appear to be widespread, and some of the tariffs are clear to be quite significant.
Brazil appears one of the countries with the larger impact, seeing a potential increase up to 50% tariff on goods. Other countries listed out in the round of letters sent by the administration are Japan, Korea, South Africa, Indonesia, Thailand and other Asian, Oceanic and African countries. Most of the countries do not see much of a change from the original schedule of tariffs announced in April. After the first round of letters were dispatched, the administration sent out a few more letters to the EU And Mexico, which would see a potential 30% tariff level This adds to the scope and breadth of the outlined tariffs
At this point, we have only seen one announced agreement between the U S and Indonesia, which leaves much open to speculation with the August 1 deadline looming. U.S. importers are likely to take the wait and see approach as they did for the Q2 tariff announcements. This will continue to bring uncertainty to the market and will increase volatility as we approach peak season.


