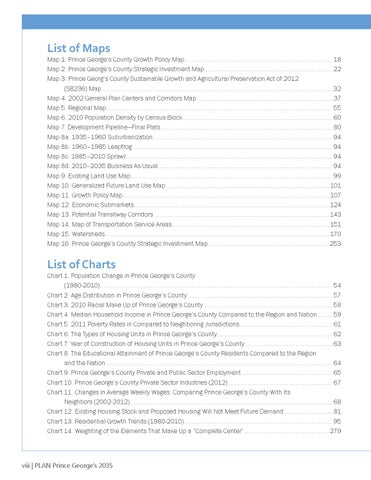
List of Maps Map 1. Prince George’s County Growth Policy Map............................................................................................. 18 Map 2. Prince George’s County Strategic Investment Map................................................................................. 22 Map 3. Prince Georg’s County Sustainable Growth and Agricultural Preservation Act of 2012 (SB236) Map................................................................................................................................................. 32 Map 4. 2002 General Plan Centers and Corridors Map.......................................................................................37 Map 5. Regional Map.............................................................................................................................................. 55 Map 6. 2010 Population Density by Census Block.............................................................................................. 60 Map 7. Development Pipeline—Final Plats............................................................................................................ 80 Map 8a. 1935–1960 Suburbanization................................................................................................................. 94 Map 8b. 1960–1985 Leapfrog.............................................................................................................................. 94 Map 8c. 1985–2010 Sprawl.................................................................................................................................. 94 Map 8d. 2010–2035 Business As Usual.............................................................................................................. 94 Map 9. Existing Land Use Map............................................................................................................................... 99 Map 10. Generalized Future Land Use Map....................................................................................................... 101 Map 11. Growth Policy Map.................................................................................................................................. 107 Map 12. Economic Submarkets.......................................................................................................................... 124 Map 13. Potential Transitway Corridors.............................................................................................................. 143 Map 14. Map of Transportation Service Areas................................................................................................... 151 Map 15. Watersheds............................................................................................................................................. 170 Map 16. Prince George’s County Strategic Investment Map............................................................................ 253
List of Charts Chart 1. Population Change in Prince George’s County (1980-2010).................................................................................................................................................. 54 Chart 2. Age Distribution in Prince George’s County............................................................................................57 Chart 3. 2010 Racial Make Up of Prince George’s County................................................................................. 58 Chart 4. Median Household Income in Prince George’s County Compared to the Region and Nation.......... 59 Chart 5. 2011 Poverty Rates in Compared to Neighboring Jurisdictions............................................................61 Chart 6. The Types of Housing Units in Prince George’s County......................................................................... 62 Chart 7. Year of Construction of Housing Units in Prince George’s County....................................................... 63 Chart 8. The Educational Attainment of Prince George’s County Residents Compared to the Region and the Nation.............................................................................................................................................. 64 Chart 9. Prince George’s County Private and Public Sector Employment.......................................................... 65 Chart 10. Prince George’s County Private Sector Industries (2012).................................................................. 67 Chart 11. Changes in Average Weekly Wages: Comparing Prince George’s County With Its Neighbors (2002-2012)............................................................................................................................... 68 Chart 12. Existing Housing Stock and Proposed Housing Will Not Meet Future Demand................................81 Chart 13. Residential Growth Trends (1980-2010)............................................................................................. 95 Chart 14. Weighting of the Elements That Make Up a “Complete Center”...................................................... 279
viii | PLAN Prince George’s 2035
