contents
message from the ceo
business model, strategy & targets
market overview
risk & risk management
operations
sustainability report
financial information
corporate governance report
share information
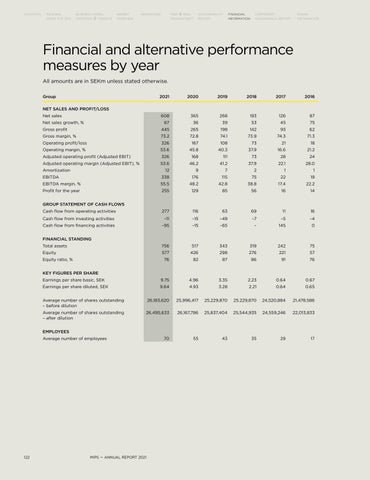
Financial and alternative performance measures by year All amounts are in SEKm unless stated otherwise. Group
2021
2020
2019
2018
2017
2016
608
365
268
193
126
87
67
36
39
53
45
75
Gross profit
445
265
198
142
93
62 71.3
NET SALES AND PROFIT/LOSS Net sales Net sales growth, % Gross margin, %
73.2
72.8
74.1
73.9
74.3
Operating profit/loss
326
167
108
73
21
18
Operating margin, %
53.6
45.8
40.3
37.9
16.6
21.2
Adjusted operating profit (Adjusted EBIT)
326
168
111
73
28
24
Adjusted operating margin (Adjusted EBIT), %
53.6
46.2
41.2
37.9
22.1
28.0
12
9
7
2
1
1
EBITDA
Amortization
338
176
115
75
22
19
EBITDA margin, %
55.5
48.2
42.8
38.8
17.4
22.2
Profit for the year
255
129
85
56
16
14
277
116
63
69
11
16
GROUP STATEMENT OF CASH FLOWS Cash flow from operating activities Cash flow from investing activities
–11
–15
–49
–7
–5
–4
Cash flow from financing activities
–95
–15
–65
–
145
0
75
FINANCIAL STANDING Total assets
756
517
343
319
242
Equity
577
426
298
276
221
57
76
82
87
86
91
76
Earnings per share basic, SEK
9.75
4.96
3.35
2.23
0.64
0.67
Earnings per share diluted, SEK
9.64
4.93
3.28
2.21
0.64
0.65
Average number of shares outstanding – before dilution
26,183,620
25,996,417
25,229,870
25.229,870
24,520,884
21,478,586
Average number of shares outstanding – after dilution
26,495,633
26,167,786
25,837,404
25,544,935
24,559,246
22,013,833
70
55
43
35
29
17
Equity ratio, % KEY FIGURES PER SHARE
EMPLOYEES Average number of employees
122
MIPS — ANNUAL REPORT 2021