


MINERAL RESOURCES LIMITED 2022 ANNUAL REPORT I AM MINRES
I AM THE SUM OF MY COMBINED QUALITIES, EXPERIENCE AND KNOWLEDGE. I CARE FOR THE HEALTH, SAFETY AND WELLBEING OF EVERYONE AROUND ME. I AM THE PAST, PRESENT AND FUTURE OF OUR COMPANY.
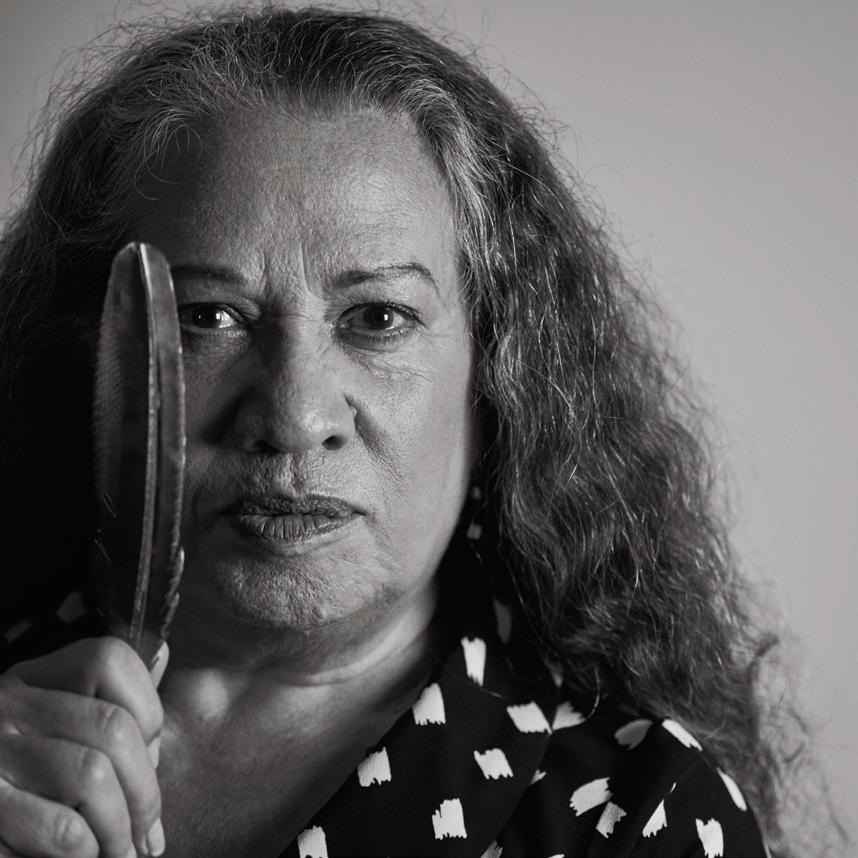
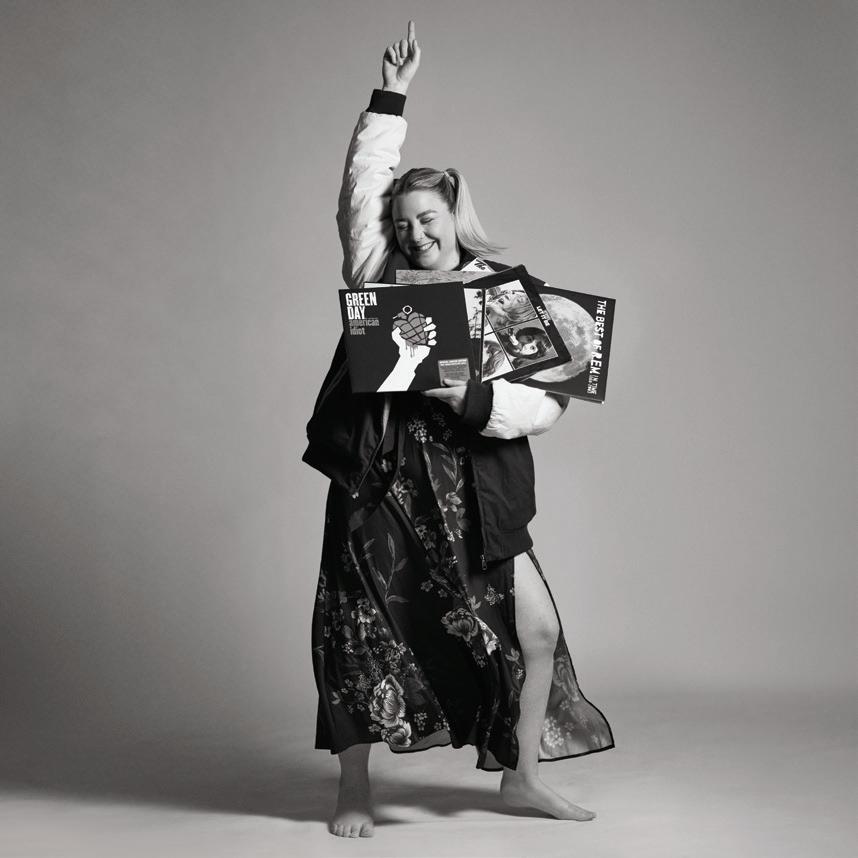
I AM MINRES ENVIRONMENTAL ADVISOR ARMY VETERAN AND MARINE BIOLOGIST INDEPENDENT NON-EXECUTIVE CHAIR CYCLIST MANAGING DIRECTOR FISHERMAN RECRUITMENT TEAM LEAD HOCKEY GOALKEEPER CHIEF FINANCIAL OFFICER AND COMPANY SECRETARY BLACK BELT AIKIDOIST SAFETY ADVISOR TRIATHLETE ELECTRICIAN GAMER CHIEF EXECUTIVE - MINING SERVICES ANTIQUE COLLECTOR EXECUTIVE GENERAL MANAGER - PROJECT DEVELOPMENT SURFER CULTURAL CONSULTANT LOVER OF SPORTS AND CULTURE SITE ADMINISTRATOR LP RECORD COLLECTOR CHIEF EXECUTIVE - IRON ORE DOG MAN SITE MANAGER, CRUSHING AND PROCESSING VANS SHOE COLLECTOR CHIEF EXECUTIVE - LITHIUM GYM ENTHUSIAST SITE CHEF BASKETBALLER EXECUTIVE GENERAL MANAGER - ENERGY DECORATED HERO GEOGRAPHIC INFORMATION SYSTEMS OFFICER BONSAI ARTIST UTILITIES KARAOKE PERFORMER UTILITIES INTERNATIONAL MS AUSTRALIA 2022 - OPEN HEART SURGERY SURVIVOR CHIEF PEOPLE AND SHARED SERVICES OFFICER REFUGEE ADVOCATE ONBOARDING COORDINATOR REPTILE CONSERVATIONIST EMPLOYMENT MARKETING MANAGER 4WD AND CAMPING YOUTUBER SAFETY ADVISOR BOLLYWOOD ACTOR INDIGENOUS ENGAGEMENT ADVISOR GENEALOGY ENTHUSIAST GALLERY MANAGER AND SOCIAL MEDIA SPECIALIST FASHIONISTA INX ADMINISTRATOR STUDENT PRIVATE INVESTIGATOR EXECUTIVE ASSISTANT SPRINTER SENIOR INX ADMINISTRATOR HUMAN RIGHTS ADVOCATE GENERAL MANAGER LEADERSHIP AND PERFORMANCE TRADITIONALIST PROJECT GEOLOGIST CONTAINER-HOME DESIGNER ENTERPRISE ARCHITECT MATHEMATICIAN HEALTH SERVICES ADMINISTRATOR GLOBAL BACKPACKER LEADING HAND MECHANICAL FITTER SOCCER PLAYER IT SUPPORT OFFICER AND CHIEF REMOTE PILOT PALADIN-BEARER OF SHADOWMOURNE COMPLIANCE TRAINER GENERATIONAL UPHOLSTERER GRADUATE LAND ACCESS ACOUSTIC GUITARIST SITE CHEF FOOD PHOTOGRAPHER GEOGRAPHIC INFORMATION SYSTEMS OFFICER LEADLIGHT ARTIST FIELD ASSISTANT MILITARY MODEL BUILDER GENERAL MANAGER PEOPLE DOG LOVER ELECTRICIAN MOTOCROSS RIDER TENEMENT OFFICER BAKER SITE CHEF SUPERYACHT CHEF
OUR SUCCESS IS OUR PEOPLE
There is an intrinsic link between everything we have accomplished and the people who have made it possible. In fact, we can’t have one without the other. Our people – who bring their passion, their devotion, and their determination to work every day – are the bedrock of all our successes. We foster a culture that embraces individuality, and with nearly 5,000 team members, that’s a seriously diverse mix.
As we celebrate 30 years in business, we also celebrate the people, from all walks of life, who have made significant contributions to it. It’s the eclectic range of work and life experience that helps create a culture of acceptance and a unified sense of ambition. No matter where or what level of work, our people are respected and listened to. It’s all about being part of the MinRes family.
NURTURING AND REWARDING TALENT
Our success relies on us finding, and keeping, the right people. That starts by attracting new talent. We have several successful initiatives to attain new staff, including entry level programs, like work experience, apprentices and trainees, graduate and vocation programs plus our dump truck operator training. For many, this is the beginning of their pathway with us. Our aim then is to make sure they continue to grow, by providing opportunities for career advancement. Because we value our employees and appreciate their contribution, we work harder to help their career progression. We’re constantly seeking feedback from our people too, to get a better understanding of how they want to be rewarded. We’ve introduced benefits like our quarterly bonuses, MyShare share plan, salary sacrificing and our referral program. We know that retaining great people means having a better understanding of what makes their working life more rewarding, now and into the future.
WELLBEING
We know how important our people are. We know the only way for us to keep growing and succeeding as a company, is to keep our best people. To do that, we need to keep them happy. It’s one thing to understand the importance of looking after your employees and commit to ensuring their wellbeing is a priority. What’s more important is following through and delivering on that promise every day. That means setting new standards for workplace wellbeing. It means paying as much attention to mental health as physical health with more training, better mental health resources and a greater awareness of the kinds of issues and sensitivities our employees may encounter. We also know the physical surrounds of everyone’s day-to-day environments make a significant impact on wellbeing. It is not just about safety, it’s also about providing comfort during work and opportunities for recreation. It’s why we’re leading the industry by delivering world-class facilities, from our Walters Drive headquarters in Perth, through to resort-style camps on our sites.
DIVERSITY AND INCLUSION
Our policy for diversity and inclusion is comprehensive, but it can be summed up in three words; everyone is welcome. We are a family, which means the care and respect we have for one another is equal, always. We want all our people to bring their true selves to work and expect total acceptance. Individuality is encouraged; we want all our employees to know they are welcomed into a safe space every day. A space where we have zero tolerance for harassment and discrimination. We’re working to increase our representation of Aboriginal and Torres Strait Islander employees and have targets in place to increase the number of female employees. But it’s not just about making targets. We believe a more inclusive and diverse workplace is healthier and more productive. We’re reviewing and updating policies and procedures to address issues like gender pay equality, and we’re working with Aboriginal groups to increase representation and return the benefits of our work to local communities.
CONTENTS
ACKNOWLEDGEMENT OF COUNTRY MinRes is committed to reconciliation and recognises and respects the significance of Aboriginal and Torres Strait Islander peoples’ communities, cultures, and histories. MinRes acknowledges Aboriginal and Torres Strait Islander people as the first and continuing custodians of the land and waters and in doing so pays respect to Elders past and present.
ABOUT THIS REPORT
This Annual Report is a summary of Mineral Resources Limited’s operations and financial results for the financial year ended 30 June 2022. All references to ‘Mineral Resources’, ‘MinRes’, ‘the Company’, ‘the Group’, ‘we’, ‘us’ and ‘our’ refer to Mineral Resources Limited (ABN 33 118 549 910) and the entities it controlled, unless otherwise stated.
References in this report to a ‘year’ are to the financial year ended 30 June 2022 unless otherwise stated. All dollar figures are expressed in Australian dollars (AUD) unless otherwise stated. All references to ‘Indigenous’ people are intended to include Australian Aboriginal and/or Torres Strait Islander people.
Photography by Russell James OAM. Creative direction by Ali Franco.
This publication is sustainably printed, utilising solar electricity and FSC certified paper. The printer is ISO14001 accredited, the highest environmental standard.
CHAIR’S REVIEW 2 MANAGING DIRECTOR’S REPORT 4 A YEAR OF ACHIEVEMENTS 8 FINANCIAL REVIEW 11 OPERATIONAL REVIEW 21 MINING SERVICES 25 IRON ORE 33 LITHIUM 37 ENERGY 41 SUSTAINABILITY REVIEW 43 OVERVIEW 44 HEALTH AND SAFETY 51 PEOPLE 54 ENVIRONMENT 57 CLIMATE CHANGE 62 SOCIAL 67 ANNUAL FINANCIAL REPORT – 30 JUNE 2022 71 DIRECTORS’ REPORT 73 REMUNERATION REPORT 85 FINANCIAL STATEMENTS 131 NOTES TO FINANCIAL STATEMENTS 139 SHAREHOLDER INFORMATION, CORPORATE DIRECTORY, GLOSSARY 203 MY STORY 215
GROWING AN AUSTRALIAN SUCCESS STORY
VISION
To be recognised as a great Australian company and a leading provider of innovative and sustainable mining services and mining operations.
PURPOSE
This year MinRes celebrates 30 years in business.
From humble beginnings as a two-person crushing contractor in 1992, we have built a reputation for delivering best-in-class mining services to the Western Australian mining sector.
Today we are an ASX 50 company with nearly 5,000 people in our team.
We’re a recognised market leader in the delivery of mining services to some of the world’s largest mining companies, and we’re growing our own world-class portfolio of iron ore and lithium operations, with 20-to-50-year business horizons.
With a major gas discovery in the Perth Basin, our energy business is dedicated to finding cleaner ways to power our operations, including using gas and renewables to displace diesel.
The key to our success is our people and our can-do culture.
This annual report is dedicated to the 5,000 talented and committed individuals who dedicate their working lives to making Mineral Resources the outstanding success story it is today.
To provide innovative and low-cost solutions across the mining infrastructure supply chain by operating with integrity and respect, working in partnership with our clients, our customers, our people and our community.
OUR VALUES
AGILE
• You won’t hear “I don’t know” or “I can’t” very often at MinRes. We employ the best in the business to keep us moving forward
• We act fast and seize opportunities
• We think differently.
FAMILY
• We show up for each other and have each other’s backs
• We care for each other and the world around us
• We celebrate our differences because they make us stronger
• Above all else, we are family.
ACHIEVE
• Every person in our business contributes to our success
• We do challenging work and we achieve incredible things
• We have the courage to take on the impossible and the passion to make it happen.
MINERAL RESOURCES LIMITED 2022 ANNUAL REPORT I 1
I am delighted to share my first letter to shareholders as the Chair of MinRes.
I’d like to start by thanking my predecessor, Peter Wade, for the critical role he played building MinRes into the outstanding success story it is today.
Peter retired in March 2022 after dedicating 23 years to MinRes. This included nine years in Managing Director roles for PIHA, CSI and MinRes, and 14 years as an Executive and Non-Executive Chair.

His career progression from company executive to Chair provided an intimate knowledge of the business and the leadership, expertise, and guidance to enable MinRes to grow into the market leader we are today. I am honoured to follow him and build on his legacy.
I joined the MinRes Board in 2015 because I believe in the exciting, adaptive, and agile culture of the firm, fostered by our Managing Director Chris Ellison, a preeminent leader in the mining industry.
It’s in the MinRes operating DNA to make quick decisions and create opportunities. This has seen the company grow from a humble, two-person crushing business established in 1992, to a top 50 ASX company employing nearly 5,000 people today.
OUR YEAR IN REVIEW
It has been another outstanding year for MinRes. We have built the foundations for transformational growth, while continuing to deliver a strong operational performance in challenging market conditions.
Importantly we kept our people safe, with total recordable injuries down by 29 per cent since FY20 and no lost time injuries throughout the year.
We continue to focus on employee wellness in a holistic sense and consider mental health as important as physical health and safety.
The Parliamentary Inquiry into Sexual Harassment Against Women in the FIFO Mining Industry makes it clear that as an industry we need to make sustained changes to our culture, sites and reporting processes to ensure women feel safe and work in an environment that is free from sexual harassment.
MinRes has already started making progress in these areas. We made decisions three years ago to create a different, safe and community-minded environment for our FIFO workers; one where women and couples can thrive. You can read more about these initiatives in our Managing Director’s Report and Sustainability Report.
Market conditions were volatile during the year with a tough first half financially due to an iron ore price collapse, widening
James McClements | Independent Non-Executive Chair | Cyclist
IT HAS BEEN ANOTHER OUTSTANDING YEAR FOR MINRES. WE HAVE BUILT THE FOUNDATIONS FOR TRANSFORMATIONAL GROWTH, WHILE CONTINUING TO DELIVER A STRONG OPERATIONAL PERFORMANCE IN CHALLENGING MARKET CONDITIONS.
2 I MINERAL RESOURCES LIMITED 2022 ANNUAL REPORT CHAIR'S REVIEW
discounts and cost pressures across the supply chain. MinRes responded by turning off high-cost tonnes at our Yilgarn iron ore hub and slowing capital expenditure.
Financial conditions rebounded in the second half, and MinRes responded to deliver a number of business records, including record iron ore export tonnes at 19.2 million, record earnings before interest, tax, depreciation and amortisation (EBITDA) contribution from our lithium business of over $585 million, and record Mining Services operational and financial performance with 274 million tonnes moved and an EBITDA contribution of $533 million.
To reflect this strong performance and reward our shareholders, the Board declared a final fully franked dividend of $1.00 per share.
BUILDING THE FOUNDATIONS FOR GROWTH
MinRes has a vision to be recognised as one of the great Australian companies and a leading provider of innovative and sustainable mining services. Over the next five years, we aim to make this vision a reality as we work to deliver the most transformational growth period in our history.
Our challenge is to set up for growth by investing in the development of corporate governance, structures, systems, and leadership capability suitable for a significantly larger business, while retaining the adaptive and agile culture that has been a key part of our success.
Succession planning and building more depth in the Board and executive leadership team was imperative during FY22 and this will continue into FY23.
Zimi Meka joined the Board as an Independent Non-Executive Director on 17 May 2022. Zimi has over 35 years’ experience in the design, construction and operation of minerals processing plants and infrastructure and is the Chief Executive Officer and a founding director of consulting and engineering firm, Ausenco.
We also commenced a process to add two new positions to the Board. We are searching for candidates that enhance Board diversity and have specialist skills that reflect the growing needs of the business.
The executive leadership team was expanded with the appointment of two new executives who started in early FY23. Chris Soccio commenced as Chief Executive, Iron Ore on 1 July 2022, and Bronwyn Grieve commenced on 1 August 2022 in the newly-created position of Chief People and Shared Services Officer.
The leadership team at MinRes works at an incredible pace and can identify and capitalise on opportunities like no other business. An example of this was the decision to convert Mt Marion spodumene into hydroxide via toll treatment agreements, which was made during the year. This was not identified in the FY22 budget but ultimately made a significant contribution to financial outcomes.
The Board needs to ensure we design remuneration structures that recognise the DNA of MinRes, including rewarding nimble decision-making that takes advantage of changing market conditions. You can read more about this in our Remuneration Report on page 85.
SUSTAINABLE OPERATIONS
During FY22 we established the Sustainability Committee, which is chaired by Susie Corlett, with Xi Xi and I as members.
The Committee holds bi-monthly meetings to monitor performance on MinRes’ 22 sustainability targets across the six areas of Ethics and Integrity, Climate Change, Social, Health and Wellbeing, Environment, and Diverse and Inclusive Workplaces.
These are issues in our industry, and we accept responsibility as an influential industry participant to achieve better outcomes. Pleasingly, over 85 per cent of our sustainability targets were exceeded, achieved, or demonstrated positive progress over the year.
I encourage you to read our Sustainability Report which details our sustainability management approach and our performance for FY22.
LOOKING AHEAD
FY23 will be an exciting year for MinRes. Our Mining Services business will continue its growth trajectory to double in size over the next five years, while our lithium business will ramp up to full capacity to take full advantage of buoyant lithium market demand and pricing, which are showing no sign of weakening.
We will continue to progress the development of our Onslow Iron and South West Creek iron ore projects, which will potentially quadruple iron ore production in the next five years, transforming this business with lower cost and significantly longer-life operations and setting the iron ore business up for the next 30-to-50 years.
While there are significant geopolitical and economic challenges ahead, including cost and supply chain pressures and a tight labour market, MinRes has the business model, assets, balance sheet and people to continue to deliver superior value to shareholders.
I’d like to thank the MinRes leadership team and Board for their support and guidance during my first months as Chair, and I look forward to seeing you at our AGM later in the year.
James McClements Independent Non-Executive Chair
MINERAL RESOURCES LIMITED 2022 ANNUAL REPORT I 3
I’ve never stopped being excited about the future.
That’s the ethos that MinRes was founded on from day one.
This year marks an important milestone - 30 years since MinRes was born as a two-person crushing company operating out of my lounge room with $10,000 and big dreams.
Fast forward to today, and we have grown to become a diversified top 50 ASX company employing nearly 5,000 people, with a market cap of more than $10 billion.
There’s been enormous change in that period. But our excitement for the future has never wavered.
I want MinRes to always anticipate and help build the future - not let future conditions dictate our success. To always be looking down the road to see what’s next.
As I look down the road today, it’s paved with people who have the ideas and knowhow we need to succeed.
It has never been more important to attract and retain the best people. They are MinRes’ number one resource. And around the world, they are becoming more and more scarce, and in higher demand.
As the business continues its steady growth, we need to find thousands of people over the next five years, in a nation of full employment and the most constrained labour market in a generation.
At MinRes, our focus on addressing this challenge is to become an employer of choice. Where family, culture and conditions are world-class, no matter what part of the business you work in.
It’s something we are driving from the top, with a renewed focus on people and culture driven by a new Chief People and Shared Services Officer, and a commitment to this aim from our entire leadership group.

This year has seen us take a number of important steps down this road.
It’s a year that has also shone a light on a dark story, with brave women coming forward for the Parliamentary Inquiry on sexual harassment in the mining industry, with harrowing tales of abuse and disrespect, and a culture that did not give them justice.
As an industry, we should never ignore these stories. And as the leader of our business, I will never accept or excuse it. We must do better.
Chris Ellison | Managing Director | Fisherman
THE OPPORTUNITIES IN FRONT OF US ARE ENORMOUS. HAVING THE RIGHT PEOPLE IS THE KEY TO THE SUCCESSFUL DELIVERY OF THE NEXT STAGE OF OUR GROWTH.
MANAGING DIRECTOR’S REPORT
4 I MINERAL RESOURCES LIMITED 2022 ANNUAL REPORT
That’s why at MinRes we’re committed to working with the broader industry, through the Chamber of Minerals and Energy Safe and Respectful Behaviours Working Group, and through the practical steps we’ve taken in our own business to create a safe, welcoming and equal workplace.
In particular, I’m proud that our Safe and Respectful Behaviours program expanded during FY22 to include company-wide training on how to identify and report inappropriate behaviour, so it becomes our collective responsibility to never walk past.
The introduction of the Safe Zone mobile application will allow team members to send an alert if they feel unsafe, and risk assessments for the prevention of workplace violence and aggression have been completed.
I’m proud that this year saw an increase in female participation from 17 per cent to 20 per cent, but there is so much more work to do. Our Gender Equity Strategy outlines the key focus areas for the years ahead, including increasing MinRes’ female representation to over 22 per cent, reviewing and updating existing policies and procedures to ensure they are equitable to all employees, a gender pay equity review, and year-on-year improvement in the Workplace Gender Equality Agency report.
We also know that to be the employer of choice, we must create a workplace that suits the lifestyles and aspirations of a broader range of potential employees. That means better amenities, with work underway for high-quality resort-style accommodation and facilities, whether you’re in the office, on the mine site or helping get our resources to market.
At MinRes, we’re a family. And ultimately, I want us to always be a family business - where couples can work FIFO together
in accommodation that suits them, whatever their roles. Where flexibility of working and support for family circumstances are embedded, so more parents are encouraged to stay in the workforce, and where new generations are encouraged by those who come before them to join the business.
Our new headquarters at 20 Walters Drive in Osborne Park in Perth is the centrepiece of that vision.
Walters Drive sets a new standard for workplace wellness with world-class features including a café, restaurant, commercial gym, creche and wellness centre. The building is targeting the Platinum WELL Standard certification, which has been achieved by only a small number of buildings globally.
The opportunities in front of us are enormous. Having the right people is the key to the successful delivery of the next stage of our growth.
Despite challenging conditions, the past year has seen more outstanding results for MinRes.
Against the headwinds of commodity price and cost pressures, we achieved the second-best financial performance in our history. Revenue was $3.4 billion, down eight per cent on FY21, and underlying EBITDA was $1 billion, down 46 per cent on FY21.
The projects we’re undertaking today will set the business up for continued growth of 30 years or more. To help meet the potential of this next phase of growth, our internal structure and governance needs to evolve and grow too.
That’s why we’ve restructured the business under four growth pillars of mining services, iron ore, lithium and energy. Each growth area will operate as a separate business drawing on centralised shared services from MinRes.
Our People and Shared Services division will support our growth businesses by delivering the structures, systems, processes and people to take MinRes to the next phase of growth.
MINING SERVICES
Our Mining Services business has delivered year-on-year growth of 25 per cent over the last three years. This is the heart of our business and provides long-term annuity revenue with predictable cash flows and returns which are unaffected by commodity prices.
Mining Services continued to deliver outstanding results, with record production volumes of 274 million tonnes, up 10 per cent, and EBITDA of $533 million, up 15 per cent. We were awarded five new contracts throughout the year and had three long-term contracts renewed.
WE ALSO KNOW THAT TO BE THE EMPLOYER OF CHOICE, WE MUST CREATE A WORKPLACE THAT SUITS THE LIFESTYLES AND ASPIRATIONS OF A BROADER RANGE OF POTENTIAL EMPLOYEES.
MINERAL RESOURCES LIMITED 2022 ANNUAL REPORT I 5
OUR LITHIUM DEPOSITS, DOWNSTREAM PARTNERSHIPS AND GLOBAL REACH PUT US IN A UNIQUE POSITION TO CAPTURE MORE OF THE BATTERY SUPPLY CHAIN IN THIS RAPIDLY GROWING GLOBAL MARKET.
IRON ORE
Despite challenging conditions in the iron ore market, including the sharpest fall in the iron ore price in history, we shipped almost 20 million tonnes of iron ore in FY22 and kept costs in line with guidance despite inflationary pressures.
Beyond existing production, this was a year of strong progress in setting up the business for the significant growth ahead, as we race towards becoming a low-cost, long-life iron ore exporter through the development of two high-quality projects - Onslow Iron, in our Ashburton Hub, and South West Creek, in our Pilbara Hub.
This also marked a new stage of our business’ development, with our joint venture with Hancock Prospecting to set MinRes up for future growth with progress on approvals for new rail linkages and the development of the Stanley Point Berth 3 facility at Port Hedland. Once complete, this project could see us shipping an additional 20 million tonnes of iron ore per annum from Port Hedland.
ENERGY
This year also saw us make one of Australia’s largest on-shore gas discoveries, at Lockyer Deep in the Perth Basin. While we continue work developing this asset, it offers the business a unique opportunity not only to grow through potential export opportunities, but to dramatically reduce our carbon emissions, complementing our existing commitment to reduce our carbon footprint.
This discovery also presents a unique and exciting opportunity to power our existing and future operations with low-cost, lower-emissions and abundant power.
It illustrates why we’re focusing on the future, and always looking towards the next thing. I know what we do today can have a profound impact on what our business looks like in decades to come.
LITHIUM
This year saw MinRes cement itself as a global leader in lithium mining, processing and global distribution.
Through our partnership with Albemarle Corporation, we have not only restarted operations at Wodgina, one of the world’s largest hard-rock lithium mines, but also taken our first step into hydroxide processing and marketing through our partnership at Kemerton.
Work underway to restructure the joint venture with Albemarle will further set the business up for future growth and profitability over the long-term.
6 I MINERAL RESOURCES LIMITED 2022 ANNUAL REPORT MANAGING DIRECTOR’S REPORT (CONTINUED)
Our Mt Marion mine in the Goldfields was expanded and will produce 900,000 tonnes of mixed-grade spodumene per annum after the next stage of upgrades. With possession of 51 per cent of the offtake, converted into lithium hydroxide, our partnership with Ganfeng will continue to deliver revenue growth over the coming years.
The exponential demand for battery minerals and lithium-ion batteries presents an exciting opportunity for our business over the medium-term.
Our lithium deposits, downstream partnerships and global reach put us in a unique position to capture more of the battery supply chain in this rapidly-growing global market.
Over the next five years, we are assessing the opportunity to produce lithium hydroxide from our Wodgina mine right here on Australian soil, with planning underway for a potential processing facility in the Pilbara, just like we’ve done with Albemarle at Kemerton.
It’s the first step in our long-term vision to do more with the resources we develop here in Australia – to leverage our strength at the front of the resource supply chain, and work with international partners wanting to secure a pipeline of the resources and products we need as we race towards global decarbonisation.
From a rock-crushing company just 30 years ago, which went on to become one of Australia’s biggest diversified mining services and resource companies, we believe MinRes could be Australia’s first lithium-ion battery cell manufacturer in the not-too-distant future.
We identified lithium as a target commodity more than a decade ago.
Now, not only do we operate two of the world’s biggest lithium mines, but we are rapidly growing the supply chain, having expanded into battery-grade hydroxide production with proven international joint venture partners.
Automakers and governments globally are already looking to secure the global battery supply chains they need to turn the global vehicle fleet green.
Our medium-term ambition is to leverage this global demand, and our current position, to capture the full battery supply chain – from hard-rock mining, to processing, constructing new facilities powered with our own gas, and working with the world’s best to manufacture battery cells right here in Australia.
It’s not just good business, it’s the right thing to do.
I believe we can’t, and shouldn’t, continue to just dig up Australia’s resources and ship them overseas for others to create more value.
We can do more with our resources. Make more and give back more to Australia in high-tech jobs and economic activity and help secure our sovereign capability.
And in doing so, we’ll be contributing to the decarbonisation of our planet.
MinRes is an active member of the UN Global Compact and is committed to embedding the principles on human rights, labour, environment, and anti-corruption as part of our strategy and day-to-day operations. This Annual Report along with our 2022 Sustainability Report forms our Communication on Progress (CoP), and reflects our ongoing commitment to the UN Global Compact and our progress toward implementation of the principles.
In every aspect of our business – from sustained growth in services, growth in commodities, to the projects that set us up for the future and the people who will help get us there – MinRes is well positioned for the future.
A lot has changed in the last 30 years. But we’re as ambitious as ever.
Chris Ellison Managing Director
MINERAL RESOURCES LIMITED 2022 ANNUAL REPORT I 7
JULY 2021
6 JULY
EnRes secures a drilling rig for a conventional gas exploration well Lockyer Deep-1, in Perth Basin. Drilling commences during July.
SEPTEMBER 2021
8 SEPTEMBER
Significant conventional gas discovery made in Lockyer Deep-1 drilling program.
22 SEPTEMBER Locker Deep-1 gas discovery exceeds predrill expectations.
27 SEPTEMBER
In a world first, MinRes achieves a successful demonstration of a triple-trailer automated road train, commencing work at our Yilgarn Iron Ore operations.
NOVEMBER 2021
29 NOVEMBER
MinRes enters into an agreement with Hancock Prospecting and Roy Hill Holdings to investigate a new iron ore export facility at Port Hedland’s Stanley Point Berth 3 in South West Creek, with Roy Hill providing rail haulage and port services for the project.
2 AUGUST
MinRes announces the acquisition of Red Hill Iron’s 40% participating interest in the Red Hill Iron Ore Joint Venture in the West Pilbara region of WA.
3 AUGUST
The world’s first carbon fibre screen, designed and built by MinRes, was successfully installed at Mt Marion, replacing the traditional steel screens, and increasing productivity.
AUGUST 2021
25 OCTOBER
MinRes announce the restart of the Wodgina Lithium Mine through MARBL Joint Venture with Albemarle.
OCTOBER 2021
2 DECEMBER CSI Mining Services are awarded a contract by Roy Hill at its iron ore operation in WA’s Pilbara region.
13 DECEMBER Reed Advanced Materials JV (Mineral Resources 30 per cent / Neometals 70 per cent) agree to evaluate a lithium refinery (25,000tpa) in Portugal with Bondalti Chemicals, S.A.
DECEMBER 2021

8 I MINERAL RESOURCES LIMITED 2022 ANNUAL REPORT MINRES A YEAR OF ACHIEVEMENTS
2022
25 JANUARY
The Board Sustainability Committee is established.
MARCH 2022
2 MARCH
Peter Wade retires as Non-Executive Chairman after 23 years – James McClements is announced as successor.
28 MARCH
Initial well testing activities of the gas discovery at Lockyer Deep-1 completed, confirming excellent reservoir quality.
31 MARCH Gendered Violence Position Statement and New Climate Change Policy launched.
2022
3 MAY MinRes successfully completes $US1.25 billion senior unsecured notes bond raise in the US market.
3 MAY CSI Mining Services awarded a 10-year crushing services contract by Core Lithium for the Finniss Lithium Project in the Northern Territory.
12 MAY MinRes produces first spodumene product from newly-restarted Wodgina mine site.
17 MAY Zimi Meka is appointed to the MinRes Board as a NonExecutive Director.
24 MAY MinRes reaches agreement with Buru Energy to match an Australian Federal Grant of up to $7 million awarded to Buru for a three-year Carbon Capture Storage feasibility study in the onshore Northern Carnarvon Basin.
1 FEBRUARY
The WA Government allocates MinRes and Hancock Prospecting (HanMin JV), Stanley Point Berth 3 at the port of Port Hedland, paving the way for the development of an additional iron ore export berth.
8 FEBRUARY
Goldfields Aboriginal Business Chamber partnership launched.
9 FEBRUARY
MinRes restructures lithium business announcing proposed changes for MARBL and the decision to take possession of 51 per cent share of Mt Marion spodumene offtake.
23 FEBRUARY
Safe Zone App introduced across MinRes operations. The app supports the reporting of anti-social behaviour or medical emergencies.
1 APRIL
MinRes’ first Reconciliation Action Plan endorsed by Reconciliation Australia.
5 APRIL
MinRes announces the intention to upgrade Mt Marion lithium mine to double spodumene production from 450,000 tonnes to 900,000 tonnes of mixed grade per annum.
18 APRIL
Installation completed of 2.1MW Solar Array at Wonmunna.
APRIL 2022
2 JUNE MinRes enters partnership with Marquee Resources to explore a lithium joint venture across the West Spargoville Project in WA.
3 JUNE MinRes enters the ASX 50 Index.
13 JUNE MinRes moves into new WELL standard building at 20 Walters Drive, Osborne Park.
JUNE 2022

JANUARY
MAY
FEBRUARY 2022
MINERAL RESOURCES LIMITED 2022 ANNUAL REPORT I 9
 Sharon Thomson | Recruitment Team Lead | Hockey Goalkeeper
FINANCIAL OVERVIEW
MINERAL RESOURCES LIMITED 2022 ANNUAL REPORT I 11
12 I MINERAL RESOURCES LIMITED 2022 ANNUAL REPORT WHILE COMMODITY PRICES AND COST PRESSURES IMPACTED FINANCIAL RESULTS, MINRES CONTINUED ITS RUN OF STRONG FINANCIAL PERFORMANCES, LEAVING OUR BUSINESS WELL POSITIONED FOR THE FUTURE.
 Mark Wilson | Chief Financial Officer and Company Secretary | Black Belt Aikidoist
FY22 was a year of two halves. The first half was tough financially, with iron ore prices falling almost US$130 per tonne in a little over two months. At the same time, product discounts increased and we faced considerable cost pressures across the supply chain, particularly with our shipping and haulage.
Market conditions rebounded in the second half, and by the end of the year the business had delivered record iron ore export tonnes of 19.2 million tonnes, and record Mining Services volumes with 274 million tonnes moved. Our Mining Services business remains at the core of our operations and delivered record EBITDA of $533 million
Our decision to take control of our Mt Marion offtake in February 2022 also made a significant impact on our earnings, by allowing us to downstream process, for the first time, our share of product into lithium hydroxide. The market for lithium in the second half was very strong and helped us deliver a record lithium EBITDA contribution of $585 million for the year.
Total revenue was $3.4 billion, down eight per cent on the prior year as a result of lower iron ore prices, and we continued to deliver strong Return on Invested Capital (ROIC) at 14.1 per cent. While underlying EBITDA was down 46 per cent to $1 billion compared to the prior year, FY22 saw our second best financial performance in our history.
The expansion of our lithium business, including our move into downstream processing, impacted our operating cash flow, which reduced to $344 million.
We continued to reinvest heavily in projects that will support the long-term future of our Company. We invested $800 million in FY22, with more than half spent on growth projects including the restart of our Wodgina lithium mine, the development of our Wonmunna iron ore operation, our natural gas drilling program and early development activities on Onslow Iron.
In May we took steps to strengthen our balance sheet in the face of an uncertain external environment, by raising US$1.25 billion through a new bond issue which was conducted in a difficult market. The issue was heavily oversubscribed, demonstrating the confidence investors have in our business.
We are well positioned to support our next phase of growth with a strong balance sheet, holding cash and cash equivalents of $2.4 billion as at 30 June 2022.
14 I MINERAL RESOURCES LIMITED 2022 ANNUAL REPORT
REVENUE $3.4bn ▼ 8% OPERATING CASH FLOW $344M ▼ (79)% ROIC (After Tax) 14.1% UNDERLYING EBITDA $1.0bn ▼ (46)% CASH $2.4bn US BOND NOTES US$1.25bn CAPEX $800M INDEX INCLUSION ASX50 MINRES FINANCIAL OVERVIEW
 Nicholas Bakker | Safety Advisor | Triathlete
16 I MINERAL RESOURCES LIMITED 2022 ANNUAL REPORT MINRES LONG TERM VALUES TSR GROWTHSECOND HIGHEST IN ASX 200 30% PA SINCE LISTING $7.4bn SINCE LISTING UNDERLYING EBITDA A DECADE OF CONSISTENT DIVIDEND GROWTH 20% PA FULLY FRANKED AVERAGE RETURN ON INVESTED CAPITAL AFTER TAX1 21% PA SINCE LISTING TRACK RECORD SNAPSHOT 1 Rolling Average Return on Invested Capital from FY07-FY22. 4 yr Rolling Ave ROIC Annual ROIC RETURN ON INVESTED CAPITAL AFTER TAX (ROIC) SINCE LISTING 2007 2008 2009 2010 2011 2012 2013 2014 2015 2016 2017 2018 2019 2020 2021 2022 60% 50% 40% 30% 20% 10% 0% -10% CUMULATIVE RETURNS TO SHAREHOLDERS GROWTH IN DIVIDENDS ($bn) - 10 YEARS TO 30 JUNE 2022 Cumulative dividends declaredInvested Capital 7.0 6.0 5.0 4.0 3.0 2.0 1.0 0.0 2013 2014 2015 2016 2017 2018 2019 2020 2021 2022 Cumulative operatingcash flow before interest and tax
DELIVERING A DECADE OF STRONG FINANCIAL RETURNS
EARNINGS
Revenue 1,097 1,899 1,299 1,178 1,458 1,624 1,512 2,125 3,734 3,418
473 575 386 2,006 2,183 969
1,002 1,268
11%
Diluted
(cents/share) 97.37 124.1 41.52 -13.31 107.66 145.3 87.09 532.96 673.18 184.87
BALANCE SHEET
Total Assets 1,804 1,858 1,592 1,618 1,835 2,085 3,161 4,631 5,724 7,811
Total Equity 1,018 1,139 1,082 1,009 1,132 1,305 1,380 2,296 3,246 3,271
Net tangible assets per share ($/share) 5.08 5.75 5.44 5.14 5.64 6.58 6.89 11.78 16.55 16.67
CASH GENERATION
Operating Cash Flow3 329 567 52 316 296 411 186 674 1,642 344
Net (Debt)/Cash (310) 81 118 188 104 1 (897) 231 280 (698)
MARKET CAPITALISATION
Number of shares on issue (millions) 186 187 188 187 187 188 188 188 189 189
Share price at 30 June ($/share)2 8.25 9.59 6.60 8.31 10.85 16.00 14.98 21.17 53.73 48.27
Market Capitalisation 1,534 1,789 1,238 1,553 2,033 3,003 2,818 3,990 10,141 9,133
RETURNS TO SHAREHOLDERS
Total Shareholder Return (cumulative) ($/share) 9.07 11.03 8.44 10.38 13.34 19.07 18.58 25.31 59.64 55.93
Dividends declared (cents/share) 48 62 22.5 29.5 54 65 44 100 275 100
1
2
3
Financial Year NPAT
Shareholder Return
Earnings Per Share
Deferred Tax Asset on
MRRT
abolition of the Minerals Resource Rent Tax (MRRT).
paid per share since listing.
cash flow
tax paid
$65
Wodgina disposal.
FY22
Pilbara Minerals (ASX:PLS) and tax paid of $333 million and $79 million in FY21 and FY20 respectively
MINERAL RESOURCES LIMITED 2022 ANNUAL REPORT I 17 MINRES HAS DELIVERED A DECADE OF STRONG FINANCIAL RETURNS AND HAS THE BUSINESS MODEL, INVESTMENT OPPORTUNITIES, BALANCE SHEET, PEOPLE AND EXPERIENCE TO CONTINUE TO DELIVER SUPERIOR VALUE TO SHAREHOLDERS. Financial Summary ($millions unless otherwise stated) 2013 2014 20151 2016 2017 2018 2019 2020 2021 2022
EBITDA 383 554 283 278
NPAT 180 231 78 -26 201 272 165
351 Return on Revenue % 16% 12% 6% -2% 14% 17%
47% 34% 10% Return on Equity % 18% 20% 7% -3% 18% 21% 12% 44% 39% 11%
EPS
2015
and
exclude the impact of the reversal of
the
NPAT for the 2015 Financial Year would be $12,814,000 and Diluted EPS 6.85c/share if the impact of
were to be included.
Total
is calculated as the cumulative share price appreciation and dividends
Operating
excludes
of
million in
on divestment of
on the
MINRES AT A GLANCE: VALUE CREATION
INPUTS
HUMAN CAPITAL: Our employees and contractors (nearly 5,000 as at 30 June 2022) who provide the skills, experience and knowledge required to undertake our business activities.
NATURAL CAPITAL: The natural resources such as water, land, materials and energy required to undertake our business activities.
SOCIAL AND RELATIONSHIP CAPITAL: The relationships we have with communities, government agencies and other stakeholders, as well as our reputation and brand that are essential to our social licence to operate and the long-term sustainability of our business.
FINANCIAL CAPITAL:
The pool of funds provided by shareholders, bondholders and banks, or generated through investments and operations that are required to undertake our business activities.
MANUFACTURED CAPITAL: The manufactured tangible objects such as buildings, plant, equipment and infrastructure that are required to undertake our business activities.
INTELLECTUAL CAPITAL: Intangible aspects such as intellectual property, organisational knowledge, systems and processes required to undertake our business activities.
VALUE CREATION MODEL
DURING THE YEAR WE RESTRUCTURED OUR BUSINESS UNDER FOUR GROWTH PILLARS - MINING SERVICES, IRON ORE, LITHIUM AND ENERGY.
Each growth pillar will operate as a separate business drawing on centralised shared services from MinRes.
These pillars are targeted for transformational growth over the next five years and require focused services and specialised skills to ensure they are set up for growth and success.
This structure aims to deliver value to shareholders by:
• Mining Services – Doubling in size over the next five years, as we build, own and operate a significant portfolio of world-class assets, while continuing to offer our Tier 1 clients pit-to-port solutions
• Iron Ore – Increasing production from 20Mtpa to a targeted 90Mtpa+ through the development of our three iron ore hubs in Ashburton, Pilbara, and Yilgarn
• Lithium – Becoming a top five hydroxide producer and creating a significant cost advantage through a fully-integrated business model
• Energy – Displacing diesel with gas and solar across MinRes operations, and investigating downstream opportunities including LNG and iron ore pellet manufacturing
Double in size over the next 5 years
Top 5 hydroxide producer. Full vertical integration - pit to battery manufacturer
IRON ORE Transition to large, low cost producerincrease production to 90Mtpa+ in 5 years
Decarbonise & power MinRes operations. Investigate downstream opportunities
MINING SERVICES
LITHIUM
SHARED SERVICES DELIVERING THE STRUCTURES, SYSTEMS AND PEOPLE TO TAKE MINRES TO THE NEXT PHASE OF GROWTH Safety, Health & Wellbeing, Finance, Procurement, Human Resources, IT, Corporate Affairs, Environment & Approvals, Community & Stakeholder Engagement
ENERGY
18 I MINERAL RESOURCES LIMITED 2022 ANNUAL REPORT
OUTCOMES
HUMAN CAPITAL TRIFR 2.33
LTIFR 0
Employee wages and benefits paid $631M
Overall female representation 20%
Graduates, Apprentices and Trainees 139
NATURAL CAPITAL
Energy consumption 5,025,719GJ
Solar energy generation 3,499GJ
Scope 1 and 2 GHG emissions 340,515tCO2e
Rehabilitated land 1,153ha
SOCIAL AND RELATIONSHIP CAPITAL
Community contributions $5.77M
Suppliers screened for Modern Slavery 2,682
Payment to Federal, State and Local Governments $397M
FINANCIAL CAPITAL
Underlying net profit after tax $400M
Share price as at 30 June 2022 $48.27
Dividends (fully franked) $1.00
MANUFACTURED CAPITAL
Capital expenditure $800M
Mines owned/operated 5 Crushing and processing operating plants 26
INTELLECTUAL CAPITAL
NextGen 2 modular crushing plant 5Mtpa - 50Mtpa
Spodumene concentrate processing 1.65Mtpa1
Kemerton lithium hydroxide 50ktpa capacity1
1 On completion of approved mine upgrades
MINERAL RESOURCES LIMITED 2022 ANNUAL REPORT I 19 FY22 OUTPUTS RETURN ON INVESTED CAPITAL (ROIC) 14.1% IRON ORE PRODUCTION 19.2Mt SPODUMENE PRODUCTION 442k dmt MINING SERVICES VOLUME INCREASE 10% COVID-19 SCREENINGS 24,603 TOTAL MATERIAL MOVED 136,877Mt FY22
and plant construction.
 Ryan Zammit | Electrician | Gamer
OPERATIONAL REVIEW
MINERAL RESOURCES LIMITED 2022 ANNUAL REPORT I 21
22 I MINERAL RESOURCES LIMITED 2022 ANNUAL REPORT MINRES IS A PROUD WESTERN AUSTRALIAN COMPANY SUPPORTING TIER 1 CLIENTS ON MORE THAN 20 WORLD-CLASS MINING OPERATIONS ACROSS WESTERN AUSTRALIA AND THE NORTHERN TERRITORY. WE’RE ALSO GROWING OUR OWN WORLD-CLASS PORTFOLIO OF IRON ORE AND LITHIUM OPERATIONS, WITH 20-TO-50 YEAR BUSINESS HORIZONS AND WE’RE THE LARGEST GAS ACREAGE HOLDER IN THE PERTH AND CARNARVON BASINS.
BUNGAROO SOU TH WESTERN AUSTRALIA OPHT HALMIA KE ME RT ON NEWM AN KWINANA WORKSHOP UT AH PO INT SOU TH WE ST C REE K PO R T HEDL AND TOM PRI CE MAR IL LANA K UM INA G ER A LDTO N IR ON VAL LE Y K OO L YANOBB ING WO DGI NA WONMUNN A ONSL OW ESPER ANCE KAL G OO RLIE MT MARIONPA RKE R R AN GE B UNB UR Y C ARI NA PE RTH NORTHERN TERRITORY SOUTH AUSTRALIA MINRES IRON ORE MINRES LITHIUM CSI MINING SERVICES ENERGY RESOURCES EP SEA PORT OFFICE/WORKSHOP MINRES DEVELOPMENT PROJECT TOWNRAIL LINE ROAD
 Mike Grey | Chief Executive - Mining Services | Antique Collector
CSI HAS MULTIPLE CONTRACTS AT TIER 1 MINE SITES OWNED BY LEADING GLOBAL MINING COMPANIES, WITH MANY CUSTOMER RELATIONSHIPS SPANNING DECADES.
MinRes’ mining services are delivered by our CSI Mining Services business (CSI). CSI is a leading provider of innovative and sustainable mining services. Our pit-to-port mining services offering is unique to the resources industry and spans construction, engineering, mining, crushing, processing, haulage and village services.
CSI has multiple contracts at Tier 1 mine sites owned by leading global mining companies, with many customer relationships spanning decades.
Innovation drives the CSI competitive advantage and is the key to its continued growth. As MinRes progresses the development of stranded assets across Western Australia, the pit-to-port supply chain will provide additional growth for CSI’s unique build, own, operate model.
In a very successful year, CSI achieved record production volumes and year-on-year growth of 10 per cent. A 100 per cent retention rate on the renewal and extension of existing contracts illustrates CSI’s ability to retain customers through a solid track record of delivery and industry-leading safety performance.
CRUSHING AND PROCESSING
CSI has a history of safely providing industry-leading crushing, screening and processing solutions for some of the world’s largest mining companies.
During the year, CSI’s crushing and processing team was awarded two new contracts. One contract builds on an existing, longstanding relationship and will see CSI provide an expanded scope of work including crushing, screening and haulage services.
The second contract was for a new lithium client, bolstering CSI’s existing lithium crushing portfolio and making it the dominant crushing contractor for hard rock lithium operations. In a business first, CSI will produce its own crushers under licence for installation at the project, which offers a reduced cost and improved lead-time.
CSI’s carbon fibre manufacturing facility is a world leader in the use of carbon fibre for mining equipment. The team has developed a carbon fibre vibrating screen which takes the place of traditional steel vibrating screens and brings a host of cost and productivity benefits. The screen components are lightweight, corrosion resistant and have a significantly higher structural strength than steel. The first carbon fibre screen was completed in the first quarter and successfully installed at Mt Marion, with a series of additional screens for Mt Marion now in production.
MINING
CSI’s mining offering spans mine planning and technical services, drill and blast and load and haul services. Drill and blast and load and haul services are provided to both MinRes-owned and client operations.
During the year, CSI was awarded two new load and haul contracts with an existing client, building on a successful relationship which spans almost 18 years.
CAMPS AND AIRPORTS
CSI builds, owns and operates its own camps and accommodation and is considered an industry leader in camp services. An increase in activity on MinRes mine sites resulted in greater activity for our Site Services division.
The Site Services delivery team was well equipped to manage the ongoing impacts of COVID-19 during the year to ensure a high level of safety and wellbeing for MinRes people and visitors.
In line with a heightened focus on safe and respectful behaviours on site, a suite of initiatives were introduced including a review of alcohol limits, promotion of alcohol-free social activities, 24-hour security services, nightly security patrols, CCTV enhancements and the installation of security gatehouses. A new app, Safe Zone, was implemented across MinRes-owned sites, and this can be used to report anti-social behaviour or seek assistance in the event of a medical episode.
MINERAL RESOURCES LIMITED 2022 ANNUAL REPORT I 25 OPERATIONAL REVIEW - MINING SERVICES
OPERATIONAL REVIEW - MINING SERVICES (CONTINUED)
MinRes places a high priority on quality village accommodation and services and during the year a number of villages were upgraded to improve the site experience. At Mt Marion, 40 new rooms were added, the dining room and gym were expanded, and a new café offers barista-made coffee.
MinRes continued to manage its own airports at the Windarling and Carina mines in the Yilgarn region and the Wodgina mine in the Pilbara region, each facilitated through an Aerodrome Manager.
HAULAGE
CSI offers a full range of pit-to-port solutions including a fleet of 425 tonne gross combination mass jumbo road trains, 140 tonne quad road trains and a fleet of in-house rail locomotives and wagons.
This extensive haulage capacity and proven track record provides the opportunity for CSI to extend its services to its blue-chip clients. During the year, CSI was awarded its first external off-highway road train services contract, building on an existing relationship established through the long-term provision of crushing and processing services.
CSI announced a partnership with a leading automation specialist to develop an autonomous road train solution as part of the mining services infrastructure supply chain solution that is key to unlocking stranded tonnes in the Pilbara.
In a world first, the autonomous road trains project achieved a successful demonstration run of a triple-trailer, automated road train platoon. The demonstration showcased the success of the autonomous road trains pilot project, which commenced at MinRes’ Yilgarn iron ore operations in late 2021. You can read more about our innovative haulage solutions on page 29.
TRANSHIPPING
MinRes Marine, a wholly-owned Mineral Resources subsidiary, has been established with the capability and experience to design, build, commission and operate marine assets.
MinRes Marine has contracted the Cosco Zhoushan shipyard in China to construct the transhipment barges and work has commenced on the first two. MinRes Marine recently confirmed orders for a further two transhipment barges to be delivered in line with the projected Onslow Iron production ramp-up.
MinRes Marine has also purchased four tugs which will be converted to suit the transhippers’ articulated tug and barge configuration. The tugs will be extensively refurbished to ensure a high standard of health and wellbeing for the crews onboard. Work is expected to commence on the first tug in mid-FY23. You can read more about our innovative transhipping solutions on page 30.
26 I MINERAL RESOURCES LIMITED 2022 ANNUAL REPORT
 Joshua Thurlow | Executive General Manager - Project Development | Surfer
 Emeritus Professor Colleen Hayward AM | Cultural Consultant | Lover of Sports and Culture
OPERATIONAL REVIEW - INNOVATION (CONTINUED)
INNOVATION
MinRes’ success lies in our foundations as a Mining Services company. It’s in our DNA to aim higher, push the boundaries and forge new paths.
We’ve developed a suite of innovative and proprietary equipment designed to process and move bulk commodities at lower costs and with a reduced environmental footprint. This equipment allows MinRes to unlock stranded assets that would otherwise remain undeveloped.
We are also setting a new standard for FIFO employees by introducing the industry’s first resort-style accommodation designed to provide a more comfortable home-away-from-home and attract more women and couples to work in the industry.
NEXT GEN CRUSHERS
The Next Gen Crushers are a unique MinRes design. These relocatable crushers will displace higher-cost fixed plants and improve the environmental impact of crushing construction and operations.
With capacity ranging from 5-50 million tonnes per annum, the crushers significantly lower dust and noise emissions, consume less energy, and can be rapidly deployed in remote operations.
BENEFITS
• Lower dust and noise emission
• Rapid deployment - plug and play
• Remote operations capability
• Lower operating and maintenance costs
• Displaces higher-cost fixed plants
HAULAGE SOLUTIONS
MinRes has designed 320 tonne road trains in collaboration with Kenworth to reduce the environmental impact and costs of haulage. These jumbo road trains are manufactured locally, and their significant size reduces the amount of traffic on roads. The costs of mine site to port haulage are reduced by 50 per cent and product gets to market faster than when using rail.
In a world first, autonomous testing is underway and the road trains are expected to be fully autonomous by the end of 2023, improving safety outcomes.
On the Onslow Iron project in the Shire of Ashburton, MinRes is planning to transition 170 of these jumbo road trains from diesel to electric by 2025, providing a fully electric transport solution from mine gate to port. The road train batteries will be charged with renewable and gas-fired energy. This electrification project will displace 44 million litres of diesel each year - about a third of MinRes’ total diesel usage - and will reduce carbon emissions by 120,000 tonnes per annum.
BENEFITS
• Less traffic on roads
• Half the cost from mine site to port
• Quicker to market than rail
• Automation testing underway
• Electric by 2025 – reducing carbon emissions by 120,000 tonnes per annum
MINERAL RESOURCES LIMITED 2022 ANNUAL REPORT I 29
OPERATIONAL REVIEW - INNOVATION (CONTINUED)
TRANSHIPPERS
The Onslow Iron transhipping solutions are designed by MinRes with the support of naval architects and engineering firms in Australia and Canada. The vessels have a 20,000 tonne capacity and are fully enclosed and dust free. They feature an articulated tug and barge solution with single point loading and are self-discharging.
The transhippers have a significantly lower environmental footprint when compared to major dredging and deep-water berths, along with superior safety, efficiency and productivity. The transhippers are part of MinRes’ solution to bring stranded tonnes to market and lower the capital cost of port development. Iron ore will be loaded onto cape-size carriers offshore - the most cost-effective way to transport iron ore.
BENEFITS
• Lower environmental footprint
• Superior safety, efficiency and productivity
• Helps monetise stranded tonnes
• Lower capital cost
• All tonnes onto cape-size carriers offshore
RESORT STYLE ACCOMMODATION
MinRes recognises people as the foundation of our success and we are committed to looking after our employees’ physical and mental health. This includes setting a new standard for FIFO accommodation with our new resort-style accommodation - an industry first.
Our resorts will encourage women and couples to live and work on site and will feature rooms three times the size of traditional FIFO accommodation, together with restaurants, tavern, commercial gym, an Olympic sized swimming pool and a wellness centre.
BENEFITS
• Supports employee health and wellbeing
• Apartments three times the size of traditional accommodation
• Quality fit out
• Resort-quality facilities and amenities
Living Area 11.00m2 30.00m2 +19.00m2
Ensuite 3.50m2 6.00m2 +2.50m2


Private Alfresco Nil 12.00m2 +12.00m2
Total Area 14.50m2 48.00m2 33.50m2
Traditional accommodation
Resort-style accommodation - three times the size and significantly greater quality than standard accommodation
Space Traditional Accommodation MinRes Resort Accommodation Additional Area
30 I MINERAL RESOURCES LIMITED 2022 ANNUAL REPORT
 Angie Olsen | Site Administrator | LP Record Collector

IRON ORE IS ONE OF MINRES’ KEY GROWTH PILLARS AND SINCE PRODUCTION COMMENCED IN 2010, THE COMPANY HAS GROWN TO BECOME THE FIFTH-LARGEST IRON ORE PRODUCER IN AUSTRALIA.
MinRes has three iron ore hubs: the Yilgarn, Pilbara, and Ashburton Hubs. Planned development at these hubs underpins MinRes’ iron ore strategy to transition from short-life, high-cost mines to lower cost, long-life operations, underpinned by innovative infrastructure solutions.
Despite constraints, including the continued impact of COVID-19 and a significant decline in the iron ore price, it was a successful year for the business. Total iron ore shipments from the Yilgarn and Pilbara Hubs were 11 per cent higher than FY21.
YILGARN HUB
The Yilgarn Hub is located in Western Australia’s Goldfields region and incorporates the Koolyanobbing, Parker Range and Carina mines.
MinRes acquired the Parker Range Project, located 85 kilometres from the Koolyanobbing mine site, in 2019. First ore was achieved from Parker Range in the first quarter of FY22. In response to the downturn in the iron ore price, operations at both Parker Range and Carina were paused until the third quarter, when prices rallied and operations successfully recommenced. Personnel from Parker Range and Carina were redeployed to other MinRes operations during the shutdown, and then brought back to site to recommence operations, with no jobs lost.
Upgrades at the Carina iron ore train load out area created greater flexibility to process ore for shipment from the Yilgarn Hub. The Carina rail loop, which previously supported travel towards the Kwinana Port, was upgraded to a bi-directional rail loop enabling trains to travel simultaneously to Kwinana and the Port of Esperance.
In a world first, an autonomous road train pilot project began at the Yilgarn Hub in late 2021. A significant milestone was achieved with a successful demonstration run of an autonomous road train platoon, consisting of three prime movers each pulling three
trailers, hauling 300 tonnes of iron ore. These road trains will form an essential part of the cost-efficient supply chain unlocking stranded resources in the Pilbara region as part of the Onslow Iron project.
MinRes’ iron ore growth strategy includes the transformation of its Yilgarn Hub from a hematite to magnetite operation, which will extend the life of the operation. Promising results were received from a proof-of-concept drilling program, and a Koolyanobbing Magnetite Phase 1 drilling program commenced in the fourth quarter to understand the resource potential of an initial mining area footprint.
PILBARA HUB
The Pilbara Hub includes MinRes’ Wonmunna and Iron Valley mine sites, with product from both sites hauled via road to Port Hedland for export from Utah Point.
Wonmunna is located 80 kilometres north-west of Newman and 360 kilometres south of Port Hedland in the Pilbara. Purchased as an undeveloped project from the Australian Aboriginal Mining Corporation in FY21, first ore was achieved just five months after construction began at the site.
During FY22, plant upgrades and modifications were undertaken to enable further flexibility to meet blending requirements, including the addition of a tertiary plant so production can alternate between a ‘lump and fines’ and ‘all-in fines’ product. Production from Wonmunna ramped up during the year.
Iron Valley is MinRes’ oldest iron ore producing mine and is located 75 kilometres north-west of Newman. During the year, an engineering study was completed and technical design changes implemented to improve wet feed materials handling. This included the introduction of belt feeders designed by MinRes’ in-house carbon fibre manufacturing team.
MINERAL RESOURCES LIMITED 2022 ANNUAL REPORT I 33 OPERATIONAL REVIEW - IRON ORE
OPERATIONAL REVIEW - IRON ORE (CONTINUED)
Coinciding with the ramp up of Wonmunna, Iron Valley strategically ramped down to manage costs and ensure grade delivery of the Central Pilbara Blend.
Lamb Creek is a MinRes-owned deposit and exploration project located 50 kilometres west of Iron Valley. Production from Lamb Creek will be incorporated into MinRes’ Utah Point iron ore blend, which includes tonnes from Iron Valley and Wonmunna. A diamond drill program collecting data to inform resource modelling was successfully completed during the year and full approvals are expected in the first quarter of FY23.
The next phase in the development of the Pilbara Hub is the South West Creek project, an integrated pit-to-port iron ore infrastructure solution. Development of South West Creek will follow the Onslow Iron project and provide continuity of employment for MinRes construction crews.
In an unprecedented model of cooperation for the Australian resources industry, MinRes entered into a Port and Rail Agreement with Hancock and Roy Hill to jointly investigate and develop a new iron ore export facility at the port of Port Hedland’s Stanley Point Berth 3 in South West Creek. Roy Hill would provide services to both MinRes and Hancock for development and operation of the project, including rail haulage and port services.
This agreement was subject to an allocation of berth space at the port, which was confirmed by the Western Australian State Government in early 2022. If the project proceeds, MinRes aims to ship approximately 20Mt of iron ore per annum from this berth. The project remains subject to further approvals and agreements, and a positive final investment decision by MinRes and Hancock.
ASHBURTON HUB
The Onslow Iron project (previously known as the Ashburton project) will be transformational for MinRes. The project will use MinRes’ proprietary Mining Services innovations to monetise stranded tonnes in the Pilbara, using unique pit-to-ship infrastructure solutions. It is expected to add 35Mtpa to MinRes’ iron ore business and introduces a low-cost, long-life operation with project economics which are compelling through commodity price cycles.
Onslow Iron will be developed with our RHIOJV joint venture partners AMCI, POSCO and Baowu, and represents a robust investment. Final investment decision (FID) has been received by all joint venture partners. MinRes is ready to commence construction once final government and regulatory approvals are secured.
During Q1, MinRes completed the acquisition of Red Hill Iron’s 40 per cent participating interest in the Red Hill Iron Ore Joint Venture (RHIOJV), as part of a strategy to expand MinRes’ resource inventory around the Ashburton Hub. In line with the terms of the transaction, MinRes paid Red Hill $200 million on completion of the sale, with a further $200 million to be paid on first shipment of iron ore. Following completion of the transaction with Red Hill, MinRes holds a 40 per cent participating interest in the RHIOJV with the Australian Premium Iron Joint Venture holding the remaining 60 per cent.
During the year, significant engineering and detailed design work continued to progress the project, with milestones met for mining, autonomous hauling, transhipping, port and marine infrastructure.
Development activities continued at the Ken’s Bore deposit with the installation of two camps to support drilling and early construction works. A construction compound was established, construction water bores installed, and earthworks commenced on the Onslow Iron Airport. Bulk earthworks and site establishment commenced at the Port of Ashburton. Construction accommodation units were ordered, and site works have commenced in preparation for installation at the Yarri Lease and North West Coastal Highway temporary construction villages.
The Onslow Iron project will set a new standard in accommodation for the resources industry, with resort-style accommodation encouraging greater diversity and couples to live and work on site. Larger rooms, restaurants, tavern, commercial gym, an Olympic sized swimming pool and a wellness centre will help create a home-away-from-home experience.
The project will provide long-term benefits to the local Traditional Owners, the Thalanyji people. MinRes has agreed terms for a 30+ year lease of the Thalanyji freehold land that will host the Onslow Resort accommodation facility. This partnership model is the first of its kind.
34 I MINERAL RESOURCES LIMITED 2022 ANNUAL REPORT
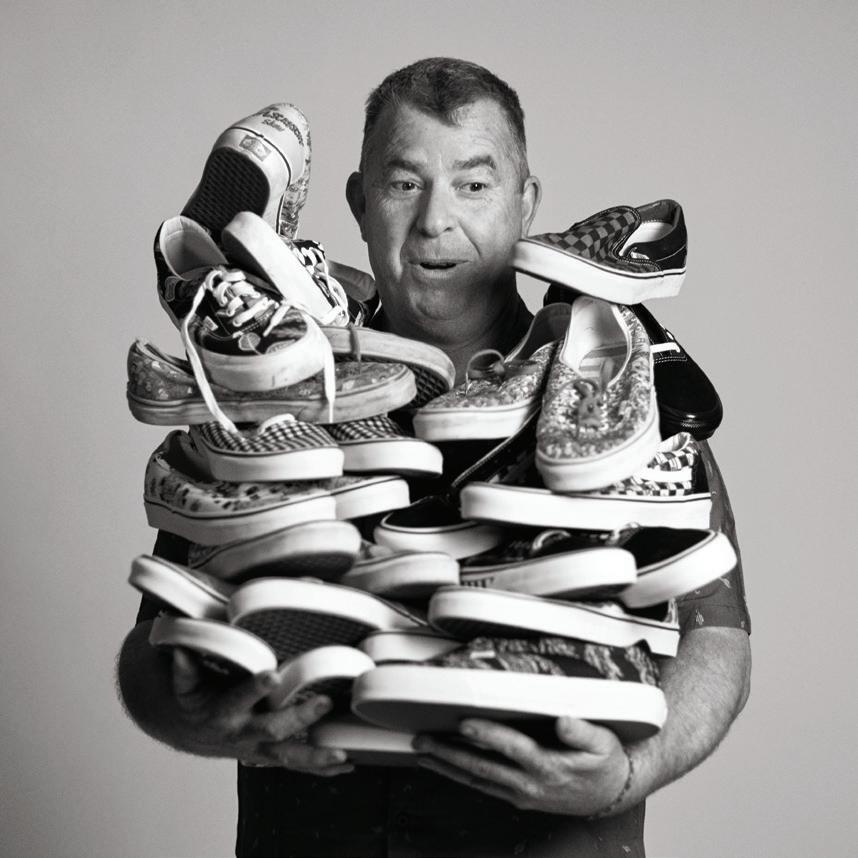 Jason Hampton | Site Manager, Crushing and Processing | Vans Shoe Collector
 Paul Brown | Chief Executive - Lithium | Gym Enthusiast
BATTERY-GRADE LITHIUM PRODUCTS ARE CRITICAL TO A RENEWABLE ENERGY FUTURE AS THE WORLD FOCUSES ON DECARBONISATION AND ACHIEVING NET ZERO CARBON EMISSIONS.
This lightweight and highly reactive metal has become a key component for the manufacture of high-quality lithium-ion batteries, and ongoing advancements in this technology are supporting a renewable energy pathway.
Governments across the world are also implementing emissions reduction targets, encouraging uptake of electric vehicles and supporting energy projects requiring battery storage technology, prompting vehicle and battery manufacturers to secure their supply chains.
Global demand for lithium is expected to significantly increase further over the next 10 years and with supply constrained by available resources, high barriers to market entry, conversion capacity challenges and substantial lead times, lithium prices are expected to remain strong over the medium term.
With Western Australia boasting the world’s second-largest hard rock lithium reserves, and one of the safest mining jurisdictions, MinRes is ideally positioned to service growing demand for high quality lithium products.
The Company identified this opportunity over a decade ago and subsequently built a portfolio of lithium assets delivering long-term value across the supply chain. This includes ownership in two of the world’s largest hard rock lithium mines and strategic partnerships with global leaders in the production and supply of battery-grade lithium hydroxide, which has become the preferred product for battery manufacturers due to its superior energy capacity and battery life.
Rising demand for lithium products has driven significant price increases over the past 12 months. MinRes was quick to respond to the market upswing, leveraging its unique industry position, world-class lithium assets, dedicated local workforce and fully integrated business model to drive strong productivity and returns.
Lithium remains one of MinRes’ key pillars and through an ambitious growth strategy, the Company has built a 30-plus year business horizon that will support the continued growth and diversification of its lithium portfolio in line with growing market demand.
WODGINA LITHIUM OPERATION
The Wodgina lithium operation is located 120 kilometres south of Port Hedland in the Pilbara region of Western Australia.
As one of the world’s largest known hard rock lithium deposits, Wodgina is operated under the MARBL JV - an unincorporated joint venture between MinRes (40 per cent) and leading lithium hydroxide producer, Albemarle Corporation (60 per cent).
MinRes manages all mining operations at Wodgina, including the 750,000 tonnes per annum spodumene concentrate plant. The facility features three processing trains – each with a capacity of 250,000 tonnes per annum of six per cent spodumene concentrate.
In late 2021, following two years in care and maintenance, the MARBL JV announced Wodgina would be brought back online in response to rising global demand for high-quality lithium products. Focus immediately turned to quickly and safely restarting two of Wodgina’s three processing trains, with Train 1 producing first spodumene concentrate ahead of schedule in May 2022. The restart of Wodgina’s second train also progressed well, with first spodumene concentrate delivered in early July 2022 in line with guidance.
In February 2022, MinRes signed a non-binding agreement with Albemarle to explore the potential expansion of the MARBL JV.
MINERAL RESOURCES LIMITED 2022 ANNUAL REPORT I 37 OPERATIONAL REVIEW - LITHIUM
OPERATIONAL REVIEW - LITHIUM (CONTINUED)
In August 2022, first spodumene product since the restart of operations at Wodgina was shipped from Port Hedland on schedule. This shipment will be converted into lithium hydroxide as part of the MARBL JV agreement.
By the end of FY22, the Wodgina restart had progressed with more than 90 per cent of the site’s workforce in place and its mining fleet in position to steadily ramp up operations.
KEMERTON LITHIUM HYDROXIDE PLANT
The Kemerton lithium hydroxide plant is located approximately 150 kilometres south of Perth, near Bunbury in the South West region of Western Australia.
The plant forms part of the MARBL JV - with ownership shared between MinRes (40 per cent) and Albemarle (60 per cent)and will be fed by spodumene concentrate from the nearby Greenbushes mine. Albemarle will exclusively market all lithium hydroxide produced at the site.
Albemarle continues to manage construction of the 50,000 tonnes per annum facility, which achieved mechanical completion of the first of two 25,000 tonnes per annum trains in November 2021. Construction of the second train is scheduled for completion in FY23.
First product from the Kemerton plant was delivered in July 2022, converting a portion of Albemarle’s spodumene offtake from the Greenbushes mine into battery-grade lithium hydroxide.
MT MARION LITHIUM OPERATION
The Mt Marion lithium operation is located approximately 40 kilometres south-west of Kalgoorlie in the Goldfields region of Western Australia.
The operation is jointly owned by MinRes (50 per cent) and one of the world’s largest lithium hydroxide producers, Jiangxi Ganfeng Lithium Co. Ltd (Ganfeng) (50 per cent).
MinRes manages all mining operations at Mt Marion, along with a spodumene concentrate plant featuring a current production capacity of 600,000 tonnes per annum of mixed grade spodumene concentrate.
Through optimised mine planning and an integrated supply chain, Mt Marion transports lithium spodumene concentrate through the Port of Esperance for offshore conversion to lithium hydroxide and supply to global markets by Ganfeng.
In February 2022, MinRes announced it had taken possession and control of its 51 per cent share of Mt Marion spodumene offtake. The Company entered into a toll treatment agreement for its share of spodumene to be converted into lithium hydroxide by Ganfeng in China for an initial seven-month period, which was subsequently extended to November 2022 with scope for further extensions.
In April 2022, following the completion of project studies and positive results from metallurgical test work, MinRes and Ganfeng announced a decision to increase production at Mt Marion from 450,000 to 600,000 tonnes per annum of mixed grade spodumene concentrate. Further site upgrades will support a targeted increase in plant capacity to 900,000 tonnes per annum of mixed grade product by the first half of 2023.
MinRes’ maiden share of offtake for Mt Marion spodumene concentrate was converted into 6,722 tonnes of lithium hydroxide in China during Q4 FY22, marking first earnings from downstream lithium hydroxide production, a significant milestone in the Company’s lithium growth strategy.
38 I MINERAL RESOURCES LIMITED 2022 ANNUAL REPORT
 Jeremy Lozano | Site Chef | Basketballer
 Shelley Robertson | Executive General Manager - Energy | Decorated Hero
MINRES CONTINUES TO PURSUE LOWER COST AND MORE SUSTAINABLE WAYS TO OPERATE, WITH A GOAL OF ATTAINING NET ZERO EMISSIONS BY 2050.
Our Roadmap to Net Zero Emissions was developed in FY21 to identify a decarbonisation pathway to achieve this target as soon as possible. The roadmap and the progress that has been made in FY22 is outlined in the 2022 Sustainability Report
The MinRes Energy team plays a critical role in advancing this roadmap by working across the business to ensure that MinRes’ operations integrate lower emission and renewable energy solutions into future growth and development plans. The Energy team works closely with government, industry and community stakeholders to ensure all new energy opportunities are explored responsibly and safely.
GAS EXPLORATION AND DRILLING
MinRes’ wholly owned subsidiary, Energy Resources Limited (EnRes), is the largest petroleum acreage holder in both the onshore Perth Basin and onshore Northern Carnarvon Basin, with a total acreage position in Western Australia of 13,629 square kilometres.
In the first quarter of FY22, EnRes commenced its maiden drilling program in the Perth Basin. A drilling rig was mobilised to the Lockyer Deep-1 gas exploration well, located on exploration permit EP368 in the Shire of Mingenew. Lockyer Deep is operated by EnRes in joint venture with Norwest Energy (EnRes holds an 80 per cent interest in the JV).
In September 2021, MinRes announced a significant gas discovery at Lockyer Deep-1 within the Kingia Sandstone. Initial well testing activities were completed in the third quarter of FY22, which confirmed excellent reservoir quality, well deliverability and an instantaneous maximum gas flow rate of 117 million cubic feet – one of the highest rates recorded onshore in Australia. Additional gas and condensate data was gathered during the Lockyer Deep-1 drilling program, and further analysis of the gas reservoir will be provided in the first quarter of FY23.
In FY23, the exploration and appraisal program will continue in permit EP368, with drilling of an additional four wells. Another two exploration wells are planned in other acreage held by EnRes in the Perth Basin, with drilling expected to commence in the second quarter of FY23. This will enable EnRes to develop a maiden resource statement and continue reviewing options for gas production and development.
An extensive seismic program was also completed in FY22 which will continue to inform drilling targets and prove up resources in the Perth and Carnarvon Basins.
CARBON CAPTURE AND STORAGE
MinRes recognises carbon capture and storage (CCS) is an important emissions reduction technology that can support the path to net zero. CCS involves capturing carbon emissions at their source and storing these emissions in deep underground rock formations.
In the fourth quarter of FY22, MinRes reached an agreement with joint venture partner Buru Energy to match an Australian Federal Government grant of up to $7 million awarded to Buru for a three-year CCS feasibility study in the onshore Northern Carnarvon Basin. Planning and studies have commenced on a program for Exploration Permit EP 510 (operated by EnRes with a 75 per cent interest) located near MinRes’ proposed Onslow Iron project in the Pilbara.
RENEWABLE ENERGY
MinRes continues to investigate renewable energy for power generation, road transport and mining equipment to support the achievement of net zero emissions by 2050.
Installation of a 2.1 megawatt solar array and battery at the Wonmunna iron ore project in the Pilbara continues to progress. The solar panels have now been installed, with installation of the battery system expected to be completed during FY23. The combined solar-battery system will provide approximately 30 per cent of the site’s energy requirements and reduce carbon emissions on site by around 1,800 tonnes of carbon dioxide each year.
With an expected life of up to 20 years, the solar power station can be redeployed to other operations when Wonmunna reaches its end-of-life.
MINERAL RESOURCES LIMITED 2022 ANNUAL REPORT I 41 OPERATIONAL REVIEW - ENERGY
 George Wan | Geographic Information Systems Officer | Bonsai Artist
SUSTAINABILITY
REVIEW This Sustainability Review summarises MinRes’ sustainability performance in FY22. For the full 2022 Sustainability Report visit www.mrl.com.au. MINERAL RESOURCES LIMITED 2022 ANNUAL REPORT I 43
44 I MINERAL RESOURCES LIMITED 2022 ANNUAL REPORT WE STRIVE TO GENERATE SHAREHOLDER VALUE AND MAINTAIN OUR SOCIAL LICENCE TO OPERATE BY SUPPORTING THE WELLBEING OF OUR PEOPLE, PROTECTING THE ENVIRONMENT AND MAKING A POSITIVE CONTRIBUTION TO THE COMMUNITIES IN WHICH WE OPERATE.
SUSTAINABILITY REVIEW - OVERVIEW
SUSTAINABILITY OVERVIEW
Our sustainability reporting covers activities for which MinRes and our subsidiaries have operational control, and is prepared in accordance with the Global Reporting Initiative (GRI) Standards, the Sustainability Accounting Standards Board (SASB), and recommendations from the Taskforce on Climate-related Financial Disclosures (TCFD) of the Financial Stability Board. Refer to our 2022 Sustainability Performance Tables, available on our website, for a copy of the GRI and SASB content index.
We have obtained external assurance for seven of our sustainability performance indicators. (Refer to our 2022 Sustainability Report for a copy of the Independent Limited Assurance Statement.)
MinRes is an active participant of the United Nations Global Compact (UN Global Compact) and views this report as our Communication on Progress. Our ongoing commitment to the Ten Principles – covering human rights, labour, environment, and anti-corruption – is integrated into our business strategy, culture, and daily operations.
MinRes is committed to continually improving our sustainability performance to provide the metals and minerals the world needs to transition to a low carbon future. We strive to make a difference through our leadership in mining services and operations, encouraging responsible business practices and advancing the UN Sustainable Development Goals (SDGs). MinRes has a Sustainability Policy outlining our commitment to sustainability risk and opportunity identification, management, performance measurement and reporting. The Sustainability Policy is supported by a suite of governance policies including a Human Rights Policy, Anti-Bribery and Corruption Policy and a Supplier Code of Conduct.
To strengthen our commitment, MinRes established a Board level Sustainability Committee in January 2022. The Committee is chaired by our independent Non-Executive Director, Susie Corlett, and is responsible for providing oversight of MinRes’ approach to sustainability management and performance, ensuring the Board is kept informed on emerging areas of sustainability that may impact the Company.
OUR MATERIAL SUSTAINABILITY TOPICS
In line with best practice, our materiality assessment applies GRI Principles for determining report content and is undertaken annually to identify the most critical sustainability issues influencing our ability to create and maintain value in the short, medium and long term.
In FY22, four topics were expanded and addressed separately, including: diversity and inclusion, protection of cultural heritage, responsible and transparent supply chain, and economic performance and value creation. Our previous six material topics remain consistent with our previous reporting periods in FY20 and FY21. Updated material sustainability topics have been outlined in Table 1.
Table 1: MinRes’ material sustainability topics
Theme Material Topic
Our Principles of Governance
Value Creation
Responsible Supply Chains
Health, Safety & Wellbeing
Our People Environment
Climate Change
Social
1. Operating with ethics and integrity
2. Economic performance and value creation
3. Socially, environmentally responsible, transparent and agile supply chain
4. Maintaining a safe working environment that promotes health and wellbeing
5. 6. Attracting and retaining talent Developing a diverse and inclusive workplace
7. Managing our environmental impact by enhancing water stewardship and natural resource efficiency
8. Understanding and managing our climate-related obligations, opportunities and risks under a changing climate
9. 10. Protection of cultural heritage Developing and maintaining strong community and stakeholder relationships
MINERAL RESOURCES LIMITED 2022 ANNUAL REPORT I 45
SUSTAINABILITY REVIEW - OVERVIEW (CONTINUED)
OUR SUSTAINABILITY PERFORMANCE TARGETS
Our sustainability plan is built around our commitment to drive continuous improvement across all material topics. Throughout FY22, MinRes assessed sustainability performance against our integrated sustainability targets in line with our material topics, with monthly oversight from our Board.
OPERATING WITH ETHICS AND INTEGRITY
We are committed to operating ethically and with integrity in all business activities and stakeholder relationships.
MinRes believes consistent and proper business conduct creates loyalty and trust with our stakeholders and we are committed to promoting a culture of ethical corporate behaviour.
As a Western Australian-based company, MinRes’ operations are governed by Federal and State Government legislation, which promote fair-trading and competition while protecting the environment and the community. Australia has built a reputation as a world leader in sustainable mining with a long history of implementing strong safety and environmental regulations and adopting best practice voluntary international codes, frameworks and standards. This has set the foundation for a robust and stable economy with strong governance practices, which provides a predictable and low-risk business environment for MinRes.
CODE OF CONDUCT AND BUSINESS INTEGRITY
Our Code of Conduct and Business Integrity (the Code) defines the way we do business. The Code is based on our Values and represents our commitment to upholding the highest standards of ethics in our business practices.
Prior to commencing employment with MinRes, employees are required to complete training on the Code. Our people undertake refresher training each year to ensure they understand the requirements and acknowledge and agree to abide by the most recent Code and other relevant policies. During FY22, our e-learning package on the Code was refreshed, widely communicated and implemented throughout the business with 89 per cent of our employees completing the training.
DISCRIMINATION, BULLYING AND HARASSMENT
MinRes’ stance is that any form of harassment, assault or bullying is completely unacceptable and has no place in any setting, including our workplace.
Our senior leadership team is focused on:
• Ensuring strong leadership, governance and education on safe and respectful workplace behaviour
• Promoting positive workplace relationships built on respect
• Creating a culture and work environment that supports people from all backgrounds and life experiences
• Listening to and learning from the experiences of our people. We expect all our people to:
• Treat each other with respect and ensure their behaviours are aligned with our values
• Show up for their colleagues, stand up to unacceptable behaviour, speak up to address situations and if required, listen to and learn from the experiences of others.
SAFE AND RESPECTFUL BEHAVIOURS
MinRes is committed to eliminating sexual harassment from our business, and taking any steps necessary to ensure our workplace is safe and all people feel valued and included. That means feeling safe and respected at work, in camp accommodation, during travel and at work-related events. Any person in our business who has witnessed or experienced sexual harassment, sexual assault or any behaviour that doesn’t align with the Code is encouraged and supported to report through internal channels or externally through our confidential, independent whistleblowing service, MinRes Integrity Assist.
Our Whistleblower Policy, and its supporting Whistleblower Procedure, outlines the ways stakeholders can report matters they genuinely believe are in breach of the Code or are illegal. To better ensure whistleblowers feel safe to come forward, MinRes provides for a whistleblower to qualify for protection even if their disclosure turns out to be incorrect or if they make the disclosure anonymously.
We are actively encouraging the reporting of incidents and have recorded an increase in reports following our Safe and Respectful Behaviours training and awareness campaign. We will continue to reinforce this messaging and measure our trends in reporting rates, types of reports and feedback through the anonymous ‘Your Voice’ culture surveys. Our Board has oversight including, but not limited to, disclosures in the event of any incidents/complaints. Information provided is de-identified and provides complainant type, detail, and actions/resolution.
Through FY22, MinRes received 25 reports through MinRes Integrity Assist, two of which related to sexual harassment. Of the 366 reports received through internal channels, 20 related to sexual harassment and three related to racial harassment. MinRes takes commensurate action to prevent, address and
46 I MINERAL RESOURCES LIMITED 2022 ANNUAL REPORT


 Jenni Christiansen | Utilities | Karaoke Performer
SUSTAINABILITY REVIEW - OVERVIEW (CONTINUED)
eliminate harassment from the workplace on a case-by-case basis. Of the sexual harassment cases reported internally, five resulted in terminations, one resulted in resignation and 14 required education and/or written warnings. Of the racial harassment cases reported, one resulted in a termination and two in written warnings.
As with mitigating health and safety risks in the workplace, managing the risk of sexual harassment is an ongoing, embedded process. In FY22, we expanded the Safe and Respectful Behaviours program of works, with actions including:
• In person Stop for Safety sessions across all teams to address incidents of inappropriate conduct across the WA mining industry, outline expectations of leaders and employees and inform employees of the various reporting channels
• Refreshed annual mandatory Code of Conduct training to improve the focus on respect at work
• Mandated Safe and Respectful Behaviours training with a focus on positively encouraging a reporting culture
• Involvement in the industry response to safe and respectful behaviours
• Identification and management of psychosocial hazards
• A risk assessment for the prevention of workplace violence and aggression, supported by our Safe and Respectful Work Committee. This resulted in action to improve our camps and workplaces, including a review of alcohol limits, promotion of alcohol-free social activities, and changes to camp physical safety environments (lighting, CCTV, security, and camp layout)
• Establishment of a Safe Zone mobile application, which allows site-based employees to access a panic button in the event they feel unsafe or have an emergency that requires assistance
• Development and implementation of a Safe and Respectful Behaviours video featuring senior leaders and employees, with the focus on encouraging employees to feel empowered to stand up against poor behaviours. Reporting increased 100 per cent following the launch of the video.
We know there is still more to do, and we will be intensifying our efforts through FY23 to ensure our sites are safe, respectful and equipped to adequately support our people and hold offenders accountable.
Over time, it is our intention to continue to upgrade the physical aspects of our camps to provide more spacious and comfortable accommodation, along with a broader range of sporting facilities and social activities. We intend to develop facilities that support family and greater occupancy by couples/partners. Our expectation is that the changes we are planning will strengthen the sense of community at each site and in turn enhance safety for all our workforce.
RISK MANAGEMENT
MinRes’ Enterprise Risk Management Policy outlines our expectations with regard to the formal management of risk.
Our Business Risk Register considers all strategic, operational, compliance, regulatory and financial risks impacting MinRes. Our sustainability and climate-related risks are also incorporated into the Business Risk Register. Risk workshops are conducted across the business to encourage awareness and ensure sustainability issues are integrated appropriately into our day-to-day operations.
MinRes is committed to continually improving our approach to Business Continuity Management (BCM), strengthening and maintaining our BCM plan, and enhancing our overall organisational resilience to business disruption. During FY22, MinRes engaged an external consultant to strengthen and enhance our BCM maturity. The first phase of this work involved the review and assessment of our value chain, growth trajectory, risk landscape and appetite, and current frameworks and mechanisms in place for BCM.
ECONOMIC PERFORMANCE AND VALUE CREATION
We are committed to operations that aim to sustain long-term value creation for all our stakeholders.
MinRes has developed an operating model with an aim to sustain long-term value creation for all our stakeholders. The inputs, or capitals from which we create value include human, natural, social and relationships, financial, manufactured and intellectual. Refer to MinRes at a Glance: Value Creation on page 16 for further detail.
The value-added statement in Table 2 demonstrates some of the financial value that MinRes generated and distributed in FY22. We continue to increase the value distributed to Federal, State and Local Governments, employees, and our suppliers and contractors.
48 I MINERAL RESOURCES LIMITED 2022 ANNUAL REPORT
1
2:
generated and distributed
FY19 $M FY20 $M FY21 $M FY22 $M
Value generated Revenue 1,512.0 2,124.6 3,733.6 3,418.0
Value distributed1 Payment to Federal, State and Local Governments 124.1 185.1 692.7 397.1
Employee wages and benefits paid 265.5 359.3 479.9 631.2
Community contributions 1.99 2.60 5.25 5.77
Payments to suppliers and contractors 891.4 1,035.4 1,227.2 2,034.0
Investment in infrastructure and exploration and innovation 857.8 391.0 774.5 1,000.3
Financing costs 19.4 97.6 86.4 82.5
RESPONSIBLE SUPPLY CHAINS
We are committed to ethically and sustainably procuring goods and services across our business value chain.
Global supply chain challenges increased through FY22, with the ongoing COVID-19 pandemic and geopolitical tensions from the Russia-Ukraine conflict adding further complexity. MinRes was able to successfully manage these risks through a combination of:
• Strategic supply chain planning
• Responding quickly to challenges
• Leveraging strong relationships with our suppliers.
During FY22, MinRes had 2,682 active suppliers in more than 25 countries.
MinRes focuses on continuously improving our approach and responsible procurement practices to meet the growing expectations of sustainable sourcing and supply chain management. During FY22, MinRes implemented a third-party platform that enables risk screening across all active suppliers and their shareholders for regulatory and reputation risks including sanctions, fraud, Securities and Exchange Commission (SEC) violations, cybercrime, politically exposed persons (PEPs), adverse media, environmental crimes and human rights abuses. Through FY23-24, MinRes will further integrate this screening program into our procurement systems landscape, enabling an efficient process for both screening new suppliers, and continual risk review of the supplier base.
LOCAL, ABORIGINAL AND TORRES STRAIT ISLANDER PROCUREMENT
MinRes is committed to contracting business partners to promote, support and employ local Aboriginal and Torres Strait Islander peoples through a range of well-designed and fully supported business opportunities. We place high importance on purchasing goods and services locally to support the communities in which we operate and build resilient supply chains. During FY22, $1.7 billion of our total spend was with Western Australian suppliers. Of this, we contributed $10 million to Aboriginal and Torres Strait Islander suppliers, an increase from $2.8 million in FY21.
We invest in building local capability by identifying programs and processes that can assist local Aboriginal and Torres Strait Islander businesses and people to meet their aspirations to have their own business.
During FY22, MinRes positively impacted the local community through wealth creation, direct employment, skill creation and the growth in Aboriginal and Torres Strait Islander entrepreneurs and business owners.
SUSTAINABILITY REVIEW - OVERVIEW (CONTINUED)
MINERAL RESOURCES LIMITED 2022 ANNUAL REPORT I 49
Value derived from the MinRes Cash Flow Statements Table
Value
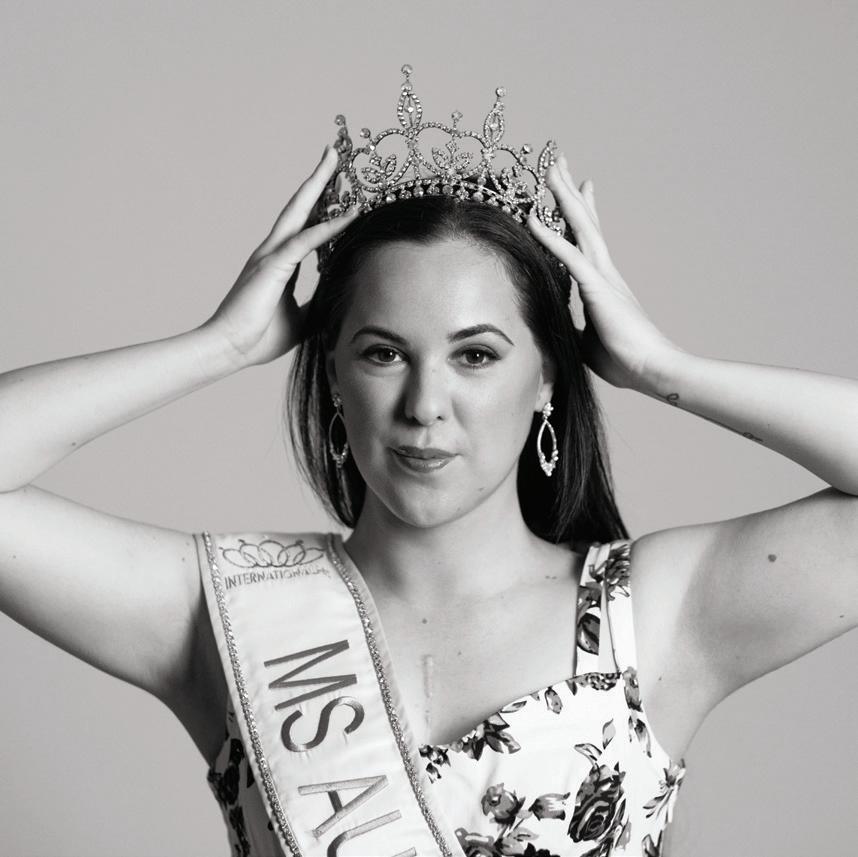 Lisa Bennett | Utilities | International Ms Australia 2022 - Open Heart Surgery Survivor
SUSTAINABILITY REVIEW - HEALTH AND SAFETY
HEALTH AND SAFETY
We strive to maintain a healthy and safe working environment for our employees, contractors and visitors, and to enhance the wellbeing of our people.
Health and safety performance is fundamental to MinRes’ overall success and pivotal to our social licence to operate. We work hard to protect the safety and wellbeing of our workforce, their families and the communities in which we operate. During FY22, COVID-19 has continued to have an impact and we have continued to adapt.
At the start of the pandemic, MinRes assembled a team to coordinate and provide day-to-day leadership of our COVID-19 response. This team, led by our COVID-19 Manager, was responsible for developing and implementing policies and procedures to keep our people safe and operations running smoothly.
During FY22, MinRes conducted more than 24,000 COVID-19 polymerase chain reaction (PCR) tests through our screening facilities. Our partnership with Australian Clinical Laboratories (ACL) and Safe Work Laboratories (SWL) ensured all MinRes PCR samples could be expedited, with a turnaround time between four to six hours, rather than the standard 24-hour time frame. These screening and testing processes were made available to MinRes employees and their families to ensure peace of mind and safety for all.
Looking forward, we will continue to address the risks that COVID-19 poses, with the safety and wellness of our workforce being our top priority.
To manage the safety of our people while at work, MinRes seeks to proactively identify and control hazards and minimise exposure to health and safety risks. Our Critical Risk Management Program informs a detailed analysis of activities presenting the greatest risk of highconsequence injury.
MinRes has a dedicated Health Services team that support employee health and wellbeing across the full spectrum of health services. MinRes considers mental health as important as physical health and critical to employee engagement and productivity.
During FY22, 348 of our employees accessed the Employee Assistance Program (EAP) or in-house psychology support, representing more than seven per cent of employees and exceeding our target of more than 5 per cent of our workforce to engage in professional proactive psychological support services. Further information on mental health initiatives at MinRes can be found in our 2022 Sustainability Report.
During FY22, MinRes experienced no Lost Time Injuries and our Lost-time Injury Frequency Rate (LTIFR) reduced from 0.12 in FY21 to 0.00. This is encouraging and reflects an improving risk management culture that continues to enhance our safety performance. MinRes’ Total Recordable Injury Frequency Rate (TRIFR) was 2.33 which, while not a year-on-year improvement, demonstrates approximately 36 per cent improvement compared to FY20. We continued to work closely with our key contracting partners to ensure alignment of safety and health expectations to deliver successful safety outcomes.
A summary of MinRes’ FY22 safety performance is outlined in Table 3. Figure 1 shows MinRes’ injury frequency rate based on 1 million hours worked for employees and contractors.
MINERAL RESOURCES LIMITED 2022 ANNUAL REPORT I 51
REVIEW - HEALTH AND SAFETY (CONTINUED)
Table 3: FY22 Safety Performance
FY22 Safety Metric
Work-related Fatality Rate 0.00
0.00
Lost-time Injury Frequency Rate 0.00 0.00 0.00
Total Recordable Injury Frequency Rate TRIFR 1.96 3.36 2.33
High-consequence Work-related Injuries Rate1 0.00 0.00 0.00
All Incident Rate2 150.14
1 High consequence injuries are defined as significant injuries, which include lost time injuries and fatalities.
2 All Incident Rate excludes non-work related injuries.
Total Recordable Injury Frequency Rate (TRIFR)
Injury Frequency Rates (Injuries per Million Hours Worked)
Near Miss Frequency Rate 32.47 Hours worked 7,637,402 2,679,478 10,316,879 (LTIFR)(TRIFR)
1.00 0.80 0.60 0.40 0.20 0.00
Lost Time Injury Frequency Rate (LTIFR)
FY14 FY15 FY16 FY17 FY18 FY19 FY20 FY21 FY22
Figure 1: Historical trends in LTIFR and TRIFR - combined employees and contractors
For further information on MinRes’ historical injury rate performance and frequency rates, refer to our 2022 Sustainability Report and standalone publication of our 2022 Sustainability Performance Tables.
10.00 8.00 6.00 4.00 2.00 0.00
SUSTAINABILITY
52 I MINERAL RESOURCES LIMITED 2022 ANNUAL REPORT
per 1,000,000 hours worked Employees Contractors Combined Employees & Contractors
0.00
 Bronwyn Grieve | Chief People and Shared Services Officer | Refugee Advocate
PEOPLE
ATTRACTING AND RETAINING TALENT
We support business growth and performance by providing learning and development pathways that introduce new talent and develop existing talent.
Our people are the foundation of our business and are instrumental to our growth and success. As of 30 June 2022, MinRes employed 3,863 employees15, an increase of 18 per cent when compared to 30 June 2021. It is critical for our business to identify, attract and retain high quality talent to help us meet our objectives.
To ensure MinRes is well positioned to attract and retain top talent, in FY22 our People team drove several initiatives to support MinRes’ ambitious growth plans:
• Introduced an all-employee share plan to reward commitment to MinRes and share our company’s success with employees
• Promoted our employee referral program to support existing recruitment strategies. This program incentivises current employees to refer suitably qualified and skilled candidates to MinRes
• Launched a national six-month brand awareness campaign promoting MinRes’ unique employee value proposition, positioning MinRes as an employer of choice and an organisation that helps its people live their best life
• Attended and sponsored several career development events
• Launched our Military to Mining initiative to match military veterans’ diverse and transferrable skills to career opportunities at MinRes
• Continued our Apprenticeship Program, in partnership with the Kwinana Industries Council
• Continued to grow our career entry level programs. Our Career Entry Pathways include apprenticeships, traineeships, entry level dump truck operator training, work experience, graduate and vacation programs, which are designed to attract new entry level talent to our company
To improve employee retention, MinRes undertook several initiatives during FY22:
1. Introduced a new employee engagement survey, Your Voice, to gain insights into what matters most to our people. This, along with data from our exit interviews and anecdotal feedback from employees through regular conversations, has informed numerous initiatives designed to increase retention
2. Supported a Curtin University research program aimed at identifying new industry initiatives to improve health and wellbeing among WA’s FIFO workforce
3. Maintained an understanding of market pay and conditions to ensure MinRes remains competitive in the market and our employees are fairly rewarded
4. Further developed talent management and succession planning in key business areas, including the deployment of a new tool and dashboard for reporting
5. Continued our strong focus on providing development and career progression opportunities for our people
6. Offered weekly employee training sessions to support performance and development opportunities, including guidance for emerging frontline leaders through bespoke development programs such as the Adaptive Leader Program
7. Continued to support returning mothers by providing a dedicated lactation room in our head office.
ATTRACTING TALENT WITH OUR NEW STATE-OF-THE-ART HEADQUARTERS
MinRes has built, designed and constructed new headquarters in Osborne Park, guided by the International WELL Building Standards. The building aims to set a new Australian standard for employee wellbeing and ensure we provide the best conditions for our people, supporting the attraction and retention of high-quality talent.
The International WELL Building Standards are a performance-based certification that focuses on the health and wellness of building occupants. The standards incorporate performance metrics, design strategies and policies to elevate human health in the built environment. The Ten WELL concepts form part of MinRes’ master plan to achieve International Platinum WELL v2 Building Standard accreditation. The concepts cover the wellness areas of Air, Water, Nourishment, Light, Movement, Thermal Comfort, Sound, Materials, Mind and Community. Features and initiatives designed to put people first include: an à la carte restaurant and café with heavily subsidised food and beverages, a fitness centre, family zone, and cutting-edge technology including a MyMinRes app.
54 I MINERAL RESOURCES LIMITED 2022 ANNUAL REPORT
SUSTAINABILITY REVIEW - PEOPLE 15. This figure does not include contractors or Non-Executive Directors
SUSTAINABILITY REVIEW - PEOPLE (CONTINUED)
STATE-OF-THE-ART SIMULATORS AND TRAINING
MinRes has installed and commissioned state-of-the-art Immersive Pro 5, Pro 4 and two LX6 Simulators at our Osborne Park training facility, totalling an investment of $6 million as part of our commitment to using technology and innovation to train and upskill our workforce.
In FY22, focused efforts were applied to develop supportive simulator training programs that offer pathways into the MinRes business, as well as career progression for current employees. The simulator technology was incorporated into the current three-month Dump Truck Entry Level Operator (ELO) Program, as well as the development of our new Dozer Operator Pathway Program. The curriculum of these programs has been designed and commissioned by our simulator training team to ensure participants are provided the opportunity to develop and build on key skills by increasing complexity levels throughout the training. During FY22, we welcomed 80 ELOs, of which 52.5 per cent identified as female, and 11 Dozer Pathway Program participants.
This program continues to enable us to successfully fill market gaps, while growing a second-generation MinRes workforce. We will continue to roll out our simulator training via our entry level programs and pathway programs to build and strengthen our workforce and provide career progression opportunities for our existing talent.
DIVERSE AND INCLUSIVE WORKPLACE
A diverse, inclusive and non-discriminatory workplace is critical to MinRes’ growth and culture and is a key contributor to our long-term success. The benefits of diversity include improved organisational performance, positive impacts on organisational culture and reputation, employee attraction and retention, and enhanced internal, customer and stakeholder relationships.
During FY22, we exceeded our target for overall female participation of 17.1 per cent and achieved 20 per cent. As at 30 June 2022, employees identifying as Aboriginal and Torres Strait Islander accounted for 1.8 per cent of MinRes’ workforce. Table 4 shows the overall female and Aboriginal and Torres Strait Islander representation across our business.
As of 30 June 2022, our Board comprised four male members (67 per cent) and two female members (33 per cent).
MINERAL RESOURCES LIMITED 2022 ANNUAL REPORT I 55
Refer to our 2022 Sustainability Report and 2022 Sustainability Performance Tables on our website for more information about our diversity and inclusion performance based on age, gender and Aboriginal and Torres Strait Islander representation. Financial Year1 FY20 FY21 FY22 Overall Female Representation (%) 15 17 20 Overall Aboriginal and Torres Strait Islander Peoples Representation (%) 1.4 1.8 1.8 1 Financial year as at 30 June of the financial year Table 4: Overall female and Aboriginal and Torres Strait Islander peoples representation between FY20 and FY22
 Lauren Kenny | Onboarding Coordinator | Reptile Conservationist
SUSTAINABILITY REVIEW - ENVIRONMENT
ENVIRONMENT
We are committed to environmental management that maintains our licence to operate in an environmentally responsible and sustainable manner.
Environmental management is essential in maintaining our social licence to operate. We adopt a systematic approach to mitigate risk and identify management strategies to ensure our operations avoid unacceptable environmental impacts. MinRes supports a precautionary approach to environmental management.
Our Environmental Policy is implemented through our Environmental Management System (EMS), developed in line with the ISO 14001:2015 - Environmental Management Systems standard.
AIR QUALITY
Across MinRes’ business, the equipment used to undertake operational activities - such as drilling, blasting, load and haulage and ore processing - generates dust and other air emissions such as exhaust emissions. To manage air emissions at our operations, we apply dust suppression measures such as the use of water carts on high traffic areas, roads and tracks, and sprinkler systems installed on transfer points at our crushing and train load out facilities. At our Yilgarn operations, where we manage several private haul roads, investment in surface sealing has delivered a range of benefits including significant reductions in wheelgenerated dust from our road haulage fleet.
WATER INPUT (WITHDRAWAL)1
We have disclosed historical air quality emissions data in our 2022 Sustainability Report and further information on the breakdown of air emissions by commodity and region can be found in our 2022 Sustainability Performance Tables
WATER
MinRes recognises water as a vital resource for all aspects of life and a key resource for our operations and supply chain. MinRes aims to apply strong and transparent water governance, manage water effectively at our operations and collaborate with key stakeholders to achieve responsible and sustainable water use.
During FY22, we increased our efforts in water stewardship and updated our water disclosure to align more closely with the Mineral Council of Australia’s (MCA) Water Accounting Framework. As the accepted industry water accounting standard, this framework aims to improve data integrity and comparability across the sector to ensure the continuous improvement of water reporting.
We achieved improvements in water metering and data capture through water efficiency and modelling initiatives, which allows for an enhanced understanding of our water withdrawals, use and re-use opportunities.
Figure 2 provides a simplified overview of where water was withdrawn, discharged and consumed across our operations during FY22. Refer to our 2022 Sustainability Performance Tables for further information on water volumes by commodity, water source, water quality and water stress.
WATER OUTPUTOPERATION (TASK) ACTIVITIES
Water abstracted, reused and recycled to enable operational activities including, but not limited to:
• Ore processing • Cooling
Dust control • Wash down
Irrigation • Tailings
Potable water • Product transportation and sanitation
REUSE
MINERAL RESOURCES LIMITED 2022 ANNUAL REPORT I 57
1. Water Withdrawn is defined as water received, extracted or managed to meet operational water demand and reported by type – surface groundwater, third party (municipal) water. Due to location of MinRes operations no seawater is used/reported 2. Water Reused & Recycled reflects total of recycled water at Koolyanobbing and Wodgina and reused water from Mt Marion 3. Change in storage includes temporary storage pits 4. Task Water: water used in tasks / operational activities which use water 5. Surface Water Discharge: water removed from Iron Valley operation and returned to the environment SURROUNDING COMMUNITY & ENVIRONMENT Figure 22: FY22 Water Balance Surface Water (Discharge) Groundwater Evaporation Entrainment Task Loss Surface Water Groundwater Third Party Other (pit groundwater recovery) 14% Category 1 97%% Category 2 & Category 3 1% 33% Category 1 45% Category 1 Surface Water DischargeSurface Water Evaporation GROUNDWATER OTHER EVAPORATION ENTRAINMENT TASK LOSS4 SURFACE WATER DISCHARGE5 3,731ML 2,348 355 1,027 7,470 ML 5,555ML281MLSURFACE WATER (includes precipitation3)
TOTAL OUTPUT 16,756ML OTHER (pit groundwater recovery) 20,865MLGROUNDWATER 245MLTHIRD PARTY 36ML Groundwater Groundwater
•
•
•
WATER
202 ML | 14% RECYCLED2 91ML | 7% TOTAL INPUT 21,427ML CHANGE IN STORAGE 3 4,671ML
SUSTAINABILITY REVIEW - ENVIRONMENT (CONTINUED)
WASTE AND TAILINGS
The generation of waste throughout the lifecycle of mining operations, processing and associated activities has the potential to cause environmental damage and human health hazards to our employees, contractors, communities and landscapes adjacent to our operations. To ensure waste is appropriately managed, MinRes monitors and reports on all hazardous and non-hazardous waste streams in accordance with the Waste Avoidance and Resource Recovery Act 2007 and landfill licence conditions issued by the Department of Water and Environmental Regulation.
During FY22, MinRes developed a Waste Strategy in consultation with a specialist waste consultant to advance the business towards more efficient waste management practices and circular economy outcomes across our operations.
MinRes’ total waste rock is disclosed in Table 5, with the increase in quantities reflecting changes in our operations over time and significant growth in our mining operations.
Table 5: FY20 - FY22 Waste rock quantities in Wet Metric Tonnes
Unit ‘000 WMT Operation
FY20
FY21 FY22
Yilgarn Hub (Iron Ore) 38,765 51,301 51,553
Utah Point Hub (Iron Ore)
Lithium Commodities
Iron Valley 11,177 28,816 20,205
Wonmunna 3,603 14,791
Mt Marion 25,401 27,654 29,197
Wodgina1 1,540 176 609
Total 76,883 111,549 116,356
1 Wodgina was in care and maintenance through FY20- FY21. Aggregated volume is calculated based on actuals and estimates.
MinRes is committed to operating in line with the 15 principles and 77 requirements set out by the Global Industry Standard on Tailings Management (GISTM) published by the International Council on Mining and Metals, the United Nations Environment Program, and the Principles for Responsible Investment.
During FY22, we progressed closing gaps against the GISTM requirements across all our directly controlled and managed operations, including but not limited to;
1. Development of a Tailings Storage Facility (TSF) Policy
2. Appointment of an Engineer of Record
3. Ongoing TSF surveillance and design, administrative and operational review.
MinRes manages two active TSFs, two decommissioned TSFs and two inactive TSFs. All TSFs are located in remote areas and are significant distances from local communities and infrastructure.
Further information on our TSFs Hazard categorisation and consequence of failure for all MinRes TSFs, both active and inactive, can be found in our 2022 Sustainability Report and 2022 Sustainability Performance Tables.
We have disclosed our tailings waste data in Table 6.
58 I MINERAL RESOURCES LIMITED 2022 ANNUAL REPORT
SUSTAINABILITY REVIEW - ENVIRONMENT (CONTINUED)
Table 6: Historical cumulative tailings waste (tonnes) for Mt Marion and Wodgina operations
Operation1
FY21 (Dry Metric tonnes)
FY22 (Dry Metric tonnes)
Mt Marion Wet Tailings (Ghost Crab Pit) 757,573 826,766
Mt Marion – Coarse Tailings 945,381 994,337
Total 1,702,954 1,821,103
1 Wodgina TSF3E, Coobina TSF 1
care and maintenance) and Koolyanobbing in-pit TSF
BIODIVERSITY AND LAND MANAGEMENT
tailing during FY22.
MinRes recognises the nature of our operations has the potential to impact natural habitats and ecosystems in direct and indirect ways. We work to ensure direct and indirect environmental impacts are avoided, minimised, rehabilitated and offset in alignment with the mitigation hierarchy.
MinRes has looked to evolve our techniques to better understand our operations and how recent technological advances can provide the industry with more robust biodiversity survey techniques to define rehabilitation success. During FY22, MinRes engaged Dendra Systems to carry out a portfolio-wide remote sensing assessment using ultra high-resolution drone technology coupled with machine learning to transform imagery into insights via the Dendra Insights platform. The machine learning technology will enable MinRes gather insights covering erosion risk, vegetation health per species and quantification of native and invasive flora, with an easy-to-use dashboard to diagnose problems and created targeted large scale action plans.
The collection and sourcing of native plant seed is undertaken as part of the rehabilitation process of waste rock landforms and other disturbed areas during mining and exploration. During FY22, MinRes commenced seed collection efforts in spring to allow works to be planned in the Yilgarn and Pilbara regions, which are due to continue into 2023. Any seed collected will be processed and stored by a commercial provider in a climate-controlled environment, ready for use in rehabilitation works. MinRes also fostered training with Traditional Owners to support seed collection and processing and in the business aspects of native seed harvesting and brokering. Collaborative restoration processes further help protect traditional ecological knowledge while restoring knowledge, biodiversity and ecological functions to the lands on which MinRes operates.
Table 7 provides a summary of land disturbance and rehabilitation information for FY20 to FY22, consolidated for all MinRes tenements.
MINERAL RESOURCES LIMITED 2022 ANNUAL REPORT I 59
(in
did not receive
SUSTAINABILITY REVIEW - ENVIRONMENT (CONTINUED)
Land Under Rehabilitation (ha) Operation FY20 FY21 FY22 FY20 FY21 FY22
Yilgarn Hub (Iron Ore)2
Utah Point Hub (Iron Ore)
Land Disturbed (ha)
3,374 3,519 3,710 725 720 766
Iron Valley3 494 515 556 3 3 6 Wonmunna 0 116 315 0 0 0
Lithium Commodities
Mt Marion3 628 634 686 33 50 50 Wodgina 1,3 909 909 862 395 395 395
Total 5,405 5,693 6,130 1,156 1,168 1,217
1 Decreases in land rehabilitation may be attributed to re-disturbance as a result of internal/external survey audits.
2 The Yilgarn Hub (Iron Ore) FY20-FY21 figures have been restated due to an update of the reporting boundary in FY22 to capture Carina in addition to Koolyanobbing and Parker Range.
FY21 disturbance and rehabilitation decreased due to a re-disclosure of Koolyanobbing MRF disturbance and rehabilitation data made post 30 June 2021.
3 FY20-FY21 Iron Valley, Mt Marion and Wodgina rehabilitation restated following a review of historical rehabilitation activities in FY22.
Table 7: Total land disturbance and rehabilitation information cumulative for FY20-22 consolidated for all MinRes tenements
60 I MINERAL RESOURCES LIMITED 2022 ANNUAL REPORT
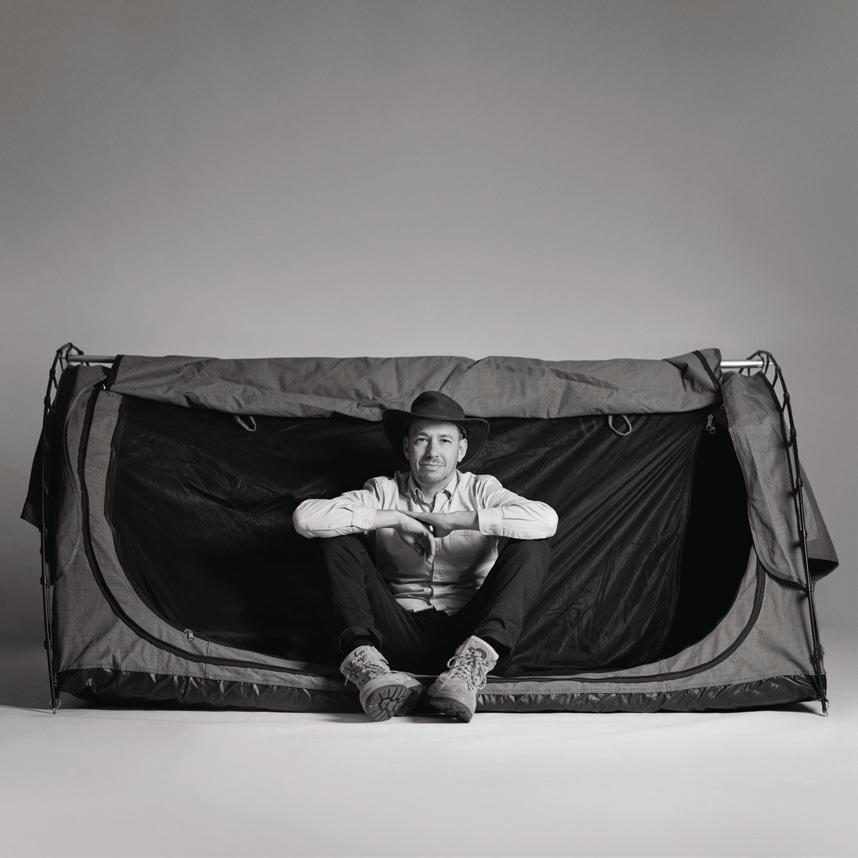 Mark Hughes | Employment Marketing Manager | 4WD and Camping YouTuber
SUSTAINABILITY REVIEW - CLIMATE CHANGE
CLIMATE CHANGE
We are committed to understanding and managing our climate-related obligations, risks and opportunities as we operate within an increasingly carbon-constrained and changing climate.
MinRes recognises the need to take action to reduce our carbon footprint. Our strategy is to adopt a practical and project-based approach to decarbonisation, using known technologies that are available today and are economically feasible.
We continually review our performance against our Roadmap to Net Zero Emissions1 and report our progress annually. This ensures we remain agile and responsive to technological and commercial advancements as well as material project developments, acquisitions or divestments. Our roadmap shows our emissions profile fluctuating above and below the 1.5°C and 2°C scenarios, which is a realistic depiction of how we will aim to reach our target.
Our roadmap incorporates all greenhouse gas emissions produced at sites under MinRes’ operational control. This includes the Yilgarn and Pilbara Hubs, our Mt Marion lithium operation, and the development of the Ashburton and Pilbara Hubs. Modelling is based on peak emissions for each operation during its project life and is categorised into power generation, pit-to-port transportation and mining equipment.
The roadmap excludes MARBL JV investments as they are outside of MinRes’ operational control. Our gas exploration activities and carbon capture and storage opportunities are also excluded as the reservoirs are not yet sufficiently defined to provide known outcomes. The modelling does not assume the purchase of carbon offsets, although this could accelerate our carbon reduction efforts.
Abatement initiatives have and will be implemented to reduce emissions in accordance with forecast technology readiness and procurement cycles.
During FY22, our Roadmap to Net Zero Emissions was reviewed and maintained, as there were no changes to our emissions methodology or structural changes in the company that materially changed facility boundaries.
62 I MINERAL RESOURCES LIMITED 2022 ANNUAL REPORT
1 Roadmap includes modelling based on peak emissions for each current and forecast future operations over their project life. Abatement initiatives are proposed in accordance with forecasted technology readiness and procurement cycles. For further detail refer to our 2022 Sustainability Report and 2022 Sustainability Performance Tables Greenhous Gas Emissions Power Generation Well-below 2oC Emissions Pathway 1.5oC Emissions PathwayPit to Port Mining Equipment Power Generation Pit-to-Port Mining Equipment Science-Aligned Emissions PathwaysProcess 1.5oC Emissions Pathway Well-below 2oC Emissions Pathway FUEL MIX Financial Year 2025 2030 2035 DIESEL GAS
SUSTAINABILITY REVIEW - CLIMATE CHANGE (CONTINUED)
Setting targets helps drive business decisions aligned to manage climate-related risks and pursue opportunities. MinRes has a target of achieving net zero operational emissions by 2050. This year we have expanded on our net zero climate target strategy, to include our medium-term reduction target, setting our ambition to reduce our emissions on existing operations by 50 per cent by 2035 from baseline FY22 emissions, inclusive of Scope 1 and Scope 2 and equating to 321,744 tCO2e. The baseline includes all existing operations including the Pilbara Hub (Wonmunna, Iron Valley), Yilgarn Hub (Koolyanobbing, Parker Range and Carina operations) and Mt Marion in alignment with our Roadmap to Net Zero Emissions in pursuit of a 1.5°C pathway. The baseline will be adjusted when structural changes occur in the company that change the facility boundary or mining activity (such as acquisitions or divestments).
GREENHOUSE GAS EMISSIONS PROFILE
Our GHG emissions are directly related to our energy use and growth of our operations. MinRes calculates our direct (Scope 1) and energy indirect (Scope 2) GHG emissions for entities under our operational control16 in alignment with the GHG Protocol and the Australian National Greenhouse and Energy Reporting Act (2007).
Table 8 shows our Scope 1 and 2 GHG emissions in metric tonnes of CO2 equivalent (CO2e) from FY20 to FY22. Absolute emission increases in FY22 are attributed to ramp up in mining activity at our Wonmunna mine site. Refer to our Sustainability Performance Tables for our historical Scope 1 and 2 GHG emissions.
External limited assurance is provided over our FY22 Scope 1 and 2 GHG emissions. Refer to our 2022 Sustainability Report for a copy of the Independent Limited Assurance Statement.
Table 8: Scope 1 and 2 GHG emissions
FY20 FY21 FY22
Scope 1 (tCO2e)
222,978 296,343 337,489
Scope 2 (tCO2e) 1,917 1,993 3,026
Total (tCO2e) 224,895 298,336 340,515
Emission intensity of our operations per total material mined for sites under our operational control is shown in Table 9. Between FY21 and FY22, we have seen a 10 per cent increase in our GHG emission intensity, which is mainly attributed to changes in the geological setting of the ore mined and an increase in exploration activities.
Table 9: Carbon intensity of our operations between FY20 – FY22 (tCO2e/TMM)
FY20
FY21
FY22
Tonnes Material Mined (TMM) 94,237 131,565 136,877
GHG intensity: tCO2e/ TMM (wet metric kt)1 2.39 2.27 2.50
1 The GHG emissions included in the intensity metrics are Total Scope 1 and 2 GHG emissions, which include the greenhouse gases CO2 CH4 N2O and SF6
We continue to invest in activities that reduce the carbon intensity of our operations. To support the growth of our business, it is important we pursue reliable, secure, low cost and sustainable energy solutions. Our Roadmap to Net Zero Emissions outlines a pathway to progressively incorporating gas, LNG, renewable energy technologies and other emerging technologies over time to reduce our carbon intensity.
MINERAL RESOURCES LIMITED 2022 ANNUAL REPORT I 63
16. This excludes GHG emissions from our mining services activities, as MinRes does not have operational control over these activities
SUSTAINABILITY REVIEW - CLIMATE CHANGE (CONTINUED)
During FY22, our emission reduction initiatives included:
• Installing a 2.1 megawatt solar panel array and battery at MinRes’ Wonmunna Iron Ore Project in the Pilbara. The solar panels were installed during the third quarter of FY22 and installation of the battery storage system is expected to be completed in FY23
• Designing the Onslow Iron Project infrastructure to minimise the use of diesel power generation to support mining operations. The port and mine developments provide for the installation of solar photovoltaic (PV) renewable generation and battery storage systems to maximise the utilisation of the installed renewable energy systems. Provision has been made for the future expansion of the solar PV generation at the mine to increase the displacement of thermal power generation over the life of the mine
• Ongoing analysis of geothermal potential in Western Australia. This includes exploring opportunities for baseload geothermal power sourced from the production of hot water from sedimentary aquifers at depth to the surface, where production can be sustained over time, providing 24-7 renewable power
• Continuing to support the installation of seven 600kW wind turbines for JV partner RDG at the Australian Garnet project, located south of Kalbarri
• Continuing to assess opportunities to install modular LNG storage facilities which will allow LNG to be rolled-out on our sites rapidly and cost effectively. This design leverages on our experience with our LNG Power Station at Mt Marion
• Testing autonomous road trains in the Yilgarn which have the potential to reduce energy through optimal acceleration, braking and reduced wind resistance through platooning
• Deploying the first electric truck fully assembled in Australia
• Completing our role as a patron of the “Charge On” Haul Truck Electrification Challenge, selecting one of the eight technology innovators that are progressing beyond the Charge on Challenge.
As interest in climate change continues to grow, we are committed to conducting ongoing and regular engagement with our stakeholders to understand better any concerns, interests and opportunities.
MinRes has been a partner in the Future Energy Exports Cooperative Research Centre (CRC) since our inception in 2020. The CRC’s goal is in “Future Proofing Australia’s energy exports through industrial-scale innovation”. As a partner, we are directly involved via:
• Future Energy Export’s Co-operative Research Centre Kwinana Energy Transformation Hub (KETH) project
• The Paths to a sustainable hydrogen supply chain project
• The Net Zero Australia (NZau) project.
64 I MINERAL RESOURCES LIMITED 2022 ANNUAL REPORT


 Jasper Daruwala | Safety Advisor | Bollywood Actor
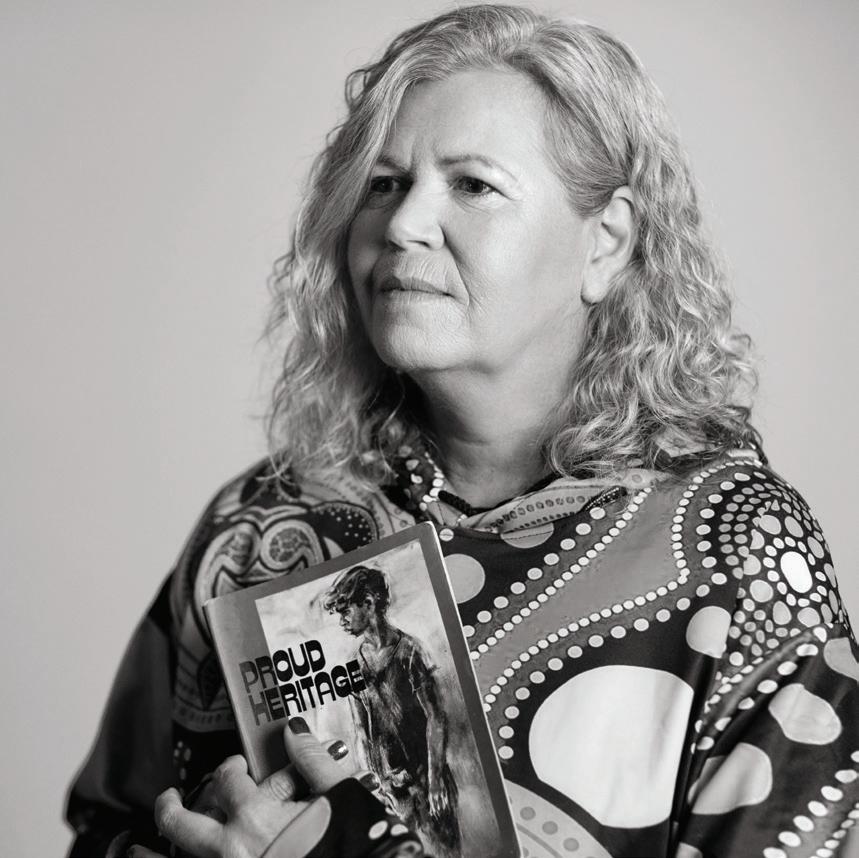 Candice Burvill | Indigenous Engagement Advisor | Genealogy Enthusiast
SUSTAINABILITY REVIEW - SOCIAL SOCIAL
PROTECTION OF CULTURAL HERITAGE
We are committed to respecting and recognising the Traditional Owners of the land on which we operate and their link to culture and heritage.
We collaborate with Aboriginal and Torres Strait Islander communities to ensure cultural heritage is managed and protected. With our operations spanning regional and remote areas of Western Australia and the Northern Territory, our ability to build strong and trusting relationships with our communities is critical to our success.
At MinRes, we respect internationally recognised human rights principles, including those contained in the United Nations (UN) Universal Declaration of Human Rights and the UN Declaration on the Rights of Indigenous Peoples. We acknowledge and respect the human rights principles of Free, Prior and Informed Consent (FPIC), which highlights the importance of consulting with people in making decisions that affect their lives and we strive to consider this across all of our operations.
MinRes is aware that Traditional Owner expectations around engagement in statutory processes are evolving and we continue to support Traditional Owners to manage their cultural heritage. We are moving beyond simply complying with legislative requirements to a ‘site avoidance’ model, which will see cultural heritage sites avoided to the greatest extent possible across our operations.
Over the past year, MinRes has committed to increasing engagement with Traditional Owners in the regions where we operate. Through proactive consultation, we have identified that business support, cultural awareness training within our business, and community investment initiatives are some of the primary areas of interest for Traditional Owners. To address this, the Communities and Stakeholder Engagement team has:
• Developed an Aboriginal Small Business Grants Program which provides targeted support for Aboriginal businesses
• Worked with Traditional Owner representatives to develop and deliver site specific cultural awareness training in FY22. More than 70 Cultural Awareness Training sessions have been undertaken across our Yilgarn and Pilbara operations
• Continued to work with Traditional Owners to identify programs and initiatives that can be funded through our community investment program.
We have both heritage-specific and comprehensive native title agreements in place with the Traditional Owners of the land on which we operate. The intent of the 16 agreements in place is to provide a range of cultural heritage protections and benefits for Traditional Owner groups, such as heritage management procedures, the provision of employment and business opportunities, health and education initiatives and work ready programs.
We also continue to proactively work with Traditional Owner groups to identify opportunities to collaborate beyond what is provided for in our agreements. In FY22, this has included involving Traditional Owner representatives in baseline environmental surveys and ongoing monitoring processes. Our Heritage and Native Title team engages with Traditional Owner representatives to carry out cultural heritage surveys prior to the commencement of any activities across our operations. Despite the on-going challenges presented by the COVID-19 pandemic, we completed 167 days of heritage surveys across our various project locations in FY22.
BUILDING RECONCILIATION WITH ABORIGINAL AND TORRES STRAIT ISLANDER COMMUNITIES
At MinRes we recognise our responsibility to take meaningful action to advance reconciliation. MinRes’ vision for reconciliation prioritises education, mutual respect and positive action as key pillars in building a successful and respected business that appreciates and is enriched by Aboriginal and Torres Strait Islander peoples and cultures.
During FY22, MinRes’ inaugural Reconciliation Action Plan (RAP)a Reflect RAP, was formally endorsed by Reconciliation Australia, which outlines and strengthens our commitment to reconciliation with Aboriginal and Torres Strait Islander communities. For further information and to read our RAP, please visit our website
We have also established a Reconciliation Working Group to drive governance and implementation of the RAP across the business, with an aim to grow a diverse business and workforce that respects and embraces Aboriginal and Torres Strait Islander culture. Further information on the actions we have taken to progress reconciliation can be found in our 2022 Sustainability Performance Tables.
COMMUNITY CONTRIBUTIONS
MinRes supports local communities through contributions that generate value for society and demonstrate our corporate social responsibility. We define community contributions as voluntary spend that benefits the community and apply our contributions across five categories: health and wellbeing, employment, education, Aboriginal engagement and environment.
In FY22, we implemented a Community Engagement Strategy which is intended to guide how we identify, invest and participate alongside local organisations and our host communities.
We supported more than 106 charitable organisations and contributed $5.77M to communities in FY22 (refer to Figure 4). This includes grassroots investment in the regional communities in which we operate, primarily in the Pilbara, Yilgarn, GoldfieldsEsperance and Greater Perth regions. For more information about our community partnerships and regional investments, please visit our website.
MINERAL RESOURCES LIMITED 2022 ANNUAL REPORT I 67
SUSTAINABILITY REVIEW - SOCIAL (CONTINUED)
Figure 4: Community contributions (Million AUD)
ENGAGEMENT ACTIVITIES
MinRes is committed to providing local communities with open and transparent access to information about our operations. The aim of our Stakeholder Engagement Management Plan and Community Relations Strategy is to ensure we engage effectively with local communities, government and other key stakeholders on matters concerning environment, land access, heritage and community during all phases of our operations.
We recognise genuine and effective stakeholder engagement involves building relationships based on mutual trust, respect and understanding. To further support this, MinRes has three regional Community Engagement Officers to manage and support stakeholder, community and Aboriginal and Torres Strait Islander engagement activities.
MinRes continues our participation in local industry events held in the regions as a meaningful way to engage with other businesses and the wider Aboriginal and Torres Strait Islander community. This ensures we are well-informed of issues and strengthens our community connections year-on-year by:
• Developing deeper relationships with members of the communities in which we operate, including non-government entities
• Building awareness of projects to ensure they are known and understood prior to approval processes
• Engaging with non-government conservation organisations and individuals
• Conducting MinRes-focused community forums
• Participating in existing local community forums and local shire meetings
• Presenting our plans to the Chamber of Commerce and Industry WA
• Establishing relationships with schools and developing work experience programs at mine sites for local high schools
• Hosting business development and employment sessions
• Further investing in our community development partnerships at a local level
• Supporting school NAIDOC events, Country Week events, regional fairs and community festivals.
During FY22, we have undertaken 546 stakeholder engagement sessions across the Yilgarn, West Pilbara and Central Pilbara regions.
68 I MINERAL RESOURCES LIMITED 2022 ANNUAL REPORT
■ FY18 ■ FY19 ■ FY20 ■ FY21 ■ FY22 1.37 1.99 5.25 5.77 2.60
0 1 2 3 4 5 6 7
 Marco Octaviano | Gallery Manager and Social Media Specialist | Fashionista
 Matthew Shaw | INX Administrator | Student Private Investigator
ANNUAL FINANCIAL REPORT
GENERAL INFORMATION
The financial statements cover Mineral Resources Limited as a group consisting of Mineral Resources Limited (the ‘Company’ or ‘Parent Entity’) and the entities it controlled (the ‘Group’) at the end of, or during, the financial year. The financial statements are presented in Australian dollars, which is the Group’s functional and presentation currency.
Mineral Resources Limited is a listed public company limited by shares, incorporated and domiciled in Australia. Its registered office and principal place of business is:
20 Walters Drive Osborne Park Western Australia 6017 Australia
A description of the nature of the Group’s operations and its principal activities are included in the notes to the financial statements.
The financial statements were authorised for issue, in accordance with a resolution of Directors, on 29 August 2022.
MINERAL
RESOURCES LIMITED 2022 ANNUAL REPORT I 71
72 I MINERAL RESOURCES LIMITED 2022 ANNUAL REPORT
DIRECTORS’ REPORT
The Directors present their report, together with the financial statements, for the Financial Year ended 30 June 2022.
DIRECTORS
The following persons were Directors of Mineral Resources Limited during the whole of the financial year and up to the date of this report, unless otherwise stated:
James McClements
Chris Ellison Kelvin Flynn Susie Corlett Xi Xi
Peter Wade (resigned 2 March 2022)
Zimi Meka (appointed 17 May 2022)
PRINCIPAL ACTIVITIES
During the financial year, the principal continuing activities of the Group consisted of the integrated supply of goods and services to the resources sector.
The overview of the Group’s operations, and a review of the operation performance, financial performance and cash and capital management are contained in the following sections of the Annual Report; (Report): Overview on page 74, Operational Review on pages 75 to 77 and Cash and Capital Management on page 75.
DIVIDENDS
Cents Franked % $M
2022 Financial Year final dividend – declared 29 August 2022 100.00 100% 188.3
2021 Financial Year final dividend – paid 6 September 2021 175.00 100% 329.4
2021 Financial Year interim dividend – paid 8 March 2021 100.00 100% 188.6
MINERAL RESOURCES LIMITED 2022 ANNUAL REPORT I 73
DIRECTORS’ REPORT (CONTINUED)
SIGNIFICANT CHANGES IN THE STATE OF AFFAIRS
There were no significant changes in the state of affairs of the Group during the financial year.
OPERATIONS AND FINANCIAL REVIEW SUMMARY OF RESULTS
MinRes’ project execution and development continued to safely and efficiently position the company for growth, expanding capacity in mining services and across the iron ore and lithium operations. Key highlights during FY22 include:
• No Lost T ime Injuries and maintaining low Total Recordable Injury Frequency Rate of 2.33
• Record Mining Services production volumes – 274Mt
• Expansion to double production at Mt Marion commenced
• Wodgina Train 1 and 2 successfully restarted production
• First lithium hydroxide earnings from Mt Marion offtake
• Record iron ore tonnes sold – 19.2Mt
• Onslow Iron Project construction commenced
• Secured capacity allocation for Stanley Point Berth 3 at Port Hedland subject to approvals
• Binding port and rail sharing agreement with Hancock Prospecting Pty Ltd
• Significant Perth Basin onshore gas discovery at Lockyer Deep.
MinRes generated Underlying EBITDA of $1.0 billion for the 2022 financial year (FY22) (FY21: $1.9 billion), down 46 per cent on the previous corresponding period (pcp). Earnings were negatively impacted in the first half by the steep decline in iron ore prices and widening discounts before stabilising in the second half. With record lithium prices, first earnings from conversion of Mt Marion spodumene concentrate into lithium hydroxide and record growth in the Mining Services division, MinRes delivered a strong second-half performance.
Underlying earnings after tax were $400 million (FY21: $1.1 billion). Statutory net profit after tax was $351 million (FY21: $1.3 billion) and including $10 million post-tax impairment charges in relation to intangible assets.
The Directors have resolved to distribute a final dividend and total dividends for FY22 of $1.00 per ordinary share. The final dividend will be fully franked, have a record date of 5 September 2022, and will be paid to shareholders on 23 September 2022.
Metric
FY22 Results Comparison to FY21
Revenue $3.4bn Down 8%
Underlying EBITDA1 $1.0bn Down 46%
Underlying earnings after tax1 $400M Down 64%
Diluted earnings per share (EPS) 184.87cps Down 73%
Operating cash flow2 $344M Down 79%
Capex $800M Up 7%
Cash $2.4bn Up 57%
Net assets $3.3bn Up 1%
Return on invested capital (ROIC)3 14.1% Down from 38.6%
74 I MINERAL RESOURCES LIMITED 2022 ANNUAL REPORT
1 Refer to Note 3 for reconciliation of non-IFRS measures to the IFRS financial metrics reported in the financial statements. 2 Operating cash flow excludes tax paid of $65 million in FY22 on divestment of Pilbara Minerals Limited (ASX: PLS) and tax paid of $333 million in FY21 on the Wodgina disposal. 3 ROIC calculated as per FY22 Remuneration report definition on a rolling 12 month basis.
1
DIRECTORS’ REPORT (CONTINUED)
CASH AND CAPITAL MANAGEMENT
At 30 June 2022, the Group maintained a strong balance sheet with cash and cash equivalents of $2.4 billion (30 June 2021: $1.5 billion). In addition, the Group has access to substantial undrawn debt facilities to support business development activities of $425 million as at 30 June 2022.
On 3 May 2022, the Group completed a US$1.25 billion Senior Unsecured Notes offering, consisting of US$625 million with 8.0 per cent coupon due 2027 and US$625 million with 8.5 per cent coupon due 2030.
DEBT
Undrawn
US$700M
US$625M
US$625M
Operating cash flow1 of $344 million (30 June 2021: $1,642 million) was impacted by an increase in working capital relating to the restart of Wodgina, ramp-up of Mt Marion production and the conversion of the Group’s spodumene concentrate into lithium hydroxide.
Net cash used in investing activities of $654 million in FY22 includes $326 million net proceeds from the divestment of shares held in Pilbara Minerals Ltd (PLS) and $200 million consideration paid to acquire an interest in the Red Hill Iron Ore JV tenements for the Onslow Iron project.
FY22 was a pivotal year for the future of MinRes with capital expenditure on key projects including:
• Early works and development of Onslow Iron project
• Restart and ramp-up of Wodgina with the commencement of operations of Trains 1 and 2
• Investment to support new external Mining Services contracts
• Natural gas drilling programs in the Perth Basin as part of the transition to lower emitting fuels and low-cost energy, with a significant gas discovery made at Lockyer Deep-1
• Investment in a new state-of-the-art head office to support the Group’s growth agenda.
OPERATIONAL PERFORMANCE
Mining Services
Mining Services delivered a record year with revenue of $2.1 billion (FY21: $1.8 billion), EBITDA of $533 million (FY21: $464 million) and achieved record production of 274Mt for FY22 (FY21: 249Mt). The growth has been primarily driven by higher volumes at Utah Point Hub, along with new external contracts.
Mining Services achieved a margin of 25 per cent, marginally down from 27 per cent in FY21, impacted by lower volumes across the Yilgarn supply chain, as well as higher parts and labour costs.
MINING SERVICES PRODUCTION-RELATED CONTRACT TONNES1
1
Services
1 Operating cash flow excludes tax paid of $65 million on the divestment of the Group’s shareholdings in Pilbara Minerals Limited (ASX: PLS) and tax paid of $333 million in FY21 on the Wodgina disposal.
MINERAL RESOURCES LIMITED 2022 ANNUAL REPORT I 75
Excluding capital repayments on hire purchase arrangements.
MATURITY PROFILE1 2.5 2.0 1.5 1.0 0.5 0.0 $Billions FY23 FY24 FY25 FY26 FY27 FY28 FY29 FY30
$400M Secured Revolving Credit Facility
8.125% due 2027
8.0% due 2027 Senior Unsecured Notes
8.5% due 2030 Senior Unsecured Notes
160 140 120 100 80 60 40 20 Contract tonnes (m wmt) 1H19 2H19 1H20 2H20 1H21 2H21 1H22 2H22 57 70 100 110 124 CAGR 25% 125 146 128
Mining
production-related contract tonnes are based upon TMM, crushed, processed, transported and other logistical services.
DIRECTORS’ REPORT
IRON ORE
Total Sales
IRON ORE (k wmt)
1H21 2H21 FY21 1H22 2H22 FY22
Yilgarn Hub (100%) 4,979 5,526 10,505 4,422 4,258 8,679 (1,826)
Utah Point Hub (100%) 2,934 3,835 6,769 5,436 5,097 10,533 3,767
Total Iron Ore 7,913 9,361 17,274 9,858 9,355 19,212 1,938
The Group owns two iron ore operations in Western Australia being the Utah Point Hub and Yilgarn Hub. Iron ore exports in FY22 were a record 19.2Mt, 11 per cent higher than FY21 as a result of the growth at the Utah Point Hub. Production in the Yilgarn Hub was slightly lower than FY21, with high-cost tonnes removed in response to the lower iron ore prices and widening discounts during the first half.
Iron ore revenue of $2.0 billion (FY21: $3.1 billion) was 35 per cent lower, with volume growth offset by lower iron ore prices and widening discounts. The Platts 62% IODEX declined steeply from US$218/wmt at the end of FY21 to a low of US$87/wmt during the first half, before stabilising in the second half to average US$139/wmt across FY22. The Group’s FY22 average iron ore price achieved was US$82/dmt, a decrease of 42 per cent on FY21, including negative prior period finalisations of US$33 million. Excluding prior year adjustments, iron ore shipments for FY22 achieved a price of US$84/dmt.
Iron ore produced EBITDA of $64 million (FY21: $1,528 million) including a negative adjustment of $43 million related to finalisation of iron ore sales contracts recognised in FY21.
LITHIUM SPODUMENE CONCENTRATE
Total Sales
Mt Marion (100%)1
Wodgina (100%)2 - - - 22 22 22
Total Spodumene Concentrate 203 282 485 208 257 464 (21)
1 The Group operates 100 per cent of the Mt Marion project, in which it has a 50 per cent equity interest and a 51 per cent offtake share of spodumene concentrate produced.
2 The Group has a 40 per cent equity interest in the Wodgina Project
The Group sold 464k dmt of spodumene concentrate in FY22, four per cent lower than FY21 due to lower yields at Mt Marion from mining lower-grade transitional material.
Spodumene concentrate revenue of $566 million (FY21: $130 million) was 336 per cent higher, reflecting a significant rebound in lithium prices. The Group’s share of Mt Marion revenue for FY22 was $539 million (FY21: $130 million). The achieved spodumene concentrate price at Mt Marion increased 329 per cent to average US$1,733/dmt. In response to strong lithium market conditions, the MARBL JV (in which the Group has a 40 per cent interest) also sold 22k dmt of spodumene concentrate, which was stockpiled prior to Wodgina’s closure in 2019, for US$2,200/dmt.
Spodumene concentrate EBITDA was $382 million (FY21: $5 million loss), with higher prices and earnings from the Wodgina stockpile shipment partially offset by costs increasing by 49 per cent on FY21 at Mt Marion, driven by significantly higher royalties, shipping costs, and operating costs.
During FY22, the MARBL JV restarted operations at the Wodgina mine. Mining operations ramped up steadily with resumption of production from Train 1 completed by the end of FY22 and Train 2 subsequently in July 2022. Spodumene concentrate produced from Wodgina will be converted into lithium hydroxide from FY23.
1H21 2H21 FY21
2H22 FY22 YoY Variance
SPODUMENE CONCENTRATE (k dmt)
76 I MINERAL RESOURCES LIMITED 2022 ANNUAL REPORT
(CONTINUED)
YoY Variance
1H22
203 282 485 208 235 442 (43)
DIRECTORS’ REPORT (CONTINUED)
LITHIUM HYDROXIDE
Total Sales
LITHIUM HYDROXIDE (tonnes)
1H21 2H21 FY21 1H22 2H22 FY22 YoY Variance
Mt Marion (51% share) - - - - 6,722 6,722 6,722
Total Lithium Hydroxide - - - - 6,722 6,722 6,722
The Group took possession and control of its 51 per cent offtake share of Mt Marion spodumene concentrate from 1 February 2022, which was toll-converted into 6,722 tonnes of lithium hydroxide in China and sold under a tolling agreement with joint venture partner, Jiangxi Ganfeng Lithium Co. Ltd. (Ganfeng). The average achieved price on the sale of lithium hydroxide under the arrangement was US$77,052/t and the Group recognised EBITDA of US$154 million. The tolling agreement has been extended for an additional three months and will end on 30 November 2022, unless further extended by both parties.
The MARBL JV also holds an interest in two trains of the Kemerton Lithium Hydroxide Plant, near Bunbury in the South West region of Western Australia, which once completed will receive spodumene concentrate feed from the third-party Greenbushes lithium mine. Construction of the plant progressed during FY22 with first product from Train 1 delivered in early July 2022 and mechanical completion of Train 2 on track for the first half of FY23.
LIKELY DEVELOPMENTS AND EXPECTED RESULTS OF OPERATIONS
Information on likely developments in the operations of the Group and the expected results of operations have not been included in this report as the Directors believe it would be likely to result in unreasonable prejudice to the Group.
ENVIRONMENTAL REGULATION
The Group is subject to environmental regulation of its operations, including exploration and mining activities. The Directors are not aware of any significant known breaches of environmental regulations to which the Group is subject.
The Group is registered under the National Greenhouse and Energy Reporting Act 2007, under which it is required to report annual energy consumption and greenhouse gas emissions for its Australian facilities. The Group has systems and processes in place for the collection and calculation of data. Further information on the reporting and results under the Act can be found on the Group’s website.
MINERAL RESOURCES LIMITED 2022 ANNUAL REPORT I 77
INFORMATION ON DIRECTORS
JAMES MCCLEMENTS
Title: Independent Non-Executive Chair (Appointed 2 March 2022)
Lead Independent Non-Executive Director (2017 financial year to 1 March 2022)
Appointment: 29 May 2015
Qualifications: B Econ (Hons)
Experience and expertise: James has over 35 years of experience in the mining industry as a banker and fund manager financing projects globally. He was raised and educated in the Pilbara region of Western Australia and began his professional career with BHP Limited before joining Standard Chartered Bank in Perth and N.M. Rothschild & Sons in Sydney then Denver. James also spent 11 years in the USA and co-founded Resource Capital Funds during that time. James is currently the Managing Partner of RCF and has extensive Board experience having served as a Director of 12 RCF portfolio companies.
Other current directorships: None
Former directorships (last 3 years): None
Special responsibilities:
Chair of Board of Directors (Appointed 2 March 2022)
Chair of Remuneration Committee
Member of Nomination Committee
Member of Sustainability Committee
Interests in shares: 20,872
Interests in options: None
PETER WADE
Title: Former Independent Non-Executive Chair
Appointment: 27 February 2006 (resigned 2 March 2022)
Experience and expertise: Peter has over 46 years’ experience in engineering, construction, project management, mining and infrastructure services. He started his career with the NSW Public Service managing the construction of significant infrastructure projects in NSW including the Port Kembla coal loader and the grain terminals at Newcastle and Wollongong and was also the Deputy Director for the Darling Harbour Redevelopment construction project.
Following his period of employment with the NSW Public Service, Peter joined the executive team of the Transfield Group. Throughout the 1980s and 1990s he was General Manager of Sabemo Pty Ltd, Transfield Construction Pty Ltd, and Transfield Power Technologies and subsequently became Transfield Chief Operations Officer (Southern). During this period Peter was responsible for significant build, own, operate projects including the Melbourne City Link, the Airport Link, the Northside Storage Tunnel and the Collinsville and Smithfield Power Plants.
Peter became Managing Director of Crushing Services International Pty Ltd and PIHA Pty Ltd in 1999, and subsequently Process Minerals International Pty Ltd in 2002 (now wholly owned subsidiaries of Mineral Resources Limited). He managed the companies through a sustained period of growth and development prior to the formation and listing of Mineral Resources Limited in 2006 at which time he was appointed Managing Director of the Group. He was subsequently appointed Executive Chair in 2008 and Non-Executive Chair in 2012. Peter retired and resigned as a director of the Company on 2 March 2022.
Other current directorships: None
Former directorships (last 3 years): SRG Global Limited (ASX: SRG) (resigned 26 November 2019)
Special responsibilities: Former Chair of Board of Directors
Interests in shares: Not applicable as no longer a director
Interests in options: Not applicable as no longer a director
78 I MINERAL RESOURCES LIMITED 2022 ANNUAL REPORT
DIRECTORS’ REPORT (CONTINUED)
INFORMATION ON DIRECTORS (CONTINUED)
CHRIS ELLISON
Title: Managing Director
Appointment: 27 February 2006
Experience and expertise: Chris is the founding shareholder of each of the three original subsidiary companies of Mineral Resources Limited (Crushing Services International Pty Ltd, PIHA Pty Ltd and Process Minerals International Pty Ltd). He has over 40 years of experience in the mining contracting, engineering and resource processing industries within Australia.
Since 2013, Chris has also served as Honorary Consul for New Zealand within Western Australia.
Other current directorships: None
Former directorships (last 3 years): None
Special responsibilities: Managing Director
Interests in shares: 22,522,453
Interests in options: None
KELVIN FLYNN
Title: Independent Non-Executive Director
Appointment: 22 March 2010
Qualifications: B Com, CA
Experience and expertise: Kelvin is a qualified Chartered Accountant with over 31 years’ experience in investment banking and corporate advisory roles, including private equity and special situations investments in the mining and resources sector. He has held various leadership positions in Australia and Asia, having previously held the position of Executive Director/Vice President with Goldman Sachs and Managing Director of Alvarez & Marsal in Asia. He has worked in complex financial workouts, turnaround advisory and interim management.
Kelvin is the Managing Director of the specialist alternative funds manager Harvis, which focuses on structured credit finance, investments and advice in the real estate and natural resources sectors. Kelvin is currently a Non-Executive Director of ASX listed Silver Lake Resources Ltd.
Other current directorships: Silver Lake Resources Limited (ASX: SLR)
Former directorships (last 3 years): None
Special responsibilities: Chair of Audit and Risk Committee
Member of Remuneration Committee
Member of Nomination Committee
Interests in shares: 20,414
Interests in options: None
MINERAL RESOURCES LIMITED 2022 ANNUAL REPORT I 79
DIRECTORS’ REPORT (CONTINUED)
DIRECTORS’ REPORT (CONTINUED)
INFORMATION ON DIRECTORS (CONTINUED)
SUSIE CORLETT
Title: Independent Non-Executive Director
Appointment: 4 January 2021
Qualifications: BSc (Geo, Hons), FAusIMM, GAICD
Experience and expertise: Susie Corlett is a professional Non-Executive Director following a 25-year executive career spanning mine operations, investment banking and private equity. Susie is currently Non-Executive Director of Iluka Resources Ltd, Aurelia Metals Limited, a Director of The Foundation for National Parks and Wildlife and a Trustee of the Australian Institute of Mining and Metallurgy (AusIMM) Education Endowment Fund.
Originally a Geologist, Susie has a background in mining operations and mineral exploration. During her executive career, she was an Investment Director for a global mining private equity fund and worked in mining risk management and project finance for Standard Bank Limited, Deutsche Bank and Macquarie Bank.
Susie has a track record of delivering significant value to stakeholders through the deployment of growth strategies, oversight of capital allocation, project execution and operational excellence. Her career success has been underpinned by sound commercial judgement, strong risk management skills and a long-standing commitment to diversity, inclusion, shared values and sustainability. Susie is a member of Chief Executive Women.
Other current directorships: Iluka Resources Limited (ASX: ILU), Aurelia Metals Limited (ASX: AMI)
Former directorships (last 3 years): None
Special responsibilities: Chair of the Sustainability Committee
Member of Audit and Risk Committee
Member of the Nominations Committee
Member of Remuneration Committee
Interests in shares: 3,080
Interests in options: None
XI XI
Title: Independent Non-Executive Director
Appointment: 11 September 2017
Qualifications: MA International Relations (China Studies & International Finance), BSc Chemical Engineering & Petroleum Refining, BSc Economics
Experience and expertise: Xi Xi has over 20 years’ experience in the global natural resources sector having served as a Director of Sailing Capital, a US$2 billion private equity fund founded by the Shanghai International Group. She has worked with numerous Chinese state owned and privately owned enterprises, advising on international acquisitions and investments. Xi Xi has previously served as an analyst and portfolio manager for the Tigris Financial Group (Electrum) in New York, focused on the oil and gas and mining sectors. She has led and managed several mineral exploration teams in West Africa and Latin America, including the successful discovery of a new silver-lead-zinc district in Mexico.
Other current directorships: Zeta Resources Ltd (ASX:ZER)
Former directorships (last 3 years): None
Special responsibilities:
Chair of Nomination Committee
Member of the Audit and Risk Committee
Member of the Sustainability Committee
Interests in shares: 18,839
Interests in options: None
80 I MINERAL RESOURCES LIMITED 2022 ANNUAL REPORT
REPORT (CONTINUED)
ZIMI MEKA
Title: Independent Non-Executive Director
Appointment: 17 May 2022
Qualifications: B Eng (Hons) Mech, FEAust FAusIMM MAICD
Experience and expertise: Zimi is the Chief Executive Officer and a founding director of consulting and engineering firm, Ausenco Pty Ltd. He has over 40 years’ experience in the design, construction and operation of minerals processing plants and infrastructure, both in Australia and internationally. He has grown Ausenco from its inception in Australia into a well-respected global business with over 3,000 people across 26 offices in 14 countries servicing the minerals and metals, oil and gas, and industrial sectors. He is the Queensland University of Technology’s 2008 Alumnus of the Year, was awarded the Australian Institute of Mining and Metallurgy’s 2009 Institute Medal and is one of Australia’s top 100 most influential engineers as awarded by Engineers Australia. In 2013 Engineers Australia also named him Queensland Professional Engineer of the Year.
He is a Fellow of Engineers Australia, a Fellow of the Australian Institute of Mining and Metallurgy, and a Member of the Australian Institute of Company Directors. In 2019, Zimi was inducted into the Engineers Australia Hall of Fame.
Other current directorships: C3 Metals TSXV:CCCM (formerly Carube Copper Corp. TSXV:CUC)
Former directorships (last 3 years): None
Special responsibilities: Member of Nomination Committee
Interests in shares: 215
Interests in options: None
Note: ‘Other current directorships’ quoted above are current directorships for listed entities only and excludes directorships of all other types of entities, unless otherwise stated. ‘Former directorships (in the last three years)’ quoted above are directorships held in the last three years for listed entities and excludes directorships of all other types of entities, unless otherwise stated. ‘Interest in shares’ quoted above are as at the date of this report.
COMPANY SECRETARIES
MARK WILSON
Mark joined Mineral Resources Limited as Chief Financial Officer in August 2018 and was subsequently appointed as Company Secretary on 19 October 2018. Mark is an experienced senior executive with a strong track record in development and implementation of business strategy, balance sheet management, organisational design, project management, and transaction execution. Mark has held senior positions in a number of Australian and international companies, including Laing O’Rourke, Multiplex and Brookfield Multiplex. Mark holds a Bachelor of Commerce (Finance) and Bachelor of Laws from the University of New South Wales and has a Graduate Diploma in Applied Finance and Investment from the Securities Institute of Australia (FINSIA).
DEREK OELOFSE
Derek has over 35 years’ financial and commercial management experience in large private, governmental and listed entities based within Australia, South Africa and the United Kingdom. Derek has a Bachelor of Accounting and Bachelor of Commerce degree from the University of the Witwatersrand in South Africa, a Master of Business Administration from Henley Management College in the United Kingdom and is a Fellow of the Institute of Chartered Accountants Australia and New Zealand. Derek joined Mineral Resources Limited in 2012 as Group Financial Controller and was appointed joint Company Secretary on 4 October 2018.
MINERAL RESOURCES LIMITED 2022 ANNUAL REPORT I 81
DIRECTORS’
DIRECTORS’ REPORT (CONTINUED)
INFORMATION ON DIRECTORS (CONTINUED)
MEETINGS OF DIRECTORS
The number of meetings of the Company’s Board of Directors (the Board) and of each Board committee held during the year ended 30 June 2022, and the number of meetings attended by each Director while they were a member of the Board/committee were:
Full Board
Remuneration Committee Nomination Committee4 Sustainability Committee
Attended Held Attended Held Attended Held Attended Held Attended Held
James McClements1 12 12 n/a 4 5 5 2 2 2 2
Peter Wade2 9 9 n/a 3 n/a 3 1 1 n/a n/a
Chris Ellison 12 12 n/a n/a n/a n/a n/a n/a n/a n/a
Kelvin Flynn 11 12 4 4 5 5 2 2 n/a n/a
Susie Corlett 12 12 4 4 5 5 2 2 2 2 Xi Xi 12 12 4 4 n/a n/a 2 2 2 2
Zimi Meka3 1 1 n/a 1 n/a 1 n/a n/a n/a n/a
1 James McClements was appointed Independent Non-Executive Chairman on 2 March 2022.
2 Peter Wade retired as Non-Executive Chairman and from the Company’s Board on 2 March 2022. Number Held relates to meetings held from 1 July 2021 and prior to his retirement on 2 March 2022.
3 Zimi Meka was appointed as Non-Executive Director on 17 May 2022. Number Held relates to meetings held from 17 May 2022 to 30 June 2022.
4 All Non-Executive Directors are members of the Nominations Committee.
82 I MINERAL RESOURCES LIMITED 2022 ANNUAL REPORT
Audit & Risk Committee
 Mandy Crowe | Executive Assistant | Sprinter
 Cilivia Moro Moriba | Senior INX Administrator | Human Rights Advocate
REMUNERATION REPORT (AUDITED) MINERAL RESOURCES LIMITED 2022 ANNUAL REPORT I 85
REMUNERATION REPORT (AUDITED)
LETTER FROM THE REMUNERATION COMMITTEE CHAIR
Dear Shareholder,
I am pleased to present the 2022 Financial Year (FY22) Remuneration Report (Remuneration Report) for Mineral Resources Limited (MinRes, the Group or the Company) on behalf of the Remuneration Committee (the Committee).
Following my appointment as Independent Non-Executive Chair to the MinRes Board, I will continue to Chair the Remuneration Committee for an interim period while we recruit new Non-Executive Directors to the Board.
SUSTAINABILITY
During FY22 we established the Sustainability Committee, which is Chaired by Susie Corlett, with Xi Xi and me as members.
The Committee holds bi-monthly meetings to monitor performance on MinRes’ 22 sustainability targets across the six areas of Ethics and Integrity, Climate Change, Social, Health and Wellbeing, Environment, and Diverse and Inclusive workplaces.
These are issues in our industry, and we accept responsibility as an influential industry participant to achieve better outcomes. Pleasingly, over 85 per cent of our sustainability targets were exceeded, achieved, or demonstrated positive progress over the year.
The Parliamentary Inquiry into sexual harassment against women in the FIFO mining industry makes it clear that as an industry we need to make sustained changes to our culture, sites and reporting processes to ensure women feel safe and work in an environment that is free from sexual harassment.
MinRes has already started making progress in these areas. We made decisions three years ago to create a different, safe and community-minded environment for our FIFO workers. One where women and couples can thrive.
As with prior years, the Short Term Incentive awards pay a significant portion in equity to align executive and shareholder interests, and enables the enactment of clawback and malus provisions if MinRes’ values of Integrity and Respect for all stakeholders are not upheld.
I encourage you to read our 2022 Sustainability Report which details our sustainability management approach and our performance for FY22.
OUR YEAR IN REVIEW
FY22 has been another outstanding year for MinRes, despite the challenges of COVID-19 and the uncertain external environment characterised by substantially reduced prices for our iron ore exports along with higher costs of key inputs such as fuel and labour.
MinRes has made significant progress in the development of quality, long life assets in our lithium, iron ore and energy portfolios. These assets, coupled with the Group’s continued strength in Mining Services, will underpin a strong future for many years to come.
The Company generated underlying earnings before interest, tax, depreciation, amortisation and impairment (Underlying EBITDA) of $1.0 billion, down 46 per cent on the prior corresponding period (pcp). Earnings were negatively impacted in the first half by a steep decline in iron ore prices and widening discounts before stabilising in the second half. Record lithium prices, conversion of Mt Marion spodumene concentrate into lithium hydroxide and record growth in the Mining Services division, led to a strong second half performance.
MinRes was admitted to the ASX 50 Index on 3 June 2022, another important milestone for the Company. Since listing in 2006, we have been one of the ASX’s strongest performers, delivering an annual average total return to shareholders of 30 per cent.
It is particularly pleasing to see MinRes’ long term strategic investment in lithium begin to reach its potential in FY22.
In February 2022, the Group transitioned into being a producer and seller of lithium hydroxide for the first time. Lithium hydroxide is a key input in the manufacture of batteries used in electric vehicles. Prior to this, MinRes had sold lithium spodumene concentrate from its Mt Marion facility, jointly owned with our partner Ganfeng. The move to have Ganfeng toll treat MinRes’ 51 per cent share of mine output and sell the lithium hydroxide sees MinRes move into a vertically integrated model that derives more value across the lithium value chain, and delivers a significant cost advantage.
In November 2021, we recommenced operations at Wodgina with our joint venture partner Albemarle. First product was achieved in May, which is a remarkable achievement given the challenging labour market conditions. Wodgina is a world-class asset and is expected to contribute significant earnings for many years to come.
FY23 will see the expansion of the lithium business’ contribution as we expand our Mt Marion mine, restart Train 3 at our Wodgina mine and commence hydroxide production at our Kemerton Plant.
MINERAL RESOURCES LIMITED 2022 ANNUAL REPORT I 87
REMUNERATION REPORT (AUDITED) (CONTINUED)
Our iron ore division also reached a significant milestone in FY22, with unconditional Final Investment Decision taken by all partners in the Onslow Iron project. The final remaining approval was received in August 2022. Project development has commenced with early construction works underway.
The HanMin Joint Venture (a 50/50 JV between MinRes and Hancock Prospecting), was also awarded the rights to develop a new capesize carrier berth in Port Hedland (subject to approvals) for the South West Creek project in the Pilbara. MinRes is working with Hancock and Roy Hill to evaluate the development of supporting infrastructure, which will unlock stranded assets at Marillana.
MinRes is committed to achieving net zero carbon emissions by 2050. Displacing diesel used across our operations with cleaner natural gas and renewable energy is a key strategy on our pathway to net zero.
During FY22, our energy division made one of Australia’s largest onshore gas discoveries, at Lockyer Deep in the Perth Basin. MinRes will continue to progress our search for additional gas resources in the Perth Basin and Northern Carnarvon Basin to facilitate this transition at the lowest possible cost through ownership of dedicated gas resources, which will also offer other commercial opportunities.
MinRes successfully completed a US$1.25 billion Senior Unsecured Notes Offering (the Notes) in May 2022 in a very challenging finance market. A portion of the notes mature in 2027, with the balance maturing in 2030 at an average rate of 8.2 per cent, providing funds to support growth projects. The success of this raising demonstrates the strength of support within global capital markets for the MinRes business model.
Pleasingly, our Return on Invested Capital (ROIC) being a key measure for the Executive KMP’s Long Term Incentive Program, remained above 12 per cent in FY22, with the four-year rolling ROIC average at 27 per cent in FY22. MinRes’ ROIC has now exceeded the 12 per cent target in nine of the 13 four-year ROIC measurement periods since listing in FY06.
During the year, the Committee reviewed the adequacy of the 12 per cent target by reference to the performance of groups separately comprising large listed Australian companies, the ASX 100 and the Remuneration Peer Group. The review highlighted MinRes’ strong relative performance and the Committee has determined that the 12 per cent threshold remains appropriate (refer section 4.4 in this Report) for the LTI grant to be made during FY23. The Committee will continue to review the appropriateness of this target regularly, particularly given the rising interest rate environment currently being experienced in capital markets globally.
Late in the financial year, MinRes moved into new headquarters in Perth. This world class facility will assist in promoting an increased focus on mental and physical health and wellbeing and provide
a platform to attract and retain outstanding talent. This new standard of accommodation will be progressively rolled out across all operating sites with plans for substantial upgrades to camp accommodation for our FIFO workforce.
Furthering the development of our strong and deep leadership team for the organisation is a key priority of the Board to ensure sustainability of the business. Maintaining the culture and commercial DNA of MinRes, while respecting the requirement for structures appropriate for an ASX 50 listed company, is one of the key challenges and areas of focus for the Board.
CHANGES TO EXECUTIVE KMP REMUNERATION
No changes were made to key remuneration structures in FY22, with base salaries for KMP remaining largely unchanged for the third consecutive year.
As set out in Section 5.2 below, the Company expanded its STI determination process to include a new individual assessment matrix that supplements the broader assessment of Group performance previously used in assessing performance. This new matrix focuses on six key attributes considered to be fundamental in the continued success of the Group, and is applied to the Executive KMP other than the Managing Director.
A review of remuneration conducted during the year identified a significant gap between the remuneration on offer to Executive KMP in FY22 and the Company’s targeted position of 50th percentile of our Comparator Businesses for fixed remuneration and 75th percentile for maximum remuneration (including maximum STI and LTI opportunities). In order for our remuneration to remain competitive, changes will be made to the fixed remuneration and maximum STI percentage for Executive KMP for FY23. These changes are detailed in the report that follows.
CHANGES TO NON-EXECUTIVE DIRECTOR REMUNERATION
No changes were made to the Non-Executive Director (NED) fees in FY22 following the increase in FY21 made in order to align more closely with Comparator Businesses. The FY21 changes represented the first change to the fee structure since FY15, and included the introduction of board committee fees to recognise the significant workload inherent in service on these committees, and an increase in base fees for the Chair, Board and Board Committee members. These changes have been made to ensure the Company remains able to attract suitably qualified and experienced NEDs.
A review of Non-Executive Director fees was conducted during FY22 with independent benchmarking analysis finding that the Chair and Committee Fees currently offered were well below the Company’s targeted position of 50th percentile of our Comparator Businesses. In order for Non-Executive Director remuneration to remain competitive, changes will be made to the fee paid to the Chairman for FY23 as detailed in the report that follows.
88 I MINERAL RESOURCES LIMITED 2022 ANNUAL REPORT
FY22 OUTCOMES AND ALIGNMENT
FY22 has been another strong year for the Company, with a positive financial performance and meeting of guidance across all key metrics. In addition, there was material progress and success with several strategic initiatives commencing this financial year, most of which are the result of a number of years of planning and development, and all of which will enable the Company to continue its growth over the next decade.
Despite the success delivered across many fronts, the Group did not declare an interim dividend due to market uncertainty and a substantial reduction in iron ore prices over the first half of the year. A Final Dividend of $1.00 per share has been declared.
The STI outcomes for Executive KMP range between 78.8 per cent and 94.5 per cent of maximum STI, less than in prior years, reflecting the performance of the Company. Consistent with the design of the Short Term Incentive program, any STI reward in excess of 50 per cent of the participant’s maximum STI (i.e. anything above 50 per cent of Fixed Annual Remuneration for the Managing Directors and 40 per cent for the remaining Executive-KMP) is deferred for up to two years and settled in equity, to further align management and shareholder interests. Further detail of these outcomes can be found in Section 5.3 of the Remuneration Report.
To ensure the Company is developing deep leadership talent, MinRes has enhanced internal processes, particularly in relation to assessment of leadership performance. The STI outcomes reflect the performance of the Company across a range of key objectives, including how well individual Executive KMP demonstrated the leadership attributes expected to support growth objectives and corporate culture.
Under the Long Term Incentive program issued to Executive KMP in FY22, 67 per cent of the LTI granted to each Executive KMP will vest only if the Company’s four-year average ROIC exceeds 12 per cent, and for 100 per cent to vest, the four year average ROIC must exceed 18 per cent, with FY22 being the first of those four years. The LTI program provides significant rewards to Executive KMP only if strong financial performance is achieved through this period (i.e., likely to cover highs and lows of commodity cycles).
In conclusion, we are satisfied that the FY22 remuneration outcomes reflect and support the Company’s strategic and financial performance and requirement to develop future leadership to sustain the business in the long term.
Our EGM of Corporate Development, James Bruce, NonExecutive Director and Chair of the Sustainability Committee, Susie Corlett, and I met with Institutional Investors and Proxy Advisors over the last few months. It was pleasing to note the high level of continued support at these sessions for the Group’s remuneration arrangements. This feedback is sincerely appreciated, and we continue to value any further feedback you may have in this regard.
I invite you to review the full report laid out over the following pages and thank you for your interest in our Company.
Yours faithfully,
James McClements Independent Non-Executive Chair and Chair of the Remuneration Committee
REMUNERATION REPORT (AUDITED) (CONTINUED) MINERAL RESOURCES LIMITED 2022 ANNUAL REPORT I 89
 Clay Greenbank | General Manager Leadership and Performance | Traditionalist
MINERAL RESOURCES LIMITED 2022 ANNUAL REPORT I 91 REMUNERATION REPORT CONTENTS 1. KEY MANAGEMENT PERSONNEL 93 2. REMUNERATION GOVERNANCE 93 3. REMUNERATION STRATEGY 95 4. REMUNERATION FRAMEWORK FOR FY22 97 5. REMUNERATION OUTCOMES FOR FY22 107 6. KEY CHANGES TO REMUNERATION FOR FY23 118 7. SUMMARY OF KMP EMPLOYMENT CONDITIONS 118 8. KMP STATUTORY REMUNERATION SCHEDULE 120 9. SHARE RIGHTS GRANTED, VESTED AND POTENTIAL FUTURE VESTING 122 10. EQUITY INSTRUMENTS HELD BY KMP 126 11. TRANSACTIONS WITH RELATED PARTIES 127 This Remuneration Report forms part of the Directors’ Report for the year ended 30 June 2022 and has been audited in accordance with section 300A of the Corporations Act 2001. The report addresses the following key areas: MINERAL RESOURCES LIMITED 2022 ANNUAL REPORT I 91
REMUNERATION REPORT (AUDITED) (CONTINUED)
1. KEY MANAGEMENT PERSONNEL
Key Management Personnel (KMP) comprise those persons that have responsibility, authority and accountability for planning, directing and controlling the activities of the entity, directly or indirectly, including any Director of that entity. In this report, a reference to an “Executive” or “Executives” is a reference to a KMP, including the Managing Director.
The following table outlines the Company’s KMP during the whole of FY22 and up to the date of this report, unless otherwise stated:
EXECUTIVE KMP
Current
Chris Ellison Managing Director (MD)
Paul Brown Chief Executive – Lithium
Mike Grey Chief Executive – Mining Services
Mark Wilson Chief Financial Officer and Company Secretary
NON-EXECUTIVE KMP
Current
James McClements Independent Non-Executive Director
Susie Corlett Independent Non-Executive Director
Kelvin Flynn Independent Non-Executive Director
Zimi Meka Independent Non-Executive Director (appointed on 17 May 2022)
Xi Xi Independent Non-Executive Director
Former Peter Wade Non-Executive Chair (resigned 2 March 2022)
2. REMUNERATION GOVERNANCE
2.1 REMUNERATION COMMITTEE INDEPENDENCE
The Remuneration Committee continued to be comprised solely of independent Non-Executive Directors (NED):
• James McClements Committee Chair
• Kelvin Flynn Committee Member
• Susie Corlett Committee Member
2.2 ROLE OF THE REMUNERATION COMMITTEE
The Remuneration Committee advises the Board on KMP remuneration by performing the following functions:
• Making recommendations to the Board on remuneration structure, practices, policy and quantum for the Managing Director Executive KMP and NEDs
• Determining the eligibility, award and vesting of Short Term Incentives (STI) and Long Term Incentives (LTI)
• Work closely with the Audit and Risk Committee to ensure financial measures and Risk and Compliance outcomes properly inform the relevant STI and LTI outcomes; and
• Work closely with the Sustainability Committee, providing oversight of company diversity and gender pay equity and recommendations to the Board on appropriate targets.
The Remuneration Committee convened regularly throughout FY22 and invited senior management and external consultant input as required.
2.3 EXTERNAL AND INDEPENDENT ADVICE
As with previous years, the Remuneration Committee engaged the services of independent external consultants to provide insights on KMP remuneration trends, regulatory and governance updates and market data.
No remuneration recommendations as defined in Section 9B of the Corporations Act 2001 were obtained during FY22.
MINERAL RESOURCES LIMITED 2022 ANNUAL REPORT I 93
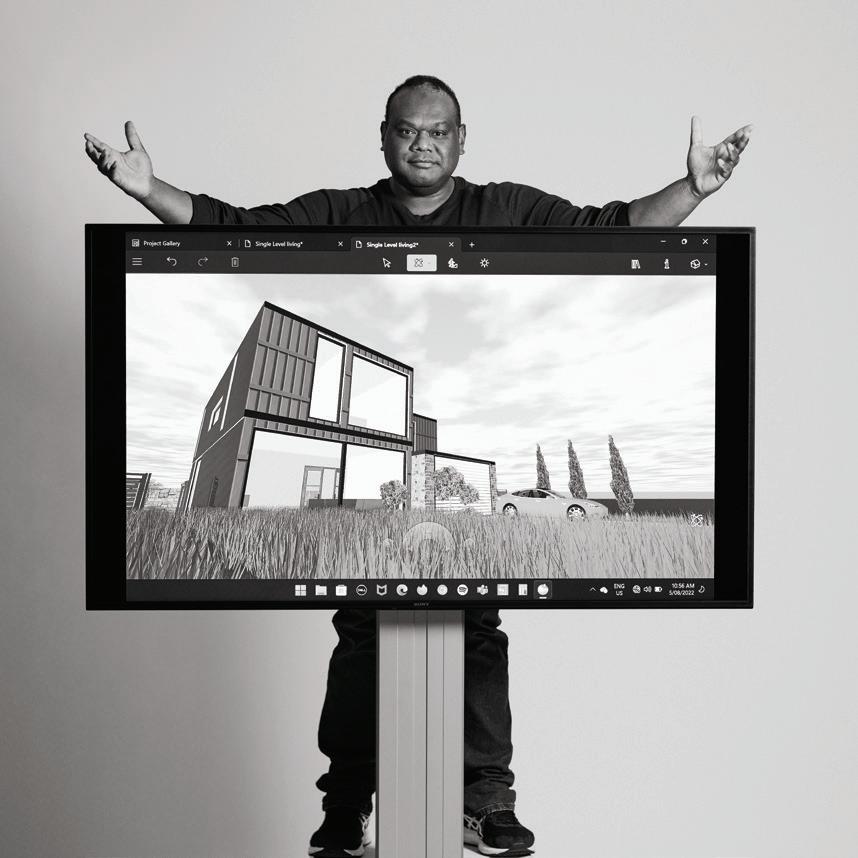 Gabriel Laim | Project Geologist | Container-Home Designer
REMUNERATION REPORT (AUDITED) (CONTINUED)
3. REMUNERATION STRATEGY
3.1 THE CONTEXT IN WHICH WE SET OUR REMUNERATION STRATEGY
The remuneration framework is designed to support the Company’s vision to be recognised as a great Australian company that:
• Is a leading provider of innovative and sustainable mining services
• Provides innovative and low-cost solutions across the mining infrastructure supply chain
• Operates with integrity and respect; and
• Works in partnership with our clients, our customers, our people and our community to achieve these objectives.
To create wealth for shareholders, we task our management team with employing the capital entrusted to them to sustain attractive rates of return, that is, exceeding the long-term returns that could be achieved elsewhere at comparable levels of risk. This is recognised through the Long Term Incentive Program, both by rewarding management when undertaking long-term strategic growth initiatives that maintain high operating returns throughout commodity cycles, and in seeking opportunities to deploy capital innovatively for sustainable high future returns for shareholders.
The Board has approved a strategy to deliver on this objective comprising:
• A core business as a mining services contractor
• An owner and operator of mining-related infrastructure
• An acquirer of significant profit share stakes in mineral projects with rights to operate the associated mines for longer-term sustainability higher capital efficiency and lower risk including from diversification
• Recycling of capital; and
• A flexible balance sheet to fund organic growth for mining services and mining infrastructure businesses while retaining a level of agility for opportunistic growth opportunities as they arise.
The ability to execute this strategy innovatively, sustainably and in a way that creates attractive returns for shareholders is highly dependent on the quality of the Company’s culture, management and workforce.
The difficulty of attracting and retaining executives of the necessary calibre to realise the above vision and strategy varies depending on the current phase of Australia’s resources industry. Presently, industry demand for executive talent has never been stronger. This requires the Company to offer competitive remuneration, both in
terms of fixed and variable opportunity, and to have adequate and effective retention mechanisms in place (such as the STI deferral arrangements introduced in FY20). As part of our wider employee engagement strategies, these actions ensure the Company retains experienced and competent employees who are capable of innovating to promote growth, ultimately leading to attractive long-term rates of return.
The Company’s long-term sustainable growth is promoted within the framework by the delivery of a significant portion of remuneration in equity, and the Company’s requirement that Executive KMP hold the equivalent of at least one year’s FAR in Company shares, assisting in aligning the senior leadership team’s interest with shareholders’ interests.
3.2 REMUNERATION PRINCIPLES
The following principles guide the Company’s KMP remuneration decisions:
• Fairness and impartiality
• Transparency
• Promotion of a direct link between reward and performance
• Encouraging retention of key personnel over the longer term
• Alignment of employee, customer and shareholder interests
• Incentivising behaviour that optimises return on shareholder capital
• Flexibility to optimise returns via changes in investment strategy; and
• Prioritisation of the Company culture and behaviours that continue to promote physical and psychological safety, social and environmental responsibility, innovation and risk management.
3.3 MARKET POSITION FOR REMUNERATION
The Company again conducted a review of its market position for KMP remuneration that included examination of common practice within comparable businesses, external advice and input from investors and their advisors. Fixed remuneration for Executive KMP is targeted at the 50th percentile of comparable roles in Comparator Businesses (see below) while total maximum remuneration, inclusive of fixed and at-risk remuneration, is targeted at the 75th percentile of maximum remuneration at Comparator Businesses.
MINERAL RESOURCES LIMITED 2022 ANNUAL REPORT I 95
REMUNERATION REPORT (AUDITED) (CONTINUED)
3. REMUNERATION STRATEGY (CONTINUED)
Comparator Businesses
The Board determines a group of Comparator Businesses on an annual basis that are used for the purposes of benchmarking remuneration offered to KMP, in terms of amounts and structure. In determining the Comparator Businesses, the Committee considers a broad group of ASX-listed companies of a comparable size in terms of enterprise value and revenue, with a particular focus on those in the commercial services and mining sectors, head-quartered in Australia.
The Company’s business model is not typical of peers in the resource sector due to its dual-pronged business operations – first in providing mining services to resources companies and secondly in the ownership and management of resource tenements. This differentiation is accentuated by the recent addition of energy as one of the Company’s focus areas, with all pillars underpinned by innovation.
The list of Comparator Businesses was again reviewed in FY22 to ensure it remains relevant, given the growth in operating activity, revenue and enterprise value. As a result of this review, Newcrest Mining and Origin Energy were added to the Comparator Group, and four companies were removed that were previously included in the FY21 Comparator Businesses list: Beach Energy, New Hope Corporation, NRW Holdings and Perenti. The current Comparator Businesses therefore comprise:
ALS Limited Orica Limited
Aurizon Holdings Limited Origin Energy
CIMIC Group Limited Oz Minerals Limited
Cleanaway Waste Management Limited Qube Holdings Limited
Downer EDI Limited Seven Group Holdings Limited
Evolution Mining Limited Sims Limited
IGO Limited South32 Limited
Northern Star Resources Limited
Washington H. Soul Pattinson
Newcrest Mining Worley Limited
96 I MINERAL RESOURCES LIMITED 2022 ANNUAL REPORT
REMUNERATION REPORT (AUDITED)
4. REMUNERATION FRAMEWORK FOR FY22
4.1 REMUNERATION FRAMEWORK
The table below outlines the remuneration framework that applied in FY22.
Fixed remuneration
At-risk remuneration
Element Salary, superannuation & other fixed benefits Short-Term Incentive (STI) Long-Term Incentive (LTI)
Delivery format Cash
Up to 50 per cent of max STI paid in cash after the financial year
Performance measures
Performance period
Link to MinRes strategy
Share rights
Portion of award over 50 per cent of max STI deferred and awarded as share rights – the first half of which vest at 12 months, and the second half at 24 months after grant date, subject to ongoing service, clawback and malus provisions
Targets in the areas of safety, governance and sustainability; strategic growth; operational performance and financial measures; and organisational culture. Assessments in the areas of leadership; wellbeing and growth of our people; strength of supporting management team; level of collaboration and teamwork; issues resolution; stakeholder engagement; and innovation and creativity
One year
Rights will vest, subject to performance hurdles, ongoing service, malus and clawback provisions, four years after the grant date
Serves to attract high-calibre people and motivate them to deliver on the Company’s immediate business objectives over a 12-month period
Return on Invested Capital (ROIC)
Vesting subject to four-year average ROIC performance over the performance period (Starting 1 July in the financial year of grant)
Recognises that MinRes is a capital intensive business and management and shareholder wealth are created through achieving superior returns on capital deployed
The timeline below illustrates the timing of rewards under the FY22 remuneration arrangements for KMP. Details for each component are set out in section 4.3.
FAR (Salary, superannuation & fixed benefits)
FY22
Paid throughout the year
FY23
FY24 FY25 FY26
STI
Performance period (12 months)
STI up to 50 per cent of max STI paid August 2022. Any portion of award over 50 per cent of max STI is deferred to August 2023 and August 2024
Half of deferred portion vests August 2023, subject to ongoing service and clawback and malus provisions. Number of shares awarded based on value of award divided by the five-day VWAP up to and including 30 June 2022
Total Performance Period (4 years)
Half of deferred portion vests August 2024, subject to ongoing service and clawback provisions. Number of shares awarded based on value of award divided by the five-day VWAP up to and including 30 June 2022
LTI
LTI rights granted November 2021. Number of rights granted based on the participant’s LTI opportunity divided by the five-day VWAP up to and including 30 June 2021
August 2025: Portion of LTI rights vest, subject to 4 year average ROIC, continuous service and clawback provisions
MINERAL RESOURCES LIMITED 2022 ANNUAL REPORT I 97
(CONTINUED)
REMUNERATION REPORT (AUDITED)
4. REMUNERATION FRAMEWORK FOR FY22 (CONTINUED)
4.2 REMUNERATION MIX
The mix of KMP fixed, short and long-term remuneration reflects the Company’s remuneration strategy of:
• Having substantial amounts of pay subject to service and performance so that remuneration can be maximised only by sustained high levels of performance over rolling four year periods; and
• Paying a significant portion in equity, to reduce cash remuneration costs, align executive and shareholder interests, and enable the enactment of clawback and malus provisions if MinRes’ values of Integrity and Respect are not upheld.
The table below summarises the maximum and ‘on-target’ remuneration mix applicable in FY22 for Executive KMP, with on-target STI being 75 per cent of maximum STI and on-target LTI being two thirds of the LTI opportunity.
REMUNERATION MIX
120%
100%
Base
* Base FAR representing FAR excluding superannuation and other fixed elements of remuneration.
4.3 KEY COMPONENTS OF REMUNERATION
The tables below summarise the key components of KMP remuneration for FY22.
FIXED ANNUAL REWARD
Composition
Determination
FAR comprises a base salary, superannuation and other fixed elements of remuneration such as vehicle allowances. Base FAR is comprised just of base salary, excluding superannuation and other fixed elements of remuneration such as vehicle allowances.
Fixed remuneration is determined with reference to the 50th percentile of similar roles in Comparator Businesses, taking account of the experience and skills of the manager involved.
Review FAR is determined on appointment and reviewed annually.
98 I MINERAL RESOURCES LIMITED 2022 ANNUAL REPORT
(CONTINUED)
80% 60% 40% 20% 0% On target On target On targetMax Max Max MD CFO Chief Executives
FAR* STI LTI 41% 48% 34% 26% 25% 26% 23% 38% 39% 24% 31% 45% 25% 42% 33% 27% 33% 40%
REMUNERATION REPORT (AUDITED) (CONTINUED)
SHORT-TERM INCENTIVE
The key elements of the FY22 STI plan are as follows:
Purpose Focus participants on delivery of business objectives over a 12-month period and exhibiting the leadership attributes expected of Executive KMP.
Participation All Executive KMP.
Opportunity The current maximum STI opportunity is 100 per cent of Base FAR for the MD and 80 per cent for other Executive KMP.
Performance Period Performance is measured per financial year (1 July to 30 June).
Exercise of discretion
The Board has discretion, after considering recommendations from the Remuneration Committee, to adjust overall STI awards or an individual’s final STI award. This discretion will be exercised in the case of extraordinary events, exceptional circumstances/business performance and/or the individual’s performance.
Payment Awards made under the STI plan that exceed 50 per cent of the maximum STI opportunity as defined above, are deferred and settled in the form of rights to Company shares (Rights) that vest in two equal instalments: one year and two years following grant of the Rights. Vesting is subject to continued service and the application of the clawback and malus provisions mentioned below. The quantity of Rights provided for each deferred portion is based on the deferred value for each financial year divided by the Volume Weighted Average Price for the five trading days up to and including the last day of the financial year immediately preceding the award year.
Rights on termination
To be eligible for payment, a participant in the STI must be employed by the Company on the date of payment and on the date at which Rights vest, subject to the application of the clawback and malus provisions mentioned below. Executive KMP whose employment is terminated before the date of payment/grant of Rights are not eligible for any STI payment/grant of Rights. Rights that have not yet vested will be cancelled where an Executive KMP’s employment is terminated prior to the vesting date.
Clawback and malus provisions
The Board may, at its discretion, reduce or rescind any awards made under the STI for a period of up to two years following cash payment/grant of Rights in the event that it determines that the cash payment/grant of Rights has been made inappropriately, including in the instance of fraud, dishonesty, breach of duties, misstatement or manipulation of financial information.
Performance Category, Weighting and Measure (refer section 5.3 for FY22 outcomes and section 6 for changes for FY23)
Group Performance
Safety, Governance and Sustainability –weighting 20%
Safety Performance; Total Reportable Injury Frequency Rate (TRIFR), lead indicators
Market and investor relationships including external perception study
Sustainability performance (emissions intensity, strategy development and implementation)
Strategic Growthweighting 30%
Development of long-life projects including development of Onslow Iron project and securing access to berth rights in Port Hedland
Recommencement of operations at Wodgina
Deliver growth in Mining Services activities (tonnes of material moved)
Progress gas exploration to aid energy transition and secure low-cost energy
MINERAL RESOURCES LIMITED 2022 ANNUAL REPORT I 99
REMUNERATION REPORT (AUDITED) (CONTINUED)
4. REMUNERATION FRAMEWORK FOR FY22 (CONTINUED)
SHORT-TERM INCENTIVE (CONTINUED)
Operational performance and Financial Measures –weighting 30%
EBITDA performance against Target
Organisational Cultureweighting 20%
Balance sheet management
Cashflow performance
Cost discipline against Target Delivery of physical outcomes in line with Guidance
Tonnes of production
Retention of senior staff
Cultural development and brand repositioning Leadership behaviours and people development
Individual Performance Assessment
Key Attributes expected of Executive KMP
Strength of leadership on the wellbeing and growth of our people
Performance in growing and developing a strong management team
Openness and directness of communication and focus on collaboration and teamwork
Performance in growing and developing a strong management team
Drive, energy and initiative in taking ownership of and resolving problems
Engagement with stakeholders, and development of personal and business reputation
Innovation and creativity
100 I MINERAL RESOURCES LIMITED 2022 ANNUAL REPORT
REMUNERATION REPORT (AUDITED) (CONTINUED)
LONG-TERM INCENTIVE
The key elements of the FY22 LTI plan are as follows:
Purpose
To focus Executive KMP on:
• Achieving a high and sustained ROIC over the longer term, being a total of four years including the current financial year (Grant Year)
• Encouraging agility and entrepreneurialism to seize opportunities for higher returns contingent on rapid capital deployment within relatively short timeframes and
• Alignment with shareholders’ interests through share rights that do not vest until completion of a four-year period.
Payment vehicle
LTI grants provide rights to Company shares (Rights) with Rights granted within the first half of the Grant Year (Grant Date). Subject to the Performance Measure mentioned below, Rights vest in the fourth financial year after the Grant Year.
Participants have up until the fifteenth anniversary of the Grant Date (Expiry Date) to exercise Rights (convert Rights to Company Shares) with no exercise price being payable. Any vested Rights not previously exercised are automatically exercised at the Expiry Date.
Opportunity
LTI grant value
The LTI grant opportunity for the Managing Director is equal to 180 per cent of base FAR and 150 per cent of base FAR for other Executive KMP.
An amount equal to the LTI opportunity is granted to each LTI participant annually; being the Grant Year (e.g. FY22). Rights vest in the fourth financial year after the Grant Year (e.g. following the end of FY25 for the FY22 award) subject to the Performance Measure mentioned below.
The number of Rights to be issued is determined using the following formula: LTI Rights issued = (base salary x LTI Opportunity)/VWAP where ‘VWAP’ is the five-day Volume Weighted Average Price to the Grant Date (in the case of the FY22 LTIP, up to and including 30 June 2021).
Performance Period
Performance is measured over four consecutive years, being the Grant Year and the following three financial years. For grants made in FY22, the Performance Period is FY22 to FY25 inclusive, with Rights vesting in FY26.
Performance Measure
The number of Rights that vest is subject to the four-year average ROIC achieved by the Company over the Performance Period.
Further discussion of the calculation of ROIC is included in Section 4.4.
Vesting hurdle
The amount of Rights that vest at the end of the Performance Period is determined by reference to the following hurdles:
Four year average ROIC achievement
Less than 12%
Between 12% and 18% 18%+
% of maximum LTI opportunity Nil Pro-rata between 67% and 100% 100%
The selection of 12 per cent ROIC, being an after tax measure, as the threshold for any rights to vest, reflects a level of performance materially above the Company’s nominal post-tax Weighted Average Cost of Capital and ensures that value-destroying performance is not rewarded – i.e. that KMP are focused on achieving returns for shareholders in excess of the Company’s cost of capital.
The high vesting at threshold performance recognises that the Company has set a high bar relative to its cost of capital and to the rates of ROIC achieved by Comparator Companies. It also recognises that inputs to the Cost of Capital can be volatile, so the threshold is set to remain above a cyclical increase in Weighted Average Cost of Capital.
MINERAL RESOURCES LIMITED 2022 ANNUAL REPORT I 101
REMUNERATION REPORT (AUDITED) (CONTINUED)
4. REMUNERATION FRAMEWORK FOR FY22 (CONTINUED)
LONG-TERM INCENTIVE (CONTINUED)
Vesting period
Holding lock
Dividends
All Rights vest four financial years after the Grant Year subject to the Performance Measure, clawback and malus provisions, and continued service.
No holding lock applies to Rights that vest under the FY22 LTI plan, as Rights vest only at the end of the Performance Period, provided the Performance Measure has been achieved.
No dividends are paid to, or received by, Executive KMP on any Rights.
To ensure alignment between shareholder and Executive KMP interests, each Right entitles Executive KMP to one MinRes share, plus an additional number of MinRes shares equal in value to the dividends paid on a MinRes share over the period from the Grant Date of the Rights to the date of exercise (Exercise Date) (Dividend Rights). Without this entitlement, Executive KMP might otherwise be motivated to seek growth over dividend payments. If any Rights are forfeited, their associated Dividend Rights are likewise forfeited.
Clawback and malus provisions
The Board has the discretion to lapse Rights that are on foot, or clawback previously vested LTI awards, in the event that the Board concludes that Rights should not vest or should not have vested due to: fraud, dishonesty or fundamental breach of duties (including misstatement or manipulation of financial information) of any person; or the intentional or inadvertent conduct of any person that the Board determines resulted in an unfair benefit being obtained by a participant.
Hedging Hedging, or the use of derivatives such as collars, caps or similar products in relation to Company securities, including vested shares or unvested Rights, allocated under Company incentive schemes, are strictly prohibited, as is KMP providing share entitlements/Rights as security for loans that may result in margin calls.
Cessation of employment Cessation of employment prior to the Vesting date will result in automatic forfeiture of all unvested Rights unless the Board exercises its discretion (e.g. for health reasons or Change of Control as set out below).
Change of Control / Resignation / Retirement in the event of ill health
In the event of a change of control, resignation or retirement due to ill health, the Board may exercise its discretion to determine whether to vest granted but unvested Rights.
Board discretion The Board retains the discretion to amend, vary, terminate or suspend the LTI plan at any time. Any such variation, amendment, termination or suspension is not to adversely affect or prejudice rights of LTI participants holding Company shares or Rights at that time.
4.4 LTI PERFORMANCE MEASURES
CALCULATING RETURN ON INVESTED CAPITAL (ROIC)
ROIC is measured at a Group consolidated level, on the following basis: ROIC = Net Operating Profit After Tax/Invested Capital
Where:
Net Operating Profit After Tax (NOPAT) is calculated as the Company’s statutory Earnings Before Interest and Tax (EBIT) for the year, after applying the prevailing corporate tax rate. The earnings amount is adjusted to remove the impact of changes to accounting policies and fair value adjustments for listed investments, whether favourable or unfavourable.
Profits, arising on the monetisation of investments such as on the formation of joint ventures or the divestment of portion of the Group’s operations, are a standard part of the Group’s strategy and are therefore included in NOPAT.
Invested Capital is the sum of closing balances for the relevant financial period’s Net Assets less Strategic cash, and Net Interest Bearing Debt at balance date less, adjusted for accumulative accounting policy adjustments and accumulated fair value adjustments for listed investments.
102 I MINERAL RESOURCES LIMITED 2022 ANNUAL REPORT
REMUNERATION REPORT (AUDITED) (CONTINUED)
TREATMENT OF CASH BALANCES FOR THE PURPOSES OF CALCULATING ROIC
Cash balances are included in the calculation of Invested Capital and ROIC. From FY17 though to FY21 Strategic Cash, being cash holdings over and above normal operational requirements retained for future opportunities, of $100 million was deducted from ROIC. Due to the increased size of the Group’s balance sheet and the relative scale of the $100 million Strategic Cash holding, with effect from FY22 onwards, the Board has determined that the Company will no longer deduct Strategic Cash when calculating ROIC for the purposes of measuring KMP’s LTIP performance.
WHY ROIC HAS BEEN CHOSEN AS THE SOLE MEASURE TO DETERMINE LTI AWARDS
The Remuneration Committee continues to be of the view that:
1. ROIC remains the most appropriate measure for evaluating entitlement to an LTI award, as:
(i) It is the key value driver considered by the Company when decisions are made on how to invest capital
(ii) It provides a clear and unambiguous link between Company performance and the creation of shareholder value; and
(iii) Financial return earned on capital deployed is closely correlated to the creation of wealth for shareholders over time.
2. MinRes continues to be a highly capital intensive business. As such, it is vital that Executive KMP ensure that maximum returns are generated on invested capital, which again supports utilisation of ROIC as the most appropriate measure for assessing Executive KMPs’ entitlement to LTI
3. Any additional measure would dilute Executive KMP’s focus on what is viewed by the Board as the Company’s key objective –i.e., the effective deployment of capital to ensure creation of long-term wealth
4. Executive KMP already have a strong alignment with Total Shareholder Return (TSR) given their exposure to the Company’s share price performance and dividends through the incentive structures and associated Rights
5. ROIC is a measure that is directly controlled by Executive KMP and is not influenced by market sentiment which can result in alternate measures, such as TSR, delivering volatile outcomes
6. Shareholder value is driven by a function of:
(i) The excess of ROIC over the Company’s WACC
(ii) Growth in Capital Employed, and
(iii) The number of years that this Growth is able to be sustained.
As can be seen from the above, the use of ROIC and the base target of 12 per cent, materially above the Company’s post-tax Weighted Average Cost of Capital, are designed to encourage strong longer-term performance of the Company.
The following table sets out the components used to calculate ROIC for each of the last five financial years, and shows that, with the exception of FY19 where the capital base increased significantly due to the development of the Wodgina project, ROIC has exceeded the 12 per cent hurdle in each of these years.
MINERAL RESOURCES LIMITED 2022 ANNUAL REPORT I 103
REMUNERATION REPORT
REMUNERATION FRAMEWORK FOR FY22 (CONTINUED)
$ millions
NOPAT:
FY18 Actual FY19 Actual FY20 Actual FY21 Actual FY22 Actual
Profit before tax (per income statement) 390.2 236.0 1,436.2 1,792.7 489.1
Normalised (a) (68.5) 46.8 35.4 (230.4) 196.1
Profit before tax (for ROIC) 321.7 282.8 1,471.6 1,562.3 685.2
Less: Interest income (3.4) (2.5) (14.4) (10.0) (10.7)
Add back: Interest expense 10.1 33.9 104.9 95.8 123.4
Net Operating Profit Before Tax 328.4 314.3 1,562.1 1,648.1 797.9
Less tax at 30% (98.5) (94.3) (468.7) (494.4) (239.3)
NOPAT 229.9 220.0 1,093.4 1,153.7 558.6
Invested Capital:
Net assets (per balance sheet)
1,304.6 1,380.2 2,295.6 3,246.1 3,271.1
Normalised (cumulative, net of tax) (a) (48.0) (14.8) 6.9 (154.3) (10.2)
Net Assets for ROIC 1,256.6 1,365.4 2,302.5 3,091.8 3,260.9
Net Debt 98.9 997.1 697.6
Total invested capital 1,355.5 2,362.5 2,302.5 3,091.8 3,958.5
Strategic cash holding (100.0) (100.0) (100.0) (100.0)
Net Invested Capital 1,255.5 2,262.5 2,202.5 2,991.8 3,958.5
ROIC % 18.3% 9.7% 49.6% 38.6% 14.1%
Four year average ROIC % 10.9% 11.2% 25.9% 31.0% 26.5%
(a) Normalised for the non-operating items, such as gains/losses on strategic investments where such investments are held at the discretion of the Board. Adjustments are also made to operating profits for the effect of new/revised accounting standards.
The Company’s focus on disciplined investment has, since listing, delivered outstanding returns on the capital invested in it, and in turn delivered outstanding returns for its shareholders.
60%
yr Rolling Ave ROIC
ROIC SINCE LISTING (%)
Target
104 I MINERAL RESOURCES LIMITED 2022 ANNUAL REPORT
(AUDITED) (CONTINUED)
50% 40% 30% 20% 10% 0% -10% 4
Annual ROIC Target Max
2007 2008 2009 2010 2011 2012 2013 2014 2015 2016 2017 2018 2019 2020 2021 2022 Full Vesting 18% Partial Vesting 12% 4.
 Michael Pascoe | Enterprise Architect | Mathematician
 Daney Helgadottir | Health Services Administrator | Global Backpacker
4. REMUNERATION FRAMEWORK FOR FY22 (CONTINUED)
Four-year average ROIC for the Company compares favourably against Comparator Companies, with ROIC being well in excess of the 75th percentile, and in most years above the 90th percentile, of Comparator Companies’ ROIC.
35%
30%
25%
20%
ROIC
MinRes 31% 2018 2019 2020 2021
Comparator Companies data available only up to June 2021.
Source: Juno Partners analysis. Adjustments made to reported results to ensure they are comparable to MinRes’ definition of ROIC as set out above.
5. REMUNERATION OUTCOMES FOR FY22
5.1 SUMMARY OF PERFORMANCE
FY22 has been another very successful year for the Company with considerable operational success achieved, despite ongoing COVID-19 constraints. FY22 saw significant developments for the Group’s lithium, iron ore, and energy pillars, supported by initiatives such as the Group’s carbon fibre screens, transhippers and autonomous road trains.
The Company generated underlying earnings before interest, tax, depreciation, amortisation and impairment (Underlying EBITDA) of $1.0 billion, down 46 per cent on the prior corresponding period (pcp) with earnings negatively impacted in the first half by the steep decline in iron ore prices and widening discounts before stabilising in the second half. With record lithium prices, conversion of Mt Marion spodumene concentrate into lithium hydroxide and record growth in the Mining Services division, the Company delivered a strong second half performance.
Underlying earnings after tax was $400 million, down 64 per cent on pcp. Statutory net profit after tax was $351 million, down 72 per cent on pcp, and includes $11 million post-tax impairment charges in relation to intangible assets.
A final fully-franked dividend of $1.00 has been declared, in line with the Company’s historical pay out ratio of 50 per cent of Profit After Tax.
During FY22, the Group’s Invested Capital increased by $966.7 million. Over this period, the Group generated a ROIC of 14.1 per cent.
Operating cashflow decreased by 79 per cent. Following the successful placement of a US$1.25 billion corporate bond, the balance sheet remained conservatively geared at 18 per cent. In order to conserve cash for the Company’s significant planned capital expenditure program in FY22 and FY23, no interim dividend was declared for the half year, although a fully-franked final dividend of $1.00 per share, $188.3 million, has been declared.
MINERAL RESOURCES LIMITED 2022 ANNUAL REPORT I 107 REMUNERATION REPORT (AUDITED) (CONTINUED)
15% 10% 5% P10 P50 P75 P90 11% 11% 26%
REMUNERATION REPORT (AUDITED) (CONTINUED)
5. REMUNERATION OUTCOMES FOR FY22 (CONTINUED)
Notable achievements in FY22 include:
• Industry-leading safety, with Total Recordable Injury Frequency Rate (TRIFR) at 2.33 as at June 2022
• Establishment of the Sustainability Committee, with a focus on health and safety - including mental health, carbon intensity reduction, and Land and Traditional Owner engagement
• A focus on cost management, managing the effects of COVID-19, including on recruitment of personnel and on supply chains
• Expansion of the lithium business with the recommencement of operations at Wodgina, accelerated move into downstream conversion, expansion of output from Mt Marion, and planning and negotiations with Albemarle for the restructure of the MARBL JV
• Final Investment Decision taken with Red Hill Iron Joint Venture (RHIOJV) parties to develop the RHIOJV iron ore assets as part of MinRes’ Onslow Iron Project, along with execution of a Binding Project Development Term Sheet, and commenced planning and acquisition of long-lead items for the commencement of the Onslow Iron Project
• Planning and acquisition of long-lead items for the commencement of the Onslow Iron Project, part of the Australian Premium Iron JV, with partners Baowu, Posco and AMCI
• The allocation of port rights at South West Creek and the formation of the HanMin JV with Hancock Prospecting (subject to approvals)
• The onshore gas finds in the Perth Basin for development of a gas processing facility to enable commercialisation of this find as soon as practicable, and the increased focus on gas exploration in the Carnarvon Basin with JV partner Buru Energy
• The US$1.25 billion corporate bond raise to ensure the provision of capital for the expansion projects summarised above
• The move to new corporate offices and planning for the upgrade of site facilities.
5.1.1 SAFETY, GOVERNANCE AND SUSTAINABILITY
The Company remains industry leading in its safety performance and continues to drive safety improvements throughout the business.
• Lost T ime Injury Frequency Rate (LTIFR) of 0.00 – recording no lost time injuries over FY22, an improvement from 0.12 in prior year
• TRIFR of 2.33, a slight increase from 2.31 in prior year, maintaining an outstanding safety performance year-on-year
• Establishment of the Sustainability Committee, with focus areas of health and safety - including mental health, climate change management and response, Land and Traditional Owner engagement, diversity and inclusion and human rights
• Embedded our annual requirement for employees to undertake an e-learning module on the Code of Conduct and Business Integrity, as well as the introduction of Safe and Respectful Behaviours training programs, which will be augmented by e-learning modules in FY23
• Focused efforts in relation to preventing, managing and responding to risks of sexual assault and sexual harassment, including targeted “stop for safety” campaigns, strengthening prevention and controls and enhanced reporting processes
• Installation of a 2.1MW solar array and battery at the Wonmunna iron ore mine site in the Pilbara commenced in FY22, with installation of the interconnected battery system expected to be completed during FY23. The combined solar battery system will provide approximately 30 per cent of the site’s installed power requirements and reduce carbon emissions by 1,800t of CO2 per annum; and
• Community contributions increased by 10 per cent from prior year to $5.8 million.
5.1.2 STRATEGIC GROWTH
The Group continued to focus on growing our mining services capability in FY22 to build, own and operate crushing screening and processing plants and providing infrastructure solutions to the mining industry, with mining services volumes growing 10 per cent to a record of 274 million wet metric tonnes whilst maintaining margins. The Mining Services pillar will be further bolstered in FY23 with services provided for a full year of operations at Wodgina (see below), increased activities at Mt Marion, and over the coming years, commencement of the Onslow Iron project.
Iron ore exports also increased to a record of 19.2 million wet metric tonnes, up 11 per cent on FY21. The Yilgarn Hub shipped 8.7Mwmt and Utah Point Hub shipped 10.5Mwmt; benefitting from the Group’s prior year investment in Wonmunna. These volumes will be bolstered in future with volumes from the Onslow Iron and South West Creek projects.
The restart of operations at Wodgina commenced in Q2 FY22, with first spodumene concentrate from Train 1 delivered in May and 22k dmt of spodumene concentrate produced in the quarter. The restart of Train 2 progressed well with first spodumene concentrate delivered in early July 2022. Commencing February 2022, MinRes’ 51 per cent share of offtake from Mt Marion spodumene concentrate was converted into 6,722t of lithium hydroxide in China under a tolling agreement with Ganfeng. Development of the Kemerton Lithium Hydroxide Plant continued during the year, with Kemerton Train 1 commissioning occurring in July 2022, and Train 2 due for completion in Q2 FY23.
The Group’s energy division delivered a major gas find in Q2 FY22. Initial gas and condensate analyses from the Lockyer Deep-1 well has been completed, and indicates high-quality gas with less than 4 per cent carbon dioxide.
The Group continued to explore and develop innovative solutions for the mining industry with the deployment of its first carbon fibre screens into its lithium operations as well as the increased deployment of its 320t jumbo road trains.
108 I MINERAL RESOURCES LIMITED 2022 ANNUAL REPORT
REMUNERATION REPORT (AUDITED) (CONTINUED)
The drilling program for the Koolyanobbing magnetite project commenced in late FY22 following promising results that were received from the proof-of-concept drilling program undertaken earlier in FY22. The aim of the Phase 1 program is to scope the magnetite resources potential mining area footprint, and development activities at the Ken’s Bore deposit for the Ashburton Hub commenced in FY22.
5.1.3 FINANCIAL MANAGEMENT AND PERFORMANCE
Financial results for the period are summarised as follows:
• Revenue of $3.4 billion, down 8.5 per cent year-on-year from FY21 of $3.7 billion
• EBITDA of $969 million down 56 per cent from FY21 of $2.2 billion
• Underlying EBITDA $1.0 billion down 46 per cent from FY21 of $1.9 billion
• Cash at bank $2.4 billion, with negative net cash on hand $0.7 billion
• ROIC of 14.1 per cent, and four-year rolling ROIC of 26.5 per cent.
5.1.4 ORGANISATIONAL CULTURE AND DEVELOPMENT
The Company continued to make significant progress in the important area of organisational culture and development:
• As of 30 June 2022, MinRes employed 3,863 employees, an increase of 18 per cent when compared to 30 June 2021
• The female workforce participation rate was 20 per cent, up from 17 per cent in FY21
• The Aboriginal and Torres Strait Islander workforce participation rate is 1.8 per cent with plans developed to increase representation in FY23.
DIVERSITY OF WORKFORCE - FEMALE PARTICIPATION (YTD)
DIVERSITY OF
AND TORRES STRAIT ISLANDER PARTICIPATION (YTD)
Industry Average:
MINERAL RESOURCES LIMITED 2022 ANNUAL REPORT I 109
Jul 2021 Aug 2021 Sept 2021 Oct 2021 Nov 2021 Dec 2021 Jan 2022 Feb 2022 Mar 2022 Apr 2022 May 2022 Jun 2022
17%17% 18% 19% 20% 17% • 17% • 17% • 18% • 18% • 18% • 19% • 19% • 19% • 19% • 20% • 20% •
Jul 2021 Aug 2021 Sept 2021 Oct 2021 Nov 2021 Dec 2021 Jan 2022 Feb 2022 Mar 2022 Apr 2022 May 2022 Jun 2022 Industry Average: 4.7% 1% 2% 3% 4% 5% 1.9% • 1.8% • 1.8% • 1.9% •
WORKFORCE - ABORIGINAL
1.7% • 1.7% • 1.7% • 1.6% • 1.6% • 1.6% • 1.4% • 1.5% •
(AUDITED) (CONTINUED)
5. REMUNERATION OUTCOMES FOR FY22 (CONTINUED)
A summary of the Group’s financial performance over the past five years is set out in the tables below. The relationship between the Group’s financial performance, return to shareholders and KMP remuneration reflects the direct correlation between financial performance, shareholder value and executive remuneration.
Financial Summary ($millions unless otherwise stated)
Earnings
2018
Revenue 1,624 1,512 2,125 3,734 3,418
EBITDA 575 386 2,006 2,183 969
NPAT 272 165 1,002 1,268 351
Return on Revenue 17% 11% 47% 34% 10%
Return on Equity 21% 12%
ROIC
9.7%
39% 11%
Diluted EPS (cents/share) 145.30 87.09 532.96 673.18
Financial Year Ended 30 June
2018
Final dividend for the preceding financial year 0.3300 0.4000 0.3100 0.7700 1.0000
Interim dividend for the current financial year 0.2500 0.1300 0.2300 1.0000 -
Total dividend paid 0.5800 0.5300 0.5400 1.7700 1.0000
Share price 16.00 14.98 21.17 53.73 48.27
Total Shareholder Return (TSR) (cumulative) 19.07 18.58 25.31 59.64 55.93
MINRES SHARE PRICE PERFORMANCE
TOTAL SHAREHOLDER RETURNS 5 YEARS TO 30 JUNE 2022
110 I MINERAL RESOURCES LIMITED 2022 ANNUAL REPORT
2019 2020 2021 2022
44%
18.3%
49.6% 38.6% 14.1%
184.87
2019 2020 2021 2022
REMUNERATION REPORT
800 700 600 500 400 300 200 100 0 Jun 2017 Sept 2017 Jun 2018 Sept 2018 Dec 2017 Mar 2018 Dec 2018 Mar 2019 Jun 2019 Dec 2019 Sept 2019 Jun 2020 Mar 2020 Dec 2020 Mar 2021 Jun 2021 Sept 2020 Sept 2021 Dec 2021 Mar 2022 Jun 2022 ASX 300 ResourcesASX 300MINRES
5.2 DETERMINING STI PERFORMANCE
The FY22 STI assessment matrix was modified to combine Group performance with a measure of individual performance as per the following matrix:
REVISED STI PROGRAM FOR KMP REWARD CALCULATION
GROUP
4-5 core Group objectives for the year
FY22
• Safety, governance, & ESG (20%)
• Strategic growth (30%)
• Operations & Finance (30%)
• Organisational culture (20%)
PERFORMANCE ASSESSMENT
How well has the participant performed measured against the core attributes we expect of our KMP
• Outstanding 1.75x
• Exceptional 1.50x
• On point 1.25x
• Work in progress 0.75-1.0x
For example 80 out of 100 x 1.25x
STI
REWARD
75% of maximum STI Capped at max
Rewards above 50% (MD)/40% (Other KMP) of Base FAR settled in equity vesting over 2 years
of max STI =
of max STI
Drawing on an analysis of performance against key indicators, the Board determines Company performance by each objective and determines an overall score out of 100% with a score of 80% required for “On Target” performance. Then for Executive KMP apart from the Managing Director, a review of individual performance against core Executive KMP attributes is made by the Board to determine an individual performance assessment grading. The Individual Performance Assessment outcome can range between 0 to 1.75. A score of 1.25 is required for “On Target” performance.
With the exception of the Managing Director, the STI reward is then a product of the Group performance score (A) multiplied by the Individual’s Performance Assessment (B) and the Executive KMP’s Target STI, being 75% of their maximum STI opportunity (C). The Managing Director’s STI outcome is not subject to the Individual Performance Assessment element – his STI reward is the product of the Group performance score and his maximum STI opportunity, so as to fully link their STI reward to the overall rating of the Group’s performance.
5.3 FY22 STI OUTCOMES
Company objectives
The Board’s assessment of performance against Company objectives was as follows:
MINERAL RESOURCES LIMITED 2022 ANNUAL REPORT I 111
REMUNERATION REPORT (AUDITED) (CONTINUED)
PERFORMANCE x INDIVIDUAL
x TARGET
= STI
x 75%
75%
OBJECTIVE WEIGHTING OVERALL SCORE Safety, Governance and Sustainability 20% 16/20 Strategic Growth 30% 28/30 Financial and Operational Performance 30% 23/30 Organisational Culture 20% 17/20 Overall score for Company objectives 84/100
REMUNERATION REPORT
5. REMUNERATION OUTCOMES FOR FY22 (CONTINUED)
FY22 STI OUTCOMES (CONTINUED)
Individual performance assessment
Following a detailed review of performance against core attributes required of our leadership team, Executive KMP gradings (excluding the Managing Director) ranged between “On-point” and “Outstanding” resulting in an average score of 1.25 across the Executive KMP for the purposes of the STI program in FY22.
FY22 Discretionary adjustments:
The Board determined, following consideration of the above and other factors, that no discretionary adjustments to STI outcomes were required in FY22.
OUTCOMES ACROSS ALL MEASURES NOTED ABOVE
After consideration of the above factors, the Remuneration Committee recommended, and the Board accepted, the following outcomes for the Executive KMP for FY22.
Exec - KMP Company Score x Individual performance grading x Target STI1 = STI Declared Settled in Cash* Settled in Equity*
MD 84% n/a $1,200,000 $1,008,000 $600,000 $408,000
CE - Lithium 84% 1.252 $510,000 $535,500 $384,000 $195,500
CE - Mining Services 84% 1.252 $510,000 $535,500 $384,000 $195,500
CFO 84% 1.50 $570,000 $718,200 $380,000 $338,200
* Awards made under the STI plan to Executive KMP that exceed 50 per cent of max STI opportunity are deferred in the form. of rights to Company shares (Rights) that vest in two equal instalments: one year and two years following grant of the Rights.
1 W ith the exception of the Managing Director, target STI is 75 per cent of the maximum STI opportunity. For the Managing Director, target STI is equal to the maximum STI opportunity.
2 Although the Individual Performance Grading for the CE – Lithium and the CE – Mining Services is 1.25, this was an outcome of differing ratings across the various Core Attributes for each of the two roles.
These resulted in an overall outcome of 84 per cent of maximum STI for the Managing Director, 78.8 per cent of maximum for the CE - Lithium and CE - Mining Services, and 94.5 per cent of maximum for the CFO.
5.4 LTI PERFORMANCE OUTCOMES: FY22 GRANT
A grant equal to the LTI opportunity was made to FY22 plan participants. The LTI awards will vest in early FY26 with the amount vesting subject to the participant’s ongoing employment with the Company and dependent on the Company’s average ROIC performance over the four year period FY22 to FY25.
Where average ROIC is less than 12 per cent no LTI award will vest. Where average annual ROIC is between 12 per cent and 18 per cent over the four-year period the LTI will vest pro-rata from 67 per cent to 100 per cent of the LTI grant. Where average annual ROIC is greater than 18 per cent, 100 per cent of the LTI grant will vest.
112 I MINERAL RESOURCES LIMITED 2022 ANNUAL REPORT
(AUDITED) (CONTINUED) 5.3
REMUNERATION REPORT (AUDITED)
5.5 LTI PERFORMANCE OUTCOMES: EARLIER GRANTS ON-FOOT
• FY18 Grant
As FY21’s ROIC exceeded 12 per cent the final tranche of the FY18 LTI Plan vested in August 2021, and all three tranches were released from holding lock.
• FY19 Grant
Due to a period of substantial investment, ROIC in FY19 was 9.7 per cent. Under the LTI plan rules in place at that time, there was no LTI grant for FY19 nor was there any opportunity to retest this in subsequent years despite that investment generating substantial returns for the Group.
• FY20 Grant
A grant equal to the LTI opportunity was made to FY20 plan participants on 1 July 2019. The LTI awards will vest in early FY24 with the amount vesting dependent on the Company’s average ROIC performance over the four-year period FY20 to FY23.
Where average ROIC is less than 12 per cent, no LTI award will vest. Where average annual ROIC is between 12 per cent and 18 per cent over the four-year period, the LTI will vest pro-rata from 67 per cent to 100 per cent of the LTI grant. Where average annual ROIC is greater than 18 per cent, 100 per cent of the LTI grant will vest.
FY20’s ROIC was 49.6 per cent, FY21’s ROIC was 38.6 per cent and FY22’s ROIC is 14.3 per cent, therefore contributing to a favourable average ROIC over the three years of the KMP’s FY20 LTIP award. This program is three-quarters of the way through its four-year life, with average ROIC over the four years needing to meet a minimum of 12 per cent. Final vesting is due August 2023.
• FY21 Grant
A grant equal to the LTI opportunity was made to FY21 plan participants on 1 July 2020. The LTI awards will vest in early FY25 with the amount vesting dependent on the Company’s average ROIC performance over the four-year period FY21 to FY24.
Where average ROIC is less than 12 per cent, no LTI award will vest. Where average annual ROIC is between 12 per cent and 18 per cent over the four-year period, the LTI will vest pro-rata from 67 per cent to 100 per cent of the LTI grant. Where average annual ROIC is greater than 18 per cent, 100 per cent of the LTI grant will vest.
ROIC for FY21 was 38.6 per cent and FY22’s ROIC is 14.1 per cent. This program is halfway through its four-year life, with average ROIC over the four years needing to meet a minimum of 12 per cent. Final vesting is due August 2024.
• FY22 Grant
A grant equal to the LTI opportunity was made to FY22 plan participants on 1 November 2021. The LTI awards will vest in early FY26 with the amount vesting dependent on the Company’s average ROIC performance over the four-year period FY22 to FY25.
Where average ROIC is less than 12 per cent, no LTI award will vest. Where average annual ROIC is between 12 per cent and 18 per cent over the four-year period, the LTI will vest pro-rata from 67 per cent to 100 per cent of the LTI grant. Where average annual ROIC is greater than 18 per cent, 100 per cent of the LTI grant will vest.
ROIC for FY22 is 14.1 per cent. This program is a quarter of the way through its four-year life, with average ROIC over the four years needing to meet a minimum of 12 per cent. Final vesting is due August 2025.
MINERAL RESOURCES LIMITED 2022 ANNUAL REPORT I 113
(CONTINUED)
 David Robin | Leading Hand Mechanical Fitter | Soccer Player
5. REMUNERATION OUTCOMES FOR FY22 (CONTINUED)
5.6 REMUNERATION OUTCOMES SCHEDULES
The following tables provide a summary of the take-home pay and shares vested for each KMP during the year, which may be useful in understanding current year pay and alignment with performance. These remuneration outcomes tables differ from the statutory remuneration tables in Section 8 which are prepared in accordance with the Corporations Act 2001 and Australian Accounting Standards.
FY22
Non-Executive Directors
Current:
James McClements 126,528 126,528 24,536 277,592 277,592
Susie Corlett 100,000 100,000 22,944 222,944 222,944
Kelvin Flynn 102,500 102,500 20,500 225,500 225,500
Xi Xi 117,000 97,500 214,500 214,500
Zimi Meka 1 11,126 11,126 1,962 24,214 24,214
Former: Peter Wade8 97,069 97,069 21,025 215,163 215,163
Executive Director
Chris Ellison 1,200,000 600,000 267,451 839,103 54,570 2,961,124 406,672 2,541,413 5,909,209
Other Executives
Paul Brown 850,000 340,000 141,828 142,649 103,568 1,578,045 215,657 432,045 2,225,747
Michael Grey 834,750 340,000 172,218 103,568 1,450,536 261,866 1,712,402
Mark Wilson 933,992 380,000 192,478 140,580 1,647,050 292,671 1,939,721
Total 4,372,965 1,660,000 773,975 981,752 534,723 493,253 8,816,668 1,176,866 2,973,458 12,966,992
1 Zimi Meka commenced on 17 May 2022
2 Cash Salary and Fees exclude superannuation contributions, which are reported within ‘Other Benefits’.
3 STI rewards of up to 40 per cent of an Executive KMP’s base FAR (50 per cent for the Managing Director) are settled in cash, with the balance settled in equity rights. Amounts included here relate to performance during FY21, paid in FY22.
4 FY18 LTI share awards that have vested during FY22, calculated as the number of shares vested multiplied by the face value at grant date. Tranche 3 of the FY18 LTIP vested on 11 August 2021, with the trading restriction being lifted on 12 August 2021.
5 Equity component of Non-Executive Directors’ (NED) remuneration. NED fees continue to be paid 50 per cent in cash and 50 per cent in Company shares. Remuneration disclosed relates to the performance during FY22.
6 Other Benefits relate to non-monetary benefits and superannuation benefits that are awarded for performance during FY22. Paul Brown, Michael Grey and Mark Wilson each received $80,000 in Resource Development Group Ltd (RDG) share options during FY22 as remuneration for serving as NEDs of RDG. RDG is 65.77 per cent owned by the Group.
7 The ‘share price growth’ amount is equal to the number of rights vested multiplied by the increase in the Company share price over the period from grant date to vesting date.
8 Peter Wade retired as Non-Executive Chairman and from the Company’s Board on 2 March 2022.
9 FY20 STI equity settled awards that have vested during FY22 multiplied by the face value at grant date.
MINERAL RESOURCES LIMITED 2022 ANNUAL REPORT I 115 REMUNERATION REPORT (AUDITED) (CONTINUED)
Cash Salary and Fees2 $ STI cash bonus3 $ STI vesting9 $ LTI vesting4 $ NED fees (shares)5 $ Other benefits6 $ Total $ STI vesting share price growth7 $ LTI vesting share price growth7 $ Total including share price growth $
5. REMUNERATION OUTCOMES FOR FY22 (CONTINUED)
Non-Executive Directors
Peter Wade 135,000
135,000 21,694 291,694 291,694
Susie Corlett1 46,708 46,708 8,875 102,291 102,291
Kelvin Flynn 86,250 86,250 16,388 188,888 188,888
James McClements 87,500 87,500 16,625 191,625 191,625
Xi Xi 90,338 82,500 172,838 172,838
Executive Director
Chris Ellison 1,200,000 600,000 2,933,350 51,865 4,785,215 2,605,893 7,391,108
Other Executives
Paul Brown 850,000 280,000 435,918 101,694 1,667,612 382,496 2,050,108
Michael Grey 850,000 340,000 102,069 1,292,069 1,292,069
Mark Wilson 950,000 380,000 143,448 1,473,448 1,473,448
Total 4,295,796 1,600,000 3,369,268 437,958 462,658 10,165,680 2,988,389 13,154,069
1 Susie Corlett commenced on 4 January 2021.
2 FAR is excluding superannuation contributions, which is reported within ‘Other Benefits’.
3 40 per cent of the FY21 STI plan to KMP is paid in cash (50 per cent for the Managing Director) and relates to the performance during FY20, paid in FY21.
4 FY17 and FY18 LTI share awards that have vested during FY21, calculated as the number of shares vested multiplied by the face value at grant date. FY17 LTI shares were freed of trading restrictions on 20 August 2020, while FY18 LTI shares (Tranche 1 and 2) that vested on 20 August 2020 retain their trading restrictions and clawback and malus provisions until 12 August 2021.
5 Equity component of Non-Executive Directors’ (NED) remuneration. NED fees continue to be paid 50 per cent in cash and 50 per cent in MinRes shares. Remuneration disclosed relates to the performance during FY21.
6 Other Benefits relate to non-monetary benefits and superannuation benefits that are awarded for performance during FY21. Paul Brown, Michael Grey and Mark Wilson each received $80,000 in Resource Development Group Ltd (RDG) share options during FY21 as remuneration for their RDG NED remuneration. RDG is 65.77per cent owned by the Group.
7 The ‘share price growth’ amount is equal to the number of rights vested multiplied by the increase in the Company share price over the period from grant date to vesting date.
116 I MINERAL RESOURCES LIMITED 2022 ANNUAL REPORT REMUNERATION REPORT (AUDITED) (CONTINUED) FY21 FAR (cash)2 $ STI cash bonus3 $ LTI vesting4 $ NED fees (shares)5 $ Other benefits6 $ Total $ LTI vesting share price growth7 $ Total including share price growth $
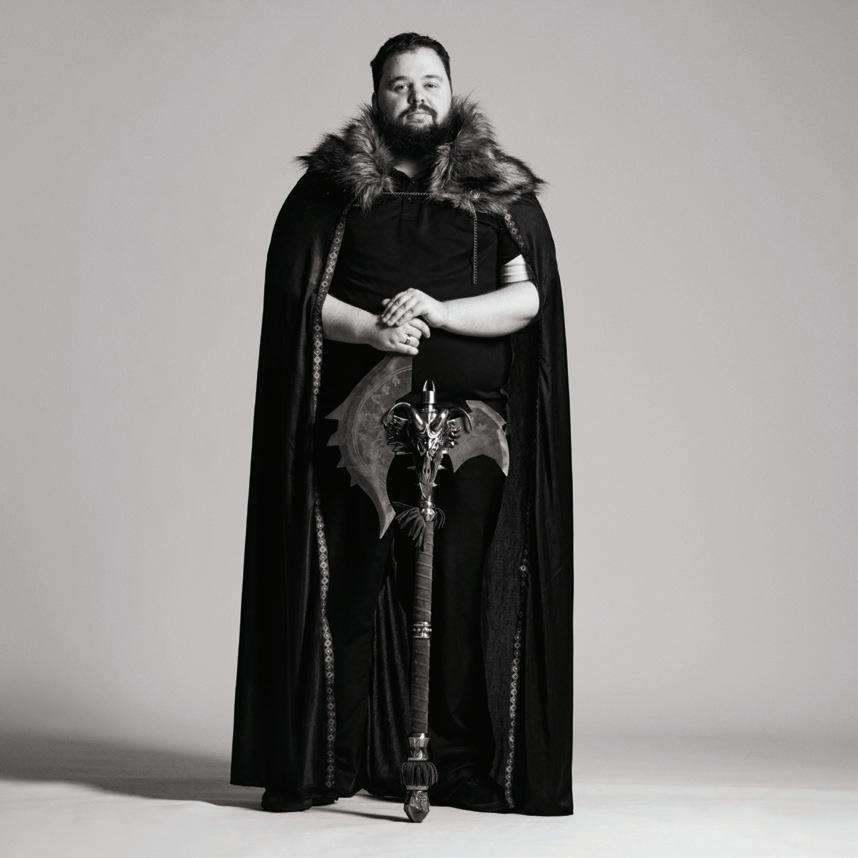 Phillip Falkingham | IT Support Officer and Chief Remote Pilot | Paladin-Bearer of Shadowmourne
REMUNERATION REPORT (AUDITED) (CONTINUED)
6. KEY CHANGES TO REMUNERATION FOR FY23
Consistent with prior years, the Board, in conjunction with its independent remuneration advisors, undertook a review of remuneration for Executive KMP during the year, benchmarking Fixed Annual Remuneration and Total Maximum Remuneration against a comparator group of Australian listed businesses of similar size and industry (the Comparator Group as detailed in Section 3.3).
This analysis found that the Managing Director’s Fixed Remuneration is now well below the Group’s policy of 50th percentile and the Total Maximum Remuneration is also well below the Group’s policy of 75th percentile. This reflects the fact that the Managing Director’s Fixed Remuneration has remained unchanged over the past three years, during which period the Company has grown significantly. Fixed Annual Remuneration for Executive KMP other than the Chief Financial Officer is now below the 50th percentile, and Total Maximum Remuneration for Executive KMP, at the 67th percentile, is likewise below policy.
In order to remain competitive in our remuneration offer to our most senior employees, and to align their remuneration more closely with the Company’s policy for these positions, in FY23 the Company will increase the Managing Director’s salary (base FAR) from $1.2M to $1.6M. There may be other changes to align the remaining Executive KMP with the Group’s policy but these are not expected to be substantial.
The STI Opportunity for the Managing Director will increase from 100 per cent of base FAR to 125 per cent. The STI Opportunity for other Executive KMP will be increased to 100 per cent of base FAR. These changes reflect the growth in the size of the Company and will more closely align their remuneration with the Company’s policy of total maximum remuneration being at the 75th percentile of similar roles in Comparator Businesses.
Finally, benchmarking by the Company’s remuneration advisors has indicated that the fees paid to the Board Chair are substantially below the 50th percentile. As a result, the fee paid to the Chair will increase from $290,000 to $380,000, effective 1 July 2022.
7. SUMMARY OF KMP EMPLOYMENT CONDITIONS
7.1 EXECUTIVES
The table below summarises the employment agreements in place with Executive KMP as at the date of this report.
KMP
Chris Ellison (Managing Director)
Paul Brown (Chief Executive - Lithium)
Michael Grey (Chief Executive – Mining Services)
Mark Wilson (Chief Financial Officer and Company Secretary)
Term of agreement Base FAR1 Base FAR1
FY23 FY22
Notice period: KMP and MinRes Termination entitlements2
Full time – permanent $1,600,000 $1,200,000 12 months
Full time – permanent $850,000 $850,000 12 months
Full time – permanent $850,000 $850,000 12 months
Notice period per contract
Notice period per contract
Notice period per contract
Full time – permanent $950,000 $950,000 12 months Notice period per contract
118 I MINERAL RESOURCES LIMITED 2022 ANNUAL REPORT
1 Base FAR comprises the executive’s salary and excludes superannuation and other fixed entitlements. 2 Should this amount be a value that requires shareholder approval then it can be reduced to maximum permissible amount without shareholder agreement.
REMUNERATION REPORT (AUDITED)
7.2 NON-EXECUTIVE DIRECTORS
A Non-Executive Director (NED) receives fees to recognise their contribution to the work of the Board and the additional time and effort associated with chairing and/or participating in Board sub-committees on which they serve.
NED remuneration is reviewed annually by the Remuneration Committee. The following table outlines the Non-Executive Director fees, exclusive of superannuation, effective as at the date of this report for the Board and associated Committees.
NED remuneration is not linked to Company performance, although in order to create alignment with shareholders, NED fees continue to be paid 50 per cent in cash and 50 per cent in Company shares. NEDs are encouraged to hold at least one year’s worth of fees in Company shares and NEDs are subject to the Company’s Security Trading Policy.
Board/Committee Fees (per annum)
Chair $ Member $
FY23 FY22 FY23 FY22
Board 380,000 290,000 170,000 170,000
Board - Lead Independent Director 25,000 25,000 20,000 20,000
Audit and Risk Committee 20,000 20,000 10,000 10,000
Remuneration Committee 20,000 20,000 10,000 10,000
Nominations Committee
Sustainability Committee 10,000 10,000 10,000 10,000
A resolution was passed at the 2020 AGM to approve an increase in the maximum pool to $2,000,000 to facilitate sufficient headroom in the pool to allow for the appointment of additional NEDs, an allocation of entitlements for participation in Board Sub-committees, and for an increase in NED fees should this be recommended by the Remuneration Committee. The fee pool was previously at $1,000,000 per annum, which had not been increased since the 2015 Financial Year. The changes in NED fees took effect from 1 January 2021.
MINERAL RESOURCES LIMITED 2022 ANNUAL REPORT I 119
(CONTINUED)
8. KMP STATUTORY REMUNERATION SCHEDULES
The following tables detail the statutory remuneration disclosures prepared in accordance with Australian Accounting Standards. These tables differ from the remuneration outcomes tables in section 5.5, due to the accounting treatment of share-based payments.
Short-Term Benefits
PostEmployment Benefits
Share-based payments
FY22
Cash salary and fees $ Other4 $ STI cash value2 $ NonMonetary $ Superannuation $ STI equity value $ LTI equity value $ NED remuneration3 $ Total $ Performance related %
Non-Executive Directors
Current:
James McClements 126,528 24,536 126,528 277,592
Susie Corlett 100,000 22,944 100,000 222,944
Kelvin Flynn 102,500 20,500 102,500 225,500 Xi Xi 117,000 97,500 214,500
Zimi Meka1 11,126 1,962 11,126 24,214
Former: Peter Wade5 97,069 21,025 97,069 215,163
Executive Director
Chris Ellison 1,200,000 600,000 31,002 23,568 170,012 1,621,316 3,645,898 66%
Other Executives
Paul Brown 850,000 80,000 340,000 23,568 81,462 650,628 2,025,658 53%
Michael Grey 834,750 80,000 340,000 23,568 81,462 765,633 2,125,413 56%
Mark Wilson 933,992 80,000 380,000 37,012 23,568 140,930 1,069,620 2,665,122 60%
Total 4,372,966 240,000 1,660,000 68,014 185,239 473,866 4,107,197 534,724 11,642,006
1 Zimi Meka commenced on 17 May 2022.
2 40 per cent of the FY21 STI plan on each Executive KMP base salary, is paid in cash (50 per cent for the Managing Director) and relates to the performance during FY21, paid in FY22.
3 Equity component of Non-Executive Directors’ (NED) remuneration. NED Remuneration is not linked to Company performance, however to create alignment with shareholders, Non-Executive Director fees continue to be paid 50 per cent in cash and 50 per cent in MinRes shares.
4 Paul Brown, Michael Grey and Mark Wilson each received $80,000 in Resource Development Group Ltd (RDG) share options during FY21 as remuneration for their RDG NED remuneration. RDG forms part of the Group.
5 Peter Wade retired as Non-Executive Chairman and from the Company’s Board on 2 March 2022.
120 I MINERAL RESOURCES LIMITED 2022 ANNUAL REPORT REMUNERATION REPORT (AUDITED) (CONTINUED)
REMUNERATION REPORT (AUDITED) (CONTINUED)
Short-Term Benefits
PostEmployment Benefits Share-based payments
FY21
Non-Executive Directors
Cash salary and fees $ Other4 $ STI cash value2 $ NonMonetary $ Superannuation $ STI equity value $ LTI equity value $ NED remuneration3 $ Total $ Performance related %
Peter Wade 135,000 21,694 135,000 291,694
Susie Corlett1 46,708 8,875 46,708 102,291
Kelvin Flynn 86,250 16,388 86,250 188,888
James McClements 87,500 16,625 87,500 191,625
Xi Xi 90,338 82,500 172,838
Executive Director
Chris Ellison 1,200,000 600,000 30,172 21,694 175,087 1,454,710 3,481,663 64%
Other Executives
Paul Brown 850,000 80,000 340,000 21,694 125,485 545,625 1,962,804 52%
Michael Grey 850,000 80,000 340,000 375 21,694 125,485 510,622 1,928,176 51%
Mark Wilson 950,000 80,000 380,000 41,754 21,694 140,226 713,366 2,327,040 53%
Total 4,295,796 240,000 1,660,000 72,301 150,358 566,283 3,224,323 437,958 10,647,019
1 Susie Corlett commenced on 4 January 2021.
2 40 per cent of the FY21 STI plan to KMP is paid in cash (50 per cent for the Managing Director) and relates to the performance during FY21.
3 Equity component of Non-Executive Directors’ (NED) remuneration. NED Remuneration is not linked to Company performance, however to create alignment with shareholders, Non-Executive Director fees continue to be paid 50 per cent in cash and 50 per cent in MRL shares.
4 Paul Brown, Michael Grey and Mark Wilson each received $80,000 in Resource Development Group Ltd (RDG) share options during FY21 as remuneration for their RDG NED remuneration. RDG forms part of the Group.
MINERAL RESOURCES LIMITED 2022 ANNUAL REPORT I 121
9. SHARE RIGHTS GRANTED, VESTED AND POTENTIAL FUTURE VESTING
No.
FY22
Chris Ellison
Date
Total value of
No. vested during the year Vested during the year
FY18 LTI3 15/08/2018 FY18 to FY21 168,157 14.97 2,517,310 56,052 33%
No. forfeited during the year % forfeited during the year %
Remaining, subject to vesting conditions
Rights to shares:
Year in which share rights may vest No. of share rights which may vest Maximum value yet to vest
FY19 LTI4 22/08/2019 FY19 to FY22 0% N/A
FY20 LTI5 FY20 DER6 01/07/2019 01/07/2019 FY20 to FY23 FY20 to FY23 142,577 18,251 15.05 33.73 2,145,784 615,550 0% 0% 142,577 18,251 FY24 FY24 142,577 18,251 2,145,784 615,550
FY20 STI7 01/07/2020 FY20 to FY22 25,267 21.17 534,902 12,634 50% -12,634 FY23 12,634 267,451
FY21 LTI8 FY21 DER6 01/07/2020 01/07/2020 FY21 to FY24 FY21 to FY24 102,950 9,034 21.17 41,42 2,179,452 374,529 0% 0% -102,950 9,043 FY25 FY25 102,950 9,043 2,179,452 374,529
FY21 STI9 01/07/2021 FY21 to FY23 7,875 53.36 420,210 0% 7,875 FY23 FY24 3,938 3,938 210,105 210,105
FY22 LTI11 FY22 DER6 01/07/2021 FY22 to FY25 FY22 to FY25 41,710 1,408 51.79 51.86 2,160,027 73,019 0% 0% 41,710 1,408 FY26 FY26 41,710 1,408 2,160,027 73,019
FY22 STI12 01/07/2022 FY22 to FY24 8,348 48.88 408,029 0% 8,348 FY24 FY25 4,174 4,174 204,014 204,014
Paul Brown FY20 LTI5 FY20 DER6 01/07/2019 01/07/2019 FY20 to FY23 FY20 to FY23 55,447 7,098 15.05 33.73 834,477 239,391 0% 0% 55,447 7,098 FY24 FY24 55,447 7,098 834,477 239,391
FY20 STI7 01/07/2020 FY20 to FY22 13,399 21.17 283,657 6,700 50% 6,700 FY23 6,700 141,828
FY21 LTI8 FY21 DER6 01/07/2020 01/07/2020 FY21 to FY24 FY21 to FY24 48,616 4,271 21.17 41.42 1,029,201 176,892 0% 0% 48,616 4,271 FY25 FY25 48,616 4,271 1,029,201 176,892
FY21 STI9 01/07/2021 FY21 to FY23 5,644 53.36 301,164 0% 5,644 FY23 FY24 2,822 2,822 150,582 150,582
FY22 LTI11 FY22 DER6 01/07/2021 FY22 to FY25 FY22 to FY25 19,697 665 51.79 51.86 1,020,045 34,487 0% 0% 19,697 665 FY26 FY26 19,697 665 1,020,045 34,487
FY22 STI12 01/07/2022 FY22 to FY24 4,000 48.88 195,510 0% 4,000 FY24 FY25 2,000 2,000 97,755 97,755
Michael Grey FY19 LTI4 22/08/2019 FY19 to FY22 0% N/A
FY20 LTI5
FY20 DER6 01/07/2019 01/07/2019 FY20 to FY23 FY20 to FY23 67,328 8,619 15.05 33.73 1,013,286 290,684 0% 0% 67,328 8,619 FY24 FY24 67,328 8,619 1,013,286 290,684
FY20 STI7 01/07/2020 FY20 to FY22 16,270 21.17 344,436 8,135 50% - 8,135 FY23 8,135 172,218
FY21 LTI8 FY21 DER6 01/07/2020 01/07/2020 FY21 to FY24 FY21 to FY24 48,616 4,271 21.17 41.42 1,029,201 176,892 0% 0%48,616 4,271 FY25 FY25 48,616 4,271 1,029,201 176,892
FY21 STI9 01/07/2021 FY21 to FY23 5,644 53.36 301,164 0% - 5,644 FY23 FY24 2,822 2,822 150,582 150,582
FY22 LTI11 FY22 DER6 01/07/2021 FY22 to FY25 FY22 to FY25 19,697 665 51.79 51.86 1,020,045 34,487 0% 0%19,697 665 FY26 FY26 19,697 665 1,020,045 34,487
FY22 STI12 01/07/2022 FY22 to FY24 4,000 48.88 195,510 0%4,000 FY24 FY25 2,000 2,000 97,755 97,755
122 I MINERAL RESOURCES LIMITED 2022 ANNUAL REPORT REMUNERATION REPORT (AUDITED) (CONTINUED)
Plan Grant
1 Performance Periods
of share rights granted Value per share right granted at grant 10 $/right
share rights granted at grant date $
%
$
REMUNERATION REPORT (AUDITED) (CONTINUED)
FY22 Plan
Mark Wilson
Grant Date 1 Performance Periods
FY19 LTI4 22/08/2019 FY19 to FY22
No. of share rights granted
Value per share right granted at grant
$/right
Total value of share rights granted at grant date $ No. vested during the year Vested during the year % No. forfeited during the year
0%
Per cent forfeited during the year %
Remaining, subject to vesting conditions
Rights to shares:
Year in which share rights may vest No. of share rights which may vest Maximum value yet to vest $
N/A
FY20 LTI5 FY20 DER6 01/07/2019 01/07/2019 FY20 to FY23 FY20 to FY23 94,061 12,041 15.05 33.73 1,415,618 406,100 0% 0% 94,061 12,041 FY24 FY24 94,061 12,041 1,415,618 406,100
FY20 STI7 01/07/2020 FY20 to FY22 18,184 21.17 384,955 9,092 50% 9,092 FY23 9,092 192,478
FY21 LTI8 FY21 DER6 01/07/2020 01/07/2020 FY21 to FY24 FY21 to FY24 67,919 5,966 21.17 41.42 1,437,845 247,093 0% 0% 67,919 5,966 FY25 FY25 67,919 5,966 1,437,845 247,093
FY21 STI6 01/07/2021 FY21 to FY23 6,307 53.36 336,542 0% 6,307 FY23 FY24 3,154 3,154 168,271 168,271
FY22 LTI11 FY21 DER 01/07/2021 FY22 to FY25 FY22 to FY25 27,517 929 51.79 51.86 1,425,017 48,178 0% 0% 27,517 929 FY26 FY26 27,517 929 1,425,017 48,178
FY22 STI12 01/07/2022 FY22 to FY24 6,920 48.88 338,232 0% 6,920 FY24 FY25 3,460 3,460 169,116 169,116
1 Grant date is determined in accordance with AASB 2 Share Based Payments.
3 FY18 was the Award Year for the LTI Plan (ROIC for FY18 exceeded 12 per cent). Each tranche of the FY18 LTI Plan vests in favour of participants provided participants remain employed with the Company over each of the subsequent Performance Years (FY19 to FY21) and ROIC for each subsequent Performance Years (FY19 to FY21) equals or exceeds 12 per cent. As ROIC for FY19 was less than 12 per cent, Tranche 1 of the FY18 LTI Plan became a Suspended Tranche. As average ROIC for FY19 and FY20 exceeded 12 per cent Tranche 1 and Tranche 2 of the FY18 LTI Plan vested on 20 August 2020, subject to trading restrictions.
4 FY19 was the Award Year for the FY19 LTI Plan. As ROIC for FY19 is less than 12 per cent there is no LTI award for FY19.
5 FY20 was the Award Year for the FY20 LTI Plan.
6 Dividend equivalent rights that attach to the FY20, FY21 and FY22 LTIP grants. These rights have an automatic vesting/exercise upon exercise of the underlying LTIP share right and can be satisfied in cash or shares at the Board’s discretion.
7 FY20 was the Award Year for the FY20 STI Plan. The number of share rights granted was calculated using the value of the award divided by the VWAP for the five days up to and including 30 June 2020. The value reflected in the table above is the quantity of shares calculated via this method, multiplied by the share price on the 1 July 2020 as required by Australian Accounting Standards. The share rights vest equally in August 2021 (FY22) and August 2022 (FY23).
8 FY21 was the Award Year for the FY21 LTI Plan. The number of share rights granted was calculated using the value of the award divided by the share price on 1 July 2020. The value reflected in the table above is the quantity of shares calculated via this method, multiplied by the share price on the 1 July 2020.
9 FY21 was the Award Year for the FY21 STI Plan. The number of share rights granted was calculated using the value of the award divided by the VWAP for the five days up to and including 30 June 2021. The value reflected in the table above is the quantity of shares calculated via this method, multiplied by the share price on the 1 July 2021 as required by Australian Accounting Standards. The share rights vest equally in August 2022 (FY23) and August 2023 (FY24).
10 Value per share right granted at grant refers to share price used for expense purposes under AASB 2 Share Based Payments, being the date when the entity and the counterparty has a mutual understanding to the terms and conditions of the arrangement. For the LTI and STI plans this is the first day of the financial year.
11 FY22 was the Award Year for the FY22 LTI Plan. The number of share rights granted was calculated using the value of the award divided by the share price on 1 July 2021. The value reflected in the table above is the quantity of shares calculated via this method, multiplied by the share price on the 1 July 2021.
12 FY22 was the Award Year for the FY22 STI Plan. The number of share rights granted was calculated using the value of the award divided by the VWAP for the five days up to and including 30 June 2022. The value reflected in the table above is the quantity of shares calculated via this method, multiplied by the share price on the 1 July 2022 as required by Australian Accounting Standards. The share rights vest equally in August 2023 (FY24) and August 2024 (FY25).
MINERAL RESOURCES LIMITED 2022 ANNUAL REPORT I 123
9. SHARE RIGHTS GRANTED, VESTED AND POTENTIAL FUTURE VESTING (CONTINUED)
Total value
No.
FY21
Chris Ellison
No. vested during the year Vested during the year
FY17 LTI2 16/08/2017 FY17 to FY20 269,730 13.96 3,765,431 89,910 33%
No. forfeited during the year
Rights to shares:
Per cent forfeited during the year
Remaining, subject to vesting conditions
Year in which share rights may vest No. of share rights which may
value yet to vest
FY18 LTI3 15/08/2018 FY18 to FY21 168,157 14.97 2,517,310 112,105 67% 56,052 FY22 56,052 839,103
FY19 LTI4 22/08/2019 FY19 to FY22 0% N/A
FY20 LTI5
FY20 DER6 01/07/2019 01/07/2019 FY20 to FY23 FY20 to FY23 142,577 13,001 15.05 26.40 2,145,784 343,285 0% 0% 142,577 13,001 FY24 FY24 142,577 13,001 2,145,784 343,285
FY20 STI7 01/07/2020 FY20 to FY22 25,267 21.17 534,902 0% - - 25,267 FY22 FY23 12,634 12,634 267,451 267,451
FY21 LTI8 FY21 DER6 01/07/2020 01/07/2020 FY21 to FY24 FY21 to FY24 102,950 5,387 21.17 34.33 2,179,452 184,929 0% 0% -102,950 5,387 FY25 FY25 102,950 5,387 2,179,452 184,929
FY21 STI9 01/07/2021 FY21 to FY23 7,875 53.36 420,210 0% 7,875 FY23 FY24 3,938 3,938 210,105 210,105
Paul Brown FY20 LTI5 FY20 DER6 01/07/2019 01/07/2019 FY20 to FY23 FY20 to FY23 55,447 5,056 15.05 26.40 834,477 133,493 0% 0% 55,447 5,056 FY24 FY24 55,447 5,056 834,477 133,493
FY20 STI7 01/07/2020 FY20 to FY22 13,399 21.17 283,657 0% 13,399 FY22 FY23 6,700 6,700 141,828 141,828
FY21 LTI8 FY21 DER6 01/07/2020 01/07/2020 FY21 to FY24 FY21 to FY24 48,616 2,544 21.17 34.33 1,029,201 87,330 0% 0% 48,616 2,544 FY25 FY25 48,616 2,544 1,029,201 87,330
FY21 STI9 01/07/2021 FY21 to FY23 5,644 53.36 301,164 0% 5,644 FY23 FY24 2,822 2,822 150,582 150,582
Michael Grey FY19 LTI4 22/08/2019 FY19 to FY22 0% N/A
FY20 LT15
FY20 DER6 01/07/2019 01/07/2019 FY20 to FY23 FY20 to FY23 67,328 6,140 15.05 26.40 1,013,286 162,123 0% 0% 67,328 6,140 FY24 FY24 67,328 6,140 1,013,286 162,123
FY20 STI7 01/07/2020 FY20 to FY22 16,270 21.17 344,436 0% - 16,270 FY22 FY23 8,135 8,135 172,218 172,218
FY21 LTI8 FY21 DER6 01/07/2020 01/07/2020 FY21 to FY24 FY21 to FY24 48,616 2,544 21.17 34.33 1,029,201 87,330 0% 0%48,616 2,544 FY25 FY25 48,616 2,544 1,029,201 87,330
FY21 STI9 01/07/2021 FY21 to FY23 5,644 53.36 301,164 0% - 5,644 FY23 FY24 2,822 2,822 150,582 150,582
1 Grant date is determined in accordance with AASB 2 Share Based Payments.
2 FY17 was the Award Year for the LTI Plan (ROIC exceeded 12 per cent). Each tranche of the FY17 LTI Plan vests in favour of participants provided participants remain employed with the Company over each of the subsequent Performance Years (FY18 to FY20) and ROIC for each subsequent Performance Years (FY18 to FY20) equals or exceeds 12 per cent. As the average ROIC for FY18 and FY19 exceeded 12 per cent, Tranche 2 of the FY17 LTI Plan vested in favour of participants who remained employed for all of FY20, and as FY20’s ROIC exceeded 12 per cent Tranche 3 of the FY17 LTI Plan vested on 20 August 2020. Trading restrictions on all three FY17 LTI Plan Tranches were lifted as at that date, subject to clawback provisions.
3 FY18 was the Award Year for the LTI Plan (ROIC for FY18 exceeded 12 per cent). Each tranche of the FY18 LTI Plan vests in favour of participants provided participants remain employed with the Company over each of the subsequent Performance Years (FY19 to FY21) and ROIC for each subsequent Performance Years (FY19 to FY21) equals or exceeds 12 per cent. As ROIC for FY19 was less than 12 per cent, Tranche 1 of the FY18 LTI Plan became a Suspended Tranche. As average ROIC for FY19 and FY20 exceeded 12 per cent Tranche 1 and Tranche 2 of the FY18 LTI Plan vested on 20 August 2020, subject to trading restrictions.
4 FY19 was the Award Year for the FY19 LTI Plan. As ROIC for FY19 is less than 12 per cent there is no LTI award for FY19.
5 FY20 was the Award Year for the FY20 LTI Plan.
6 Dividend equivalent rights that attach to the FY20 and FY21 LTIP grants. These rights have an automatic vesting/exercise upon exercise of the underlying LTIP share right.
7 FY20 was the Award Year for the FY20 STI Plan. The number of share rights granted was calculated using the value of the award divided by the VWAP for the five days up to and including 30 June 2020. The value reflected in the table above is the quantity of shares calculated via this method, multiplied by the share price on the 1 July 2020 as required by Australian Accounting Standards.
The share rights vest equally in August 2021 (FY22) and August 2022 (FY23).
8 FY21 was the Award Year for the FY21 LTI Plan. The number of share rights granted was calculated using the value of the award divided by the share price on 1 July 2020. The value reflected in the table above is the quantity of shares calculated via this method, multiplied by the share price on the 1 July 2020.
9 FY21 was the Award Year for the FY21 STI Plan. The number of share rights granted was calculated using the value of the award divided by the VWAP for the five days up to and including 30 June 2021. The value reflected in the table above is the quantity of shares calculated via this method, multiplied by the share price on the 1 July 2021 as required by Australian Accounting Standards. The share rights vest equally in August 2022 (FY23) and August 2023 (FY24).
10 Value per share right granted at grant refers to share price used for expense purposes under AASB 2 Share Based Payments, being the date when the entity and the counterparty has a mutual understanding to the terms and conditions of the arrangement. For the LTI and STI plans this is the first day of the financial year.
124 I MINERAL RESOURCES LIMITED 2022 ANNUAL REPORT REMUNERATION REPORT (AUDITED) (CONTINUED)
Plan Grant Date 1 Performance Periods
of share rights granted Value per share right granted at grant 10 $/right
of share rights granted at grant date $
%
%
vest Maximum
$
REMUNERATION REPORT (AUDITED) (CONTINUED)
FY21 Plan
Mark Wilson
Grant Date 1 Performance Periods
FY19 LTI4 22/08/2019 FY19 to FY22
No. of share rights granted
Value per share right granted at grant
$/right
Total value of share rights granted at grant date $ No. vested during the year Vested during the year %
0%
No. forfeited during the year
% forfeited during the year %
Remaining, subject to vesting conditions
Rights to shares:
Year in which share rights may vest No. of share rights which may vest Maximum value yet to vest $
N/A
FY20 LTI5 FY20 DER6 01/07/2019 01/07/2019 FY20 to FY23 FY20 to FY23 94,061 8,577 15.05 26.40 1,415,618 226,457 0% 0% 94,061 8,577 FY24 FY24 94,061 8,577 1,415,618 226,457
FY20 STI7 01/07/2020 FY20 to FY22 18,184 21.17 384,955 0% 18,184 FY22 FY23 9,092 9,092 192,478 192,478
FY21 LTI8 FY21 DER6 01/07/2020 01/07/2020 FY21 to FY24 FY21 to FY24 67,919 3,554 21.17 34.33 1,437,845 122,007 0% 0% 67,919 3,554 FY25 FY25 67,919 3,554 1,437,845 122,007
FY21 STI6 01/07/2021 FY21 to FY23 6,307 53.36 336,542 0% 6,307 FY23 FY24 3,154 3,154 168,271 168,271
1 Grant date is determined in accordance with AASB 2 Share Based Payments.
2 FY17 was the Award Year for the LTI Plan (ROIC exceeded 12 per cent). Each tranche of the FY17 LTI Plan vests in favour of participants provided participants remain employed with the Company over each of the subsequent Performance Years (FY18 to FY20) and ROIC for each subsequent Performance Years (FY18 to FY20) equals or exceeds 12 per cent. As the average ROIC for FY18 and FY19 exceeded 12 per cent, Tranche 2 of the FY17 LTI Plan vested in favour of participants who remained employed for all of FY20, and as FY20’s ROIC exceeded 12 per cent Tranche 3 of the FY17 LTI Plan vested on 20 August 2020. Trading restrictions on all three FY17 LTI Plan Tranches were lifted as at that date, subject to clawback provisions.
3 FY18 was the Award Year for the LTI Plan (ROIC for FY18 exceeded 12 per cent). Each tranche of the FY18 LTI Plan vests in favour of participants provided participants remain employed with the Company over each of the subsequent Performance Years (FY19 to FY21) and ROIC for each subsequent Performance Years (FY19 to FY21) equals or exceeds 12 per cent. As ROIC for FY19 was less than 12 per cent, Tranche 1 of the FY18 LTI Plan became a Suspended Tranche. As average ROIC for FY19 and FY20 exceeded 12 per cent Tranche 1 and Tranche 2 of the FY18 LTI Plan vested on 20 August 2020, subject to trading restrictions.
4 FY19 was the Award Year for the FY19 LTI Plan. As ROIC for FY19 is less than 12 per cent there is no LTI award for FY19.
5 FY20 was the Award Year for the FY20 LTI Plan.
6 Dividend equivalent rights that attach to the FY20 and FY21 LTIP grants. These rights have an automatic vesting/exercise upon exercise of the underlying LTIP share right.
7 FY20 was the Award Year for the FY20 STI Plan. The number of share rights granted was calculated using the value of the award divided by the VWAP for the five days up to and including 30 June 2020. The value reflected in the table above is the quantity of shares calculated via this method, multiplied by the share price on the 1 July 2020 as required by Australian Accounting Standards. The share rights vest equally in August 2021 (FY22) and August 2022 (FY23).
8 FY21 was the Award Year for the FY21 LTI Plan. The number of share rights granted was calculated using the value of the award divided by the share price on 1 July 2020. The value reflected in the table above is the quantity of shares calculated via this method, multiplied by the share price on the 1 July 2020.
9 FY21 was the Award Year for the FY21 STI Plan. The number of share rights granted was calculated using the value of the award divided by the VWAP for the five days up to and including 30 June 2021. The value reflected in the table above is the quantity of shares calculated via this method, multiplied by the share price on the 1 July 2021 as required by Australian Accounting Standards.
The share rights vest equally in August 2022 (FY23) and August 2023 (FY24).
10 Value per share right granted at grant refers to share price used for expense purposes under AASB 2 Share Based Payments, being the date when the entity and the counterparty has a mutual understanding to the terms and conditions of the arrangement. For the LTI and STI plans this is the first day of the financial year.
MINERAL RESOURCES LIMITED 2022 ANNUAL REPORT I 125
10. EQUITY INSTRUMENTS HELD BY KMP
10.1 RIGHTS AWARDED UNDER INCENTIVE PLANS
The following table details share rights awarded under incentive plans that are subject to service conditions and performance hurdles that are yet to be tested and vested rights that have not yet been exercised and converted into shares. Non-Executive Directors do not participate in incentive plans and do not hold unvested share rights.
Number of rights
Executive Director
Balance at the start of the year Granted Exercised and converted to shares
Notional dividends attaching in year1
Balance at the end of the year Balance vested and exercisable
Chris Ellison 353,109 50,058 (68,686) 10,314 344,795
Other KMP
Paul Brown
140,235 23,697 (16,229) 4,434 152,137
Michael Grey 146,542 23,697 (8,135) 4,871 166,975
Mark Wilson 198,602 34,437 (9,092) 6,805 230,752
Total 838,488 131,889 (102,142) 26,424 894,659
1 Dividend equivalent rights that attach to the FY20, FY21 and FY22 LTIP grants. These rights have an automatic vesting / exercise upon exercise of the underlying LTIP share right.
10.2 KMP SHAREHOLDINGS
The number of MinRes shares held during FY22 by each Director and Other Executive of the Company, including their related parties, is set out below:
Number of shares
Non-Executive Directors1
Balance at the start of the year Issued as part of remuneration Other Additions2 Disposals/ Other4
Balance at the end of the year
Current: James McClements 18,383 2,489 20,872
Susie Corlett 1,071 2,009 3,080 Kelvin Flynn 18,354 2,060 20,414 Xi Xi 16,887 1,952 18,839 Zimi Meka3 215 215
Former: Peter Wade4 348,498 1,994 (350,492)
Executive Director
Chris Ellison 22,425,745 68,686 28,022 22,522,453
126 I MINERAL RESOURCES LIMITED 2022 ANNUAL REPORT REMUNERATION REPORT (AUDITED) (CONTINUED)
REMUNERATION REPORT (AUDITED) (CONTINUED)
1
Number of shares
Executive KMP
Current
Balance at the start of the year
Issued as part of remuneration Other Additions2 Disposals/ Other4
Balance at the end of the year
Paul Brown 19,058 37,807 56,865
Michael Grey 8,135 8,135
Mark Wilson 26,422 9,092 6,117 41,631
Total 22,874,418 134,439 34,139 (350,492) 22,692,504
Shares paid to Non-Executive Directors disclosed in this table were part of their FY22 remuneration package. Shares for their FY21 remuneration package were issued in the current financial year. The quantity of shares granted is based on the proportion of fees payable divided by the Volume Weighted Average price for the five trading days to the end of each quarter of the financial year.
2 Other additions include shares received as part of the Company’s Dividend Re-investment Program.
3 Zimi Meka commenced on 17 May 2022.
4 Peter Wade retired as Non-Executive Chairman and from the Company’s Board on 2 March 2022.
11. TRANSACTIONS WITH RELATED PARTIES
The following transactions occurred with related parties:
Key Management Personnel / Directors’ interests: 2022 $ 2021 $
Properties from which some of the Group’s operations are performed are rented from parties related to Chris Ellison and Peter Wade1 (2,307,826) (2,215,091)
1Occupation of these premises dates back prior to the Company’s listing in 2006. The ongoing need for occupation of these premises, as well as rental arrangements, are assessed periodically. The Group has a Related Party Transaction Policy that requires the review and approval of Related Party Transactions by the Audit and Risk Committee (the Committee).
A number of Directors of the Company hold or have held positions in other companies (personally related entities) where it is considered they control or significantly influence the financial or operating policies of those entities. Other than the transactions shown above, there were no reportable transactions with those entities for the period ending 30 June 2022 (30 June 2021: Nil). This concludes the Remuneration Report, which has been audited.
MINERAL RESOURCES LIMITED 2022 ANNUAL REPORT I 127
DIRECTOR’S REPORT INDEMNITY AND INSURANCE OF OFFICERS
The Company has indemnified the Directors and Executives of the Company for costs incurred, in their capacity as a Director or Executive, for which they may be held personally liable, except where there is a lack of good faith.
During the financial year, the Company paid a premium in respect of a contract to insure the Directors and Executives of the Company against a liability to the extent permitted by the Corporations Act 2001. The contract of insurance prohibits disclosure of the nature of the liability and the amount of the premium.
INDEMNITY AND INSURANCE OF AUDITOR
The Company has not, during or since the financial year, indemnified or agreed to indemnify the auditor of the Company or any related entity against a liability incurred by the auditor.
During the financial year, the Company has not paid a premium in respect of a contract to insure the auditor of the Company or any related entity.
PROCEEDINGS ON BEHALF OF THE COMPANY
No person has applied to the Court under section 237 of the Corporations Act 2001 for leave to bring proceedings on behalf of the Company, or to intervene in any proceedings to which the Company is a party for the purpose of taking responsibility on behalf of the Company for all or part of those proceedings.
NON-AUDIT SERVICES
Details of the amounts paid or payable to the auditor for non-audit services provided during the financial year by the auditor are outlined in note 35 to the financial statements.
The Directors are satisfied that the provision of non-audit services during the financial year, by the auditor (or by another person or firm on the auditor’s behalf) is compatible with the general standard of independence for auditors imposed by the Corporations Act 2001
The Directors are of the opinion that the services as disclosed in note 35 to the financial statements do not compromise the external auditor’s independence requirements of the Corporations Act 2001 for the following reasons:
• All non-audit services have been reviewed and approved to ensure that they do not impact the integrity and objectivity of the auditor; and
• None of the services undermine the general principles relating to auditor independence as set out in APES 110 Code of Ethics for Professional Accountants issued by the Accounting Professional and Ethical Standards Board including reviewing or auditing the auditor’s own work acting in a management or decision-making capacity for the Company acting as advocate for the Company or jointly sharing economic risks and rewards.
COMPANY OFFICERS WHO ARE FORMER PARTNERS OF RSM AUSTRALIA PARTNERS
There are no officers of the Company who are former partners of RSM Australia Partners.
ROUNDING OF AMOUNTS
The Company is of a kind referred to in Corporations Instrument 2016/191, issued by the Australian Securities and Investments Commission, relating to ‘rounding-off’. Amounts in this report have been rounded off in accordance with that Corporations Instrument to the nearest million dollars, unless otherwise stated.
AUDITOR’S INDEPENDENCE DECLARATION
A copy of the auditor’s independence declaration as required under section 307C of the Corporations Act 2001 is set out immediately after this Directors’ Report.
AUDITOR
RSM Australia Partners continues in office in accordance with section 327 of the Corporations Act 2001
This report is made in accordance with a resolution of Directors, pursuant to section 298(2)(a) of the Corporations Act 2001
On behalf of the Directors.
Chris Ellison Managing Director
29 August 2022 Perth
128 I MINERAL RESOURCES LIMITED 2022 ANNUAL REPORT
AUDITOR’S INDEPENDENCE DECLARATION
AUDITOR’S INDEPENDENCE DECLARATION
RSM Australia Partners
Level 32, Exchange Tower
2 The Esplanade Perth WA 6000 GPO Box R1253 Perth WA 6844
T +61 (0) 8 9261 9100
F +61 (0) 8 9261 9111
RSM Australia Partners
As lead auditor for the audit of the financial report of Mineral Resources Limited for the year ended 30 June 2022, I declare that, to the best of my knowledge and belief, there have been no contraventions of:
RSM Australia Partners
Level 32, Exchange Tower
(i) the auditor independence requirements of the Corporations Act 2001 in relation to the audit; and
(ii) any applicable code of professional conduct in relation to the audit.
Level 32, Exchange Tower
2 The Esplanade Perth WA 6000 GPO Box R1253 Perth WA 6844
2 The Esplanade Perth WA 6000 GPO Box R1253 Perth WA 6844
T +61 (0) 8 9261 9100
F +61 (0) 8 9261 9111 www.rsm.com.au
T +61 (0) 8 9261 9100
F +61 (0) 8 9261 9111 www.rsm.com.au
AUDITOR’S INDEPENDENCE DECLARATION
RSM AUSTRALIA PARTNERS
INDEPENDENT AUDITOR’S REPORT TO THE MEMBERS OF MINERAL RESOURCES LIMITED
AUDITOR’S INDEPENDENCE DECLARATION
As lead auditor for the audit of the financial report of Mineral Resources Limited for the year ended 30 June 2022, I declare that, to the best of my knowledge and belief, there have been no contraventions of:
As lead auditor for the audit of the financial report of Mineral Resources Limited for the year ended 30 June 2022, I declare that, to the best of my knowledge and belief, there have been no contraventions of:
(i) the auditor independence requirements of the Corporations Act 2001 in relation to the audit; and (ii) any applicable code of professional conduct in relation to the audit.
Opinion
Perth, WA TUTU PHONG Dated: 29 August 2022 Partner
(i) the auditor independence requirements of the Corporations Act 2001 in relation to the audit; and
(ii) any applicable code of professional conduct in relation to the audit.
We have audited the financial report of Mineral Resources Limited (the Company) and its subsidiaries (the Group), which comprises the consolidated balance sheet as at 30 June 2021, the consolidated income statement, the consolidated statement of changes in equity and the consolidated statement of cash flows for the year then ended, and notes to the financial statements, including a summary of significant accounting policies, and the directors' declaration.
In our opinion, the accompanying financial report of the Group is in accordance with the Corporations Act 2001, including:
RSM AUSTRALIA PARTNERS
(i) giving a true and fair view of the Group's financial position as at 30 June 2021 and of its financial performance for the year then ended; and
(ii) complying with Australian Standards and the Corporations Regulations 2001.
Perth, WA Dated: 29 August 2022
Basis for Opinion
Perth, WA TUTU PHONG Dated: 29 August 2022 Partner

We conducted our audit in accordance with Australian Auditing Standards. Our responsibilities under those standards are further described in the Auditor's Responsibilities for the Audit of the Financial Report section of our report. We are independent of the Group in accordance with the auditor independence requirements of the Corporations Act 2001 and the ethical requirements of the Accounting Professional and Ethical Standards Board's APES 110 Code of Ethics for Professional Accountants (the Code) that are relevant to our audit of the financial report in Australia. We have also fulfilled our other ethical responsibilities in accordance with the Code.
We confirm that the independence declaration required by the Corporations Act 2001, which has been given to the directors of the Company, would be in the same terms if given to the directors as at the time of this auditor's report.
THE POWER OF BEIN G UNDERSTOOD AUDIT | TAX | CONSULTING
RSM
RSM

We believe that the audit evidence we have obtained is sufficient and appropriate to provide a basis for our opinion.
Liability limited by a scheme approved under Professional Standards Legislation
THE POWER OF BEIN G UNDERSTOOD AUDIT | TAX | CONSULTING
MINERAL RESOURCES LIMITED 2022 ANNUAL REPORT I 129
A ustr alia Partners is a member of the RSM network and trades as RSM. RSM is the trading name used by the members of the RSM network. Each member of the RSM network is an independent accounting and consulting firm which practices in its own right. The RSM network is not itself a separate legal entity in any jurisdiction.
Australia P artners ABN 36 965 185 036
THE POWER OF BEING UNDERSTOOD AUDIT | TAX | CONSULTING RSM Australia Partners is a member of the RSM network and trades as RSM. RSM is the trading name used by the members of the RSM network. Each member of the RSM network is an independent
 Michael Holland | Compliance Trainer | Generational Upholsterer
FINANCIAL STATEMENTS
MINERAL RESOURCES LIMITED 2022 ANNUAL REPORT I 131
FINANCIAL STATEMENTS
CONSOLIDATED INCOME STATEMENT FOR THE YEAR ENDED 30 JUNE 2022
Group
Note 2022 $M 2021 $M
Revenue 4 3,418.0 3,733.6
Other income 5 110.3 245.3
Expenses from operations
Changes in closing stock 214.8 118.9
Raw materials and consumables (299.6) (344.4)
Equipment costs (201.7) (191.2)
Subcontractors (234.0) (188.5)
Employee benefits expense (655.3) (504.1)
Transport and freight (995.0) (597.6)
Depreciation and amortisation 6 (352.2) (258.0)
Impairment charges 6 (15.0) (46.5)
Other expenses 6 (388.5) (89.0)
Profit from operations 601.8 1,878.5
Finance income 10.7 10.0
Finance costs 6 (123.4) (95.8)
Net finance costs (112.7) (85.8)
Profit before tax 489.1 1,792.7
Income tax expense 7 (138.3) (525.0)
Profit after tax for the year 350.8 1,267.7
Other comprehensive income
Items that may be reclassified subsequently to profit or loss
Net gain on cash flow hedges 4.4 4.0
Other comprehensive income for the year, net of tax 4.4 4.0
Total comprehensive income for the year 355.2 1,271.7
Profit for the year is attributable to:
Non-controlling interest 1.6 (2.0)
Owners of Mineral Resources Limited 349.2 1,269.7 350.8 1,267.7
Total comprehensive income for the year is attributable to:
Non-controlling interest 1.6 (2.0)
Owners of Mineral Resources Limited 353.6 1,273.7 355.2 1,271.7
Cents Cents
Basic earnings per share 8 184.87 673.18
Diluted earnings per share 8 184.87 673.18
The above consolidated income statement should be read in conjunction with the accompanying notes.
MINERAL RESOURCES LIMITED 2022 ANNUAL REPORT I 133
FINANCIAL STATEMENTS
CONSOLIDATED BALANCE SHEET AS AT 30 JUNE 2022
Group
Note 2022 $M 2021 $M
Assets
Current assets
Cash and cash equivalents 9 2,428.2 1,542.1
Trade and other receivables 10 626.6 331.3
Inventories 11 252.6 122.6
Current tax assets 0.5
Other assets 12 62.3 37.3
Total current assets 3,370.2 2,033.3
Non-current assets
Trade and other receivables 10 654.5 653.4
Inventories 11 - 62.4
Investments accounted for using the equity method 29 102.7 92.1
Financial assets 13 58.0 296.1
Property, plant and equipment 14 2,162.7 1,824.6
Intangibles 15 24.9 36.7
Exploration and mine development 16 1,438.1 725.8
Total non-current assets 4,440.9 3,691.1
Total assets 7,811.1 5,724.4
Liabilities
Current liabilities
Trade and other payables 18 635.7 581.8
Borrowings 19 129.2 157.3
Income tax 11.2 166.7
Employee benefits 20 82.0 69.4
Provisions 21 55.5 9.2
Total current liabilities 913.6 984.4
Non-current liabilities
Trade and other payables 18 197.9
Borrowings 19 2,996.5 1,104.6
Deferred tax1 7 220.8 194.2
Provisions 21 211.2 195.1
Total non-current liabilities 3,626.4 1,493.9
Total liabilities 4,540.0 2,478.3
Net assets 3,271.1 3,246.1
Equity
Issued capital 22 504.5 514.5
Reserves 28.9 15.7
Retained profits 2,693.5 2,673.3
Equity attributable to the owners of Mineral Resources Limited 3,226.9 3,203.5
Non-controlling interest 44.2 42.6
Total equity 3,271.1 3,246.1
1 For comparability with current year presentation, the FY21 deferred tax asset has been offset with the FY21 deferred tax liability.
The above consolidated balance sheet should be read in conjunction with the accompanying notes.
134 I MINERAL RESOURCES LIMITED 2022 ANNUAL REPORT
(CONTINUED)
FINANCIAL STATEMENTS (CONTINUED)
CONSOLIDATED STATEMENT OF CHANGES IN EQUITY FOR THE YEAR ENDED 30 JUNE 2022
Issued capital Reserves Retained profits Noncontrolling interest Total equity
Group $M $M $M $M $M
Balance at 1 July 2020 516.3 10.1 1,738.4 30.8 2,295.6
Profit/(loss) after tax for the year 1,269.7 (2.0) 1,267.7
Other comprehensive loss for the year, net of tax 4.0 4.0
Total comprehensive income for the year 4.0 1,269.7 (2.0) 1,271.7
Transactions with owners in their capacity as owners:
Shares issued under Dividend Reinvestment Plan (note 22) 9.2 9.2
Equity settled share-based payments 10.3 10.3
Purchase of shares under employee share plans (note 22) (20.2) (20.2)
Employee share awards issued (note 22) 9.2 (8.7) 0.5
Acquisition of subsidiary 12.0 12.0
Acquisition of non-controlling interest (1.0) 1.8 0.8
Dividends paid (note 23) (333.8) (333.8)
Balance at 30 June 2021 514.5 15.7 2,673.3 42.6 3,246.1
Issued capital Reserves Retained profits Noncontrolling interest Total equity
Group $M $M $M $M $M
Balance at 1 July 2021 514.5 15.7 2,673.3 42.6 3,246.1
Profit after tax for the year 349.2 1.6 350.8
Other comprehensive income for the year, net of tax 4.4 4.4
Total comprehensive income for the year 4.4 349.2 1.6 355.2
Transactions with owners in their capacity as owners:
Shares issued under Dividend Reinvestment Plan (note 22) 5.9 5.9
Equity settled share-based payments 12.3 12.3
Purchase of shares under employee share plans (note 22) (19.4) (19.4)
Employee share awards issued (note 22) 3.5 (3.5)
Dividends paid (note 23) (329.0) (329.0)
Balance at 30 June 2022 504.5 28.9 2,693.5 44.2 3,271.1
The above consolidated statement of changes in equity should be read in conjunction with the accompanying notes.
MINERAL RESOURCES LIMITED 2022 ANNUAL REPORT I 135
FINANCIAL STATEMENTS (CONTINUED)
CONSOLIDATED STATEMENT OF CASH FLOWS FOR THE YEAR ENDED 30 JUNE 2022
Group Note 2022 $M 2021 $M
Cash flows from operating activities
Receipts from customers 3,284.6 3,689.7
Payments to suppliers and employees (2,665.2) (1,719.6) 619.4 1,970.1
Interest received 10.7 10.0
Interest and other finance costs paid (82.5) (86.4)
Income taxes paid (267.8) (584.3)
Net cash from operating activities 9 279.8 1,309.4
Cash flows from investing activities
Payments for investments (36.4) (50.1)
Proceeds from disposal of investments 326.2 9.5
Payments for property, plant and equipment (456.8) (517.2)
Proceeds from disposal of property, plant and equipment 39.3 11.5
Payments for intangibles (5.5) (16.4)
Payments for exploration and evaluation (265.8) (51.4)
Payments for mine development expenditure (271.8) (174.7)
Amounts advanced to/(from) joint operations 12.5 (17.2)
Amounts advanced to other parties 4.0 (10.0)
Net cash (used in)/from investing activities (654.3) (816.0)
Cash flows from financing activities
Dividends paid (324.3) (324.6)
Proceeds from borrowings 1,754.9 31.9
Repayment of borrowings (28.5) (12.8)
Payment of finance lease liabilities (150.0) (109.8)
Purchase of shares under employee share plans (19.5) (20.2)
Net cash provided by/(used in) financing activities 1,232.6 (435.5)
Net increase in cash and cash equivalents 858.1 57.9
Cash and cash equivalents at the beginning of the financial year 1,542.1 1,521.8
Effects of exchange rate changes on cash and cash equivalents 28.0 (37.6)
Cash and cash equivalents at the end of the financial year 9 2,428.2 1,542.1
The above consolidated statement of cash flows should be read in conjunction with the accompanying notes.
136 I MINERAL RESOURCES LIMITED 2022 ANNUAL REPORT
 Kudzai Mukandiona | Graduate Land Access | Acoustic Guitarist
 Dhiresh Adatia | Site Chef | Food Photographer
NOTES TO THE FINANCIAL STATEMENTS
MINERAL RESOURCES LIMITED 2022 ANNUAL REPORT I 139
NOTES TO THE FINANCIAL STATEMENTS
NOTES TO THE FINANCIAL STATEMENTS 30 JUNE 2022
SIGNIFICANT ACCOUNTING POLICIES
1. Basis of Preparation 141
2. Critical accounting judgements, estimates and assumptions 144
FINANCIAL PERFORMANCE
3. Operating segments 145
4. Revenue 148
5. Other income 151
6. Expenses 152
7. Income tax 154
8. Earnings per share 158
KEY BALANCE SHEET ITEMS
9. Cash and cash equivalents 160
10. Trade and other receivables 161
11. Inventories 162
12. Other assets 162
13. Financial assets 163
14. Property, plant and equipment 164
15. Intangibles 167
16. Exploration and mine development 169
17. Impairment of non-financial assets 172
18. Trade and other payables 173
19. Borrowings 174
20. Employee benefits 175
21. Provisions 175
22. Issued capital 176
23. Dividends 178
24. Financial instruments 178
UNRECOGNISED ITEMS
25. Contingent liabilities 186
26. Commitments 188
OTHER INFORMATION
27. Parent Entity information 189
28. Interests in material subsidiaries 190
29. Interests in associates 191
30. Interests in joint operations 193
31. Related party transactions 193
32. Key Management Personnel disclosures 194
33. Share based payments 195
34. Remuneration of auditors 197
35. Events after the reporting period 197
140 I MINERAL RESOURCES LIMITED 2022 ANNUAL REPORT
NOTES TO THE FINANCIAL STATEMENTS (CONTINUED)
1. SIGNIFICANT ACCOUNTING POLICIES
1.1 BASIS OF PREPARATION
These general purpose financial statements have been prepared in accordance with Australian Accounting Standards and Interpretations issued by the Australian Accounting Standards Board (AASB) and the Corporations Act 2001, as appropriate for for-profit oriented entities. These financial statements also comply with International Financial Reporting Standards as issued by the International Accounting Standards Board (IASB).
Historical cost convention
The financial statements have been prepared under the historical cost convention, except for, where applicable, the revaluation of financial assets and liabilities at fair value through profit or loss, certain classes of property, plant and equipment, and derivative financial instruments.
Critical accounting estimates
The preparation of the financial statements requires the use of certain critical accounting estimates. It also requires management to exercise its judgement in the process of applying the Group’s accounting policies. The areas involving a higher degree of judgement or complexity, or areas where assumptions and estimates are significant to the financial statements, are disclosed in Note 2.
Foreign currency
The financial statements are presented in Australian dollars, which is MinRes’ functional and presentation currency.
Foreign currency transactions are translated into Australian dollars using the exchange rates prevailing at the dates of the transactions. Foreign exchange gains and losses resulting from the settlement of such transactions and from the translation at financial year-end exchange rates of monetary assets and liabilities denominated in foreign currencies are recognised in profit or loss.
Rounding of amounts
The Company is of a kind referred to in Corporations Instrument 2016/191, issued by the Australian Securities and Investments Commission, relating to ‘rounding-off’. Amounts in this report have been rounded off in accordance with that Corporations Instrument to the nearest million dollars, unless otherwise stated.
1.2 PRINCIPLES OF CONSOLIDATION
(a) Subsidiaries
The consolidated financial statements incorporate the assets and liabilities of all subsidiaries of the Company as at 30 June 2022 and the results of all subsidiaries for the year then ended.
Subsidiaries are all those entities over which the Group has control. The Group controls an entity when the Group is exposed to, or has rights to, variable returns from its involvement with the entity and has the ability to affect those returns through its power to direct the activities of the entity. Subsidiaries are fully consolidated from the date on which control is transferred to the Group. They are de-consolidated from the date that control ceases.
Intercompany transactions, balances and unrealised gains on transactions between entities in the Group are eliminated. Unrealised losses are also eliminated unless the transaction provides evidence of the impairment of the asset transferred. Accounting policies of subsidiaries have been changed where necessary to ensure consistency with the policies adopted by the Group.
The acquisition of subsidiaries is accounted for using the acquisition method of accounting. A change in ownership interest, without the loss of control, is accounted for as an equity transaction, where the difference between the consideration transferred and the book value of the share of the non-controlling interest acquired is recognised directly in equity attributable to the parent.
Profit or loss and each component of other comprehensive income are attributed to the equity holders of the parent of the Group and to the non-controlling interests, even if this results in the non-controlling interests having a deficit balance.
Where the Group loses control over a subsidiary, it derecognises the assets including goodwill, liabilities and non- controlling interest in the subsidiary together with any cumulative translation differences recognised in equity. The Group recognises the fair value of the consideration received and the fair value of any investment retained together with any gain or loss in profit or loss.
(b) Joint operations
A joint operation is a joint arrangement whereby the parties that have joint control of the arrangement have rights to the assets, and obligations for the liabilities, relating to the arrangement. The Group has recognised its share of jointly held assets, liabilities, revenues and expenses of joint operations. These have been incorporated in the financial statements under the appropriate classifications.
MINERAL RESOURCES LIMITED 2022 ANNUAL REPORT I 141
NOTES TO THE FINANCIAL STATEMENTS (CONTINUED)
1. SIGNIFICANT ACCOUNTING POLICIES (CONTINUED)
(c) Employee share trust
The Group has in place a trust to administer the Group’s employee share and share rights schemes. This trust is consolidated, as the substance of the relationship is that the trust is controlled by the consolidated entity. Shares held by the Mineral Resources Employee Share Trust are disclosed as treasury shares and deducted from contributed equity.
1.3 SUMMARY OF SIGNIFICANT ACCOUNTING POLICIES
This note provides a summary of the accounting policies that are considered significant and relevant to the preparation of the financial statements, to the extent that they have not already been disclosed in other notes to the financial statements throughout the report. These policies have been consistently applied to all the years presented, unless otherwise stated.
(a) New or amended Accounting Standards and Interpretations adopted
The Group has adopted all of the new, revised or amending Accounting Standards and Interpretations issued by the Australian Accounting Standards Board (AASB) that are mandatory for the current reporting period. The adoption of these Accounting Standards and Interpretations did not have any significant impact on the financial performance or position of the Group.
Any new or amended Accounting Standards or Interpretations that are not yet mandatory have not been early adopted.
(b) Current and non-current classification
Assets and liabilities are presented in the balance sheet based on current and non-current classification.
An asset is current when it is expected to be realised or intended to be sold or consumed in normal operating cycle, it is held primarily for the purpose of trading, it is expected to be realised within 12 months after the reporting period, or the asset is cash or cash equivalent unless restricted from being exchanged or used to settle a liability for at least 12 months after the reporting period. All other assets are classified as non-current.
A liability is current when it is expected to be settled in normal operating cycle, it is held primarily for the purpose of trading, it is due to be settled within 12 months after the reporting period, or there is no unconditional right to defer the settlement of the liability for at least 12 months after the reporting period. All other liabilities are classified as non-current.
Deferred tax assets and liabilities are always classified as non-current.
(c) Goods and Services Tax (GST) and other similar taxes
Revenues, expenses and assets are recognised net of the amount of associated GST, unless the GST incurred is not recoverable from the tax authority. In this case it is recognised as part of the cost of the acquisition of the asset or as part of the expense.
Receivables and payables are stated inclusive of the amount of GST receivable or payable. The net amount of GST recoverable from, or payable to, the tax authority is included in other receivables or other payables in the balance sheet.
Cash flows are presented on a gross basis. The GST components of cash flows arising from investing or financing activities which are recoverable from, or payable to the tax authority, are presented as operating cash flows.
Commitments and contingencies are disclosed net of the amount of GST recoverable from, or payable to, the tax authority.
(d) New Accounting Standards and Interpretations not yet mandatory or early adopted
Australian Accounting Standards and Interpretations that have recently been issued or amended but are not yet mandatory, have not been early adopted by the Group for the annual reporting period ended 30 June 2022. The Group’s assessment of the impact of these new or amended Accounting Standards and Interpretations, most relevant to the Group, are set out below. There is currently no material impact from these new standards for the Group.
AASB 2020-1 Amendments to Australian Accounting Standards – Classifications of Liabilities as Current or Non-Current
The amendment applies to annual reporting periods beginning on or after 1 January 2023. This narrow-scope amendment to AASB 101 Presentation of Financial Statements clarifies that liabilities are classified as either current or non-current depending on the rights that exist at the end of the reporting period; and also clarifies the definition of settlement of a liability.
Application date for the Group: 1 July 2023
AASB 2020-6 Amendments to Australian Accounting Standards – Classification of Liabilities as Current or Non-current – Deferral of Effective Date
The amendment applies to annual reporting periods beginning on or after 1 January 2023. AASB 2020-6 defers the mandatory effective date of amendments that were originally made in AASB 2020-1 so that the amendments are required to be applied for annual reporting periods beginning on or after 1 January 2023 instead of 1 January 2022.
Application date for the Group: 1 July 2023
142 I MINERAL RESOURCES LIMITED 2022 ANNUAL REPORT
NOTES TO THE FINANCIAL STATEMENTS (CONTINUED)
AASB 2014–10 Sale or contribution of Assets between an Investor and its Associate or Joint Venture
AASB 2015-10 Amendments to Australian Accounting Standards –Effective Date of Amendments to AASB 10 and AASB 128
AASB 017-5 Amendments to Australian Accounting Standards
– Effective Date of Amendments to AASB 10 and AASB 128 and Editorial Corrections
2021-7 Amendments to Australian Accounting Standards –Effective Date of Amendments to AASB 10 and AASB 128 and Editorial Corrections
These amendments address an acknowledged inconsistency between the requirements in AASB 10 and those in AASB 128 (2011), in dealing with the sale or contribution of assets between an investor and its associate or joint venture.
As a consequence of the amendment:
• A full gain or loss on the sale or contribution of assets between an investor and investee is recognised when a transaction involves a business (whether it is housed in a subsidiary or not)
• A partial gain or loss is recognised when a transaction involves assets that do not constitute a business, even if these assets are housed in a subsidiary.
Application date for the Group: 1 July 2025
AASB 2020-3 Amendments to Australian Accounting Standards –Annual Improvements 2018-2020 and Other Amendments
The amendment applies to annual reporting periods beginning on or after 1 January 2022. This amending standard makes narrow scope amendments to a number of standards:
• AASB 1: to simplify its application by a subsidiary that becomes a first-time adopter after its parent in relation to the measurement of cumulative translation differences
• AASB 3: updating the reference to the Conceptual Framework for Financial Reporting without changing the accounting requirements for business combinations
• AASB 9: clarifying which fees an entity includes when assessing whether the terms of a new or modified financial ability are substantially different from the terms of the original financial liability
• AASB 116: requiring an entity to recognise the sales proceeds from selling items produced while preparing property, plant and equipment for its intended use, and the related cost, in profit or loss, instead of deducting the amounts received from the cost of the asset
• AASB 137: specifying the costs that an entity includes when assessing whether a contract will be loss-making; and
• AASB 141: removing the requirement to exclude cash flows from taxation when measuring fair value, thereby aligning the fair value measurement requirements in AASB 141 with those in other Australian Accounting Standards.
Application date for the Group: 1 July 2022
AASB 2021-2 Amendments to Australian Accounting Standards –Disclosure of Accounting Policies and Definition of Accounting Estimates
The amendment applies to annual reporting periods beginning on or after 1 January 2023. This amending Standard impacts a number of standards:
• AASB 7: clarifying that information about measurement bases for financial instruments is expected to be material to an entity’s financial statements
• AASB 101: requiring entities to disclose their material accounting policy information rather than their significant accounting policies
• AASB 108: clarifying how entities should distinguish changes in accounting policies and changes in accounting estimates
• AASB 134: identifying material accounting policy information as a component of a complete set of financial statements; and
• AASB Practice Statement 2, providing guidance on how to apply the concept of materiality to accounting policy disclosures.
Application date for the Group: 1 July 2023
AASB 2021-5 Amendments to Australian Accounting Standards –Deferred Tax related to Assets and Liabilities arising from a single transaction.
This Standard amends AASB 112 to clarify the accounting for deferred tax on transactions that, at the time of the transaction, give rise to equal taxable and deductable temporary differences.
The Standard amends AASB 1 to require deferred tax related to leases and decommissioning, restoration and similar obligations to be recognised by first-time adopters at the date of transaction to Australian Accounting Standards, despite the exemption set out in AASB 12.
Application date for the Group: 1 July 2023
MINERAL RESOURCES LIMITED 2022 ANNUAL REPORT I 143
NOTES TO THE FINANCIAL STATEMENTS (CONTINUED)
2. CRITICAL ACCOUNTING JUDGEMENTS, ESTIMATES AND ASSUMPTIONS
The preparation of the financial statements requires management to make judgements, estimates and assumptions that affect the reported amounts in the financial statements. Management continually evaluates its judgements and estimates in relation to assets, liabilities, contingent liabilities, revenue and expenses. Management bases its judgements, estimates and assumptions on historical experience and on other various factors, including expectations of future events, management believes to be reasonable under the circumstances. The resulting accounting judgements and estimates will seldom equal the related actual results. The judgements, estimates and assumptions that have a significant risk of causing a material adjustment to the carrying amounts of assets and liabilities within the next financial year are found in the respective notes below:
Note
Income tax 7
Recovery of deferred tax assets 7
Exploration and evaluation costs 16
Ore reserve and mineral resource estimates 16
Impairment of non-financial assets 17
Site rehabilitation provisions 21
Project closure 21
144 I MINERAL RESOURCES LIMITED 2022 ANNUAL REPORT
NOTES TO THE FINANCIAL STATEMENTS (CONTINUED)
3. OPERATING SEGMENTS
Business segment
The Group has identified its operating segments based on internal management reports that are reviewed by the Board (the Chief Operating Decision Makers) in assessing performance and in determining the allocation of resources.
The Group reports its business results as five operating segments (referred to as Pillars) being Mining Services and Processing, Iron Ore, Lithium, Other Commodities, and Central. All are operating within the Australian resources sector.
The measurement of segment results is in line with the basis of information presented to management for internal management reporting purposes and the performance of each segment is measured based on EBITDA contribution.
The accounting policies applied for internal reporting purposes are consistent with those applied in the preparation of the financial statements.
Operating segment information:
Group - 2022 $M $M $M $M $M $M $M
Revenue
External revenue 631.3 1,996.2 790.5 - - 3,418.0
Intersegment revenue 1,506.1 - - - (1,506.1) -
Total Revenue 2,137.4 1,996.2 790.5 - (1,506.1) 3,418.0
Underlying EBITDA 532.5 63.8 585.1 (92.7) (65.0) 1,023.7
Depreciation and amortisation (194.0) (157.5) (19.4) (10.2) 28.9 (352.2)
Underlying EBIT 338.5 (93.7) 565.7 - (102.9) (36.1) 671.5
Items excluded from underlying earnings (69.7)
Net finance costs (112.7)
Profit before tax 489.1
Assets
Segment assets 2,162.4 1,504.8 1,382.7 189.4 2,682.7 (110.9) 7,811.1
Liabilities
Segment liabilities (651.0) (502.2) (197.1) (99.3) (3,090.4) - (4,540.0)
Segment net assets 1,511.4 1,002.6 1,185.6 90.1 (407.7) (110.9) 3,271.1
1 Due to internal reporting requirements, the FY21 operating segment, Commodities, changed to Iron Ore, Lithium and Other Commodities in FY22. Other Commodities includes Manganese, Gas and Garnet.
2 Net Underlying EBITDA/EBIT represents elimination of internal profits that are temporarily unrealised to the Group.
Mining Services Iron Ore1 Lithium1 Other Commodities1 Central Intersegment2 Total
MINERAL RESOURCES LIMITED 2022 ANNUAL REPORT I 145
NOTES TO THE FINANCIAL STATEMENTS
3. OPERATING SEGMENTS (CONTINUED)
Operating segment information
Total
Group - 2021
Revenue
External revenue 546.7 3,057.1 129.8 3,733.6
Intersegment revenue 1,203.4 (1,203.4)
Total Revenue 1,750.1 3,057.1 129.8 (1,203.4) 3,733.6
Underlying EBITDA 464.2 1,528.1 (10.7) (37.7) (43.2) 1,900.7
Depreciation and amortisation (155.5) (93.2) (18.5) (9.5) 18.7 (258.0)
Underlying EBIT 308.7 1,434.9 (29.2) (47.2) (24.5) 1,642.7
Items excluded from underlying earnings 235.8
Net finance costs (85.8)
Profit before tax 1,792.7
Assets
Segment assets 1,445.9 1,032.6 1,209.4 86.7 2,022.7 (72.9) 5,724.4
Liabilities
Segment liabilities (619.6) (451.0) (74.6) (46.6) (1,286.5) (2,478.3)
Segment net assets 826.3 581.6 1,134.8 40.1 736.2 (72.9) 3,246.1
1 Due to internal reporting requirements, the FY21 operating segment, Commodities, changed to Iron Ore, Lithium and Other Commodities in FY22. Other Commodities includes Manganese, Gas and Garnet.
2 Net Underlying EBITDA/EBIT represents elimination of internal profits that are temporarily unrealised to the Group.
Mining Services Iron Ore Lithium Other Commodities1
Central Intersegment2
146 I MINERAL RESOURCES LIMITED 2022 ANNUAL REPORT
(CONTINUED)
$M $M $M $M $M $M $M
NOTES TO THE FINANCIAL STATEMENTS (CONTINUED)
Reconciliation of underlying earnings to net earnings
Pre-tax 2022 Taxation 2022 Net amount 2022 Pre-tax 2021 Net amount 2021
$M $M $M $M $M
Underlying earnings1 558.8 (159.3) 399.5 1,556.9 1,102.6
Items excluded from underlying earnings
Impairment charges (Note 17) (15.0) 4.5 (10.5) (46.5) (32.5)
Realised profit on sale of financial asset (Note 5) 94.4 (28.3) 66.1
Fair value (gain)/loss on equity instruments at fair value through profit or loss (Note 6) (33.4) 10.0 (23.4) 230.3 161.2
Exchange (losses) /gains on net debt (115.7) 34.8 (80.9) 52.0 36.4
Total excluded from underlying earnings (69.7) 21.0 (48.7) 235.8 165.1
Net earnings 489.1 (138.3) 350.8 1,792.7 1,267.7
1 FY22 Underlying earnings represents Underlying EBIT ($671.5 million) less net finance costs ($112.7 million).
Geographical information
Refer Note 4 for segment revenue disaggregation based on the geographical locations of external customers. All non-current assets of the Group exclusive of, where applicable, financial instruments and deferred tax assets, are located in Australia.
Major customer information
During the year ended 30 June 2022, Lithium segment revenues from the largest customer amounted to $763.2 million and for the Iron Ore segment revenues from the three largest customers amounted to $776.6 million, $586.2 million and $378 million respectively, arising from the sale of commodities and related freight revenue. No other single customer contributed 10 per cent or more to the Group’s revenue for the year.
During the year ended 30 June 2021, Lithium segment revenues from the largest customer amounted to $129.2 million and for the Iron Ore segment revenues from three largest customers amounted to $815.6 million, $899.3 million and $859.2 million respectively, arising from the sale of commodities and related freight revenue. No other single customer contributed 10 per cent or more to the Group’s revenue for the year.
MINERAL RESOURCES LIMITED 2022 ANNUAL REPORT I 147
NOTES TO THE FINANCIAL STATEMENTS
4. REVENUE Disaggregation of revenue
The disaggregation of revenue from contracts with customers is as follows:
Mining Services Iron Ore Lithium Other Total
Group - 2022 $M $M $M $M $M
Type of goods or service
Sale of commodities1 - 2,284.1 669.6 - 2,953.7
Commodity pricing adjustments - (287.9) 120.9 - (167.0)
Total sale of commodities - 1,996.2 790.5 - 2,786.7
Contract and operational revenue 502.3 - - - 502.3
Other 129.0 - - - 129.0
Total external revenue from contracts with customers 631.3 1,996.2 790.5 - 3,418.0
Geographical information (by location of customer)
Australia 631.3 - 631.3 China - 96.4 764.3 - 860.7 Singapore - 1,899.8 - - 1,899.8
Other - - 26.2 - 26.2
Total external revenue from contracts with customers 546.7 1,996.2 790.5 3,418.0
1 Sale of commodities in the Lithium segment for FY22 includes net earnings under the Mt Marion lithium hydroxide tolling arrangement, being the achieved price of lithium hydroxide totalling US$518 million less the cost of spodumene feed and conversion.
148 I MINERAL RESOURCES LIMITED 2022 ANNUAL REPORT
(CONTINUED)
NOTES TO THE FINANCIAL STATEMENTS (CONTINUED)
Group - 2021 $M $M $M $M $M
Type of goods or service
Sale of commodities - 2,727.7 129.8 - 2,857.5
Commodity pricing adjustments - 329.4 - - 329.4
Total sale of commodities - 3,057.1 129.8 - 3,186.9
Contract and operational revenue 437.8 - - - 437.8
Other 108.9 - - - 108.9
Total external revenue from contracts with customers 546.7 3,057.1 129.8 - 3,733.6
Geographical information (by location of customer)
Australia 546.7 - - 546.7 China - 190.5 129.8 - 320.3 Singapore - 2,866.6 - - 2,866.6
Other - - - - -
Total external revenue from contracts with customers 546.7 3,057.1 129.8 - 3,733.6
Contract balances
Contract assets
A contract asset is the right to consideration in exchange for goods or services transferred to the customer. If the Group performs under the contract by transferring goods or services to a customer before the customer pays consideration or before payment is due, a contract asset is recognised for the earned consideration that is conditional.
The Group does not have any material contract assets as at 30 June 2022 (30 June 2021: nil), as performance and a right to consideration occurs within a short period of time and all rights to consideration are unconditional.
Trade receivables
A receivable represents the Group’s right to an amount of consideration that is unconditional (i.e., only the passage of time is required before payment of the consideration is due). Refer to Note 10 for trade receivables.
Contract liabilities
A contract liability is the obligation to transfer goods or services to a customer for which the Group has received consideration (or an amount of consideration is due) from the customer. If a customer pays consideration before the Group transfers goods or services to the customer, a contract liability is recognised when the payment is made or the payment is due (whichever is earlier). Contract liabilities are recognised as revenue when the Group performs under the contract.
From time to time, the Group recognises contract liabilities in relation to:
• Iron ore and lithium sales which are sold under Cost and Freight (CFR) and Cost, Insurance and Freight (CIF) Incoterms, whereby a portion of the cash may be received from the customer before the freight/insurance services are provided
• Mining services revenue, including crushing services, whereby mobilisation charges may be received from the customer but is to be allocated and recognised based on the actual tonnes crushed each period (each performance obligation).
See Note 18 for further details of contract liabilities disclosed within Trade and Other Payables.
Mining Services Iron Ore Lithium Other Total
MINERAL RESOURCES LIMITED 2022 ANNUAL REPORT I 149
NOTES TO THE FINANCIAL STATEMENTS (CONTINUED)
4. REVENUE (CONTINUED)
Accounting policy for revenue recognition
Revenue from contracts with customers
Revenue is recognised at an amount that reflects the consideration to which the Group is expected to be entitled in exchange for transferring goods or services to a customer. For each contract with a customer, the Group identifies the contract with a customer, identifies the performance obligations in the contract, determines the transaction price which takes into account estimates of variable consideration and the time value of money, allocates the transaction price to the separate performance obligations on the basis of the relative stand-alone selling price of each distinct good or service to be delivered, and recognises revenue when or as each performance obligation is satisfied in a manner that depicts the transfer to the customer of the goods or services promised.
Variable consideration within the transaction price, if any, reflects concessions provided to the customer such as discounts, rebates and refunds, any potential bonuses receivable from the customer and any other contingent events. Such estimates are determined using either the “expected value” or “most likely amount” method. The measurement of variable consideration is subject to a constraining principle whereby revenue will be recognised only to the extent that it is highly probable that a significant reversal in the amount of cumulative revenue recognised will not occur. The measurement constraint continues until the uncertainty associated with the variable consideration is subsequently resolved. Amounts received that are subject to the constraining principle are recognised as a refund liability.
(i) Sale of goods
The Group earns revenue by mining, processing, and subsequently selling commodity products (including iron ore and lithium) by export to customers under a range of commercial terms.
Revenue from the sale of product is recognised at the point in time when control has been transferred to the customer, no further work or processing is required by the Group, the quantity and quality of the goods has been determined with reasonable accuracy, the price is fixed or determinable, and collectability is reasonably assured. This is generally when title passes. The majority of the Group’s sales agreements specify that title passes when the product is delivered to the destination specified by the customer, which is typically the vessel on which the product will be shipped. In practical terms, revenue is generally recognised on the bill of lading date, which is the date the commodity is delivered to the shipping agent. Within each contract to sell commodity products, each unit of product shipped is a separate performance obligation.
Revenue is generally recognised at the contracted price as this reflects the stand-alone selling price.
The Group’s sales agreements may provide for provisional pricing of sales with pricing subsequently adjusted to reflect market prices over a quotation period stipulated in the sales contract, typically on or after the vessel’s arrival at the port of discharge. The estimated consideration in relation to provisionally priced contracts is marked to market using the spot price at the end of each reporting period with the impact of the price movements recorded as an adjustment to sales revenue.
These sales agreements also allow for an adjustment to the sales price based on a survey of the goods by the customer (an assay for mineral content) therefore recognition of the sales revenue is based on the most recently determined estimate of product specifications. The effect of variable consideration arising from these arrangements with customers is included in revenue to the extent that it is highly probable that there will be no significant reversal of the cumulative amount of revenue recognised when any pricing uncertainty is resolved.
The Group sells the majority its commodity products on CFR or CIF International Commercial Terms (Incoterms) which means that the Group is responsible for providing freight services and, in CIF instances, insurance, after the date at which title of its goods passes. The Group therefore has separate performance obligations for freight/insurance services provided for sale of products under CFR and CIF Incoterms.
Freight/insurance revenue is allocated from the overall contract price at its standalone selling price (where observable) or otherwise at its estimated cost, plus margin. The recognition of freight/insurance revenue is deferred until the product is delivered rather than when the product is shipped.
The Group does not disclose sales revenue from freight and insurance services separately as it does not consider that this is necessary in order to understand the impact of economic factors on the Group; and the Group’s Chief Operating Decision Makers (as defined in the operating segments Note 3) do not review information specifically relating to these sources of revenue in order to evaluate the performance of business segments, neither is information on these sources of revenue provided externally.
The Group applies the practical expedient in AASB 15 paragraph 121 for its freight/insurance services and does not disclose information on the transaction price allocated to performance obligations that remain unsatisfied at the end of the reporting period as the performance obligations arising under sales arrangement for its commodity products have an original expected duration of one year or less.
150 I MINERAL RESOURCES LIMITED 2022 ANNUAL REPORT
NOTES TO THE FINANCIAL STATEMENTS (CONTINUED)
(ii) Rendering of services
The Group’s Mining Services and Processing segment earns contract and operational revenue from the provision of a range of mining services, including crushing services.
Revenue from mining services is recognised over time as the services are rendered. As mining services are invoiced on a monthly basis based on the actual services provided or at cost plus margin incurred to date, the Group has used the practical expedient available under AASB 15 to recognise revenue based on the right to invoice, on the basis that the invoiced amount corresponds directly with the value to the customer of the Group’s performance completed to date.
For crushing service contracts specifically, each tonne of ore crushed represents a separate performance obligation. Revenue from the rendering of crushing services is measured and recognised as each tonne is crushed based on a schedule of rates that is invoiced to the customer, being the estimate of the price to which the Group expects to be entitled, and a corresponding trade receivable is recognised. Mobilisation/demobilisation charges on crushing service contracts constitute variable charges that will be associated and allocated to each tonne crushed (each performance obligation) and therefore recognised based on the actual tonnes crushed each period, rather than when invoiced.
The Group applies the practical expedient in AASB 15 paragraph 121 for its mining services revenue and does not disclose information on the transaction price allocated to performance obligations that remain unsatisfied at the end of the reporting period as these are not material.
5. OTHER INCOME
Group 2022 $M 2021 $M
Net fair value gain on investments held at fair value through profit or loss 230.3
Realised profit on sale of financial asset 94.4
Net gain/(loss) on disposal of property, plant and equipment 6.0 (4.0)
Share in associate profit and loss 1.8
Other 8.1 19.0
Other income 110.3 245.3
MINERAL RESOURCES LIMITED 2022 ANNUAL REPORT I 151
NOTES TO THE FINANCIAL STATEMENTS (CONTINUED)
6. EXPENSES
Group 2022 $M 2021 $M
Profit before tax includes the following specific expenses:
Depreciation and amortisation
Plant and equipment 243.1 183.1
Depreciation capitalised to assets (0.3) (0.2)
Total depreciation 242.8 182.9
Amortisation
Mine development 106.7 72.1
Other 2.7 3.0
Total amortisation 109.4 75.1
Total depreciation and amortisation 352.2 258.0
Impairment
Intangibles (Note 15) 15.0 24.1
Property, plant and equipment (Note 14) 14.2
Inventory (Note 11) - 8.2
Total impairment 15.0 46.5
Finance costs
Interest on borrowings 110.5 83.6
Interest on lease liabilities 10.0 9.4
Other 2.8 2.8
Finance costs expensed 123.4 95.8
Other expenses
Net foreign exchange loss/(gain) 92.4 (51.3)
Fair value loss on equity instruments at fair value through profit or loss 33.4
Short-term leases, low value leases and leases with variable payments 2.7 1.7
All other operating expenses 260.0 138.6
Total other expenses 388.5 89.0
Superannuation expense included in employee benefit expense
Defined Contribution superannuation expense 47.8 34.8
152 I MINERAL RESOURCES LIMITED 2022 ANNUAL REPORT
 Barbara Zakrzewska | Geographic Information Systems Officer | Leadlight Artist
NOTES TO THE FINANCIAL STATEMENTS (CONTINUED)
7. INCOME TAX Income tax expense
Group 2022 $M 2021 $M
Income tax expense
Current tax 123.9 368.4
Deferred tax - origination and reversal of temporary differences 22.3 157.4
Adjustment recognised for prior periods (7.9) (0.8)
Aggregate income tax expense 138.3 525.0
Deferred tax included in income tax expense comprises:
Increase in deferred tax assets (91.1) (17.4)
Increase in deferred tax liabilities 113.3 174.8
Deferred tax - origination and reversal of temporary differences 22.2 157.4
Numerical reconciliation of income tax expense and tax at the statutory rate
Profit before income tax expense 489.1 1,792.7
Tax at the statutory tax rate of 30 per cent 146.3 537.8
Tax effect amounts which are not deductible in calculating taxable income:
Non allowable expenses 0.4 1.6
Temporary difference movement variance (0.5)(0.1) 1.6
Research and development concessions (13.6) 146.2 625.8
Adjustment recognised for prior periods (7.9) (0.8)
Current year tax losses not recognised
Income tax expense 138.3 525.0
Amounts charged directly to equity
Deferred tax liabilities
Tax losses not recognised
Unused tax losses for which no deferred tax asset has been recognised 26.7 33.5
Potential tax benefit @ 30 per cent 8.0 10.0
The above potential tax benefit for tax losses has not been recognised in the balance sheet. These tax losses can only be utilised (or transferred in upon joining the tax consolidated group) in the future if the continuity of ownership test is passed, or failing that, the business continuity test is satisfied.
154 I MINERAL RESOURCES LIMITED 2022 ANNUAL REPORT
NOTES TO THE FINANCIAL STATEMENTS (CONTINUED)
Net Deferred tax liability
Group 2022 $M 2021 $M
Deferred tax assets and liabilities comprise of temporary differences attributable to:
Tax losses 5.2
Impairment of receivables 0.1 1.3
Trade and other receivables 18.5 (16.0)
Trade and other receivables – deferred income 12.0 7.3
Inventories (1.3) 0.1
Accruals 9.6 5.5
Employee benefits 31.0 15.5
Provisions 73.5 59.4
Unrealised foreign exchange loss 34.3 (0.4)
Financial assets 0.6 (50.0)
Development costs 12.3 30.9
Property, plant and equipment (339.5) (195.0)
Exploration and evaluation (43.9) (17.8)
Prepayments (9.2) (9.2)
Research and development (8.3) (33.2)
Employee Share Trust (11.0)
Other 0.5 2.1
Deferred tax liability (220.8) (194.3)
Movements:
Opening balance (194.2) (2.7)
Credited to profit or loss (22.2) (157.4)
(Over) provision from prior year (4.4) (34.1)
Closing balance (220.8) (194.2)
Accounting policy for income tax
The income tax expense for the period is the tax payable on that period’s taxable income based on the applicable income tax rate for each jurisdiction, adjusted by the changes in deferred tax assets and liabilities attributable to temporary differences, unused tax losses and the adjustment recognised for prior periods, where applicable.
MINERAL RESOURCES LIMITED 2022 ANNUAL REPORT I 155
 Simon Hibben | Field Assistant | Military Model Builder
NOTES TO THE FINANCIAL STATEMENTS (CONTINUED)
7. INCOME TAX (CONTINUED)
Key judgement: Income tax
The Group is subject to income taxes in the jurisdictions in which it operates. Significant judgement is required in determining the provision for income tax. There are many transactions and calculations undertaken during the ordinary course of business for which the ultimate tax determination is uncertain. The Group recognises the amount of tax payable or recoverable based on management’s best estimate of the most likely outcome. Where the final tax outcome of these matters is different from the carrying amounts, such differences will impact the current and deferred tax provisions in the period in which such determination is made.
Deferred tax assets and liabilities are recognised for temporary differences at the tax rates expected to be applied when the assets are recovered or liabilities are settled, based on those tax rates that are enacted or substantively enacted, except for:
• When the deferred income tax asset or liability arises from the initial recognition of goodwill or an asset or liability in a transaction that is not a business combination and that at the time of the transaction affects neither the accounting nor taxable profits or
• When the taxable temporary difference is associated with interests in subsidiaries associates or joint ventures and the timing of the reversal can be controlled and it is probable that the temporary difference will not reverse in the foreseeable future.
Deferred tax assets are recognised for deductible temporary differences and unused tax losses only if it is probable that future taxable amounts will be available to utilise those temporary differences and losses.
Key judgement: Recovery of deferred tax assets
Deferred tax assets are recognised for deductible temporary differences only if the Group considers it is probable that future taxable amounts will be available to utilise those temporary differences and losses.
The carrying amount of recognised and unrecognised deferred tax assets are reviewed at each reporting date. Deferred tax assets recognised are reduced to the extent that it is no longer probable that future taxable profits will be available for the carrying amount to be recovered. Previously unrecognised deferred tax assets are recognised to the extent that it is probable that there are future taxable profits available to recover the asset.
Deferred tax assets and liabilities are offset only where there is a legally enforceable right to offset current tax assets against current tax liabilities and deferred tax assets against deferred tax liabilities; and they relate to the same taxable authority on either the same taxable entity or different taxable entities which intend to settle simultaneously.
Mineral Resources Limited (the ‘head entity’) and its wholly-owned Australian subsidiaries have formed an income tax group under the tax consolidation regime. The head entity and each subsidiary in the tax consolidated group continue to account for their own current and deferred tax amounts. The tax group has applied the ‘separate taxpayer within group’ approach in determining the appropriate amount of taxes to allocate to members of the tax group.
In addition to its own current and deferred tax amounts, the head entity also recognises the current tax liabilities (or assets) and the deferred tax assets arising from unused tax losses and unused tax credits assumed from each subsidiary in the tax group.
Assets or liabilities arising under tax funding agreements with the tax group are recognised as amounts receivable from or payable to other entities in the tax group. The tax funding arrangement ensures that the intercompany charge equals the current tax liability or benefit of each tax group member, resulting in neither a contribution by the head entity to the subsidiaries nor a distribution by the subsidiaries to the head entity.
MINERAL RESOURCES LIMITED 2022 ANNUAL REPORT I 157
NOTES TO THE FINANCIAL STATEMENTS (CONTINUED)
8. EARNINGS PER SHARE
Group 2022 $M 2021 $M
Profit after tax 350.8 1,267.7
Non-controlling interest (1.6) 2.0
Profit after income tax attributable to the owners of Mineral Resources Limited 349.2 1,269.7
Number Number
Weighted average number of ordinary shares used in calculating basic earnings per share 188,890,356 188,612,740
Weighted average number of ordinary shares used in calculating diluted earnings per share 188,890,356 188,612,740
Cents Cents
Basic earnings per share 184.87 673.18
Diluted earnings per share 184.87 673.18
Accounting policy for earnings per share
Basic earnings per share
Basic earnings per share is calculated by dividing the profit attributable to the owners of Mineral Resources Limited, excluding any costs of servicing equity other than ordinary shares, by the weighted average number of ordinary shares outstanding during the financial year, adjusted for bonus elements in ordinary shares issued during the financial year.
Diluted earnings per share
Diluted earnings per share adjusts the figures used in the determination of basic earnings per share to take into account the after income tax effect of interest and other financing costs associated with dilutive potential ordinary shares and the weighted average number of shares assumed to have been issued for no consideration in relation to dilutive potential ordinary shares.
9. CASH AND CASH EQUIVALENTS
Cash and cash equivalents
Group 2022 $M 2021 $M
Current
Cash at bank and on hand 1,701.3 1,327.6
Short-term deposits and other cash equivalents 726.9 214.5 2,428.2 1,542.1
Accounting policy for cash and cash equivalents
Cash and cash equivalents includes cash on hand, short-term deposits with financial institutions, other short-term, highly liquid investments with original maturities of three months or less that are readily convertible to known amounts of cash and which are subject to an insignificant risk of changes in value.
158 I MINERAL RESOURCES LIMITED 2022 ANNUAL REPORT
NOTES TO THE FINANCIAL STATEMENTS (CONTINUED)
Cash flow information - Reconciliation of profit after tax to net cash from operating activities
Group 2022 $M 2021 $M
Profit after income tax expense for the year 350.8 1,267.7
Adjustments for:
Depreciation and amortisation 352.2 258.0
Share-based payments 11.6 10.2
Foreign exchange differences 115.7 (52.0)
Impairment loss 15.0 46.5
Net (gain)/loss on disposal of property, plant and equipment (6.0) 4.0
Net (gain)/loss on disposal of financial assets (94.4)
Share of (profit)/loss – interest in associates (1.8)
Fair value loss/(gain) on investments held at fair value through profit or loss 33.4 (230.3)
Other non-cash transactions 1.3 (2.8)
Change in operating assets and liabilities:
Increase in trade and other receivables (319.3) (123.6)
Increase in inventories (67.5) (12.7)
Increase in deferred tax assets (100.8) (10.4)
Decrease/(increase) in other operating assets (20.5) 1.1
Increase in trade and other payables 45.7 196.8
Decrease in provision for income tax (156.0) (249.2)
Increase in deferred tax liabilities 127.4 200.2
(Decrease)/Increase in provisions (7.0) 5.9
Net cash from operating activities 279.8 1,309.4
MINERAL RESOURCES LIMITED 2022 ANNUAL REPORT I 159
NOTES TO THE FINANCIAL STATEMENTS
9. CASH AND CASH EQUIVALENTS (CONTINUED)
Cash flow information – Changes in liabilities arising from financing activities
Lease liability Senior unsecured notes
Other borrowings Total
Group $M $M $M $M
Balance at 30 June 2020 282.8 1,006.7 1.2 1,290.7
Net cash from/(used in) financing activities (109.8) 25.2 (84.6)
Acquisition of leases 172.6 172.6
Exchange differences (88.9) (88.9)
Other changes (30.4) 2.4 (28.0)
Balance at 30 June 2021 315.2 920.2 26.4 1,261.8
Balance at 1 July 2021 315.2 920.2 26.4 1,261.8
Net cash from/ (used in) financing activities (150.0) 1,738.6 (12.2) 1,576.4
Acquisition of leases 144.8 144.8
Exchange differences 141.4 141.4
Other changes 1.3 1.3
Balance at 30 June 2022 310.0 2,801.5 14.2 3,125.7
160 I MINERAL RESOURCES LIMITED 2022 ANNUAL REPORT
(CONTINUED)
NOTES TO THE FINANCIAL STATEMENTS (CONTINUED)
10. TRADE AND OTHER RECEIVABLES
Group 2022 $M 2021 $M
Current
Trade receivables 602.1 301.7
Less: Allowance for expected credit losses (4.3) 602.1 297.4
Loan receivables 24.5 33.9 626.6 331.3
Non-current
Loan receivables 43.9 46.9
Less: Allowance for expected credit losses (0.3) (0.5) 43.6 46.4
Other receivables
Security deposits 2.6 0.9
Deferred consideration receivable from sale of disposal group (note 24) 608.3 606.1 654.5 653.4
Expected credit losses on trade and other receivables are not material. Further information about the Group’s exposure to credit and market risks, and impairment losses for trade receivables and contract assets is included in Note 24.
Accounting policy for trade and other receivables
Trade receivables
Trade receivables are initially recognised at fair value and subsequently measured at amortised cost using the effective interest method, less any allowance for impairment losses. Trade receivables are generally due for settlement within 30 days.
Refer Note 24 for the Group’s credit risk management policies.
Impairment of trade receivables
Collectability of trade receivables is reviewed on an ongoing basis. Loss allowances for trade receivables are measured at an amount equal to lifetime expected credit losses (ECLs). Lifetime ECLs are the ECLs that result from all possible default events over the expected life of a financial instrument. Significant financial difficulties of the debtor, probability that the debtor will enter bankruptcy or financial reorganisation and default or delinquency in payments are considered indicators that a receivable is credit-impaired. ECLs are a probability-weighted estimate of credit losses. Credit losses are measured as the present value of all cash shortfalls (i.e. the difference between the cash flows due to the entity in accordance with the contract and the cash flows that the Group expects to receive). Cash flows relating to short-term receivables are not discounted if the effect of discounting is immaterial.
Debts which are known to be uncollectable are written off by reducing the carrying amount directly. If an impairment allowance has been recognised for a debt that then becomes uncollectable, the debt is written off against the allowance account. If an amount is subsequently recovered, it is credited against profit or loss.
MINERAL RESOURCES LIMITED 2022 ANNUAL REPORT I 161
NOTES TO THE FINANCIAL STATEMENTS (CONTINUED)
10. TRADE AND OTHER RECEIVABLES (CONTINUED)
Loans and other receivables
Other receivables generally arise from transactions outside the usual operating activities of the Group. Loans and other receivables are classified as financial assets held at amortised cost, less any allowance for impairment losses.
The Group’s other receivables do not contain impaired assets and are not past due. Based on the credit history, it is expected that these other receivables will be received when due.
11. INVENTORIES
Group 2022 $M 2021 $M
Current
Raw materials and stores 69.9 52.4
Ore inventory stockpiles 179.3 67.3
Work in progress 3.4 2.9 252.6 122.6
Non-current
Ore inventory stockpiles 62.4
Accounting policy for inventories
Raw materials, work in progress and finished goods are stated at the lower of weighted average cost and net realisable value. Cost comprises direct materials and delivery costs, direct labour, import duties and other taxes, an appropriate proportion of variable and fixed overhead expenditure based on normal operating capacity, and, where applicable, transfers from cash flow hedging reserves in equity. Costs of purchased inventory are determined after deducting rebates and discounts received or receivable.
Net realisable value is the estimated selling price in the ordinary course of business less the estimated costs of completion and the estimated costs necessary to make the sale.
12. OTHER ASSETS
Group
2022 $M 2021 $M
Current
Prepayments 58.0 37.6
Foreign exchange forward contracts 4.3 (0.3) 62.3 37.3
162 I MINERAL RESOURCES LIMITED 2022 ANNUAL REPORT
NOTES TO THE FINANCIAL STATEMENTS (CONTINUED)
13. FINANCIAL ASSETS
Group 2022 $M 2021 $M
Non-current
Shares in listed corporations - at fair value through profit or loss 58.0 296.1
Reconciliation
Reconciliation of the fair values at the beginning and end of the current and previous financial year are set out below:
Opening fair value 296.1 42.3
Additions 37.5 40.2
Disposals (233.3) (9.6)
Transfer (10.1) (7.1)
Revaluation (32.2) 230.3
Closing fair value 58.0 296.1
Refer to Note 24 for further information on fair value measurement.
Accounting policy for investments and other financial assets
Investments and other financial assets are initially measured at fair value. Transaction costs are included as part of the initial measurement, except for financial assets at fair value through profit or loss. Such assets are subsequently measured at either amortised cost or fair value depending on their classification. Classification is determined based on both the business model within which such assets are held and the contractual cash flow characteristics of the financial asset unless an accounting mismatch is being avoided.
Financial assets are derecognised when the rights to receive cash flows from the financial assets have expired or have been transferred and the Group has transferred substantially all the risks and rewards of ownership.
Financial assets at fair value through profit or loss
Financial assets not measured at amortised cost or at fair value through other comprehensive income (FVOCI) are classified as financial assets at fair value through profit or loss (FVTPL). Typically, such financial assets will be either: (i) held for trading, where they are acquired for the purpose of selling in the short-term with an intention of making a profit, or a derivative; or (ii) designated as such upon initial recognition where permitted. Fair value movements are recognised in profit or loss.
The Group’s investments in equity instruments that are not held for trading are measured at FVTPL. An irrevocable election has not been made by management to measure any instruments at FVOCI. This election is made on an investment by investment basis.
MINERAL RESOURCES LIMITED 2022 ANNUAL REPORT I 163
NOTES TO THE FINANCIAL STATEMENTS (CONTINUED)
14. PROPERTY, PLANT AND EQUIPMENT
Group 2022 $M 2021 $M
Non-current
Land - cost 28.9 25.4
Buildings - cost 314.9 241.7
Less: Accumulated depreciation (52.8) (46.5) 262.1 195.2
Right-of-use buildings - at cost 38.9 12.7
Less: Accumulated depreciation (15.1) (8.9) 23.8 3.8
Right-of-use plant and equipment - cost 494.4 550.7
Less: Accumulated depreciation (115.9) (152.0) 378.5 398.7
Plant and equipment - cost 2,226.3 1,743.1
Less: Accumulated depreciation (756.9) (541.6) 1,469.4 1,201.5 2,162.7 1,824.6
164 I MINERAL RESOURCES LIMITED 2022 ANNUAL REPORT
NOTES TO THE FINANCIAL STATEMENTS (CONTINUED)
Reconciliations
Reconciliations of written-down values at the start and end of the current and previous financial year are set out below:
Land Building Right-of-use buildings Right-of-use plant and equipment Plant and equipment Total
Group $M $M $M $M $M $M
Balance at 1 July 2020
14.4 54.4 40.0 271.3 985.8 1,365.9
Additions 9.5 142.1 1.7 183.7 365.6 702.6
Disposals (31.7) (8.8) (7.2) (47.7)
Impairment of assets (14.2) (14.2)
Transfers 1.5 4.2 0.1 11.6 (16.3) 1.1
Depreciation expense (5.5) (6.3) (59.1) (112.2) (183.1)
Balance at 30 June 2021
25.4 195.2 3.8 398.7 1,201.5 1,824.6
Additions 3.5 73.4 26.2 91.0 427.2 621.3
Disposals (21.0) (16.4) (37.4)
Impairment of assets
Transfers (0.2) (28.8) 26.0 (3.0)
Depreciation expense (6.3) (6.2) (61.4) (168.9) (242.8)
Balance at 30 June 2022 28.9 262.1 23.8 378.5 1,469.4 2,162.7
Capitalised borrowing costs
The amount of borrowing costs capitalised during the year ended 30 June 2022 was not material. In the prior year ended 30 June 2021, the amount of borrowing costs capitalised was not material.
Assets in the course of construction
At 30 June 2022, there were no material amounts included in property, plant and equipment relating to assets in the course of construction. In the prior year ended 30 June 2021, there were no material amounts included in property, plant and equipment relating to assets in the course of construction.
Impairment testing
Refer to Note 17 for details of impairment testing.
MINERAL RESOURCES LIMITED 2022 ANNUAL REPORT I 165
NOTES TO THE FINANCIAL STATEMENTS (CONTINUED)
14. PROPERTY, PLANT AND EQUIPMENT (CONTINUED)
Accounting policy for property, plant and equipment Owned assets
Items of plant and equipment are stated at cost less accumulated depreciation and impairment losses. The cost of self-constructed assets includes the cost of materials, direct labour and an appropriate portion of production overheads. The cost of selfconstructed and acquired assets includes (i) the initial estimate at the time of installation and during the period of use, when relevant, of the costs of dismantling and removing the items and restoring the site on which they are located, and (ii) changes in the measurement of existing liabilities recognised for these costs resulting from changes in the timing or outflow of resources required to settle the obligation or from changes in the discount rate.
Where parts of an item of plant and equipment have different useful lives, they are accounted for as separate items of plant and equipment.
Right-of-use assets
The Group has adopted AASB 16 Leases (AASB 16) from 1 July 2019. Except for short-term leases and leases of low-value assets, right-of-use assets and corresponding lease liabilities are recognised in the balance sheet when a contract is, or contains, a lease. That is, if the contract conveys the right to control the use of an identified asset for a period of time in exchange for consideration.
A right-of-use asset is recognised at the commencement date of a lease. The right-of-use asset is measured at cost, which comprises the initial amount of the lease liability, adjusted for, as applicable, any lease payments made at or before the commencement date net of any lease incentives received, any initial direct costs incurred, and, except where included in the cost of inventories, an estimate of costs expected to be incurred for dismantling and removing the underlying asset, and restoring the site or asset.
Right-of-use assets are depreciated on a straight-line basis over the unexpired period of the lease or the estimated useful life of the asset, whichever is the shorter. Where the Group expects to obtain ownership of the leased asset at the end of the lease term, the depreciation is over its estimated useful life. Right-of use assets are subject to impairment or adjusted for any re-measurement of lease liabilities.
Depreciation
Depreciation is calculated either on the straight-line method to write-off the net cost of each item of property, plant and equipment over the shorter of the lease term (where applicable) and their expected useful lives, or units of production method where the Group’s ore reserves are used to determine the units of production depreciation.
Buildings 40 years
Buildings at mine sites 10 years or usage basis
Right-of-use buildings Shorter of 40 years or the term of the lease
Right-of-use plant and Shorter of 3 - 20 years or the term equipment of the lease
Plant and equipment
Subsequent costs
1 - 10 years or usage basis
The Group recognises in the carrying amount of an item of plant and equipment the cost of replacing part of such an item when that cost is incurred if it is probable the future economic benefits embodied within the item will flow to the Group and the cost of the item can be measured reliably. All other costs are recognised in the income statement as an expense as incurred.
Borrowing costs
Borrowing costs directly attributable to the acquisition, construction or production of assets that necessarily take a substantial period of time to prepare for their intended use or sale are added to the cost of those assets, until such time as the assets are substantially ready for their intended use or sale.
All other borrowing costs are recognised in profit or loss in the period in which they are incurred.
166 I MINERAL RESOURCES LIMITED 2022 ANNUAL REPORT
NOTES TO THE FINANCIAL STATEMENTS
15. INTANGIBLES
Group 2022 $M 2021 $M
Non-current
Goodwill - cost 1.4 1.4
Development - at cost 2.7
Patents - cost 0.6 Less: Accumulated amortisation and impairment (0.1) 0.5
Access rights - cost 56.7 56.7 Less: Accumulated amortisation and impairment (39.3) (37.9) 17.4 18.8
Other - cost 10.5 23.0
Less: Accumulated amortisation (7.6) (6.5) 2.9 16.5 24.9 36.7
MINERAL RESOURCES LIMITED 2022 ANNUAL REPORT I 167
(CONTINUED)
NOTES TO THE FINANCIAL STATEMENTS (CONTINUED)
INTANGIBLES (CONTINUED)
Reconciliations
The table below sets out reconciliations of the written-down values at the beginning and end of the current and previous financial year are set out below:
Goodwill Capitalised development costs Patents Access rights Others Total
Group $M $M $M $M $M $M
Balance at 1 July 2020 1.4 21.8 1.7 21.1 1.9 47.9
Additions 0.6 15.9 16.5
Impairment of assets (22.4) (1.7) (24.1)
Amortisation expense - - (2.3) (1.3) (3.6)
Balance at 30 June 2021 1.4 18.8 16.5 36.7
Additions 1.4 2.6 5.9
Transfer in/(out) 3.3 0.6
Impairment of assets (0.6) (15.0) (15.0)
Amortisation expense (0.1) (1.4) (1.2) (2.7)
Balance at 30 June 2022 1.4 2.7 0.5 17.4 2.9 24.9
Allocation of goodwill to cash-generating units
Impairment testing
Refer to Note 17 for details of impairment testing
Accounting policy for intangible assets
Intangible assets acquired as part of a business combination, other than goodwill, are initially measured at their fair value at the date of the acquisition. Intangible assets acquired separately are initially recognised at cost. Indefinite life intangible assets are not amortised and are subsequently measured at cost less any impairment. Finite life intangible assets are subsequently measured at cost less amortisation and any impairment. The gains or losses recognised in profit or loss arising from the derecognition of intangible assets are measured as the difference between net disposal proceeds and the carrying amount of the intangible asset. The method and useful lives of finite life intangible assets are reviewed annually. Changes in the expected pattern of consumption or useful life are accounted for prospectively by changing the amortization method or period.
Goodwill
Goodwill arises on the acquisition of a business. Goodwill is not amortised. Instead, goodwill is tested annually for impairment, or more frequently if events or changes in circumstances indicate that it might be impaired, and is carried at cost less accumulated impairment losses. Impairment losses on goodwill are taken to profit or loss and are not subsequently reversed.
Group
Process Minerals International Pty Ltd
The following cash generating units have carrying amounts of goodwill:
168 I MINERAL RESOURCES LIMITED 2022 ANNUAL REPORT
2022 $M 2021 $M
1.4 1.4
15.
NOTES TO THE FINANCIAL STATEMENTS (CONTINUED)
Research and development
Research costs are expensed in the period in which they are incurred. Development costs are capitalised when it is probable that the project will be a success considering its commercial and technical feasibility; the Group is able to use or sell the asset; the Group has sufficient resources; and intent to complete the development and its costs can be measured reliably. Capitalised development costs are amortised when it is available for use in the manner intended by management on a straight-line basis over the period of their expected benefit.
Patents and trademarks
Significant costs associated with patents and trademarks are deferred and amortised on a straight-line basis over the period of their expected benefit.
Access rights
Access rights acquired as part of a business combination are recognised separately from goodwill. The rights are carried at their fair value at the date of acquisition less accumulated amortisation and impairment losses. Amortisation is calculated based on the timing of projected cash flows of the access rights over their estimated useful lives.
Other Intangibles
Other Intangible assets are carried at cost and amortisation is calculated based on their useful life.
16. EXPLORATION AND MINE DEVELOPMENT
Group 2022 $M 2021 $M
Non-current
Exploration and evaluation 619.6 163.5
Mine development 1,128.4 765.5
Less: Accumulated amortisation (309.9) (203.2) 818.5 562.3 1,438.1 725.8
MINERAL RESOURCES LIMITED 2022 ANNUAL REPORT I 169
NOTES TO THE FINANCIAL STATEMENTS
16. EXPLORATION AND MINE DEVELOPMENT (CONTINUED)
Reconciliations
Reconciliations of the written-down values at the beginning and end of the current and previous financial year are set out below: Exploration and evaluation Mine development Total
Group $M $M $M
Balance at 1 July 2020 132.0 344.4 476.4
Additions 66.9 190.7 257.6
Disposals (2.4) (2.4)
Reassessment of rehabilitation 65.9 65.9
Transfers (33.0) 33.0
Amortisation expense - (71.7) (71.7)
Balance at 30 June 2021 163.5 562.3 725.8
Balance at 30 June 2021 163.5 562.3 725.8
Additions 487.3 262.5 749.8
Disposals
Reassessment of rehabilitation 71.0 71.0
Transfers (31.2) 29.4 (1.8)
Amortisation expense - (106.7) (106.7)
Balance at 30 June 2022 619.6 818.5 1,438.1
Accounting policy for exploration and mine development assets
Exploration and evaluation assets
Exploration and evaluation expenditure in relation to separate areas of interest for which rights of tenure are current is carried forward as an asset in the balance sheet where it is expected that the expenditure will be recovered through the successful development and exploitation of an area of interest, or by its sale; or exploration activities are continuing in an area and activities have not reached a stage which permits a reasonable estimate of the existence or otherwise of economically recoverable ore reserves.
Key judgement: Exploration and evaluation costs
Key judgements are applied in considering costs to be capitalised which includes determining expenditures directly related to these activities and allocating overheads between those that are expensed and capitalised. In addition, costs are capitalised only if expected to be recovered either through successful development or sale of the relevant mining interest. Factors that could impact the future commercial production at the mine include the level of ore reserves and mineral resources, future technology changes, which could impact the cost of mining, future legal changes and changes in commodity prices. To the extent that capitalised costs are determined not to be recoverable in the future, the expenditure incurred in relation to the project or an area of interest will be written off in the period in which this determination is made.
170 I MINERAL RESOURCES LIMITED 2022 ANNUAL REPORT
(CONTINUED)
NOTES TO THE FINANCIAL STATEMENTS (CONTINUED)
Mine development
Development expenditure incurred by or on behalf of the Group is accumulated separately for each area of interest in which mineral resources have been identified. Such expenditure comprises cost directly attributable to the construction of a mine and the related infrastructure.
Once a development decision has been taken, the carrying amount of the exploration and evaluation expenditure in respect of the area of interest is aggregated with the development expenditure and classified under non-current assets as development properties.
A development property is reclassified as a mining property at the end of the commissioning phase, when the mine is capable of operating in the manner intended by management.
Depreciation is charged using the units-of-production method, with separate calculations being made for each area of interest. The units-of-production basis results in a depreciation charge proportional to the depletion of estimated total ore to be mined. These calculations require the use of estimates and assumptions, including the amount of recoverable reserves and estimates of future capital expenditure. The Group adopts a Run of Mine (ROM) tonnes of ore produced methodology.
Development properties are tested for impairment in accordance with the policy on impairment of assets.
Key estimate: Ore reserves and mineral resources
Ore reserves are estimates of the amount of product that can be economically and legally extracted from the Group’s current mining tenements. The Group estimates its ore reserves based on information compiled by appropriately qualified persons able to interpret the geological data. The estimation of recoverable ore reserves is based on factors such as estimates of foreign exchange rates, commodity prices, future capital requirements, and production costs, along with geological assumptions and judgements made in estimating the size and grade of the ore body.
Changes in the ore reserves or mineral resource estimates may impact on the value of exploration and evaluation assets, mine properties, property plant and equipment, provision for rehabilitation and depreciation and amortisation charges.
Stripping (waste removal) costs
As part of its mining operations, the Group incurs stripping costs both during the development phase and production phase of its operations.
Development stripping costs arise from the removal of overburden and other mine waste materials removed during the development of a mine site in order to access the mineral deposit. Costs directly attributable to development stripping activities, inclusive of an allocation of relevant overhead expenditure, are initially capitalised to exploration and evaluation expenditure. Capitalisation of development stripping costs ceases at the time that saleable material begins to be extracted from the mine. On completion of development, all capitalised development stripping included in exploration and evaluation is transferred to mine development.
Production stripping commences at the time that saleable materials begin to be extracted from the mine and, under normal circumstances, continue throughout the life of the mine. Costs of production stripping are charged to the profit or loss as operating costs when the ratio of waste material to ore extracted for a “component” of the ore body is expected to be constant throughout its estimated life. A “component” is a specific section of the orebody that is made more accessible by the stripping activity. It will typically be a subset of the larger orebody that is distinguished by a separate useful economic life.
MINERAL RESOURCES LIMITED 2022 ANNUAL REPORT I 171
NOTES TO THE FINANCIAL STATEMENTS (CONTINUED)
16. EXPLORATION AND MINE DEVELOPMENT (CONTINUED)
When the ratio of waste to ore is not expected to be constant, production stripping costs are accounted for as follows:
(i) All costs are initially charged to profit or loss and classified as operation costs.
(ii) When the current ratio of waste to ore is greater than the estimated life-of-component strip ratio, a portion of the stripping costs (inclusive of an allocation of relevant overhead expenditure) is capitalised to mine development as a stripping activity asset.
(iii) The amount of production stripping costs capitalised or charged in a financial year is determined so the stripping expense for the financial year reflects the estimated life-of-component strip ratio. The stripping activity asset is amortised on a units-of-production method over the life of the component, unless another method is more appropriate
Life-of-component strip ratios are based on estimates of ore reserves and mineral resources and the latest approved mine plan; they are a function of the mine design and therefore changes to that design will generally result in changes to the ratios. Changes to the estimated life-of-mine ratio are accounted for prospectively from the date of the change.
17. IMPAIRMENT OF NON-FINANCIAL ASSETS
Pre-tax Taxation Net amount Pre-tax Taxation Net amount
Group 2022 $M 2022 $M 2022 $M 2021 $M 2021 $M 2021 $M
Mining Services (14.4) 4.3 (10.1)
Commodities (15.0) 4.5 10.5 (5.2) 1.6 (3.6)
Central (26.9) 8.1 (18.8)
Total impairment charge (15.0) 4.5 10.5 (46.5) 14.0 (32.5)
Impairment testing
The Group tests non-financial assets for impairment:
• At least annually for indefinite life intangibles and goodwill; and
• Where there is an indication that the asset may be impaired.
If an asset does not generate independent cash inflows and its value in use cannot be estimated to be close to its fair value, the asset is tested for impairment as part of the cash generating unit (CGU) to which it belongs. The recoverable amount of each CGU is determined based on the higher of an asset’s fair value less costs of disposal (FVLCD) and value-in-use (VIU).
An impairment loss is recognised for the amount by which the asset’s carrying amount exceeds its recoverable amount.
Key assumptions: Assumptions used in the impairment assessments of non-financial assets
In determining the recoverable amount of assets, key assumptions and estimates are used that require significant levels of judgement and are subject to risk and uncertainty that are beyond the control of the Group, including political risk, climate risk, and other global uncertainty risks.
172 I MINERAL RESOURCES LIMITED 2022 ANNUAL REPORT
NOTES TO THE FINANCIAL STATEMENTS (CONTINUED)
Impairment recognised - FY22
Assets are firstly assessed for impairment at the individual level. For the current financial year this resulted in a pre-tax impairment of $15.0 million in relation to intangible assets, to align carrying values with future recovery expectations.
The Group considered assets which are assessed for impairment at the CGU level, with these assessments net of impairments summarised above. There was no resulting impairment charge for the year ended 30 June 2022 at the CGU level. There was no reversal of previous impairments recorded.
Previously recognised impairment - FY21
In the previous financial year, an impairment expense of $46.5 million represented the write-down of various classes of assets, being:
• $24.1 million of capitalised development costs and associated intellectual property were impaired to align carrying values with future recovery expectations and
• $22.4 million of various idle plant and equipment and inventory were impaired to reflect a change in management’s future operational plans which no longer required utilisation of these assets.
18. TRADE AND OTHER PAYABLES
Group 2022 $M 2021 $M
Current liabilities
Trade payables and accruals 588.2 557.3
Contract liabilities (Note 4(b)) 47.5 24.5 635.7 581.8
Non-Current liabilities
Trade payables and accruals 197.9
Refer to Note 24 for further information on financial instruments.
MINERAL RESOURCES LIMITED 2022 ANNUAL REPORT I 173
NOTES TO THE FINANCIAL STATEMENTS (CONTINUED)
19. BORROWINGS
Group 2022 $M 2021 $M
Current
Other borrowings 14.2 26.4
Lease liability 115.0 130.9 129.2 157.3
Non-current
Senior unsecured notes (i - iii) 2,830.6 931.1
Less: capitalised transaction costs (29.1) (10.9)
Lease liability 195.0 184.4 2,996.5 1,104.6
(i) US$700 million senior unsecured notes offering due 2027, at an interest rate of 8.125 per cent per annum.
(ii) US$625 million senior unsecured notes offering due 2027, at an interest rate of 8.000 per cent per annum.
(iii) US$625 million senior unsecured notes offering due 2030, at an interest rate of 8.500 per cent per annum.
Refer to note 24 for further information on financial instruments.
Accounting policy for borrowings
Loans and borrowings
Loans and borrowings are initially recognised at the fair value of the consideration received, net of transaction costs. They are subsequently measured at amortised cost using the effective interest method.
Where there is an unconditional right to defer settlement of the liability for at least 12 months after the reporting date, the loans or borrowings are classified as non-current.
Lease liability
A lease liability is recognised at the commencement date of a lease. The lease liability is initially recognised at the present value of the lease payments to be made over the term of the lease, discounted using the interest rate implicit in the lease or, if that rate cannot be readily determined, the Group’s incremental borrowing rate. Lease payments are comprised of fixed payments less any lease incentives receivable, variable lease payments that depend on an index or a rate, amounts expected to be paid under residual value guarantees, exercise price of a purchase option when the exercise of the option is reasonably certain to occur, and any anticipated termination penalties. The variable lease payments that do not depend on an index or a rate are expensed in the period in which they are incurred.
Lease liabilities are measured at amortised cost using the effective interest method. The carrying amounts are remeasured if there is a change in the following: future lease payments arising from a change in an index or a rate used; residual guarantee; lease term; certainty of a purchase option and termination penalties. When a lease liability is remeasured, an adjustment is made to the corresponding right-of-use asset, or to profit or loss if the carrying amount of the right-of-use asset is fully written down.
The lease liabilities are effectively secured as the rights to the leased assets, recognised in the balance sheet as right-of-use assets and revert to the lessor in the event of default.
174 I MINERAL RESOURCES LIMITED 2022 ANNUAL REPORT
EMPLOYEE BENEFITS
Group 2022 $M 2021 $M
Current
Employee benefits 82.0 69.4
Accounting policy for employee benefits
Liabilities for wages and salaries, including non-monetary benefits, annual leave and long service leave expected to be settled wholly within 12 months of the reporting date are measured at the amounts expected to be paid when the liabilities are settled.
The current provision includes amounts for vested long-service leave for which the Group does not have an unconditional right to defer settlement, regardless of when the actual settlement is expected to occur. However, based on past experience, the Group does not expect all employees to take the full amount of accrued leave or require payment within the next 12 months.
21. PROVISIONS
Group 2022 $M 2021 $M
Current
Project closure 7.1 7.1 Site rehabilitation 47.8 1.4
Other 0.6 0.7 55.5 9.2
Non-current
Project closure 11.3 15.2 Site rehabilitation 199.9 179.9 211.2 195.1
Movements in provisions
Movements in each class of provision during the current financial year, other than employee benefits, are set out below:
Project closure Site rehabilitation Other
Group - 2022 $M
Carrying amount at the start of the year 22.3 181.3 0.7
Additional provisions recognised 4.1 74.0 0.3
Amounts used (8.0) (8.5)
Unused provisions reversed (0.4)
Unwinding of discount 0.9
Carrying amount at the end of the year 18.4 247.7 0.6
NOTES TO THE FINANCIAL STATEMENTS (CONTINUED) 20.
$M $M
MINERAL RESOURCES LIMITED 2022 ANNUAL REPORT I 175
THE FINANCIAL STATEMENTS
21. PROVISIONS (CONTINUED)
Accounting policy for provisions
Provisions are recognised when the Group has a present (legal or constructive) obligation as a result of a past event, it is probable the Group will be required to settle the obligation, and a reliable estimate can be made of the amount of the obligation. The amount recognised as a provision is the best estimate of the consideration required to settle the present obligation at the reporting date, taking into account the risks and uncertainties surrounding the obligation. If the time value of money is material, provisions are discounted using a current pre-tax rate specific to the liability. The increase in the provision resulting from the passage of time is recognised as a finance cost.
Key estimate: Site rehabilitation provisions
In accordance with the Group’s legal requirements, provision is made for the anticipated costs of future restoration and rehabilitation of areas from which natural resources have been extracted. The provision includes costs associated with dismantling of assets, reclamation, plant closure, waste site closure, monitoring, demolition and decontamination. The provision is based upon current costs and has been determined on a discounted basis with reference to current legal requirements and current technology.
Each period the impact of unwinding of the discount is recognised in the income statement as a financing cost. Any change in the restoration provision is recorded against the carrying value of the provision and the related asset, only to the extent that it is probable that future economic benefits associated with the restoration expenditure will flow to the entity, with the effect being recognised in the income statement on a prospective basis over the remaining life of the relevant operation. The restoration provision is separated into current (estimated costs arising within 12 months) and non-current components based on the expected timing of these cash flows.
Key estimate: Project closure
At the completion of some projects the Group has a liability for redundancy and the cost of relocating crushing and other mobile plant. An assessment is undertaken on the probability that such expenses will be incurred in the normal course of business for contracting services and is provided for in the financial statements.
ISSUED CAPITAL
2022 Shares
Group
Shares 2022 $M 2021 $M
Ordinary shares 189,201,267 188,735,982 558.3 535.9
Less: Treasury shares (Employee Share Plans) (1,091,931) (534,582) (53.8) (21.4) 188,109,336 188,201,400 504.5 514.5
176 I MINERAL RESOURCES LIMITED 2022 ANNUAL REPORT NOTES TO
(CONTINUED) 22.
2021
NOTES TO THE FINANCIAL STATEMENTS (CONTINUED)
22. ISSUED CAPITAL (CONTINUED)
Movements in issued capital
Details
Ordinary shares Number
Less: Treasury shares Number Total Number
Balance at 1 July 2020 188,469,830 (698,611) 187,771,219
Shares issued under Dividend Reinvestment Plan 266,152 266,152
Purchase of shares under employee share plans (449,293) (449,293)
Employee share awards issued - 613,322 613,322
Balance at 30 June 2021 188,735,982 (534,582) 188,201,400
Shares issued under Dividend Reinvestment Plan 114,229 114,229
Purchase of shares under employee share plans (396,784) (396,784)
Employee share awards issued 351,056 (160,565) 190,491
Balance at 30 June 2022 189,201,267 (1,091,931) 188,109,336
Details Ordinary shares $M
Less: Treasury shares $M Total $M
Balance at 1 July 2020 526.6 (10.3) 516.3
Shares issued under Dividend Reinvestment Plan 9.2 9.2
Purchase of shares under employee share plans (20.2) (20.2)
Employee share awards issued 0.1 9.1 9.2
Balance at 30 June 2021 535.9 (21.4) 514.5
Shares issued under Dividend Reinvestment Plan 5.9 5.9
Purchase of shares under employee share plans (19.4) (19.4)
Employee share awards issued 16.5 (13.0) 3.5
Balance at 30 June 2022 558.3 (53.8) 504.5
On a show of hands every member present at a meeting in person or by proxy shall have one vote and upon a poll each share shall have one vote.
Incremental costs directly attributable to the issue of new shares are shown in equity as a deduction, net of tax, from the proceeds.
Treasury shares
Movements in treasury shares represent acquisition of the Company’s shares on market and allocation of shares to the Company’s employees from the vesting of awards and exercise of rights under the employee share-based payment plans.
MINERAL RESOURCES LIMITED 2022 ANNUAL REPORT I 177
NOTES TO THE FINANCIAL STATEMENTS
23. DIVIDENDS
Dividends
2022 2021 Dividend per share Cents
Total $M Dividend per share Cents
Declared and paid during the year
Final franked dividend for the year ended 30 June 2021 (2021: 30 June 2020)
Total $M
175.00 329.0 77.00 145.2
Interim franked dividend for the year ended 30 June 2022 (2021: 30 June 2021) - 100.00 188.6 175.00 329.0 177.00 333.8
Proposed
Final franked dividend for the year ended 30 June 2022 (2021: 30 June 2021) 100.00 188.3 175.00 329.0
Franking credits
Group 2022 $M 2021 $M
Franking credits available for subsequent financial years based on a tax rate of 30% 809.7 903.0
The above amounts represent the balance of the franking account as at the end of the financial year, adjusted for franking credits that will arise from the payment of the amount of the provision for income tax at the reporting date.
24. FINANCIAL INSTRUMENTS
(a) Capital risk management
The Group’s objectives when managing capital are to safeguard its ability to continue as a going concern, so that it can provide returns for shareholders and benefits for other stakeholders and to maintain an optimum capital structure to reduce the cost of capital.
In order to maintain or adjust the capital structure, the Group may adjust the amount of dividends paid to shareholders, return capital to shareholders, issue new shares or sell assets to reduce debt.
The Group may look to raise capital when an opportunity to invest in a business or company is seen as value adding relative to the current Company’s share price at the time of the investment. The Group is actively pursuing additional investments in the short term as it continues to integrate and grow its existing businesses in order to maximise synergies.
The Group is subject to certain financing arrangement covenants and meeting these is given priority in all capital risk management decisions. There have been no events of default on financing arrangement covenants during the financial year.
178 I MINERAL RESOURCES LIMITED 2022 ANNUAL REPORT
(CONTINUED)
NOTES TO THE FINANCIAL STATEMENTS (CONTINUED)
24. FINANCIAL INSTRUMENTS (CONTINUED)
The capital risk management policy is unchanged from the prior year. The gearing ratio at the reporting date was as follows:
Group 2022 $M 2021 $M
Current liabilities - borrowings (note 19) 129.2 157.3
Non-current liabilities - borrowings (note 19) 2,996.5 1,104.6
Total borrowings 3,125.7 1,261.9
Current assets - cash and cash equivalents (note 9) (2,428.2) (1,542.1)
Cash and cash equivalents, net of debt 697.5 (280.2)
Total equity 3,271.1 3,246.1
Total capital 3,968.6 2,965.9
Gearing ratio 18% (9%)
(b) Financial risk management objectives
The Group’s activities expose it to a variety of financial risks: market risk (including foreign currency risk, price risk and interest rate risk), credit risk and liquidity risk. The Group’s overall risk management program focuses on the unpredictability of financial markets and seeks to minimise potential adverse effects on the financial performance of the Group. The Group uses derivative financial instruments such as forward foreign exchange contracts to hedge certain risk exposures.
Derivatives are exclusively used for hedging purposes, i.e. not as trading or other speculative instruments. The Group uses different methods to measure different types of risk to which it is exposed. These methods include sensitivity analysis in the case of interest rate, foreign exchange and other price risks, ageing analysis for credit risk and beta analysis in respect of investment portfolios to determine market risk.
Risk management is carried out by senior finance executives (‘finance’) under policies approved by the Board of Directors (‘the Board’). These policies include identification and analysis of the risk exposure of the Group and appropriate procedures, controls and risk limits.
Finance identifies, evaluates and hedges financial risks within the Group’s operating units. Finance reports to the Board on a monthly basis.
(c) Market risk
Foreign currency risk
The Group undertakes certain transactions denominated in foreign currency and is exposed to foreign currency risk through foreign exchange rate fluctuations.
Foreign exchange risk arises from future commercial transactions and recognised financial assets and financial liabilities denominated in a currency that is not the entity’s functional currency. The risk is measured using sensitivity analysis and cash flow forecasting.
The Group enters into forward exchange contracts to buy and sell specified amounts of foreign currencies in the future at stipulated exchange rates. The objective in entering the forward exchange contracts is to protect the Group against unfavourable exchange rate movements for both the contracted and anticipated future sales undertaken in foreign currencies. Certain of these foreign exchange forward contracts are designated as hedging instruments.
MINERAL RESOURCES LIMITED 2022 ANNUAL REPORT I 179
NOTES TO THE FINANCIAL STATEMENTS (CONTINUED)
24. FINANCIAL INSTRUMENTS (CONTINUED)
The carrying amount of the Group’s foreign currency denominated financial assets and financial liabilities at the reporting date were as follows:
Assets Liabilities
Group 2022 $M 2021 $M 2022 $M 2021 $M
USD denominated 758.0 681.7 2,887.8 1,211.2
The following table demonstrates the sensitivity of these foreign currency denominated financial assets and financial liabilities to a weakening/strengthening in the Australian dollar, with all other variables held constant. The impact on the Group’s profit before tax is due to changes in the fair value of monetary assets and liabilities including non-designated foreign currency derivatives. The impact on the Group’s pre-tax equity is due to changes in the fair value of forward exchange contracts designated as cash flow hedges.
AUD strengthened/ (weakened) %
2022 2021
Profit before tax higher/(lower) $M Equity higher/(lower) $M
Profit before tax higher/(lower) $M Equity higher/(lower) $M
USD denominated 5% 101.4 101.4 25.2 25.2 USD denominated -5% (112.1) (111.9) (27.9) (27.9)
Commodity price risk
The Group is exposed to commodity price risk which arises from the Group’s sale of iron ore, lithium hydroxide and lithium spodumene concentrate at contracted and/or spot prices.
2022 2021
Change in price % Profit before tax higher/lower $M Equity higher/(lower) $M
Profit before tax higher/(lower) $M Equity higher/(lower) $M
Iron Ore +/- 10% 199.6 199.6 305.7 305.7
Lithium Spodumene +/- 10% 56.7 56.7 13.0 13.0
Lithium Hydroxide +/- 10% 75.2 75.2 -
Equity price risk
The Group’s investment in listed equity securities are susceptible to market price risk arising from uncertainties about future values of the investments securities. The Board reviews and approves all equity investment decisions.
At the reporting date, the Group’s exposure to listed equity securities at fair value was $58.0 million (2021: $296.1 million). A decrease of 10 per cent (2021:10 per cent) on the share prices could have an impact of approximately $5.8 million (2021: $29.6 million) on the profit or loss attributable to the Group.
Interest rate risk
The Group’s exposure to the risk of changes in market interest rates relates primarily to the Group’s financial instruments that have variable interest rates.
180 I MINERAL RESOURCES LIMITED 2022 ANNUAL REPORT
NOTES TO THE FINANCIAL STATEMENTS (CONTINUED)
As at the reporting date, the Group is exposed to interest rate risk on its variable rate financial instruments as follows:
2022 2021
Group
Cash at bank and on hand
Weighted average interest rate % Balance $M
Weighted average interest rate % Balance $M
0.07% 1,701.3 0.210% 1,327.6
Net exposure to cash flow interest rate risk 1,701.3 1,327.6
An analysis by remaining contractual maturities is shown in ‘liquidity risk’ note 24(e) below. The Group has considered sensitivity relating to exposure to interest rate risk at the reporting date. An official increase/decrease in interest rate of 100 (FY21: 100) basis points would have a favourable/adverse effect on the profit before tax of $17.0 million (FY21: $13.3 million) per annum.
(d) Credit risk
Nature of the risk
Credit risk refers to the risk that a counterparty will default on its contractual obligations resulting in financial loss to the Group. The Group’s exposure to financial position credit risk is as indicated by the carrying amounts of its financial assets, primarily from customer receivables from operating activities and deposits with financial instruments from financing activities. The Group does not have a significant exposure to any individual counterparty.
Credit risk management: trade receivables and contract assets
The Group has adopted a lifetime expected loss allowance in estimating expected credit losses to trade receivables through the use of a provisions matrix using fixed rates of credit loss provisioning. These provisions are considered representative across all customers of the Group based on recent sales experience, historical collection rates and available forward-looking information.
The Group has a strict policy for extending credit to customers, including obtaining agency credit information, confirming references and setting appropriate credit limits. The Group obtains guarantees where appropriate to mitigate credit risk and obtains letters of credit to mitigate credit risk for commodity sales. The maximum exposure to credit risk at the reporting date to trade receivables and contract assets is the carrying amount, net of any allowances for credit losses, as disclosed in the balance sheet and notes to the financial statements. The Group does not hold any collateral.
Generally, trade receivables are written off when there is no reasonable expectation of recovery. Indicators of this include the failure of a debtor to engage in a repayment plan, no active enforcement activity and a failure to make contractual payments for a period greater than one year.
In monitoring customer credit risk, customers are grouped according to their credit characteristics and counterparty type, including whether they arise from commodity sales, crushing and processing services or construction contracts, and the existence of previous financial difficulties.
MINERAL RESOURCES LIMITED 2022 ANNUAL REPORT I 181
NOTES TO THE FINANCIAL STATEMENTS (CONTINUED)
24. FINANCIAL INSTRUMENTS (CONTINUED)
Group 2022 $M 2021 $M
Commodity sale customers 463.0 104.5
Crushing and processing services customers 91.3 73.0
Other mining services 13.2 55.7
Other 34.7 64.3 602.1 297.5
The Group uses an allowance matrix to measure the ECLs of trade receivables based on shared credit risk characteristics and days past due. At 30 June 2022, the Group had $55.8 million (2021: $46.9 million) of trade receivables past due.
These past due receivables substantially relate to customers for whom there is no history of default. On this basis, the resulting allowance for credit losses on trade receivables is not material.
At 30 June 2022, the carrying amount of receivables and contract assets for the Group’s four major customers (Iron ore and Lithium commodity sale customers) (2021: three commodity sale customers) totalled $462.9 million (2021: $152.2 million).
The Group has no customers that are credit-impaired at the reporting date.
Credit risk management: cash deposits and derivatives
The credit risk on liquid funds and derivative financial instruments is limited as the counterparties are Australian/major international banks with high credit ratings assigned by international credit-rating agencies.
Credit risk management: loan receivables and other financial assets
Lending to external parties may be provided; secured by acceptable collateral as defined in the Group credit policy and business unit procedures. The Group restricts its dealings to counterparties that have acceptable credit ratings. Should the rating of a counterparty fall below certain levels, Group policy dictates that approval by the Board is required to maintain the level of the counterparty exposure. Alternatively, management may consider closing out positions with the counterparty or novating open positions to another counterparty with acceptable credit ratings.
Credit risk management: financial guarantees given to banks
There is also exposure to credit risk when the Group provides a guarantee to another party. The Group’s maximum exposure in this respect is the maximum amount the Group would have to pay if the guarantee is called upon. Details of contingent liabilities are disclosed in note 25.
(e) Liquidity risk
Vigilant liquidity risk management requires the Group to maintain sufficient liquid assets (mainly cash and cash equivalents) and available borrowing facilities to be able to pay debts as and when they become due and payable.
The Group manages liquidity risk by maintaining adequate cash reserves and available borrowing facilities by continuously monitoring actual and forecast cash flows and matching the maturity profiles of financial assets and liabilities.
182 I MINERAL RESOURCES LIMITED 2022 ANNUAL REPORT
1
NOTES TO THE FINANCIAL STATEMENTS (CONTINUED)
Financing arrangements
Unrestricted access was available at the reporting date to the following lines of credit:
Group 2022 $M 2021 $M
Total facilities
Bank overdraft3 4.0 4.0
Loan Facility1 400.0 250.0
Senior unsecured notes 2,830.6 931.1
Lease liability 286.8 311.1
Other borrowings 21.0 21.0
Bank guarantees 58.6 40.0 3,601.0 1,557.2
Used at the reporting date
Bank overdraft3 -
Loan Facility1 -
Senior unsecured notes 2,830.6 931.1
Lease liability 286.8 311.1
Other borrowings 1.6 1.3
Bank guarantees 45.2 21.6 3,164.2 1,265.1
Unused at the reporting date
Bank overdraft3 4.0 4.0
Loan Facility1 400.0 250.0
Senior unsecured notes
Lease liability2
Other borrowings 19.4 19.7
Bank guarantees 13.4 18.4 436.8 292.1
In January 2022, the Loan Facility was changed from a syndicate facility to a club facility. The club facility includes a number of separate facilities under a single common terms deed.
2 In order to finance the acquisition of mobile mining assets, the Company obtains commitments and funding via hire purchase master leases. The Company’s hire purchase lease liabilities are limited by the conditions of both the Loan Facility and senior unsecured notes to the greater of $430 million and 10% of the total assets less cash of the borrower group.
3 The bank overdraft facilities may be drawn at any time and may be terminated by the bank without notice.
MINERAL RESOURCES LIMITED 2022 ANNUAL REPORT I 183
NOTES TO THE FINANCIAL STATEMENTS (CONTINUED)
24. FINANCIAL INSTRUMENTS (CONTINUED)
Remaining contractual maturities
The following tables detail the Group’s remaining contractual maturity for its financial instrument liabilities. The tables have been drawn up based on the undiscounted cash flows of financial liabilities based on the earliest date on which the financial liabilities are required to be paid. The tables include both interest and principal cash flows disclosed as remaining contractual maturities and therefore these totals may differ from their carrying amount in the balance sheet.
Weighted average interest rate 1 year or less
Between 1 and 2 years Between 2 and 5 years
Over 5 years
Remaining contractual maturities
Group - 2022 % $M $M $M $M $M
Non-derivatives
Non-interest bearing
Trade payables
Interest-bearing - fixed rate
635.7 197.9 833.6
Senior unsecured notes 8.205% 1,016.1 1,814.5 2,830.6
Lease liability 3.349% 115.0 75.3 105.8 13.9 310.0
Other 0.850% 1.6 - - - 1.6
Total non-derivatives 752.3 273.2 1,121.9 1,828.4 3,975.8
Weighted average interest rate 1 year or less
Between 1 and 2 years Between 2 and 5 years Over 5 years
Remaining contractual maturities
Group - 2021 % $M $M $M $M $M Non-derivatives
Non-interest bearing
Trade payables 506.8 506.8
Interest-bearing - fixed rate
Senior unsecured notes 8.125% 931.1 931.1
Lease liability 2.760% 130.9 95.4 88.9 0.1 315.3
Other 0.850% 1.3 1.3
Total non-derivatives 639.0 95.4 88.9 931.2 1,754.5
The cash flows in the maturity analysis above are not expected to occur significantly earlier than contractually disclosed above.
184 I MINERAL RESOURCES LIMITED 2022 ANNUAL REPORT
NOTES TO THE FINANCIAL STATEMENTS (CONTINUED)
(f) Fair value of financial instruments
Fair value hierarchy
The following tables detail the Group’s assets and liabilities, measured or disclosed at fair value, using a three-level hierarchy, based on the lowest level of input that is significant to the entire fair value measurement being:
• Level 1: Quoted prices (unadjusted) in active markets for identical assets or liabilities that the entity can access at the measurement date
• Level 2: Inputs other than quoted prices included within Level 1 that are observable for the asset or liability, either directly or indirectly
• Level 3: Unobservable inputs for the asset or liability
Level 1
Group - 2022 Assets
Financial assets held at fair value through profit or loss:
- Shares in listed corporations 58.0 58.0
Deferred consideration receivable from sale of disposal group - - 608.3 608.3
Foreign exchange forward contracts in cash flow hedges 4.4 4.4
Total assets 62.4 - 608.3 670.6
Liabilities
Contingent consideration (197.9) (197.9)
Other liabilities: Foreign exchange forward contracts in cash flow hedges -Total liabilities - (197.9) (197.9)
Level 1
Group - 2021 Assets
Financial assets held at fair value through profit or loss:
- Shares in listed corporations 296.1 296.1
Deferred consideration receivable from sale of disposal group 606.1 606.1
Total assets 296.1 606.1 902.2
Liabilities
Other liabilities: Foreign exchange forward contracts in cash flow hedges (0.3) (0.3)
Total liabilities (0.3) (0.3)
Unless otherwise stated the carrying amount of financial instruments reflects their fair value.
The carrying amounts of trade and other receivables and trade and other payables are assumed to approximate their fair values to their short-term nature.
MINERAL RESOURCES LIMITED 2022 ANNUAL REPORT I 185
$M Level 2 $M Level 3 $M Total $M
$M Level 2 $M Level 3 $M Total $M
NOTES TO THE FINANCIAL STATEMENTS (CONTINUED)
24. FINANCIAL INSTRUMENTS (CONTINUED)
Valuation techniques for fair value measurements categorised within Level 3
The basis of the valuation of deferred consideration receivable is fair value. The Group obtained an independent valuation of the deferred consideration, measured at fair value, arising from the sale of Wodgina on 1 November 2019. The main Level 3 inputs used in the independent valuation were derived and evaluated as follows:
• Discount rate assumed fixed tolling charges per annum per feed tonne capacity assumed variable tolling charges per wet metric tonne feed
• Considered against the value implied by the Wodgina sale consideration for the arms-length transaction that completed on 1 November 2019.
The Group assessed that there were no material changes at the end of the reporting period since initial recognition.
Accounting policy for fair value measurement
When an asset or liability, financial or non-financial, is measured at fair value for recognition or disclosure purposes, the fair value is based on the price that would be received to sell an asset or paid to transfer a liability in an orderly transaction between market participants at the measurement date; and assumes that the transaction will take place either: in the principal market; or in the absence of a principal market, in the most advantageous market.
Fair value is measured using the assumptions that market participants would use when pricing the asset or liability, assuming they act in their economic best interests. For non-financial assets, the fair value measurement is based on its highest and best use. Valuation techniques that are appropriate in the circumstances and for which sufficient data are available to measure fair value, are used, maximising the use of relevant observable inputs and minimising the use of unobservable inputs.
Assets and liabilities measured at fair value are classified into three levels, using a fair value hierarchy that reflects the significance of the inputs used in making the measurements. Classifications are reviewed at each reporting date and transfers between levels are determined based on a reassessment of the lowest level of input that is significant to the fair value measurement.
For recurring and non-recurring fair value measurements, external valuers may be used when internal expertise is either not available or when the valuation is deemed to be significant. External valuers are selected based on market knowledge and reputation. Where there is a significant change in fair value of an asset or liability from one period to another, an analysis is undertaken, which includes a verification of the major inputs applied in the latest valuation and a comparison, where applicable, with external data.
25. CONTINGENT LIABILITIES
Legal claim contingency
(a) Subiaco lease for corporate headquarters
In July 2020, the Group terminated the lease agreement for corporate headquarters in Subiaco. The parties have since been in dispute over the validity of the termination. Both parties have alleged that they have incurred damages in connection with the disputed lease and the termination.
The status of the dispute is still preliminary and any potential award of damages against the Group is only possible, not probable, and cannot be reliably estimated as at the date of this report. Accordingly, no additional provision for liability has been made in these financial statements.
(b) Validity of Wonmunna mining leases
Fortescue Metals Group (ASX: FMG) (FMG) commenced legal proceedings against the Minister for Mines and Petroleum, the DMIRS Registrar and Wonmunna Iron Ore Pty Ltd (a MinRes subsidiary), seeking declarations that the Wonmunna mining leases (M47/1423, M47/1424, M47/1425) are invalid. In its claim, FMG alleges that the Minister did not have jurisdiction to grant the mining leases in 2012 as the applications for the mining leases in 2008 were not accompanied by mineralisation reports. Wonmunna Iron Ore Pty Ltd denies these claims and is defending the action.
186 I MINERAL RESOURCES LIMITED 2022 ANNUAL REPORT
NOTES TO THE FINANCIAL STATEMENTS (CONTINUED)
25. CONTINGENT LIABILITIES (CONTINUED)
The status of the matter is still preliminary and legal costs or potential claims are only possible, not probable, and cannot be reliably estimated as at the date of this report. Accordingly, no provision for liability has been made in these financial statements.
(c) Iron Valley haul road claim
On 25 November 2020, FMG commenced legal proceedings against the Group alleging that the access deed, executed between FMG and MinRes on 30 August 2012 for the road which is used to haul iron ore from the Group’s Iron Valley project has expired. FMG alleges that the Group must stop using the haul road and must remove the road and surrender its miscellaneous licenses over the area. The Group is defending the claim. By the consent of the parties, the matter has been adjourned until 1 June 2023 while MinRes pursues the construction of a new haul road.
Legal costs or potential claims or impacts of these proceedings are only possible, not probable, and cannot be reliably estimated as at the date of this report. Accordingly, no provision for liability has been made in these financial statements.
(d) Claim for introduction of Reed Industrial Minerals Pty Ltd offtake partner and equity partner
Reed Industrial Minerals Pty Ltd (RIM) is a joint operation in which the Group has a 50 per cent interest. During FY21, an individual and a related company (the Claimants) lodged a claim in the Supreme Court against RIM’s previous equity owners Neometals Limited (Neometals) and RIM (as a second defendant). The Claimants allege that agreements were reached in 2009 and 2015 which obliged Neometals to pay fees to one of the Claimants for having introduced Neometals to RIM’s offtake partner and for introducing an equity partner. The Claimants allege that RIM is also liable to pay the fee relating to the introduction of the offtake partner.
Based on the information provided by the Claimants to date, the Directors consider that it is not probable that material damages will be awarded against RIM in respect of the claim. Accordingly, no provision for liability has been made in these financial statements.
There has been no other material change to contingent liabilities since the last annual report.
Bank guarantees
The Group has provided guarantee to third parties in relation to performance of contracts and against warranty obligations for a defects liability period after completion of the work. Defects liability periods are usually from 12 to 18 months duration. Bank guarantees are issued as security for these obligations.
Group 2022 $M 2021 $M
Bank guarantee facility 40.0 40.0
Amount utilised (28.9) (21.6)
Unused facility 11.1 18.4
Cash-backed guarantee facility 18.6
Amount utilised (16.3)
Unused facility 2.3
MINERAL RESOURCES LIMITED 2022 ANNUAL REPORT I 187
NOTES TO THE FINANCIAL STATEMENTS
26. COMMITMENTS
Group 2022 $M 2021 $M
Capital commitments
Commitments relating to the purchase of property, plant and equipment contracted for at reporting date and not recognised as liabilities, payable:
- Within one year 433.7 215.8
- Later than one year but no later than five years 94.0 9.5
Total capital commitment 527.7 225.3
Lease commitments - finance
Committed at the reporting date and recognised as liabilities, payable:
Within one year 123.2 137.8
One to five years 193.7 189.7
More than five years 16.1 0.1
Total lease commitment 333.0 327.6
Less: Future finance charges (23.0) (12.3)
Net commitment recognised as liabilities 310.0 315.3
188 I MINERAL RESOURCES LIMITED 2022 ANNUAL REPORT
(CONTINUED)
NOTES TO THE FINANCIAL STATEMENTS (CONTINUED)
27. PARENT ENTITY INFORMATION
Set out below is the supplementary information about the parent entity.
Income statement
Parent 2022 $M 2021 $M
Profit after tax 165.8 2,060.3
Total comprehensive income 165.8 2,060.3
Balance sheet
Parent 2022 $M 2021 $M
Total current assets 2,076.6 1,413.6
Total assets 6,623.2 10,975.7
Total current liabilities 290.2 332.6
Total liabilities 4,951.8 9,141.7
Net assets 1,671.4 1,834.0
Equity
Issued capital 504.5 514.6 Reserves 26.8 14.2 Retained profits 1,140.1 1,305.2
Total equity 1,671.4 1,834.0
Guarantees entered into by the parent entity in relation to the debts of its subsidiaries
The parent entity had no guarantees in relation to the debts of its subsidiaries as at 30 June 2022 and 30 June 2021 other than as obligor under its syndicated financing facilities.
Contingent liabilities
The Parent Entity had no contingent liabilities as at 30 June 2022 (2021: $nil).
Capital commitments - Property, plant and equipment
The Parent Entity had capital commitments for property, plant and equipment at as 30 June 2022 of $4.2 million (2021: $nil).
Significant accounting policies
The accounting policies of the parent entity are consistent with those of the Group, as disclosed in note 1, except for the following:
• Investments in subsidiaries are accounted for at cost, less any impairment, in the Parent Entity
• Investments in associates are accounted for at cost, less any impairment, in the Parent Entity
• Dividends received from subsidiaries are recognised as other income by the Parent Entity.
MINERAL RESOURCES LIMITED 2022 ANNUAL REPORT I 189
NOTES TO THE FINANCIAL STATEMENTS
28. INTERESTS IN MATERIAL SUBSIDIARIES
The consolidated financial statements incorporate the assets, liabilities and results of the following material subsidiaries in accordance with the accounting policy described in note 1:
Ownership interest
Name Country of incorporation 2022 % 2021 %
Crushing Services International Pty Ltd Australia 100.00% 100.00%
PIHA Pty Ltd Australia 100.00% 100.00%
Polaris Metals Pty Ltd Australia 100.00% 100.00%
Process Minerals International Pty Ltd Australia 100.00% 100.00%
Auvex Resources Pty Ltd Australia 100.00% 100.00%
Mineral Resources (Equipment) Pty Ltd Australia 100.00% 100.00%
MRL Asset Management Pty Ltd Australia 100.00% 100.00%
MIS Carbonart Pty Ltd Australia 100.00% 100.00%
Mineral Resources Transport Pty Ltd Australia 100.00% 100.00%
Wodgina Lithium Pty Ltd Australia 100.00% 100.00%
Energy Resources Ltd New Zealand 100.00% 100.00%
Cattamarra Farms Pty Ltd* Australia 90.00% 90.00%
Yilgarn Iron Pty Ltd Australia 100.00% 100.00%
Iron Resources Pty Ltd Australia 100.00% 100.00%
Kumina Iron Pty Ltd Australia 100.00% 100.00%
MinRes Health Pty Ltd Australia 100.00% 100.00%
Bungaroo South Pty Ltd Australia 100.00% 100.00%
Buckland Minerals Transport Pty Ltd Australia 100.00% 100.00%
Cape Preston Logistics Pty Ltd Australia 100.00% 100.00%
Resource Development Group Limited* Australia 65.77% 65.77%
Wonmunna Iron Ore Pty Ltd Australia 100.00% 100.00%
MinRes Properties Pty Ltd Australia 100.00% 100.00%
MinRes Marine Pty Ltd Australia 100.00% 100.00%
Bulk Ore Shuttle Systems Pty Ltd* Australia 50.00% 50.00%
*Non-fully owned subsidiaries included are not considered to be material to the group.
190 I MINERAL RESOURCES LIMITED 2022 ANNUAL REPORT
(CONTINUED)
29. INTERESTS IN ASSOCIATES
Group 2022 $M 2021 $M
Norwest Energy NL 15.9 7.1
Aquila Resources Pty Ltd 86.8 85.0
Interest in associates 102.7 92.1
Interests in associates are accounted for using the equity method of accounting. Information relating to associates that are material to the Group are set out below:
Ownership interest
Name
Principal place of business/ Country of incorporation 2022 % 2021 %
Norwest Energy NL Australia 19.90 19.90
Aquila Resources Pty Ltd1 Australia 15.00 15.00
1 Aquila Resources Pty Ltd is accounted for as an associated company as the Group has significant influence primarily through representation on Aquila Resources Pty Ltd’s Board of Directors.
MINERAL RESOURCES LIMITED 2022 ANNUAL REPORT I 191
NOTES TO THE FINANCIAL STATEMENTS (CONTINUED)
29. INTERESTS IN ASSOCIATES (CONTINUED)
Group
31 December 20211 $M
Summarised statement of financial position
31 December 2020 $M
Current assets 35.9 87.2
Non-current assets 586.5 618.4
Total assets 622.4 705.6
Current liabilities 418.7 23.8
Non-current liabilities 27.2 48.8
Total liabilities 445.9 72.6
Net assets 176.5 633.0
Summarised statement of profit or loss and other comprehensive income
Revenue 24.5 7.4
Expenses (544.0) (76.9)
Loss before income tax (519.5) (69.5)
Income tax benefit 41.2 19.0
Loss after income tax (478.3) (50.5)
Other comprehensive income 22.0 (0.1)
Total comprehensive income (456.3) (50.6)
Reconciliation of the consolidated entity’s carrying amount
Opening carrying amount 85.0
Acquisition of ownership interest 85.0
Share of profit after income tax2 1.8
Closing carrying amount3 86.8 85.0
1 The results between 31 December 2021 disclosed audit results and 30 June 2022 is not expected to be material.
2 The share in profit represents amounts taken up for the financial year and exclude losses relating to provisions which have already been included in the investment carrying value at date of acquisition.
3 The Group considered impairment indicators in line with AASB 128: Investments in Associates and Joint Ventures and assessed that no event has occurred since acquisition. Losses relating to provisions have already been included in the investment carrying value at date of acquisition.
192 I MINERAL RESOURCES LIMITED 2022 ANNUAL REPORT
30. INTERESTS IN JOINT OPERATIONS
The Group has recognised its share of jointly held assets, liabilities, revenues and expenses of joint operations. These have been incorporated in the financial statements under the appropriate classifications. Information relating to joint operations that are material to the Group are set out below:
Ownership interest
Name
Principal place of business/ Country of incorporation 2022 % 2021 %
Reed Industrial Minerals Pty Ltd Australia 50.00 50.00 Buru Energy Limited Australia 50.00 50.00
Red Hill Iron Ore Joint Venture1 Australia 40.00
1 On 30 July 2021, the Group reached an agreement with Red Hill Iron Limited (ASX: RHI; Red Hill Iron) to acquire RHI’s 40 per cent participating interest in the Red Hill Iron Ore Joint Venture (RHIOJV) of a total consideration of $400 million, of which $200 million was paid out in 1H22 and a further $200 million is payable on first commercial shipment of iron ore extracted from the RHIOJV tenements recognised as deferred consideration at a present value of $197.9m, refer to note 24(f).
31. RELATED PARTY TRANSACTIONS
Parent entity
Mineral Resources Limited is the parent entity. Subsidiaries
Interests in subsidiaries are set out in Note 28. Associates
Interests in associates are set out in Note 29.
Joint operations
Interests in joint operations are set out in Note 30.
Key Management Personnel
Disclosures relating to Key Management Personnel are set out in Note 32 and the remuneration report included in the Directors’ Report.
Transactions with related parties
The value of transactions with related parties and outstanding balances in relation to transactions with related parties were as follows:
Transaction values for the year ended 30 June 2022
$M
Key Management Personnel:
Group
Transaction values for the year ended 30 June 2021 $M
Properties from which the Group’s operations are performed are rented from parties related to Chris Ellison and Peter Wade1 (2.3) (2.2)
Balances outstanding as at 30 June 2022 $M Balances outstanding as at 30 June 2021 $M
1 Occupation of these premises dates back prior to the Company’s listing in 2006. The ongoing need for occupation of these premises, as well as rental arrangements, are assessed periodically. The Group has a Related Party Transaction Policy that requires review and approval of Related Party Transactions by the Audit and Risk Committee (the Committee).
MINERAL RESOURCES LIMITED 2022 ANNUAL REPORT I 193
NOTES TO THE FINANCIAL STATEMENTS (CONTINUED)
31. RELATED PARTY TRANSACTIONS (CONTINUED)
A number of Directors of the Company hold or have held positions in other companies (personally related entities) where it is considered they control or significantly influence the financial or operating policies of those entities. Other than the transactions shown above, there were no reportable transactions with those entities for the period ending 30 June 2022 (30 June 2021: Nil).
Terms and conditions
All transactions were made on normal commercial terms and conditions and at market rates.
32. KEY MANAGEMENT PERSONNEL DISCLOSURES
Compensation
The aggregate compensation made to Directors and other members of Key Management Personnel of the Group is set out below: Group 2022 $M 2021
Short-term employee benefits 6.3 6.3
Post-employment benefits 0.2 0.2
Share-based payments 5.1 4.2 11.6 10.7
Detailed information about the remuneration received by each KMP is provided in the Remuneration Report that is audited and forms part of the Directors’ Report.
194 I MINERAL RESOURCES LIMITED 2022 ANNUAL REPORT
$M
NOTES TO THE FINANCIAL STATEMENTS (CONTINUED)
33. SHARE BASED PAYMENTS
Expense arising from share-based payment transactions
The expense recognised for employee services received during the year is shown in the following table:
Group 2022 $M 2021 $M
Equity-settled share-based payment transactions 11.3 10.2
Number and fair value of share awards granted during the period
Weighted average fair value $ Granted Number
FY22 STI plan (for Executive KMP) (Share Rights) 48.88 23,268
FY22 LTI plan (for Executive KMP) (Share Rights) 51.79 108,621
FY22 LTI and One Off Rights plans (for Employees) (Share Rights) 51.79 251,484
The weighted average fair value of the above equity instruments granted was determined with reference to the share price on the date of grant.
Additional information on the award schemes granted in FY22 are as follows:
(i) FY22 Short Term Incentive Plan for Key Executives (FY22 STIP)
Executive KMP is invited to participate in the FY22 STIP, under which awards made under the STIP that exceed 50 per cent of the FAR for the Managing Director or 40 per cent of FAR for other Executive KMP, will be settled in the form of MinRes shares that vest progressively over the two years following grant subject to continued service and application of clawback provisions.
(ii) FY22 Long Term Incentive Plan for Key Executives (FY22 LTIP)
Executive KMP are invited to participate in the FY22 LTIP, under which participants receive share rights in the Company, subject to four years of continuing service and testing of the performance measure over a four-year performance period. The performance measure is the four-year average ROIC enjoyed by the Company over the performance period compared with hurdles set in advance by the Board. Further details on the FY22 LTIP are provided in the Remuneration Report.
(iii) FY22 Long Term and One-off Rights Plans for Employees (FY22 ORP)
Under the FY22 Long Term and One-off Rights Plans, eligible employees are invited to receive share rights (Rights) in the Company, subject to employees remaining in service for a period of three to five years from the date of grant. Rights under the plan do not carry voting entitlements.
MINERAL RESOURCES LIMITED 2022 ANNUAL REPORT I 195
NOTES TO THE FINANCIAL STATEMENTS (CONTINUED)
33. SHARE BASED PAYMENTS (CONTINUED)
Equity-settled awards outstanding
Details of equity-settled share awards outstanding as at the reporting date are presented in the following table:
Grant date Expected vesting date
Outstanding at 30 June 2022 Number
Outstanding at 30 June 2021 Number Vesting conditions
FY18 LTIP (Share Rights) Aug-18 Aug-21 124,755 Non-market
FY20 STIP (for Executive KMP) - Deferred shares component (Share Rights) July-20 Aug-21/22 36,560 73,120 Non-market
FY20 LTIP (for Executive KMP) (Share Rights) Sep-19 Aug-23 359,413 359,413 Non-market
FY20 ARP & ORP (for Employees) (Share Rights) Sep-19 July-22/Sep-24 1,294,411 1,320,724 Non-market
FY21 STIP (for Executive KMP) - Deferred shares component (Share Rights) July-21 Aug-22/23 25,470 25,470 Non-market
FY21 LTIP (for Executive KMP) (Share Rights) July-20 Aug-24 268,101 268,101 Non-market
FY21 LTIP & ORP (for Employees) (Share Rights) July-20 July-23/Sep-25 522,152 548,283 Non-market
FY22 STIP (for Executive KMP) - Deferred shares component (Share Rights) July-22 Aug-23/24 23,268 Non-market
FY22 LTIP (for Executive KMP) (Share Rights) July-21 Aug-25 108,621 Non-market
FY22 LTIP (for Employees) (Share Rights) July-21 Aug-25 251,484 Non-market
Outstanding balances in relation to Share Rights under the FY20, FY21 and FY22 plans represent awards not yet exercised.
Accounting policy for share-based payments
Certain employees may receive remuneration in the form of share-based compensation.
Equity-settled
Equity-settled transactions are awards of shares, or options over shares, that are provided to employees in exchange for the rendering of services.
The cost of equity-settled transactions is measured at fair value on grant date and recognised as an expense with a corresponding increase in equity over the vesting period. The cumulative charge to profit or loss is calculated based on the grant date fair value of the award, the best estimate of the number of awards that are likely to vest and the expired portion of the vesting period. The amount recognised in profit or loss for the period is the cumulative amount calculated at each reporting date less amounts already recognised in previous periods.
If the non-vesting condition is within the control of the Group or employee, the failure to satisfy the condition is treated as a cancellation. If the condition is not within the control of the Group or employee and is not satisfied during the vesting period, any remaining expense for the award is recognised over the remaining vesting period, unless the award is forfeited.
196 I MINERAL RESOURCES LIMITED 2022 ANNUAL REPORT
NOTES TO THE FINANCIAL STATEMENTS
34. REMUNERATION OF AUDITORS
During the financial year the following fees were paid or payable for services provided by RSM Australia Partners, the auditor of the Company:
Group 2022 $’000 2021 $’000
Audit services - RSM Australia Partners
Audit or review of the financial statements 743.0 676.0
Other services - RSM Australia Partners & overseas network firms
Taxation services 61.0 61.0
Due diligence services required for US Notes offering 175.0 226.4 61.0
Audit services – unrelated firms 119.3 66.4 1,088.7 803.4
35. EVENTS AFTER THE REPORTING PERIOD
Dividend
On 29 August 2022, the Directors declared a final fully franked dividend for the year ended 30 June 2022 of $1.00 per share to be paid on 23 September 2022, a total estimated distribution of $188.3 million based on the number of ordinary shares on issue as at 5 September 2022.
COVID-19 pandemic
During FY22, the Group continued with its proactive implementation of a range of measures and adaptations to its operations in response to the COVID-19 pandemic. However, border closures and lockdowns following COVID-19 outbreaks around Australia impacted MinRes’ operations, primarily through the forced curtailment of staff movements from interstate and overseas. This continues to impact our ability to transport iron ore from our operations as the shortage of road train drivers constrains movement of materials.
Post FY22 close MinRes has continued COVID-19 testing checks as part of the fit-for-work regime for all FIFO workers as and when required. In addition, the Group maintains its ability, through MinRes Health, to rapidly re-activate these testing services, thereby benefitting the Group and the wider resources industry and general community in Western Australia.
Importantly, MinRes Health testing facilities are able to be re-commissioned within approximately 12 hours of a public health notification of a positive COVID-19 case in Western Australia. Despite these measures, the challenges presented by COVID-19 are fluid and continue to change; it is therefore not practical to estimate the potential impact of COVID-19 after the reporting date. The Group will continue to assess its response to the COVID-19 pandemic on an ongoing basis.
Onslow Iron Project
On 29 August 2022, the Red Hill Iron Ore Joint Venture (RHIOJV) parties made an unconditional Final Investment Decision (FID) to develop the RHIOJV iron ore assets as part of MinRes’ Ashburton Hub Development (Onslow Iron Project or Project) and have executed a Binding Project Development Term Sheet. The RHIOJV is currently held 40 per cent by MinRes and 60 per cent by API Management Pty Ltd (APIM) on behalf of the parties to the Australia Premium Iron Joint Venture, Aquila Steel Pty Ltd (Aquila) and AMCI Pty Ltd (AMCI).
MINERAL RESOURCES LIMITED 2022 ANNUAL REPORT I 197
(CONTINUED)
DIRECTORS’ DECLARATION
In the Directors’ opinion:
• The attached financial statements and notes comply with the Corporations Act 2001, the Accounting Standards, the Corporations Regulations 2001, and other mandatory professional reporting requirements
• The attached financial statements and notes comply with International Financial Reporting Standards as issued by the International Accounting Standards Board as described in note 1 to the financial statements
• The attached financial statements and notes give a true and fair view of the Group’s financial position as at 30 June 2022, and of its performance for the financial year ended on that date; and
• There are reasonable grounds to believe that the Company will be able to pay its debts as and when they become due and payable.
The Directors have been given the declarations required by section 295A of the Corporations Act 2001.
Signed in accordance with a resolution of Directors made pursuant to section 295(5)(a) of the Corporations Act 2001.
On behalf of the Directors
Chris Ellison Managing Director
198 I MINERAL RESOURCES LIMITED 2022 ANNUAL REPORT
29 August 2022 Perth
RSM Australia Partners
Level 32, Exchange Tower
2 The Esplanade Perth WA 6000 GPO Box R1253 Perth WA 6844
T +61 (0) 8 9261 9100
F +61 (0) 8 9261 9111
www.rsm.com.au
AUDITOR’S INDEPENDENCE DECLARATION
As lead auditor for the audit of the financial report of Mineral Resources Limited for the year ended 30 June 2022, I declare that, to the best of my knowledge and belief, there have been no contraventions of:
(i) the auditor independence requirements of the Corporations Act 2001 in relation to the audit; and
(ii) any applicable code of professional conduct in relation to the audit.
INDEPENDENT AUDITOR’S REPORT TO THE MEMBERS OF MINERAL RESOURCES LIMITED
RSM AUSTRALIA PARTNERS
INDEPENDENT AUDITOR’S REPORT TO THE MEMBERS OF MINERAL RESOURCES LIMITED
Opinion
RSM Australia Partners
Level 32, Exchange Tower
2 The Esplanade Perth WA 6000 GPO Box R1253 Perth WA 6844
T +61 (0) 8 9261 9100
F +61 (0) 8 9261 9111
www.rsm.com.au
Opinion
We have audited the financial report of Mineral Resources Limited (the Company) and its subsidiaries (the Group), which comprises the consolidated balance sheet as at 30 June 2022, the consolidated income statement, the consolidated statement of changes in equity and the consolidated statement of cash flows for the year then ended, and notes to the financial statements, including a summary of significant accounting policies, and the directors’ declaration.
Perth, WA TUTU PHONG Dated: 29 August 2022 Partner
In our opinion, the accompanying financial report of the Group is in accordance with the Corporations Act 2001, including:
We have audited the financial report of Mineral Resources Limited (the Company) and its subsidiaries (the Group), which comprises the consolidated balance sheet as at 30 June 2021, the consolidated income statement, the consolidated statement of changes in equity and the consolidated statement of cash flows for the year then ended, and notes to the financial statements, including a summary of significant accounting policies, and the directors' declaration.
(i) giving a true and fair view of the Group’s financial position as at 30 June 2022 and of its financial performance for the year then ended; and
(ii) complying with Australian Accounting Standards and the Corporations Regulations 2001
Basis for Opinion
In our opinion, the accompanying financial report of the Group is in accordance with the Corporations Act 2001, including:
(i) giving a true and fair view of the Group's financial position as at 30 June 2021 and of its financial performance for the year then ended; and
We conducted our audit in accordance with Australian Auditing Standards. Our responsibilities under those standards are further described in the Auditor’s Responsibilities for the Audit of the Financial Report section of our report. We are independent of the Group in accordance with the auditor independence requirements of the Corporations Act 2001 and the ethical requirements of the Accounting Professional and Ethical Standards Board’s APES 110 Code of Ethics for Professional Accountants (the Code) that are relevant to our audit of the financial report in Australia. We have also fulfilled our other ethical responsibilities in accordance with the Code.
(ii) complying with Australian Accounting Standards and the Corporations Regulations 2001.
Basis for Opinion
We confirm that the independence declaration required by the Corporations Act 2001, which has been given to the directors of the Company, would be in the same terms if given to the directors as at the time of this auditor ’s report.
We believe that the audit evidence we have obtained is sufficient and appropriate to provide a basis for our opinion.
We conducted our audit in accordance with Australian Auditing Standards. Our responsibilities under those standards are further described in the Auditor's Responsibilities for the Audit of the Financial Report section of our report. We are independent of the Group in accordance with the auditor independence requirements of the Corporations Act 2001 and the ethical requirements of the Accounting Professional and Ethical Standards Board's APES 110 Code of Ethics for Professional Accountants (the Code) that are relevant to our audit of the financial report in Australia. We have also fulfilled our other ethical responsibilities in accordance with the Code.
We confirm that the independence declaration required by the Corporations Act 2001, which has been given to the directors of the Company, would be in the same terms if given to the directors as at the time of this auditor's report.
THE
AUDIT
member of the RSM network is an independent accounting and consulting firm which practices in its own right. The RSM network is not itself a separate legal entity in any jurisdiction.
We believe that the audit evidence we have obtained is sufficient and appropriate to provide a basis for our opinion.
RSM Australia P artners ABN 36 965 185 036
Liability limited by a scheme approved under Professional Standards Legislation
MINERAL RESOURCES LIMITED 2022 ANNUAL REPORT I 199 INDEPENDENT AUDITOR’S REPORT
THE POWER OF BEING UNDERSTOOD AUDIT | TAX | CONSULTING RSM Australia Partners is a member of the RSM network and trades as RSM. RSM is the trading name used by the members of the RSM network. Each member of the RSM network is an independent accounting and consulting firm which practices in its own right. The RSM network is not itself a separate legal entity in any jurisdiction.
POWER OF BEIN G UNDERSTOOD
| TAX | CONSULTING RSM A ustr alia Partners is a member of the RSM network and trades as RSM. RSM is the trading name used by the members of the RSM network. Each
Key Audit Matters
Key audit matters are those matters that, in our professional judgement, were of most significance in our audit of the financial report of the current period. These matters were addressed in the context of our audit of the financial report as a whole, and in forming our opinion thereon, and we do not provide a separate opinion on these matters.
Key Audit Matter
Revenue Refer to Note 4 in the financial statements
Revenue was considered a key audit matter as it is the most significant account balance in the income statement.
The Group’s sale agreements provide for provisional pricing of sales with pricing subsequently adjusted to reflect market pricing over a quotation period stipulated in the sales contract, typically on or after the vessel’s arrival at the port of discharge. For sales where the final settlement price is yet to be determined, the value of this revenue is adjusted by considering tonnes subject to price finalisation at the end of the period.
How our audit addressed this matter
We performed the following audit procedures, amongst others, in relation to revenue:
• Assessed whether the revenue recognition policies are in compliance with Australian Accounting Standards;
• Sampled sales contracts with provisional pricing recorded at the reporting date, by recalculating the recorded provisional pricing adjustment to ensure it is comparable to relevant external price indices;
• Sampled a selection of sales contracts and delivery documentation to ensure that revenue has been recognised in accordance with the Group’s accounting policy;
• Sampled sales transactions before and after the reporting date to ensure that revenue is recognised in the correct financial period; and
• Assessed the disclosures in the financial report to ensure they are in accordance with the requirements of the Australian Accounting Standards.
Provision for Site Rehabilitation - Refer to Note 21 in the financial statements
As at 30 June 2022, the Group had provisions for site rehabilitation of $247.7 million relating to the estimated future cost of rehabilitation and restoration of areas disturbed as a result of its mining operations.
The provision for site rehabilitation was considered a key audit matter due to the materiality of the balance, the significant judgements and estimation uncertainty, and the complexity involved in the quantification of the liability.
We performed the following audit procedures, amongst others, in relation to the provision for site rehabilitation:
• Obtained an understanding of the process involved in determining the provision;
• Obtained the calculations and the methodology used to determine if the provision had been calculated in accordance with Australian Accounting Standards;
• Considered the competence and objectivity of the Group’s internal and external experts involved in determining the cost estimates used in the calculations;
• Where external expert reports were used to support the estimation of the provision, we assessed the information provided and ensured it was appropriately reflected in the calculation of the provision;
• We checked the mathematical accuracy of provision calculations;
• On a sample basis, agreed inputs used in the calculations to supporting documentation; and
• Benchmarked the key market related assumptions, being inflation rates and discount rates, used in the calculations against external market data.
200 I MINERAL RESOURCES LIMITED 2022 ANNUAL REPORT
INDEPENDENT AUDITOR’S REPORT (CONTINUED)
INDEPENDENT AUDITOR’S REPORT (CONTINUED)
Other Information
The directors are responsible for the other information. The other information comprises the information included in the Group’s annual report for the year ended 30 June 2022, but does not include the financial report and the auditor ’s report thereon.
Our opinion on the financial report does not cover the other information and accordingly we do not express any form of assurance conclusion thereon.
In connection with our audit of the financial report, our responsibility is to read the other information and, in doing so, consider whether the other information is materially inconsistent with the financial report or our knowledge obtained in the audit or otherwise appears to be materially misstated.
If, based on the work we have performed, we conclude that there is a material misstatement of this other information, we are required to report that fact. We have nothing to report in this regard.
Responsibilities of the Directors for the Financial Report
The directors of the Company are responsible for the preparation of the financial report that gives a true and fair view in accordance with Australian Accounting Standards and the Corporations Act 2001 and for such internal control as the directors determine is necessary to enable the preparation of the financial report that gives a true and fair view and is free from material misstatement, whether due to fraud or error.
In preparing the financial report, the directors are responsible for assessing the ability of the Group to continue as a going concern, disclosing, as applicable, matters related to going concern and using the going concern basis of accounting unless the directors either intend to liquidate the Group or to cease operations, or have no realistic alternative but to do so.
Auditor’s Responsibilities for the Audit of the Financial Report
Our objectives are to obtain reasonable assurance about whether the financial report as a whole is free from material misstatement, whether due to fraud or error, and to issue an auditor’s report that includes our opinion. Reasonable assurance is a high level of assurance, but is not a guarantee that an audit conducted in accordance with the Australian Auditing Standards will always detect a material misstatement when it exists. Misstatements can arise from fraud or error and are considered material if, individually or in the aggregate, they could reasonably be expected to influence the economic decisions of users taken on the basis of this financial report.
A further description of our responsibilities for the audit of the financial report is located at the Auditing and Assurance Standards Board website at: https://www.auasb.gov.au/auditors_responsibilities/ar1.pdf. This description forms part of our auditor’s report.
MINERAL RESOURCES LIMITED 2022 ANNUAL REPORT I 201
INDEPENDENT AUDITOR’S REPORT (CONTINUED)
Report on the Remuneration Report
Report on the Remuneration Report
Opinion on the Remuneration Report
Opinion on the Remuneration Report
We have audited the Remuneration Report included within the directors’ report for the year ended 30 June 2022.
We have audited the Remuneration Report included within the directors' report for the year ended 30 June 2021.
In our opinion, the Remuneration Report of Mineral Resources Limited, for the year ended 30 June 2022, complies with section 300A of the Corporations Act 2001.
In our opinion, the Remuneration Report of Mineral Resources Limited, for the year ended 30 June 2021, complies with section 300A of the Corporations Act 2001
Responsibilities
Responsibilities
The directors of the Company are responsible for the preparation and presentation of the Remuneration Report in accordance with section 300A of the Corporations Act 2001. Our responsibility is to express an opinion on the Remuneration Report, based on our audit conducted in accordance with Australian Auditing Standards.
The directors of the Company are responsible for the preparation and presentation of the Remuneration Report in accordance with section 300A of the Corporations Act 2001. Our responsibility is to express an opinion on the Remuneration Report, based on our audit conducted in accordance with Australian Auditing Standards.
RSM AUSTRALIA PARTNERS

Perth, WA Dated: 29 August 2022
Perth, WA TUTU PHONG Dated: 11 August 2021 Partner
SHAREHOLDER INFORMATION AND CORPORATE DIRECTORY
SHAREHOLDER INFORMATION
The shareholder information set out below was applicable as of [xx ]

[LEAVE A WHOLE PAGE HERE – TO BE PROVIDED BY FINANCE CLOSER TO RELEASE DATE]
CORPORATE DIRECTORY
Directors Peter Wade Chris Ellison
James McClements
Kelvin Flynn Susan Corlett (appointed 4 January 2021)
Xi Xi
Company secretaries Mark Wilson Derek Oelofse
Registered office
1 Sleat Road Applecross WA 6153
P: + 61 8 9329 3600
F: + 61 8 9329 3601
202 I MINERAL RESOURCES LIMITED 2022 ANNUAL REPORT
MINERAL RESOURCES LIMITED 2022 ANNUAL REPORT I 203 SHAREHOLDER INFORMATION CORPORATE DIRECTORY GLOSSARY
SHAREHOLDER INFORMATION
SHAREHOLDER INFORMATION
The shareholder information set out below was applicable as at 5 September 2022.
Range Total holders Units % Units
1 to 1,000 31,491 8,812,498 4.65 1,001 to 5,000 5,575 11,894,852 6.28 5,001 to 10,000 624 4,559,932 2.41 10,001 to 100,000 383 9,194,385 4.85 100,001 and over 41 154,978,411 81.81 Rounding 0.00
Total 38,114 189,440,078 100.00
Unmarketable Parcels
Analysis of number of equitable security holders by size of holding.
Minimum Parcel Size Holders Units
Minimum $500.00 parcel at $59.9400 per unit 9 531 1,231
Equity Security Holders
The names of the 20 largest security holders of quoted equity securities are listed below.
Rank Name Units % of Units
1 HSBC CUSTODY NOMINEES (AUSTRALIA) LIMITED 62,112,527 32.79
2 J P MORGAN NOMINEES AUSTRALIA PTY LIMITED 24,434,521 12.90
3 CHRIS ELLISON 22,278,003 11.64
4 CITICORP NOMINEES PTY LIMITED 21,444,743 11.32
5 BNP PARIBAS NOMINEES PTY LTD 9,481,056 5.00
6 NATIONAL NOMINEES LIMITED 6,223,804 3.29
UBS NOMINEES PTY LTD 1,460,626 0.77
GERAGHTY
MCCUSKER HOLDINGS PTY
FOUNDATION
FAMILY
1,372,175 0.72
1,325,000 0.70
1,252,040 0.66
MCCUSKER CHARITABLE A/C> 890,000 0.47
PLANS PTY LTD 889,118 0.47
QUOTIDIAN NO 2 PTY LTD 415,000 0.22
PAKSIAN PTY LTD 371,000 0.20
PETER WADE <WADE FAMILY A/C> 344,710 0.18
PTY LTD 155,000 0.08
WEALTH CUSTODIANS LTD <RESIDENT CASH ACCOUNT> 150,138 0.08
SAMUEL LTD ACN 086243567 <ANF ITS MDA CLIENTS A/C> 138,211 0.07
KAUN PTY LTD <THE KAUN FAMILY FUND A/C> 133,250 0.07
HOLDINGS PTY LTD <CEDARFIELD A/C> 130,000 0.07
HOLDERS OF ORDINARY FULLY PAID SHARES 155,000,922 81.70
7
8 D & C
PTY LTD <GERAGHTY
A/C>
9
LTD
10 NETWEALTH INVESTMENTS LIMITED
11 MCCUSKER
LTD <THE
12 CPU SHARE
13
14
15 MR
16 MARTINDALE
17 HOBSON
18 FIRST
19
20 CEDARFIELD
TOP 20
204 I MINERAL RESOURCES LIMITED 2022 ANNUAL REPORT
 Andrea Chapman | General Manager People | Dog Lover
CORPORATE DIRECTORY DIRECTORS
James McClements
Chris Ellison
Kelvin Flynn
Susie Corlett
Xi Xi
Zimi Meka (appointed 17 May 2022)
Peter Wade (resigned 2 March 2022)
COMPANY SECRETARIES
Mark Wilson Derek Oelofse
REGISTERED OFFICE
20 Walters Drive Osborne Park WA 6017
P: +61 8 9329 3600
F: +61 8 9329 3601
Postal address: Locked Bag 13, OSBORNE PARK LPO, OSBORNE PARK, WESTERN AUSTRALIA 6017
PRINCIPAL PLACE OF BUSINESS
20 Walters Drive Osborne Park WA 6017
WEBSITE www.mrl.com.au
SHARE REGISTER
Computershare Investor Services Pty Limited Level 11, 172 St Georges Terrace Perth WA 6000
P: +61 8 9323 2000
F: +61 8 9322 2033 www.computershare.com/au
AUDITOR
RSM Australia Partners Level 32 Exchange Tower
2 The Esplanade Perth WA 6000
P: +61 8 9261 9100
F: +61 8 9261 9111 www.rsm.com.au
BANKERS
National Australia Bank 100 St Georges Terrace Perth WA 6000 www.nab.com.au
STOCK EXCHANGE LISTING
Mineral Resources Limited shares are listed on the Australian Securities Exchange (ASX: MIN)
206 I MINERAL RESOURCES LIMITED 2022 ANNUAL REPORT
GLOSSARY
1H, 2H, FY
First half, second half, full year
$ Australian dollar
Australian Accounting Standards
Australian Accounting Standards are developed, issued and maintained by the Australian Accounting Standards Board, an Australian Government agency under the Australian Securities and Investments Commission Act 2001
AASB Australian Accounting Standards Board
ASX The Australian Securities Exchange
bn Billion
CAGR Compound annual growth rate
CFR Cost and freight rate
CFR cost
Operating costs of mining, processing, rail/road haulage, port, freight and royalties, including mining infrastructure service agreements with MinRes Group entities, direct administration costs, and apportionment of corporate and centralised overheads
Corporations Act
dmt
Corporations Act 2001 of the Commonwealth of Australia
Dry metric tonnes
EPS Earnings per share
Gross debt
Gross gearing
Total borrowings and finance lease liabilities
Gross debt / (gross debt + equity)
k Thousand
LTIFR
Lost Time Injury Frequency Rate
M Million
Net debt / (cash)
Gross debt less cash and cash equivalents. Includes finance lease liabilities
pcp Prior corresponding period
ROIC
T or t
TMM
TRIFR
TSR
Return on invested capital
Wet metric tonnes unless otherwise stated
Total Material Mined
Total Recordable Injury Frequency Rate per million hours worked
Total Shareholder Return being CAGR in gain from change in share price plus dividends paid
Underlying EBIT Earnings Before Interest and Tax adjusted for impact of one-off, non-operating gains or losses
Underlying EBITDA
Underlying PBT
Underlying NPAT
Earnings Before Interest, Tax, Depreciation and Amortisation adjusted for impact of one-off, non-operating gains or losses
Profit Before Tax adjusted for impact of one-off, non-operating gains or losses
Net Profit After Tax adjusted for after tax impact of one-off, non-operating gains or losses
US$ United States dollar
wmt
Wet metric tonnes
MINERAL RESOURCES LIMITED 2022 ANNUAL REPORT I 207
THIS ANNUAL REPORT IS DEDICATED TO EACH AND EVERY ONE OF OUR PEOPLE WHO ARE THE HEART AND SOUL OF OUR BUSINESS. 208 I MINERAL RESOURCES LIMITED 2022 ANNUAL REPORT
 Sinead Commerford | Electrician | Motocross Rider
 Amy Stewart | Tenement Officer | Baker
MINERAL RESOURCES LIMITED 2022 ANNUAL REPORT I 211 OUR FOCUS IS ON CARING FOR OUR PEOPLE – WHICH MEANS THEIR HEALTH, SAFETY AND WELLBEING IS ALWAYS OUR TOP PRIORITY.
212 I MINERAL RESOURCES LIMITED 2022 ANNUAL REPORT WE’RE DEDICATED TO FOSTERING INCLUSIVITY AND DIVERSITY – AND ACTIVELY ENCOURAGE INDIVIDUALITY. .
 Jasper Daruwala | Safety Advisor | Bollywood Actor
 Jerry Supan | Site Chef | Superyacht Chef
MY STORY
“There’s no such thing as a bad fishing day. The days when you don’t catch fish make the days that you come home with a bag all the more enjoyable, but it’s about more than catching fish. Being out on the water with whales breaching, flocks of birds wheeling and calling overhead, and nothing else but a horizon all around you is the space where I’ve done some of my best thinking. I’ve made a lot of the best decisions of my life sitting out in the ocean, staring at the sky and contemplating the endless energy of the swell.”

James McClements | Independent Non-Executive Chair | Cyclist
“The terrain may be different from place to place – and I’ve ridden the historic roads in Girona in Spain, the warm latitudes of Queensland, the picturesque coastline of Western Australia and everywhere in between – but the feeling in the peloton is always the same. From twisting mountainous roads to rolling hills in ancient forests, the peloton is a place of camaraderie, support, encouragement and sometimes competition. It keeps your mind healthy and your body peaking. And taking on a challenge like the Ride for Youth is the ultimate because it brings great mates, new friends and a rewarding goal all together.”
 MINERAL RESOURCES LIMITED 2022 ANNUAL REPORT I 215
Chris Ellison MNZM | Managing Director | Fisherman
MINERAL RESOURCES LIMITED 2022 ANNUAL REPORT I 215
Chris Ellison MNZM | Managing Director | Fisherman
Luke Calvert | Environmental Advisor | Army Veteran and Marine Biologist

“My story is a bit unusual. I was ocean-mad when I was young, drawing sharks and things all over the place, but then we moved inland and I almost forgot about the ocean. It wasn’t until I went to work on Heron Island, near the Great Barrier Reef, years later that my passion was reawakened. I became a scuba instructor before spending the next six and a half years in the army, thanks to the Global Financial Crisis. Then I earned a double major degree with Honours in environmental science and marine science and management. At the end of the day, I love all aspects of the natural world. Knowing that I am helping our industry maintain Western Australia’s biodiversity for future generations is what inspires me.”
Sharon Thomson | Recruitment Team Lead | Hockey Goalkeeper

“I started playing hockey when I was five years old and all I ever wanted was to play for Australia. These days it’s all about staying active and enjoying the game with my friends. Our team is a family, and I’ve known some of my teammates for 30 years. It’s more than friendship – we have each other’s back and we support each other no matter what. I’ve had a knee reconstruction and several knee surgeries, two broken collarbones, a broken arm, broken fingers, too many torn ligaments to count, and now I need a knee replacement. But I wouldn’t change a thing.”
Mark Wilson | Chief Financial Officer and Company Secretary | Black Belt Aikidoist

“Becoming the best version of myself is my goal, and my family is my motivation. I started practising Aikido in 1989. Peaceful resolution of conflict is a core aim of mine. I have learned the importance of understanding the position of others before responding, and to absorb an attack without losing my centre.”
Nicholas Bakker | Safety Advisor | Triathlete

“The Roman philosopher Seneca once said, ‘the body should be treated rigorously, that it may not be disobedient to the mind’ and that really resonates with me. I aim to be the best version of myself, physically and mentally, and challenging myself to persevere, to push through the pain and to focus on what’s happening is a fantastic way of getting in touch with the real me. I know now that the mind will want to quit long before the body does and that gives me strength. I aim to summit Everest before I’m 50, and I know I have the will to do it.”
Ryan Zammit | Electrician | Gamer
“Yeah, I’m a character in a huge live-action, role playing game I play called life. Because why have just one life when you can have many lives, right? My inspirations range from my secret yearning to pilot a faster-than-light spacecraft to dreams of defeating dragons, and the weird and wonderful specimens I meet in this gaming, anime and musical life. Of course, I work for MinRes so one of my major influences is metal!”
Mike Grey | Chief Executive - Mining Services | Antiquities Collector

“My wife Kelly has mentioned the word ‘hoarder’ more than once, but she fully supports my passion for collecting pre- and post-war farming equipment, military pieces, and various automotive collectibles. It’s a passion that stems from ensuring we preserve our proud history in farming and the military. It also gives me a wonderful excuse to travel around Western Australia fossicking among second-hand stores and farms and meeting new people. You can imagine with tractors and such we need a bit of space, so we’re building a dedicated storage and display facility on our property. Maybe my ‘hoarding’ will pay off yet!”

Joshua Thurlow | Executive General Manager - Project Development | Surfer

“My name is Josh and I am a surf addict. I have been since I was a kid in Queensland, and I’m pretty sure I inherited my love for the ocean life from my Dad. My favourite thing to do is to surf with my sister and my two brothers. My obsession has taken me all over the world, because every wave has its own unique signature and vibe, and the craving to surf a perfect wave perfectly can never be fulfilled. The joy is in the search. Surfing is so simple. It’s you, your board, the water and hopefully some family or friends.”
Emeritus Professor Colleen Hayward AM | Cultural Consultant | Lover of Sports and Culture

“Every piece of cultural knowledge that people pick up and internalise forms a thread of connection to Country –the more knowledge we share, the greater the connection. And it’s when we’re all truly connected that Australia becomes ‘home’. My dream is to help all Australians learn about my people, our past and our culture, and the wonderful thing is that so many people who weren’t taught that in school are hungry to learn more now. There’s so much we can learn from each other, and telling stories, sharing experiences like sport, which can be one of the few opportunities people get to really know Aboriginal people in a mutually supportive environment, is the key. I love my job.”
Angie Olsen | Site Administrator | LP Record Collector

“I was never a vinyl record person until my favourite band released a vinyl-only special edition album. I bought it and picked up a cheap little record player to play it on and I just fell in love with vinyl. I’m into punk and rock, and I got my love of 80s and 90s female rockers like Alanis Morrisette and Michelle Branch from my Mum. The single greatest moment of my life is easy – sharing a mic and singing with Billie Joe Armstrong of Green Day in 2016. I was in the front row, and he just picked me. It was amazing.”
Chris Soccio | Chief Executive - Iron Ore | Dog Man

“As expats living in Ukraine, we adopted Koko within the first two weeks of arriving in 2015. She was a skinny, mistreated street puppy who had been abandoned. She quickly became a member of the family and provided love and security to us. When we went on holiday to Queensland in February 2022, we had no idea that war would descend on the scale that it did. While challenging and not advised, I returned to get her. I’ll never forget the feeling of being reunited with her or the look on her face when she realised she was coming with me. That is the responsibility and joy of owning animals.“
Jason Hampton | Site Manager, Crushing and Processing | Vans Shoe Collector

“They call me ‘Hamster’, and they always have. My Mum bought me a pair of shoes Southern Californian sneaker company, Vans, when I was 13, and I’ve been wearing and collecting them ever since. I love the SoCal vibe and the memories of a sun-soaked youth in California my Vans awaken in me, and my obsession makes my friends laugh.”
Paul Brown | Chief Executive - Lithium | Gym Enthusiast
“The benefits of lifting are far more than physical, it helps me maintain a strong mind and improve my overall wellbeing. It takes a great deal of discipline and commitment to turn up to training at 5am, so it’s lucky we have a good crew for motivation, camaraderie and a few laughs as well. I think the key to my training is variety. Changing programs every three weeks allows me to mix it up and keep my workouts interesting.”

Jeremy Lozano | Site Chef | Basketballer

“Growing up in the Philippines, there was a basketball hoop on just about every street, and whether we had concrete or just ground under us, we played and played. That used to get us into trouble with my Dad, because we’d sneak out to play rather than do our chores. I still love the game, and I love the strategy and teamwork that it teaches you.”
Shelley Robertson | Executive General Manager Energy | Decorated Hero

“I learned a lot about myself when the Boxing Day tsunami that devastated so much of Asia turned our local Busselton beach into a churning, swirling rip. There were a lot of people on the beach that day, but I was the one who dived in to rescue an eight year-old boy, his father and 16-year old cousin. I found a resilience, a strength and determination in myself that day, and I learned that when it really matters, I’m a courageous leader. Every time I look at my Australian Bravery Decoration, I’m reminded of that.”
George Wan | Geographic Information Systems Officer | Bonsai Artist

“When I was a kid, I saw a bonsai book in a bookshop and thought it was just the most amazing wizardry! I nagged my parents to buy me the book and started tinkering with plants in our backyard. I chose Australian natives because I wanted to represent our unique landscape aesthetic within a traditional art form. The challenges of styling and maintaining Australian flora in small pots are very nuanced to each species. It’s been trial and (mostly) error. But when there’s success, the results are incredible. When I work on a tree, it’s an active meditation and a welcome escape. It provides much needed quiet mindfulness.”
Jenni Christiansen | Utilities | Karaoke Performer

“I’ve been singing since I could barely stand, starting with regular performances in my Aunt’s karaoke shop in the Philippines, and it’s always been an important part of my life. It’s karaoke that brought my mother and me back together when I came to Australia to join her at the age of 21, and helped us bond with our local Pinoy community. When I’m belting out ‘I’m every woman’ by Chaka Khan, or doing Whitney’s ‘Greatest love of all,’ I feel stronger, more confident and happy all at once.”
Lisa Bennett | Utilities | International Ms Australia 2022 - Open Heart Surgery Survivor

“Mine is a story of trauma, pain, intensity, commitment and triumph. I endured open heart surgery and went on to become Ms Australia International 2022. I got there because I challenge society’s beliefs about beauty, and I dare others to love their imperfections. If I can help just one person through a similar event, give them hope and courage, my struggle has been worth it.”

Bronwyn Grieve | Chief People and Shared Services Officer | Refugee Advocate
“Living and working in many countries around the globe, including some of the poorest, I’ve seen plenty of suffering and hardship. But I’ve also been overwhelmed by the generosity, the humour and the strong sense of community that can be shared by people who have so very little in the way of material possessions. Living in conflict-affected and fragile states has given me a keen appreciation of the life that refugees leave behind and a drive to focus on enabling people to thrive. It has also taught me a great deal about our common humanity and the importance of upholding good governance and building strong systems.”
Lauren Kenny | Onboarding Coordinator | Reptile Conservationist

“A lifetime of living and working with reptiles and educating people in their correct handling and care has helped to give me a great appreciation and understanding of our environment. Working with MinRes for over a decade has allowed me the luxury of exploring our astounding WA landscapes across the Pilbara and Goldfields, deepening my appreciation and attachment to our home. One day, I hope to make a major contribution to the sustainable future of our beautiful state by developing new technologies that could improve the lives of everyone, including our scaly mates.”
Mark Hughes | Employment Marketing Manager | 4WD and Camping YouTuber
“The day I made the decision to turn the video off private and share it with the world, everything changed. Suddenly there was an audience and I had engagement. I took it on though, and now I use multiple cameras and a drone, and it can get wild. When we decided to go through with our plan to drive the Holland Track a couple of days after Cyclone Seroja, I knew we were in for a challenge, and I was not wrong. Check it out on YouTube, we’re called Perth 4WD and Camping.”
Jasper Daruwala | Safety Advisor | Bollywood Actor
“My parents worked in Bollywood decorating some of the biggest, most colourful scenes, but that isn’t what drew me to acting. I’m curious about other people – that’s the essence of it for me. I’m interested in what it would be like to be you. Initially it was all about the stardom and the lifestyle Indian stars lived, but over the years it’s the acting itself that has become my passion. An actor never dies – you can watch an actor you always loved anytime as their art is at your fingertips in today’s digital world.”
Candice Burvill | Indigenous Engagement Advisor | Genealogy Enthusiast
“How could I not be fascinated by genealogy? My family’s history has such intriguing twists and turns – my ancestors are an incredible mix of Indigenous people, pastoralists, colonists, pearlers, warriors and even the son of WA’s most revered founder, John Septimus Roe. And yes, members of my family were among the Stolen Generation. Sometimes it’s hard knowing what my family has been through – George Harriot Roe never recognised my grandmother Clara Jackamarra as his daughter – but it’s a journey I need to take to find out who I am.”
Marco Octaviano | Gallery Manager and Social Media Specialist | Fashionista


“I’ve always embraced vulnerability and I strive to break away from trends or societal constructs of gendered fashion. Because to me, costume is expression. And my wardrobe evolution is an ongoing creative journey, fed and inspired by my knowledge of design, form, shape, colour, texture, scale, structure and meaning. My fashion is what I value and what I experience first, and what I feel second.”
Matthew Shaw | INX Administrator | Student Private Investigator
“Freddy Mercury once said, ‘If you see it, darling, then it’s there! With every single beat of my heart. Every single day of my life.’ And that sums me up as well. I want to be as fearless as Freddy and his successor in Queen, Adam Lambert. Growing up as a country boy I needed all the courage I could get, just to be me. I love that no one at MinRes looks twice at what I’m wearing, unless it’s to give me a compliment.”
Mandy Crowe | Executive Assistant | Sprinter

“It can be fun being the fastest kid in a small village. My parents encouraged us to be sporty – they set up a local athletics club for me to train when I was seven, and my brother became a top jockey. I moved to Australia to be coached by Peter Fortune, Cathy Freeman’s coach at the Victorian Institute of Sport. It was a steep learning curve for a 19-year-old. I trained in Melbourne, only returning to Ireland in summer to represent Ireland in competitions. I still train twice a day and live a clean life. I look forward to seeing what sports my daughter Maeve will pursue. Currently she is looking taller than my brother so becoming a jockey is probably not on the cards.”
Cilivia Moro Moriba | Senior INX Administrator | Human Rights Advocate

“I came to Australia as a child refugee from Kampala, Uganda in 1994. The sacrifices my mother made and her tenacity enabled me and my seven siblings to flourish in our new country, and she taught me about tempered feminine strength. I earned my degree in early childhood studies and have become an advocate for diversity and human rights. I dream of one day establishing a foundation that empowers refugee youths with confidence and understanding, and to help them adapt to environmental change.”
Clay Greenbank | General Manager Leadership and Performance | Traditionalist
“My den is my sanctuary. It’s a safe place filled with the tools from my Pop’s timber yard and a deer antler which reminds me of our primal instincts. I like to spend quality time in my den with my son. He’s a professional athlete and we talk about the sacrifices others have made which have paved the way for the success and opportunities he’s enjoyed. I want to teach him oldschool values like working-hard for the things you really want, treating others with kindness and being authentic.”
 Gabriel Laim | Project Geologist | Container-Home Designer

“You are what you came from, and I came from a hard but loving life in New Guinea, so I understand the value of what I call ‘simple elegance meets functionality.’ After I bought my first home, I discovered an inbuilt need to tinker and improve on it, and that led to experimenting with shipping container conversions. My forever home will be crafted of recycled containers, and I’m sure my mother, who sacrificed so much so I could have this life, would approve.”
Michael Pascoe | Enterprise Architect | Mathematician

“Numbers run in my blood. Generations of Pascoes have contributed to the field of engineering for over 150 years, and I chose to take a turn into pure mathematics. It’s a choice that’s given me an amazing multifarious career working in no less than 14 countries across six continents, including an incredibly rewarding stint with the United Nations. Now, I work for a Western Australian company making a difference locally because that’s an equation that really works for me.”
Daney Helgadottir | Health Services Administrator | Global Backpacker
“I came from the cold in search of sun, surf and love, and I found everything I could wish for here in Western Australia. After I lost my heart to a gorgeous West Aussie man at a music festival, I knew I’d found my new home.”

David Robin | Leading Hand Mechanical Fitter | Soccer Player

“For me, soccer is all about goals. I know that sounds kind of obvious, but I mean it’s about what I want to get out of it. When my friends and I started playing after school – I was nine at the time – it was all about winning. But now I see the pleasure the game itself can give. The strategy absorbs you, and the stresses of the day or the week just wash away because you’re involved.”
Phillip Falkingham | IT Support Officer and Chief Remote Pilot | Paladin-Bearer of Shadowmourne
“Playing high-end content within the game is great fun, but you can’t succeed alone. You need a team around you, supporting each other. If you want to go fast, go alone. If you want to go far, go together. You don’t have to be a genius to see how a lesson like that has impacted my life. And that’s just the meta-effect gaming has had on my life. On a practical level, it’s taught me the computer languages, given me my best friends and the best man at my upcoming wedding – and he’s the one who introduced me to MinRes.”
Michael Holland | Compliance Trainer | Generational Upholsterer

“We live in a prefab, cookie cutter disposable world, but I come from a family of artisans. I understand the values, pride and passion that come with practising a craft. As a second-generation upholsterer, I’m incredibly proud of the design, the art and skills my father has passed on to me. Upholstering is a sustainable craft that drives a circular economy, and the way it works informs my whole world view and inspires my work at MinRes.”
Kudzai Mukandiona | Graduate Land Access | Acoustic Guitarist

“Music is storytelling and when I play I feel like I’m telling a story. I embody all of my emotions into the song when I play. It’s a passion that I learned from my Dad – he got me hooked on Afro Jazz, and we’d spend hours listening to Oliver Mtukudzi, Hugh Masekela and others. So I learned to play some of their music, and when I do I feel like I’m back home.”
Dhiresh Adatia | Site Chef | Food Photographer


“I really admire close-up photos of food, especially in fine-dining settings. It’s inspiring to see the way they put the ingredients together and I can just imagine the hours and days of prep it has taken to create the dish. My most famous dish would be my pork belly – it takes two days to prepare and it’s the best pork belly you will ever eat. But being of Indian background, I can’t go past the meals my parents cook for sheer culinary delight.”
Barbara Zakrzewska | Geographic Information Systems Officer | Leadlight Artist
“I was always fascinated by kaleidoscopes, reflections and the way sun shines through colourful glass. But in grey and monotone communist Poland it was almost impossible to find good paints and brushes, not to mention doing glasswork. Sometime in my early teens I was able to get glass paints and started painting on windows and small glass panes. Creating is blissful. The process is pure joy. It feels like time doesn’t exist anymore. Working with other artists helps me focus and make time for my hobby. Sometimes I am inspired by nature, sometimes it’s the art of others and sometimes I just see designs in my mind.“

Simon Hibben | Field Assistant | Military Model Builder
“Building ships and military hardware, albeit very small scale models of very large and complicated machines, is an intricately detailed and engrossing pastime. It demands a steady hand, deep concentration and an appreciation for the ‘big picture’. When I’m occupied with my models, my mind is completely focused, and the worries of the day and the world don’t get a look in. It’s really superb for my mental health. So far I’ve completed six ships, five aircraft and a tank. My goal is to find and complete a 1/200 scale model of the Imperial Japanese Navy’s Yamato. It’s out there somewhere, waiting for me.”
Andrea Chapman | General Manager People | Dog Lover

“This is Lenny. I call him my forever baby. My children will grow up but little Len pup is my baby for life. Lenny, like me, is a fashion lover. His little jumper came from Tokyo and his collar from London. You can always see him grinning like a little clown, another thing we share in common, two peas (or clowns) in a pod.”
Sinead Commerford | Electrician, Crushing and Processing | Motocross Rider

“Riding a motocross bike is a buzz, that’s for sure. But for me it’s also calming and centring. It helps me clear my mind and focus. For a person like me with diagnosed ADHD and anxiety, that’s a huge benefit. Riding, whether competitively or just for the rush, has given me confidence, helped me conquer my fears, and overcome the depression that can come with my condition. It’s something I just love to do with my mates.”
Amy Stewart | Tenement Officer | Baker

“It begins with a sweet aroma that floats through the apartment, and it ends with big smiles and people licking their lips. That’s why I love baking cupcakes. My whole family are big on cooking, but it wasn’t until I moved away from them that I found my inner baker. Now I indulge in it whenever I can because it makes me feel creative. I know my colleagues at Project Services appreciate it when I turn up with a tray of delicious goodies. It’s a team spirit builder.”
Jerry Supan | Site Chef | Superyacht Chef

“I’ve been fortunate enough that my skills have taken me around the world many times as a seafaring chef, and I’ve seen some glamour in my time. I once cooked for the Sultan Qaboos of Oman onboard his superyacht, and I’ve sailed the seas and tempted the palates of passengers on the Cunard, Norwegian and Star cruise lines. All that excitement and affluence has taught me that it really is the simple things in life, learning new things and providing the best for my family, that truly matters.”

MINERAL RESOURCES LIMITED 2022 ANNUAL REPORT I 223MINERAL RESOURCES LIMITED 2022 ANNUAL REPORT I 223 TO ALL OUR PEOPLE, WE OFFER SINCERE GRATITUDE FOR THIS YEAR’S ACCOMPLISHMENTS.


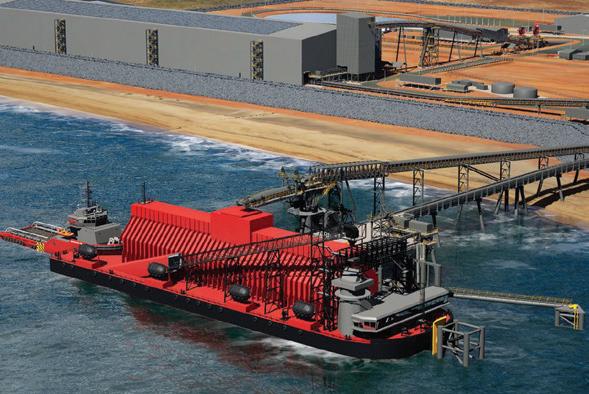

WE’RE DELIVERING WORLD-CLASS WORKING CONDITIONS FOR OUR PEOPLE - FROM OUR HEADQUARTERS, TO OUR SITES, TO OUR INNOVATIVE TRANSHIPPERS - WE’RE FOCUSED ON EMPLOYEE WELLBEING.


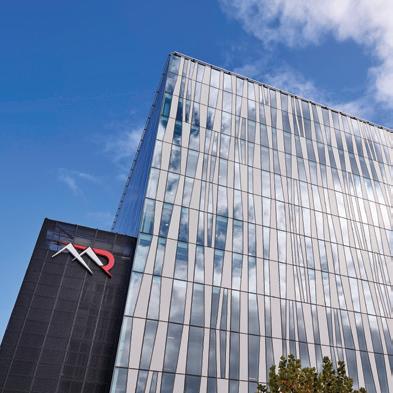


A: 20 WALTERS DRIVE, OSBORNE PARK WESTERN AUSTRALIA 6017
P: LOCKED BAG 13, OSBORNE PARK LPO, OSBORNE PARK, WESTERN AUSTRALIA 6017
T: +61 8 9329 3600
F: +61 8 9329 3601
E: RECEPTION@MRL.COM.AU
W: WWW.MRL.COM.AU
