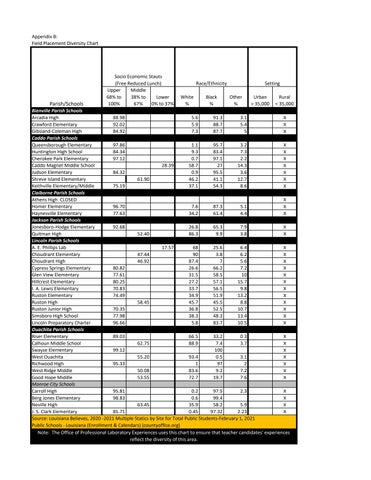
Source: Louisiana Believes, 2020 -2021 Multiple Statics by Site for Total Public Students-February 1, 2021 Public Schools - Louisiana (Enrollment & Calendars) (countyoffice.org)
Note: The Office of Professional Laboratory Experiences uses this chart to ensure that teacher candidates' experiences reflect the diversity of this area.
Upper 68% to 100% Middle 38% to 67% Lower 0% to 37% White % Black % Other % Urban > 35,000 Rural < 35,000 Bienville Parish Schools Arcadia High 88.98 5.6 91.3 3.1 X Crawford Elementary 92.02 5.9 88.7 5.4 X Gibsland-Coleman High 84.92 7.3 87.7 5 X Caddo Parish Schools Queensborough Elementary 97.86 1.1 95.7 3.2 X Huntington High School 84.34 9.3 83.4 7.3 X Cherokee Park Elementary 97.12 0.7 97.1 2.2 X Caddo Magnet Middle School 28.39 58.7 27 14.3 X Judson Elementary 84.32 0.9 95.5 3.6 X Shreve Island Elementary 61.90 46.2 41.1 12.7 X Keithville Elementary/Middle 75.19 37.1 54.3 8.6 X Claiborne Parish Schools Athens High CLOSED X Homer Elementary 96.70 7.6 87.3 5.1 X Haynesville Elementary 77.63 34.2 61.4 4.4 X Jackson Parish Schools Jonesboro-Hodge Elementary 92.68 26.8 65.3 7.9 X Quitman High 52.40 86.3 9.9 3.8 X Lincoln Parish Schools A. E. Phillips Lab 17.57 68 25.6 6.4 X Choudrant Elementary 47.44 90 3.8 6.2 X Choudrant High 46.92 87.4 7 5.6 X Cypress Springs Elementary 80.82 26.6 66.2 7.2 X Glen View Elementary 77.61 31.5 58.5 10 X Hillcrest Elementary 80.25 27.2 57.1 15.7 X I. A. Lewis Elementary 70.83 33.7 56.5 9.8 X Ruston Elementary 74.49 34.9 51.9 13.2 X Ruston High 58.45 45.7 45.5 8.8 X Ruston Junior High 70.35 36.8 52.5 10.7 X Simsboro High School 77.98 38.3 48.3 13.4 X Lincoln Preparatory Charter 96.66 5.8 83.7 10.5 X Ouachita Parish Schools Riser Elementary 89.03 66.5 33.2 0.3 X Calhoun Middle School 62.75 88.9 7.4 3.7 X Swayze Elementary 99.12 100 X West Ouachita 55.20 93.4 0.5 3.1 X Richwood High 95.33 1 97 2 X West Ridge Middle 50.08 83.6 9.2 7.2 X Good Hope Middle 53.55 72.7 19.7 7.6 X Monroe City Schools Carroll High 95.81 0.2 97.5 2.3 X Berg Jones Elementary 98.83 0.6 99.4 X Neville High 63.45 35.9 58.2 5.9 X J. S. Clark Elementary 85.71 0.45 97.32 2.23 X
Appendix B: Field Placement Diversity Chart
(Free Reduced Lunch) Race/Ethnicity Setting
Socio Economic Stauts
Parish/Schools