GRAMBLING 2018 ALT DATA DASHBOARD

Page 1

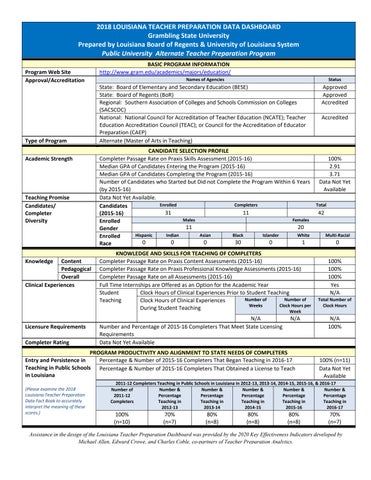
2018 LOUISIANA TEACHER PREPARATION DATA DASHBOARD

Grambling State University

Prepared by Louisiana Board of Regents & University of Louisiana System

Public University Alternate Teacher Preparation Program

National: National Council for Accreditation of Teacher Education (NCATE); Teacher Education Accreditation Council (TEAC); or Council for the Accreditation of Educator Preparation

That Began

(Please examine the 2018 Louisiana Teacher Preparation Data Fact Book to accurately interpret the meaning of these scores.)

Assistance in the design of the Louisiana Teacher Preparation Dashboard was provided by the 2020 Key Effectiveness Indicators developed by Michael Allen, Edward Crowe, and Charles Coble, co-partners of Teacher Preparation Analytics.

BASIC PROGRAM INFORMATION Program Web Site http://www.gram.edu/academics/majors/education/ Approval/Accreditation Names of Agencies Status State: Board of
and
Education (BESE) Approved State: Board of Regents (BoR) Approved Regional:
Accredited
Elementary
Secondary
Southern Association of Colleges and Schools Commission on Colleges (SACSCOC)
Accredited Type of Program Alternate (Master of Arts in Teaching) CANDIDATE SELECTION PROFILE Academic Strength Completer Passage Rate on Praxis Skills Assessment (2015-16) 100% Median GPA of Candidates Entering the Program (2015-16) 2.91 Median GPA of Candidates Completing the Program (2015-16) 3.71 Number of Candidates who Started but Did not Complete the Program Within 6 Years (by 2015-16) Data Not Yet Available Teaching Promise Data Not Yet Available. Candidates/ Completer Diversity Candidates (2015-16) Enrolled Completers Total 31 11 42 Enrolled Gender Males Females 11 20 Enrolled Race Hispanic Indian Asian Black Islander White Multi-Racial 0 0 0 30 0 1 0 KNOWLEDGE AND SKILLS FOR TEACHING OF COMPLETERS Knowledge Content Completer Passage Rate on Praxis Content Assessments (2015-16) 100% Pedagogical Completer Passage Rate on Praxis Professional Knowledge Assessments (2015-16) 100% Overall Completer Passage Rate on all Assessments (2015-16) 100% Clinical Experiences Full Time Internships are Offered as an Option for the Academic Year Yes Student Teaching Clock Hours of Clinical Experiences Prior to Student Teaching N/A Clock Hours of Clinical Experiences During Student Teaching Number of Weeks Number of Clock Hours per Week Total Number of Clock Hours N/A N/A N/A Licensure Requirements Number and Percentage of 2015-16 Completers That Meet State Licensing Requirements 100% Completer Rating Data Not Yet Available PROGRAM PRODUCTIVITY AND ALIGNMENT TO STATE NEEDS OF COMPLETERS Entry and Persistence in Teaching in Public Schools in Louisiana
(CAEP)
Percentage & Number of 2015-16 Completers
Teaching in 2016-17 100% (n=11) Percentage & Number of 2015-16 Completers
License to Teach Data Not
Available 2011-12 Completers Teaching in Public Schools in Louisiana in 2012-13, 2013-14, 2014-15, 2015-16, & 2016-17 Number of 2011-12 Completers Number & Percentage Teaching in 2012-13 Number & Percentage Teaching in 2013-14 Number & Percentage Teaching in 2014-15 Number & Percentage Teaching in 2015-16 Number & Percentage Teaching in 2016-17 100% (n=10) 70% (n=7) 80% (n=8) 80% (n=8) 80% (n=8) 70% (n=7)
That Obtained a
Yet

PREPARATION DATA DASHBOARD (CONT’D)

Grambling State University

Prepared by Louisiana Board of Regents & University of Louisiana System

Master of Arts in Teaching Alternate Teacher Preparation Program

PERFORMANCE AS CLASSROOM TEACHERS (NEW TEACHERS WITH LESS THAN TWO YEARS OF TEACHING) Impact on K-12 Students

(Please examine the 2018 Louisiana Teacher Preparation Data Fact Book to accurately interpret the meaning of these scores.)

Demonstrated Teaching Skill

(Please examine the 2018 Louisiana Teacher Preparation Data Fact Book to accurately interpret the meaning of these scores.)

Overall Impact and Demonstrated Teaching Skill

(Please examine the 2018 Louisiana Teacher Preparation Data Fact Book to accurately interpret the meaning of these scores.)

State Value Added Scores for New Teachers in Grades 4-8 with Less than Two Years of Teaching by Content Areas (Ten or More New Teachers)

(Please examine the 2018 Louisiana Teacher Preparation Data Fact Book to accurately interpret the meaning of these scores.)

Mean Compass Student Growth Score (2014-15, 2015-16, & 201617) and Number of Scores for All New Teachers with Less than Two Years of Teaching

Percentage and Number of 201415, 2015-16, & 2016-17 Compass Student Outcome Scores for the New Teachers by LDOE Teacher Effectiveness Levels

Mean Compass Professional Practice Score (2014-15, 2015-16, & 2016-17) and Number of Scores for All New Teachers with Less than Two Years of Teaching

Percentage and Number of 201415, 2015-16, & 2016-17 Compass Professional Practice Scores for the New Teachers by LDOE Teacher Effectiveness Levels

Mean Compass Final Evaluation Score (2014-15, 2015-16, & 201617) and Number of Scores for New Teachers with Less than Two Years of Teaching

Percentage and Number of 201415, 2015-16, & 2016-17 Compass Final Evaluation Scores for the New Teachers by LDOE Teacher Effectiveness Levels

Content Areas Mean, Number of Scores, & Effectiveness Levels for Value-Added Scores of Ten or More New Teachers with Less Than Two Years of Teaching who Taught During 2013-14, 2014-15, & 2015-16

Ineffective Effective Emerging Effective Proficient Highly Effective

Effective Emerging Effective Proficient Highly Effective

(Note: Data are not available –new assessments being developed.)

Ineffective Effective Emerging Effective Proficient Highly Effective

Effective Emerging Effective Proficient Highly Effective

2018 LOUISIANA
TEACHER
Compass Student Growth Mean & Number of Scores 3.2 (n=33)
Compass Teacher Effectiveness Levels for Student Growth Scores Ineffective Effective Emerging Effective Proficient Highly Effective 6% (n=≤10) 3% (n=≤10) 39% (n=13) 52% (n=17)
Compass Professional Practice Mean & Number of Scores 3.2 (n=33)
Compass Teacher
Levels
Scores Ineffective Effective Emerging Effective Proficient Highly Effective 0% (n=≤10) 3% (n=≤10) 73% (n=24) 24% (n=≤10)
Effectiveness
for Professional Practice
Compass Final Evaluation Mean & Number of Scores 3.2 (n=33)
Compass Teacher Effectiveness Levels for
Evaluation Scores Ineffective Effective Emerging Effective Proficient Highly Effective 0% (n=≤10) 9% (n=≤10) 61% (n=20) 30% (n=10)
Final
Mathematics N/A (n=N/A)
N/A% (n=N/A) N/A% (n=N/A) N/A% (n=N/A) N/A% (n=N/A) Science N/A (n=N/A)
N/A% (n=N/A) N/A% (n=N/A) N/A% (n=N/A) N/A% (n=N/A) Social Studies
Ineffective
N/A
N/A N/A N/A N/A English/Language Arts/Reading N/A (n=N/A) Ineffective
N/A% (n=N/A) N/A% (n=N/A) N/A% (n=N/A) N/A% (n=N/A)

Turn static files into dynamic content formats.

Create a flipbook
Issuu converts static files into: digital portfolios, online yearbooks, online catalogs, digital photo albums and more. Sign up and create your flipbook.