Energy Insights 2024


Compiled by Kenneth B. Medlock, III
This publication was produced in collaboration with Rice University’s Baker Institute for Public Policy. Unless otherwise specified, all calculations and estimates were made by the authors themselves. Wherever feasible, this research was reviewed by outside experts before it was released. Any errors are the authors’ alone.
This material may be quoted or reproduced without prior permission, provided appropriate credit is given to the author and Rice University’s Baker Institute for Public Policy. The views expressed herein are those of the individual author(s), and do not necessarily represent the views of Rice University’s Baker Institute for Public Policy.
© 2024 Rice University’s Baker Institute for Public Policy


Welcome to the first annual Energy Insights from the Center for Energy Studies at Rice University’s Baker Institute for Public Policy. The articles herein reflect a sample of the ongoing research at CES, each rooted in a programmatic research area. To be clear, these are not outlooks. Outlooks are a bit of a challenge to produce, and rarely are they actually predictive. Hence, we chose to refer to these articles as insights that can be used to better understand what may come to pass. While no one can predict exactly what comes next, if we are paying attention, the road we travel provides plenty of signposts that can be used to understand the challenges and opportunities ahead.
CES has an active year of research and programming ahead, with several conferences, roundtables, and workshops already planned that are in-line with the advancement of our initiatives and research programs as well as in coordination with other Rice University divisions, such as the Carbon Hub and the Rice Sustainability Institute. These include our sustainability roundtables with a focus on plastics, Latin American energy roundtables, Middle East energy roundtables, roundtables focused on the future of oil in energy transitions and on the evolution of liquified natural gas (LNG) markets, and roundtables exploring the future of fuels in mobility. For 2024, we are also planning our annual Energy Summit on Oct. 1–2, and a conference focused on the intersection of markets, policy, and technology on Aug. 29. Additionally, we will be preparing a series of post-election briefs discussing the outcomes of the U.S. elections and the opportunities presented.
We will also be releasing several programmatically focused research publications, including analysis of U.S. LNG export policy, electricity reliability, hydrogen market developments, the potential of nature-based carbon sequestration, microplastics and per- and polyfluoroalkyl substances (PFAS), energy transition commitments, mining in Latin America, methane emissions abatement, and much more. Suffice it to say, the next 12 months will be busy, and the conversations will be dynamic.
In the meantime, I hope you find this content useful, and that it will motivate you to stay involved in the conversation. If you have any questions, please do not hesitate to reach out. I look forward to seeing you soon at the Baker Institute.


KENNETH B. MEDLOCK, III, PH.D.
James A. Baker, III and Susan G. Baker Fellow in Energy and Resource Economics, and Senior Director, Center for Energy Studies
The history of energy research at Rice University’s Baker Institute dates to its founding in 1993. The principle of comparative advantage was a basis for the establishment of core pillars around which to build the institute’s research programs. Given the Baker Institute’s location in the energy capital of the world — Houston, Texas — energy was identified as foundational. From that vision, the Energy Forum was formed to bring together thought leaders in the energy world to discuss some of the most important challenges facing industry, government, and society.
In 2012, after an almost two-decade track record of success in engaging leaders around the world, the energy research program was reimagined. Under new leadership, the Center for Energy Studies (CES) was established to formalize an expansion of energy research at the Baker Institute into new and evolving dimensions. The Energy Forum was maintained within the CES as a vehicle for engagement with donors — through conferences, workshops, and roundtable events — on energy markets and policy, geopolitics, energy education, and important energy-related environmental issues. In forming the CES, a new program structure was created to diversify the research portfolio to address an expanding set of issues facing stakeholders in energy, as well as deepen interactions across the Rice University research ecosystem.
Since 2012, the CES has expanded upon its historically leading research efforts in geopolitics — with a focus on Eurasia, Latin America, and the Middle East — and global oil and natural gas. It has also built significant new programmatic strengths in sustainability and resilience, minerals and materials, transportation, electricity, and new energy technologies. Today, the CES is home to over 50 affiliated fellows, scholars, staff, graduate students, and postdoctoral researchers who provide critical insights on the world’s complex and evolving energy landscape. By conducting data-centric research and nonpartisan analysis rooted in fundamental principles, the CES provides a trusted voice that investigates the drivers of energy market evolution, including but not limited to market design, policy and regulation, technology adoption, climate change, sustainability objectives, and geopolitics.
In 2023, CES began the process of launching five cross-cutting initiatives to address materials transitions, regional perspectives on transitions, sustainability, the future of fuels, and the future of oil and gas (Table 1). Already, these initiatives have led to new institutional relationships that will enhance the depth of research and breadth of connectivity with stakeholders across industry and government.
Research Programs
Electricity Markets and Policy
Energy, Minerals, and Materials
Global Natural Gas
Global Oil
New Energy Technologies
Energy and Geopolitics in Eurasia
Regional
Energy and Geopolitics in the Middle East
Latin American Energy
Sustainability and Resilience
Transportation
Note: Programs are organized alphabetically.
Cross-Cutting Initiatives
Materials Transitions
Regional Perspectives on Transitions
Sustainability
The Future of Fuels for Mobility
The Future of Oil and Gas
Materials Transitions: A variety of material inputs are essential for legacy and new energy technologies. As a result, supply chain challenges associated with energy transitions are present in multiple dimensions. Understanding the depth of these challenges, and the opportunities they present, is at the core of materials transitions and requires research that spans the periodic table, covering the elements, minerals, and materials key to modern economies. This initiative is focused on understanding where binding constraints will manifest and how new material innovations could alleviate them. In some cases, this includes innovations that are critical for circularity along supply chains; in others, it involves materials innovations, such as advanced carbon materials, that introduce entirely new supply chain elements. A primary goal of this initiative is to elevate discourse on the deep linkages among energy, materials, and sustainable growth.

Sustainability: In the broadest sense, a sustainable outcome is one that can be maintained without disruption. Thus, sustainability is multifaceted and rooted in resilience. This connects the entirety of research at CES. This initiative aims to highlight why we must always consider higher order impacts of specific actions to understand implications for sustainability. Understanding first order impacts is never enough because the law of unintended consequences is ever-present, and often predictable. Sustainability requires a balance of environmental, socioeconomic, and financial/commercial dimensions — three legs on a stool that support a sustainable development platform. Ultimately, there are trade-offs that must be considered, and an adequate cost-benefit analysis requires a systems-level approach. Importantly, innovation, market design, and policy are the reinforcing crossbars that stabilize the entire system. Failure to think in this way is akin to neglecting the importance of all parts of the system, yet everything must work in harmony to generate sustainable outcomes.

Regional Perspectives on Transitions: To date, discussions about energy transitions have been largely dominated by developed nations’ perspectives. However, the global energy future is a developing nation story. Energy demand is rising fastest in the developing world, and it is largely driven by hydrocarbon fuels. To begin, the shares of global energy use are disproportionate to the distribution of the global population and more in line with levels of economic development. As of 2023, the world’s most economically advanced nations, the countries of the Organization of Economic Cooperation and Development (OECD), accounted for 37.1% of global energy use and 17.1% of global population, while the rest of the world, the non-OECD, accounted for 62.9% of global energy use and 82.9% of global population, many of whom are severely underserved.1 Altogether, this reflects a significant unrealized potential for future demand growth, as well as different perspectives on energy. The future, like the past, will look different everywhere, and it will hinge on resource endowments — nature, minerals, energy, human capital, capital availability, etc. — as well as various political, institutional, or aboveground features that will either hinder or promote economic advancement. Thus, it is important to understand how the principle of comparative advantage will manifest when considering future energy market outcomes.
The Future of Fuels for Mobility: Transportation constitutes roughly a third of total energy use and about a quarter of global emissions, and leverages an existing infrastructure base that is heavily interconnected through deep, well-developed global supply chains worth trillions of dollars. Policies and regulations targeting transportation technologies and fuels have profound impacts on global supply chains that underpin global commerce. Hence, suboptimal decisions risk significant economic dislocation, raising several important questions that demand an answer:

• What is the best pathway for avoiding emissions across each mode of transportation?
• What are the costs and benefits of displacing legacy fuels and internal combustion engine designs?
• What are the key factors, including supply chains and logistics, influencing the economic attractiveness of each fuel/energy option with attendant risks and uncertainties?
Our scope includes all modes for moving passengers and freight, as well as heavy-duty vehicles for utilities, mining, construction, and other uses. This will enable the identification of trade-offs along supply chains for fuel/energy choices across modes of transportation, and provide a data-driven, analytical basis for positive — rather than normative — assessment of different options.
The Future of Oil and Gas: Crude oil and natural gas are widely used raw material inputs for a variety of energy services — transportation, power generation, industrial process heat, space heating, etc. — and other basic commodities and intermediate goods — petrochemicals, plastics, lubricants, asphalt, solvents, adhesives, medical devices, electronics, etc. Crude oil and natural gas are distinctly different commodities with different end uses and marketed applications; however, they are:
1. Depletable resources.
2. Products of similar extraction processes.
3. Ubiquitous materials across the global economy.

Thus, they present an interesting opportunity to understand the challenges and opportunities that new technologies face in energy transitions. Given the prevalence of predictions that a peak in demand for hydrocarbon fuels is eminent, it is critical to understand the factors that will influence the production, distribution, and use of both crude oil and natural gas, and any residual impacts of such changes to the global energy system.
The journey of energy research at the Baker Institute is far from complete, and its successes are a testament to the fellows, scholars, graduate students, postdoctoral researchers, and staff who have contributed time and energy to maintaining the highest of standards to deliver data-driven research while striving to elevate, not advocate, research findings. CES is widely recognized for its depth and insight, having been ranked at the top of the energy field by the University of Pennsylvania’s Think Tanks and Civil Societies Program for three consecutive years before being named a “Center of Excellence.” CES is also a past recipient of the United States Association for Energy Economics’ (USAEE) prestigious Adelman-Frankel Award for “unique and innovative contributions to the field of energy.”2 CES fellows and scholars have also been individually recognized domestically and internationally, and their experience and expertise span a wide range of backgrounds — from strategic and analytical roles in industry, to regulatory roles in government, to practicing energy and environmental law, to fieldwork in journalism, to various roles in academia, to appointments and affiliations at research institutions around the world — providing a unique, multidisciplinary, and global perspective on energy-related issues.
Some of the most challenging questions faced by society today require a holistic approach to achieve environmentally, socially, and economically sustainable answers. By working across programmatic strengths in an interdisciplinary manner, CES fellows and scholars aim to elevate discourse and achieve workable, scalable solutions. The interdisciplinary team of CES fellows and scholars is frequently called to provide briefings to U.S. government officials, world leaders, and top industry professionals on a variety of issues. In the last decade, CES experts have delivered 20 congressional testimonies and worked with members of the U.S. House of Representatives and Senate and various federal agencies, including the Department of Energy, Department of State, Department of Defense, and Department of Commerce. They have also conducted an average of 23 ministerial-level briefings per year spanning 43 countries.
The collective research of CES fellows and scholars reveals several core principles tcore principles underscoring CES’ work and highlights risk and highlights risks and opportunities in an evolving global energy ecosystem.
Since its establishment, research conducted by experts at CES has led to a tremendous library spanning all CES programmatic disciplines. This has provided a foundation of critical insights that are guiding lights for future research, enabling us to identify challenges and opportunities for all stakeholders across the energy domain — from policymakers to commercial actors to the general public. It is precisely these types of insights that have focused CES research on the following core principles across a breadth of research focused on energy transitions.
Energy transitions are complex. Developments across the energy landscape in the last two decades highlight the fact that understanding the global interconnectedness of energy markets — and the factors that shape them — is growing ever more important. Technological change, economic growth, environmental preference, geopolitics, energy trade, energy poverty, and energy security concerns are all interwoven with national welfare and domestic economic priorities. The future of energy involves trade-offs, and successful transition pathways will fully consider environmental, social, and financial sustainability.
Energy transitions will look different everywhere. Globally, hydrocarbons account for over 80% of all energy, and demand continues to grow.3 Developing economies have accounted for all incremental demand since the turn of the century. The energy mix from region to region varies widely, with economic and population growth, national security priorities, innovations in the production and use of all energy sources, and native natural, physical, and human capital resource endowments all playing formative roles in defining regional risks and opportunities. These factors also foretell a future of energy that will continue to be different everywhere.
Economics matter. Assessments of the long-term market implications of new energy technologies must incorporate full system costs of adoption and operation. Failing to account for the fixed cost of deployment, operating costs, costs associated with maintaining system reliability, and costs of any nonpecuniary externalities can result in unintended consequences ranging from environmental damage and social inequity to financial insolvency. New technologies must avoid burdensome fixed costs of adoption if they are to integrate into supply chains successfully, or they risk falling into the valley of death. Coproducts can provide additional value for new technologies, which raises the possibility for things such as carbon-to-value innovations to accelerate a portfolio of scalable low-carbon energy options.
Supply chains matter. Supply chains connect raw materials to manufacturing to delivery of final products through end-of-use. Efficient supply chain function is heavily dependent on transportation infrastructure. Actors along any supply chain must coordinate to ensure resilience and reliability, and commercial returns must be positive to support long-term viability. Otherwise, the supply chain breaks down, and economic health is compromised. Transitioning to lower-carbon supply chains will require new infrastructures as well as optimization of various transportation modes and their respective fuel requirements to ensure long-term resiliency and economic health.
Energy transitions require material transitions. Hydrocarbons are critical to supply chains for advanced materials for wind, solar, electric vehicles, batteries, and countless other technologies. Sustaining a modern way of life requires plastics, advanced composites, resins, lubricants, and more. Even the most conservative energy transition scenarios represent a call on minerals and materials. Existing supply chains will be pressed to meet these demands. Improvements in the material intensity of current activities and the development of new, advanced materials will be critical for any energy future.
Infrastructure is central to any energy future. The legacy of existing infrastructures and energy delivery systems is the foundation for change in the capital-intensive energy market. Energy systems are large and must scale to accommodate growth and expanded access. Energy infrastructure is long-lived, turning over on a multidecadal time frame. Emerging technologies can drive cost improvements and signal how energy sources will compete. But investment in new (greenfield) and existing (brownfield) infrastructure is the vehicle for the deployment of new technologies. So, infrastructure investment will dictate the pace of innovation and change across the energy landscape.
Sustainability is multifaceted. Sustainability is deeply integrated with supply chains, weaving through raw materials production, manufacturing and production of final goods, and distribution of intermediate goods throughout production process and final goods into market centers, use of final products, and endof-life into waste or re-“X” streams.4 New innovations, regulatory interventions, and policy prescriptions may promise more environmentally sustainable systems. But social acceptance, including affordability, is a prerequisite for any new product development, and positive returns on invested capital will drive growth and investor focus. Hence, environmental, social, and financial sustainability will be a hallmark of successful transition pathways.
Innovation and growth will shape the future of energy. The two largest drivers of transitions in energy markets since 2000 are the shale revolution in the U.S. and the steep rise in demand in developing Asia. The U.S. shale revolution is a story of technical and process innovation, and demand growth in Asia was due to tremendous economic growth. Innovation and growth have always been the core drivers of transition in energy systems. Nations that embrace innovation and growth see the welfare of their citizens improve and their industries thrive.
1. Energy Institute (EI), Statistical Review of World Energy, 2024, https://www.energyinst.org/statisticalreview.
2. United States Association for Energy Economics (USAEE), “Awards,” https://www.usaee.org/aws/ USAEE/pt/sp/awards.
3. EI.
4. Re-“X” innovations (recycle, refurbish, repurpose, reuse, etc.) are critical for circularity along supply chains, which can ease stress on supply chains.
5. Carbon Hub, Rice University, https://carbonhub.rice.edu/; Rice Sustainability Institute, Rice University, https://si.rice.edu/
6. The Middle East Energy Roundtable is a joint endeavor with the Baker Institute Edward P. Djerejian Center for the Middle East (https://www.bakerinstitute.org/middle-east-energy-roundtable).
7. The annual Energy Summit is co-hosted with Baker Botts (https://www.bakerbotts.com/); 2024 will be the eighth in the series. The conference focused on markets, policy, and technology is co-hosted with the Energy Institute at the University of Oklahoma (https://www.ou.edu/price/energyinstitute).


JULIE A. COHN, PH.D.
Nonresident
Scholar, Center for Energy Studies, and Research Historian, Center for Public History, University of Houston
On Jan. 14, 2025, the Texas Legislature will once again gather in Austin for its biennial regular session, and electric power will once again catch the attention of lawmakers. Between now and then, Texans can look forward to a long hot summer and the early weeks of winter. How will the power grid do?
Following the disastrous Winter Storm Uri in February 2021, freezes and heat waves have kept Texans focused on the power system and questions of reliability. In 2021, the legislature passed several measures to harden the Texas grid against freezes and to improve communications with customers and between state regulatory agencies. In 2023, the legislature adopted measures to finance new dispatchable energy resources. While these actions have improved grid resilience in the face of hard freezes, vulnerabilities lie ahead, and lawmakers are sure to debate how to address them.1
At least six different developments are unfolding to affect the reliability of the Texas Interconnected System, operated by the Electric Reliability Council of Texas (ERCOT) and the regional distribution networks operated by regulated utilities:
1. Summer and winter weather extremes: Texas is experiencing unprecedented weather throughout the year: deep freezes annually across the state, spring heat waves, record-breaking sequences of high temperatures during the summer, disastrous storms, and short shoulder seasons.
2. Intertwined natural gas and electricity networks: While there are tight dependencies between natural gas production and electric power generation, the two networks are regulated by different state entities.
3. Expansion of renewables and congestion on transmission lines: Wind and solar installations are located in regions of the state far from centers of electricity use, and the transmission lines in between are experiencing congestion.
4. New electricity demand: Electric vehicle (EV) recharging is on the rise, while cryptocurrency miners, AI data centers, and microchip manufacturers, among other industries, are coming to Texas. All require large quantities of electric power, adding to the need for more installed generation very soon.
5. Increases in variability of electricity generation and reliability challenges: As the share of renewables increases, variability increases, and this requires sufficient dispatchable generation for reliable service.
6. Isolation of the Texas grid: Members of the U.S. Congress are pushing to connect Texas either to the Eastern or Western Interconnection. 2
Each of these developments poses challenges to the stability and reliability of the Texas grid, and all have historical analogs, both regionally and nationally.3
The planners for the Texas grid have important questions to address regarding anticipated weather extremes:
• Will there be enough energy?
• Will power be available when and where it is needed?
• Is the state prepared for extreme weather events?
• Are regional distribution utilities prepared for extreme weather events?
Texas is not alone in facing these challenges as other states have likewise experienced extremely hot and dry summers, wildfires, polar vortexes, and other weather conditions that have tested their regional power systems. While system operators in Texas and elsewhere may be improving preparations for the next unusual weather system, it is difficult to imagine and model every contingency.4 Much like the unanticipated cascading power failures of the late 20th and very early 21st centuries, unprecedented weather extremes have taken grid planners by surprise in recent years.5 Following major blackouts, the utilities hardened the grid, strengthened coordination, adopted new operating standards, and, eventually, acquiesced to federal oversight of reliability. Following Winter Storm Uri, grid planners in Texas and across the country reassessed their demand projections, and regulators called for improved winterization of power systems. But are the safeguards introduced during the prior two legislative sessions in Texas adequate to prepare for future weather emergencies? The state managed through the extreme cold that gripped Texas from Jan. 14–17 in 2024, which may bring a sense that the grid is ready. However, that event was not as extreme as Winter Storm Uri, so the grid has not yet been tested to the same extreme.
More recently, spring and summer storms have caused widespread and lengthy power outages in Houston and other areas, which is also related to the resilience of distribution networks. This has introduced new concerns about preparedness and recovery that have rightly attracted the attention of state leaders. Proposals to address distribution level failures include burial of power lines, replacement of older and weaker aboveground infrastructure, and enhanced tree and brush trimming requirements. Wealthier Texans are taking matters into their own hands by installing generators and energy storage batteries as backup power options. Meanwhile, policymakers will continue to weigh various proposals that could impact broad ambitions for increased electrification. Underneath it all is a set of fundamental questions whose answers will ultimately dictate next steps, such as: How can Texas best assure a reliable and resilient power system, even as weather and storm patterns shift? What will it cost? Who will pay for it? And through what mechanisms?
Reports investigating the causes and effects of Winter Storm Uri revealed the very tight interdependencies between natural gas production and distribution networks and between electric power generation and transmission networks. While some natural gas production and distribution equipment froze, Winter Storm Uri is not the first time producers have experienced wellhead freezeoffs. In fact, natural gas volumes in storage should have been sufficient to blunt the worst of the impacts
ULIE A. COHN, PH.D.
on production. But a critical failure in coordination contributed to the disastrous failure. Compressor stations along natural gas pipelines need power to function. But natural gas pipeline operators had failed to identify themselves as critical load, which would have ensured that they continue receiving power during forced outages. No power to compressor stations meant no gas could move in the pipelines. No gas moving in the pipelines meant no gas was available to power plants. The intertwined nature of gas and power is now well understood by different stakeholders, so hopefully Uri served as a wake-up call. Regardless, these shortcomings contributed to the lengthy forced outages on the Texas grid, and there appears to have been very little coordination between the various actors in the gas and power systems, particularly at the regulatory level.6
Looking back at more than 140 years of electrification in the United States, we see other examples of intertwined energy networks, including coal and power during World War I, access to hydroelectricity for war production during World War II, and shifts in generation resources during the 1970’s energy crises, to name just a few.7 Electrification has always depended on continuous access to sufficient energy resources. During Winter Storm Elliott in 2022, shortcomings in the integration of gas and electric power systems on the East Coast again exacerbated tenuous grid conditions. In Texas, in 2021 after Winter Storm Uri, the legislature established committees and councils to bring about gas and power coordination.8 But separate state agencies regulate each industry, and the ways in which they are integrated are relatively opaque. Thus, the question remains: How well are the intrastate gas and power networks working together today?
Texas now leads the rest of the country in the installed capacity of both wind and solar power generation. Most of this capacity is in the western, northernmost, and southernmost parts of the state — areas of low population and lots of windy and sunny days. There is potential for much, much more — with combined wind and solar capacity due to increase by more than 30% in the next year.9 But ERCOT is already curtailing production on occasion when wind and solar generation are very high because the transmission network is simply not large enough in the right places to move this renewables-based electric power to the users in the central and eastern parts of Texas. It is a chicken-and-egg problem: Should investment in generation follow transmission, or should investment in transmission follow generation?
The 2005 Competitive Renewable Energy Zones (CREZ) initiative illustrates that legislation establishing new renewables targets, creating priority investment zones, and defining transmission corridors can succeed at addressing this chicken and egg problem.10 The question currently facing the legislature, as was the case in 2005, is whether to promote more renewables and transmission, more traditional generation and colocation with power users, or some combination of both. Beyond that, if the state intervenes, how should this be accomplished? With the experience of CREZ behind us, we can see that a wide array of issues will be at stake: cost and the funders, speed of transformation, environmental protection, new demand, landowner rights, and grid reliability. Resolution will not likely be quick or easy.
Texas offers a very attractive home for a wide array of power-hungry industries — including cryptocurrency mining, AI data centers, logistics centers, and microchip manufacturers, plus growing EV charging. ERCOT is already predicting a greater than 25% increase in demand over the next 10 years, with peak demand increasing by 78%.11 At the same time, some of these electricity users are ideal candidates for participating in demand-side management programs on the grid. That is, without severely harming their own production, they can halt their electricity demand from the grid during short periods to help balance generation and load. In fact, this can be profitable for them. But a central question remains: Where will these emerging economic drivers for Texas obtain their electric power?
At various points during the last century, the need for more power, quickly and in certain locations, drove innovation — especially expansion of power pools and methods to operate interconnected power plants continuously.12 Today, emerging technologies that range from energy storage devices to grid-connecting devices may increase grid efficiency, and innovations may produce similar effects on the customer side of the meter. While the elected officials in Austin court new industries and tout the state’s benefits, they are also likely wondering if there will be enough electricity, and where and when it will be available. Just as importantly, it is important to understand whether current market frameworks inhibit or enhance technical innovation. These questions are already on legislators’ minds, as evidenced by various interim charges.13
At the same time that demand for electricity increases in Texas, and intermittent renewable capacity grows, there has been little recent investment in dispatchable sources of generation. As an ongoing trend, this threatens to undermine grid stability. Both the variability of wind and solar power and the fact that neither provides inertia to support the balance of load and generation on a grid are problematic. While options are available to remedy both intermittency and inadequate inertia, policy decisions at the highest level will influence whether generators, transmission companies, and the grid operator adopt new approaches.14 From investment in new dispatchable generation and energy storage capacity, to new longdistance transmission, to encouragement of siting generation close to load centers, the future stability and reliability of the Texas grid can be improved. How the legislature takes up these issues will frame Texas’ potential for continued economic health and growth.
It is not uncommon for explanations of the 2021 power outages to cite the isolation of the Texas grid as a factor. While it is true that the outages lasted longer in Texas than in the surrounding states, it is also true that neighboring regions experienced electricity shortages as well. Texas does have small, direct-current links to the Eastern Interconnection and to Mexico, but these lines were curtailed periodically throughout the week of the winter storms. We do not know what the electricity landscape might have looked like had Texas utilities built and maintained interconnections with the eastern or western grids over the past 80 years. We do know that efforts to achieve this in the 1970s failed, and studies completed shortly before and after that time forecast additional costs and reliability concerns for Texas power customers. Members of Congress recently proposed bills to require development of these links. With federal legislation on the table, Texas legislators may seriously reconsider what connection (using direct current lines) or interconnection (using alternating current lines) might mean for the state. Complex technical, infrastructural, land use, governance, reliability, and economic issues abound. But it would not be beyond the scope of the legislature, the Public Utility Commission (PUC), ERCOT, and the industry to apply their collective knowledge and research abilities to help all of us understand whether isolation is beneficial or detrimental for Texas power customers.
In summary, there are several developments across the power generation landscape that have potentially major implications for ERCOT. Notably, while ERCOT is highlighted here, many of these issues translate to other regions. So, other regions will likely take note of what legislators and market regulators do in Texas. In the end, successful resolution of the various issues will carry significant benefits for existing Texas industrial, commercial, and residential consumers and have implications for the longer-term economic attractiveness of Texas. Suffice it to say, eyes will be, and should be, on the Texas legislature in the coming session.
JULIE A. COHN, PH.D.
1. For a summary of workshop proceedings focused on the issue, see Kenneth B. Medlock III and Shih Yu (Elsie) Hung, “Resource Adequacy in ERCOT: How Long-Term Market Design Reforms Could Enhance Reliability” (Houston: Rice University’s Baker Institute for Public Policy, December 12, 2022), https:// doi.org/10.25613/8PEA-N556.
2. The isolation of the Texas grid is the topic of the “Connect the Grid Act,” introduced by Rep. Greg Cesar (D-Texas) (“H.R. 7348 — 118th Congress [2023–2024],” congress.gov, accessed July 19, 2024, https://www.congress.gov/bill/118th-congress/house-bill/7348/text).
3. Notably, most of these issues are discussed at length in several Baker Institute publications. See Peter R. Hartley, Medlock, and Hung, “ERCOT and the Future of Electric Reliability in Texas” (Houston: Rice University’s Baker Institute for Public Policy, February 7, 2024), https://doi.org/10.25613/EP4GKW61; and Hartley, Medlock, and Hung, “ERCOT Froze in February 2021. What Happened? Why Did It Happen? Can It Happen Again?” (working paper, Rice University’s Baker Institute for Public Policy, February 2, 2022), https://www.bakerinstitute.org/research/ercot-froze-february-2021-whathappened-why-did-it-happen-can-it-happen-again. For a later edition of the report focused on the freeze in February, see Hartley, Medlock, and Hung, “The Texas Deep Freeze of February 2021: What Happened and Lessons Learned?,” Economics of Energy and Environmental Policy 12, no. 2 (September 2023): 5–29.
4. ERCOT issues monthly outlooks and seasonal assessments for resource adequacy (“Resource Adequacy,” https://www.ercot.com/gridinfo/resource).
5. For reports on the two largest blackouts in the United States, see Federal Power Commission, Northeast Power Failure, November 9 and 10, 1965: A Report to the President (Washington, DC: Government Printing Office, 1965); and U.S. Department of Energy and Natural Resources Canada, U.S.-Canada Power System Outage Task Force, Final Report on the August 14, 2003 Blackout in the United States and Canada Causes and Recommendations, (April 2004), https://www3.epa.gov/ region1/npdes/merrimackstation/pdfs/ar/AR-1165.pdf.
6. Hartley, Medlock, and Hung, “ERCOT Froze in February 2021.”
7. Julie A . Cohn, “Historical Cases for Contemporary Electricity Decisions” (Houston: Rice University’s Baker Institute for Public Policy, February 11, 2020), https://doi.org/10.25613/2DP6-6H47; Cohn, “Connecting Past and Future: A History of Texas’ Isolated Power Grid” (Houston: Rice University’s Baker Institute for Public Policy, December 1, 2022), https://doi.org/10.25613/dpmy-r389.
8. S.B. 3 established the Texas Reliability Council, the Texas Electricity Supply Chain Security and Mapping Committee, and requirements for coordination and collaboration between the Texas Railroad Commission and the Public Utility Commission of Texas (S.B. 3, 87th Leg., Prior to Reg. Sess. [Tx. 2021], https://legiscan.com/TX/text/SB3/id/2335915).
9. See ERCOT, “Resource Adequacy.”
10. See Olivera Jankovska and Cohn, “Texas CREZ Lines: How Stakeholders Shape Major Energy Infrastructure Projects” (Houston: Rice University’s Baker Institute for Public Policy, November 17, 2020), https://doi.org/10.25613/261m-4215
11. ERCOT, “Load Forecast,” https://www.ercot.com/gridinfo/load/forecast; Claire Hao, “ERCOT CEO: Texas Power Grid Can Meet Unprecedented Electricity Demand Growth,” Houston Chronicle, April 24, 2024, https://www.houstonchronicle.com/business/energy/article/ercot-grid-demandincrease-19416568.php
12. Cohn, Matthew Evenden, and Marc Landry, “Water Powers: The Second World War and the Mobilization of Hydroelectricity in Canada, the United States, and Germany,” Journal of Global History 15, no. 1 (March 2020): 123–47. This publication is also available on the Baker Institute’s website (https://doi.org/10.1017/S1740022819000366).
13. For the full list of these interim charges, see “2024 Interim Legislative Charges,” April 11, 2024, https:// www.ltgov.texas.gov/wp-content/uploads/2024/04/2024-Interim-Legislative-Charges.pdf
14. Researchers at the CES have examined these issues in detail and offer numerous recommendations for improving grid reliability in Texas; for example, see Hartley, Medlock, and Hung, “ERCOT and the Future of Electric Reliability in Texas.”


GABRIEL COLLINS, J.D.
on Energy and Geopolitics in Eurasia, Center for Energy Studies
Baker Botts Fellow in Energy and Environmental Regulatory Affairs, and Head of Program
For most of the last 15 years, energy transition discussions were dominated by a small circle of American and Western European academics and policymakers hyperfocused on a rapid energy transition away from fossil fuels for the globe. These individuals’ aspirations were global, extending to developing countries that are desperate for more reliable and affordable energy to fuel economic development and raise living standards for their citizens. Key Asian partners, including China, India, Indonesia, Bangladesh, Pakistan, and others, were lectured on the evils of coal, the bleak future of oil as a transportation fuel, and the looming demise of natural gas at the hands of wind and solar. After several years of a slowly growing crescendo, the world apart from the Organization for Economic Co-operation and Development (OECD) now increasingly makes clear that it will speak with its own voice and pursue a different path than that advocated in Brussels or Washington.
Four things shattered postindustrial energy illusions and palpably transformed the climate and energy conversation:
1. The COVID-19 pandemic shook every corner of the planet. Certain observers’ 2020 energy conclusions — for instance, accelerated peak oil demand — proved woefully inaccurate within months of the global vaccines’ rollout.1
2. Russia-Ukraine War continues to perpetuate the biggest supply-side energy shock since the 1973 Oil Embargo and commensurately emphasizes energy security as a critical concern across the globe. 2 Despite its malign actions, Russia remains a systemically critical global energy player and among other things; the impacts of its evolving energy trade relationship with China will reverberate globally.3
3. Some of the world’s biggest energy consumers — including China, India, and the United States — suffered summer heat waves and droughts that pushed electricity demand to record levels.4
4. The developing world, including many countries in Asia, increasingly demand that developed nations’ policy advocacy stop treating the economic and environmental needs of the developing world as an afterthought.
Seven billion people living outside the OECD who need jobs, water, food, and light today will not wait. And the principle of comparative advantage will, as it always has, play a critical role in the paths countries take. A passage from a report my colleague Michelle Foss and I co-authored in early 2022 rings stronger than ever today:
Ambitious leaders seek to not only address the “kilowatt-scale” problem of alleviating individual citizens’ energy poverty, but also to power industrialization programs that require tens of gigawatts (or more) of power per country. In pursuit of their goals, they will use the resources most available to them. For Nigeria, Mozambique, and Tanzania, that will be gas, as Nigerian Vice President Yemi Osinbajo explained in an August 2021 Foreign Affairs essay. Ethiopia will rely on hydropower, even though the Grand Ethiopian Renaissance Dam stokes conflict with Egypt and Sudan. China, India, Indonesia, South Africa, Botswana, and others will likely lean most heavily on abundant and secure domestic coal.5
As such, the idea that global energy trajectories can be dictated from Brussels or Washington is naively hubristic, at best — and destructive, at worst.
At the individual level, energy poverty breeds water and food poverty, and the tragedy of elevated mortality from preventable disease — a burden that often falls most heavily on children.6 At the national level, measures that make it harder to access some forms of energy — such as the U.S. Department of Treasury’s general opposition to multilateral development banks’ financing natural gas projects — will backfire.7 Cheaper and dirtier coal will fill the void as leaders choose carbonaceous heat and light over clean energy poverty.8 Non-OECD countries are ground zero for emissions restraint and then for reduction efforts because even if the OECD achieved net-zero today, non-OECD emissions would still equal what the entire world emitted in the late 1990s — when climate concerns were already on the ascent.
The confluence of empirical realities like economics, physics, and thermodynamics, with moral and fairness imperatives has driven an awakening among leaderships across our Eurasian and non-OECD partners. Recent U.N. Conference of the Parties (COP) summits and the Cambridge Energy Research Associates’ 2024 CERAWeek event demonstrate that political and economic decision-makers from the non-OECD world have become far less apologetic about their needs for energy abundance and the ways they will fulfill it, starting with the most affordable, energy-dense, and secure resources.9
For some, this may be hydro, but for many, it is coal, gas, oil, or some combination of the three. Indonesia, a vital U.S. partner, illustrates the case: It aims to massively build out solar and geothermal energy production but simultaneously plans to utilize abundant domestic coal resources as a multidecadal transition fuel. The clarity that our non-OECD interlocutors bring to the conversation deserves a more prominent place in American and European energy transition deliberations.
So, what do these converging trends suggest we should expect in 2024 and 2025? As Aramco CEO Amin H. Nasser put it in a March speech at CERAWeek, “The energy transition narrative will increasingly be written by the Global South.”10 Key places to watch include:
• India , where baseload coal anchors a system that now has roughly 110 gigawatts of renewables and growing.
• Indonesia , which is a coal powerhouse with a nickel mining center for EV batteries and is gearing up to become a global carbon storage hub.
• China , which now has installed a terawatt combined of wind and solar capacity while still ramping up coal output and moving to dominate EV and renewables supply chains and manufacturing. Compounding matters, several energy issues have become securitized amid an intensifying global great power competition between the U.S. and China.11 The stakes could not be higher.12
Global gas market dynamics on both ends of Eurasia will also profoundly affect energy decision-making, as Europe continues compensating for lost Russian imports by importing liquified natural gas (LNG) on the spot market while Chinese and other higher-income Asian buyers sign long-term contracts. Heat waves or cold snaps that spike gas demand, driving up global LNG spot prices, could push more
consumers in developing Asia back toward coal. Chinese energy policy recognizes that a successful energy transition will require the country to leverage abundant coal resources, given that power grid stability is a key dimension of energy security and climate adaptation resilience.13 Indian Prime Minister Narendra Modi, recently elected for a third term, has in recent years emphasized the continuing importance both of coal and gas even as India continues large-scale pursuit of nonfossil energy sources.14 Furthermore, Vietnam reached record levels of coal use in early 2024, again reflecting the collision between long-term energy transition aspirations and the need for energy to fuel growth and human wellbeing in the present.15
Necessity forces a reconciliation between aspiration and reality. Asia in 2024 and 2025 will continue moving past the luxury beliefs held by some opinion shapers in parts of the OECD who have forgotten that the comfort and prosperity they now enjoy was built — and remains maintained — by energy abundance, mostly from carbon. To be clear, American and European policies will have shaping influence on the future of energy, especially with regard to trade patterns, international capital flows, innovation, and market designs that affect technology uptake. But, in and of itself, that is nothing new. When it comes to who is in the driver’s seat, the Global South — led by Asia — is at the wheel for at least the next 18 months and likely far beyond.
1. Noah Browning, “Pandemic Brings Forward Predictions for Peak Oil Demand,” Reuters, last modified April 21, 2021, https://www.reuters.com/business/energy/pandemic-brings-forward-predictionspeak-oil-demand-2021-04-21/
2. Gabriel Collins, Anna B. Mikulska, and Steven R. Miles, “Winning the Long War in Ukraine Requires Gas Geoeconomics” (working paper, Rice University’s Baker Institute for Public Policy, August 4, 2022), https://www.bakerinstitute.org/research/winning-long-war-ukraine-requires-gas-geoeconomics
3. Andrew S. Erickson and Collins, “Putin’s Ukraine Invasion: Turbocharging Sino-Russian Collaboration in Energy, Maritime Security, and Beyond?,” Naval War College Review 75, no. 4 (Autumn 2022): 1–36, https://digital-commons.usnwc.edu/nwc-review/vol75/iss4/8
4. Collins and Gopal Reddy, “How China’s Water Challenges Could Lead to a Global Food and Supply Chain Crisis” (Houston: Rice University’s Baker Institute for Public Policy, November 14, 2022), https:// doi.org/10.25613/526F-MR68
5. Collins and Michelle Michot Foss, “The Global Energy Transition’s Looming Valley of Death” (Houston: Rice University’s Baker Institute for Public Policy, January 27, 2022), https://doi.org/10.25613/Y18QPM32.
6. Collins, “Energy Poverty and Water-Driven Mortality,” Texas Water Intelligence, November 23, 2020, https://texaswaterintelligence.com/2020/11/23/energy-poverty-and-water-driven-mortality/.
7. U.S. Department of the Treasury, “Guidance on Fossil Energy at the Multilateral Development Banks,” August 16, 2021, https://home.treasury.gov/system/files/136/Fossil-Fuel-Energy-Guidance-for-theMultilateral-Development-Banks.pdf.
8. Collins and Miles, “Why Is Europe Not Replacing Russian Pipeline Gas with Long-Term LNG Contracts?” (Houston: Rice University’s Baker Institute for Public Policy, September 13, 2023), https:// doi.org/10.25613/3FRC-FA56.
9. U.S. Congress, Senate, U.S.-China Economic and Security Review Commission, China’s Energy Plans and Practices: Hearing Before the U.S.-China Economic and Security Review Commission, 117th Cong., 2nd sess. (March 17, 2022) (statement of Gabriel Collins, “China’s Energy Import Dependency:
Potential Impacts on Sourcing Practices, Infrastructure Decisions, and Military Posture”), https://www. uscc.gov/sites/default/files/2022-03/Gabriel_Collins_Testimony.pdf
10. “SPEECH: Remarks by Amin H. Nasser, Aramco President and CEO, at CERAWeek, Houston,” Aramco Life, March 19, 2024 https://www.aramcolife.com/en/publications/the-arabian-sun/articles/2024/ week-12/speech-amin-nasser-at-ceraweek-2024
11. Collins and Erickson, “U.S.-China Competition Enters the Decade of Maximum Danger: Policy Ideas to Avoid Losing the 2020s” (Houston: Rice University’s Baker Institute for Public Policy, December 20, 2021), https://doi.org/10.25613/T3FG-YV16
12. Erickson, Collins, and Matt Pottinger, “The Taiwan Catastrophe: What America — and the World — Would Lose If China Took the Island,” Foreign Affairs, February 16, 2024, https://www.foreignaffairs. com/united-states/taiwan-catastrophe.
13. “Qiushi Magazine: Accelerating the Construction of a New Energy System and Enhancing Energy Resource Security Assurance Capacity” (加快建设新型能源体系 提高能源资源安全保障能力), Communist Party of China National Energy Administration Leading Group (中共国家能源局党组), June 1 2024, https://www.nea.gov.cn/2024-06/01/c_1310776840.htm; National Climate Change Adaptation Strategy 2035 国家适应气候变化战略2035, translated by Georgetown University’s Center for Security and Emerging Technology, https://cset.georgetown.edu/publication/national-climate-changeadaptation-strategy-2035/. For the original Chinese version of the document, see https://www.gov.cn/ zhengce/zhengceku/2022-06/14/5695555/files/9ce4e0a942ff4000a8a68b84b2fd791b.pdf
14. Press Trust of India, “‘Historic milestone’: PM Praises India’s Record Coal, Lignite Production,” India Today, last modified April 2, 2024, https://www.indiatoday.in/business/story/pm-modi-praisesindias-record-coal-lignite-production-calls-it-historic-milestone-2522007-2024-04-02; “India Is Emphasizing the Development of Environmentally Conscious Energy Sources to Enhance Our Energy Mix: PM Modi,” Narendra Modi, February 6, 2024, https://www.narendramodi.in/text-of-primeminister-narendra-modis-address-at-inauguration-of-india-energy-week-2024-goa-579039
15. Gavin Maguire, “Vietnam’s Coal Use and Emissions Set New Records,” Reuters, last modified June 5, 2024, https://www.reuters.com/markets/asia/vietnams-coal-use-emissions-set-newrecords-2024-06-05/

TED LOCH-TEMZELIDES, PH.D.
Rice Faculty Scholar, Center for Energy Studies, and the George and Cynthia Mitchell Professor in Sustainable Development, Department of Economics, Rice University
Germany has been the economic powerhouse of post-World War II Europe. Over several decades, other European countries looked to Germany for ways to improve efficiency and develop their own economies. This might not be the case any longer. Indeed, when it comes to energy policy, Germany is perhaps the developed country whose recent policies are the most difficult to rationalize. As energy is central to a country’s prosperity, the implications of a misguided energy policy have been far-reaching, with Germany now being one of the world’s worst economic performers among major developed economies. Here we will touch on two major pillars of the German energy sector’s inefficiency, and on their implications for the country’s future economic performance, which will be formative for the overall European economic and energy landscapes.
Relying almost exclusively on Russia to supply Germany with natural gas through the Nord Stream pipelines is likely to be considered as one of former Chancellor Angela Merkel’s biggest policy mistakes, although policies aimed at shutting Germany’s nuclear plants is another major error. Despite the country’s strong focus on decarbonization, the disruption of Russian supplies after the onset of Russia-Ukraine war resulted in Germany having to run its lignite-fired power plants for longer than expected, providing a signal that short-term energy reliability is as important a factor as reducing emissions in the longer term.1
The reliability-emissions reduction conundrum is showing up in Germany’s long-term planning as well. Recently, Germany has taken steps to displace coal in its generation fleet with natural gas, despite the unlikely resumption of supplies from Russia. In order to limit resistance from powerful environmental groups that oppose any kind of investment in nonrenewable energy sources, the German government has been marketing the new gas power plants as climate-friendly since they are expected to be converted to burning renewable-produced hydrogen at some point in the future.
All of this sits against the backdrop of Germany pursuing one of the most ambitious plans for renewable energy adoption in the world. However, the energy transition — or “Energiewende” in German — has not been the panacea anticipated by its proponents.
The fundamental principles of economics are hard to escape. When demand exceeds supply, prices rise. The German economy is very dependent on the manufacturing sector as an engine of growth, and high energy prices are damaging for industry. Moreover, electricity prices in Germany are unlikely to decline any time soon as the adoption of electric cars and the planned expansion of hydrogen production will significantly increase future electricity demand. This will require significant growth of new generation capacity that will need to be demand responsive.
The popular view in Germany — arguing that a faster switch to renewable power should make electricity cheaper since levelized costs for renewable energy have been declining — appears unfounded. Given intermittency-related limitations associated with wind and solar, maintaining a reliable energy system requires additional investments in a mix of energy sources that can dispatch when needed — such as natural gas and batteries — as well as infrastructure to transmit new power sources efficiently. As a result, levelized renewable generation costs are only a fraction of the costs associated with the transition to renewable energy. 2 Large-scale battery storage and gas-fired or even coal-fired power plants need to be available and utilized when renewable energy production falls short due to the vagaries of the weather, which contributes to higher total system costs. To be clear, high energy prices in Germany have been part of the energy transition debate even before the energy crisis resulting from Russia’s war on Ukraine. Selected energy-intensive companies have enjoyed subsidized electricity prices to ensure competitive production. But smaller businesses and households are subject to electricity prices that are among the highest in Europe.
Despite the strong push for renewable energy, fossil fuel continues to be a large part of German electricity production. As of 2023, oil is still Germany’s largest domestic energy source (35.2%), followed by natural gas (23.9%), renewables (22.8%), coal (16.0%), and everything else (2.2%).3 So, fossil fuels account for 75% of Germany’s energy use, which is down from 81% in 2010, when Energiewende received legislative support. To be clear, the consumption of fossil fuels has declined by about 24% over the last 10 years, but that is largely in line with the observed reductions in overall energy use in Germany.
On the production side, Germany is almost entirely import dependent for its oil and gas needs, but it produced a little more than half of the coal it consumed on an annual basis in 2023.4 Germany also imports coal for power generation and steel production. Ironically, the closure of Germany’s entire nuclear fleet, which was finalized in 2023, is likely to keep its coal plants active for some time, or at least until sufficient gas-fired capacity can be brought online, which will serve to increase the country’s overall import dependence.
Pipelines from Norway and the Netherlands plus liquified natural gas (LNG) from the U.S. have become Germany’s main sources of natural gas supply. But, while the EU imposed sanctions on oil imports from Russia, no such ban was placed on LNG deliveries. As a result, Russia’s LNG deliveries to Europe in 2023 were on par with those from Qatar and Algeria. Thus, the EU has partially substituted Russian pipeline gas with more expensive Russian LNG. Given the connectedness of the EU gas market, this has direct implications for Germany. Moreover, this trend is expected to continue in the coming years, which will likely stoke ongoing debates centered on energy security and transitions.
Given its ability to make or break governing coalitions in Germany, the Green Party has had a remarkable influence on the country’s energy policy in recent years. The priority to phase out nuclear energy and fossil fuel as soon as possible and at any cost has been at the heart of the party’s political agenda. At the same time, other than the ideological belief that renewables will solve all of Germany’s energy problems,
TED LOCH-TEMZELIDES, PH.D.
there has not been a clear plan on how to deal with limitations imposed by intermittency, limited storage, and tight electricity transmission. Through political discourse, this ideological belief has also penetrated large parts of German society, who deem the phasing out of all nonrenewable energy sources almost as an existential necessity.
In 2021, nuclear energy accounted for about 12% of Germany’s annual electricity production.5 Despite their strong safety record and the increased geopolitical uncertainty associated with other forms of energy, these nuclear plants were shut down prior to their scheduled end-of-life, right around the time when they were needed the most. To make up for this loss, Germany’s utilities must now rely on coal-fired and gas-fired plants to bring dispatchable power to the grid whenever intermittent renewable resources — wind and solar — are not available. As noted above, the cost of back-up generation resources that are required to bring grid stability when intermittent resources are present is not factored into levelized cost of electricity (LCOE) calculations.
An additional challenge concerns the transmission of electricity; again, the cost of additional transmission for renewables is typically ignored by those claiming low levelized costs of renewable power. The green energy transition of the size and scope undertaken in Germany creates a significant challenge since large amounts of green energy need to be transported from coastal regions in the north to the large demand sinks in urban and manufacturing areas throughout Germany. It is projected that the size of Germany’s grid will have to double as a result.6 Yet, only about 1,740 km out of the estimated needed 12,234 km of new power lines were completed as of June 2023.7 As in many places around the world, the construction of new transmission lines faces local opposition. For instance, the new electricity line bringing wind power from the north to industry in the south has faced resistance by local communities. As a result, the line will have to be underground, delaying its completion and increasing costs. It seems that the not-in-my-back yard resistance is a powerful force, even in Germany.
The forceful antinuclear and antifossil fuel stance of the Green Party and some of the Social Democratic Party of Germany appears to boil down to one or more of the following arguments:
• First, a full and speedy transition to renewables is considered essential in order to fight climate change, which is viewed as an existential threat.
• Second, nuclear energy is viewed as fundamentally unsafe.
• Third, it is believed that a speedy and full transition to renewables is the fastest way to German energy independence.
• Fourth, proponents often advocate that a first-mover advantage will both make Germany a technology leader in renewable technologies and provide an effective moral example for other countries to follow.
There are several problems with these arguments.
To begin, Germany is already quite energy efficient and creates a relatively low yearly flow of carbon emissions. In fact, Germany accounts for 1.5% of global emissions and 15.6% of European emissions. Moreover, emissions in Germany have declined by about 24% over the last decade, meaning the lowestcost emissions reductions have largely already occurred.8 Hence, actions Germany takes have relatively little impact on global emissions, while potentially imposing a significant cost.
Paradoxically, as it produces no carbon emissions, nuclear energy could be an important tool in the fight to reduce emissions. Nuclear energy in Germany has an excellent safety record, and several of Germany’s close neighbors have plans to pursue nuclear energy production for decades to come, with some of these power plants to be sited very near the German border. While nuclear power will continue to be imported to Germany, the plants themselves will not be under the control of German electricity authorities.
Regarding energy independence, it is a notion that has persisted in import-dependent nations for decades, and policies championing domestic energy sources have been advocated accordingly. This has not been solely in the interest of renewables; it was a root for expanded use of coal in the past, in the Germany as well as countries such as the U.S. The idea that a rapid scale-up of renewable energy sources, in and of themselves, can lead to energy independence is problematic. Intermittency alone
requires other resources to be available to balance the grid, which requires dispatchable sources of power that can be maintained for significant periods of time. Moreover, a significant fraction of energy is not electricity; it is heat. This disqualifies battery storage from being able to handle the entirety of the issue, at least until long-duration storage options are available and scaled and everything is electrified. Neither of these is likely to be a reality in the near term, and cost is a consideration. Admittedly, one could argue that dependence on foreign-sourced natural gas and LNG, oil, and coal compromise Germany’s energy security, but sources of supply matter and dependence on Russian gas has declined. Dependence on foreign-sourced fossil fuel is likely to remain for a while. The portfolio of supplies also matters, and the emergence of the U.S. a major gas supplier has significant energy security benefits.9
Lastly, due to labor costs, a rigid regulatory regime, and expensive input prices, the development and production of renewables are already taking place outside Germany. It is unlikely that Germany will be able to compete with China in renewable technology manufacturing in the future. These same high energy and labor costs threaten the German auto industry’s hopes to expand production and export of EVs. The lack of key minerals, processing capability, and supply chains needed for EV batteries also means high dependence on China-dominated supply chains.
The resulting backlash and general dissatisfaction with the experience of the past several years have boosted support for Germany’s extreme-right Alternative for Germany (AfD) Party, which is poised to be a powerful contender to lead Germany in the future, something that was unthinkable a few years back. Several German businesses appear to have had enough and have announced plans to close and/ or relocate at least part of their operations outside the EU. Volkswagen and Mercedes are examples of companies that have taken steps to address rising costs and made significant new investments in the U.S. recently, and industrial player Badische Anilin und Soda Fabrik (BASF) announced layoffs and plant closures in 2023 due to high energy costs.10 The trend is expected to continue and has sent shockwaves through Germany, which has historically prided itself on being the manufacturing powerhouse of the EU.
The price environment and associated economic malaise are not unique to Germany; they are affecting all of Europe. Moreover, they are not the result of Russia’s invasion of Ukraine. That violation of sovereignty has certainly inflicted a significant humanitarian crisis and deepened issues on the continent. But meager economic performance and relatively high energy prices were features of EU economies prior to the Russian invasion of Ukraine. According to World Bank data, from 2013–21 in inflation adjusted terms, the average annual growth of GDP in the U.S., EU, and Germany was 2.32%, 1.57%, and 1.23%, respectively.11 So, growth in Germany has not only been lower than that of the entire EU, but it has also been significantly lower than the U.S. for a decade. The invasion served to bring a brighter light on issues that were already bubbling under the surface.
Political economy considerations in Germany have made the green transition an ideological affair. When technological and market constraints are ignored in favor of unrealistic aspirations and dogma, reality has a way of kicking back. In Germany, this has resulted in persistent economic underperformance, the fear of growing industrial weakness due to high energy prices, and the potential of political instability through the rise of the extreme right. Given that, especially after Brexit, Germany is at the core of Europe, the consequences for the EU and for the entire continent are far-reaching. To be sure, there is nobility in striving for better environmental outcomes, but if economic health is sacrificed, the backlash will be palpable. How things are playing out in Germany is a reminder that balance matters.
TED LOCH-TEMZELIDES, PH.D.
1. For more on the impact of the cut in Russian gas supplies on the EU and Germany, see Gabriel Collins, Anna B. Mikulska, and Steven R. Miles, “Winning the Long War in Ukraine Requires Gas Geoeconomics” (working paper, Rice University’s Baker Institute for Public Policy, August 4, 2022), https://www.bakerinstitute.org/research/winning-long-war-ukraine-requires-gas-geoeconomics; Collins, Kenneth B. Medlock III, Mikulska, and Steven R. Miles, “Strategic Response Options If Russia Cuts Gas Supplies to Europe” (Houston: Rice University’s Baker Institute for Public Policy, February 11, 2022), https://doi.org/10.25613/32SK-5588; and Medlock, Mikulska, and Luke (Leelook) Min, “Natural Gas Balance in Europe: Germany as a Case Study” (Houston: Rice University’s Baker Institute for Public Policy, December 7, 2022), https://doi.org/10.25613/8SKH-J217.
2. This point is expounded in multiple publications. See, for example, Robert Idel, “Levelized Full System Costs of Electricity,” Energy 259 (November 2022): 1–11, https://doi.org/10.1016/j.energy.2022.124905.
3. Energy Institute (EI), Statistical Review of World Energy, 2024, https://www.energyinst.org/statisticalreview.
4. International Energy Agency, “World Energy Balances,” https://www.iea.org/data-and-statistics/dataproduct/world-energy-balances.
5. Percentages are calculated from data in the EI’s 2024 Statistical Review of World Energy
6. Vera Eckert, “Germany Needs to Double Its Renewable Energy Output-Grids,” Reuters, last updated January 29, 2021, https://www.reuters.com/article/idUSL1N2K410K/
7. International Trade Administration, “Energy,” in “Germany — Country Commercial Guide,” last modified December 6, 2023, https://www.trade.gov/country-commercial-guides/germany-energy
8. EI.
9. See, for example, Medlock, Amy Myers Jaffe, and Meghan O’Sullivan, “The Global Gas Market, LNG Exports and the Shifting US Geopolitical Presence,” in “US Energy Independence: Present and Emerging Issues,” ed. Jaffe, special issue, Energy Strategy Reviews 5 (December 2014): 14–25, https://doi.org/10.1016/j.esr.2014.10.006.
10. See, for instance, “What If Germany Stopped Making Cars?,” The Economist, July 31, 2023, https:// www.economist.com/business/2023/07/31/what-if-germany-stopped-making-cars; and “Germany’s BASF to Shed 2,600 Jobs in Cost-Cutting Drive,” Associated Press, February 24, 2023, https://apnews. com/article/basf-se-germany-business-98a44b0766efea7c85ce0da22a30d827.
11. Growth rates are calculated from the World Bank’s “World Development Indicators” (https://datatopics.worldbank.org/world-development-indicators/).


JIM KRANE, PH.D.
Wallace S. Wilson Fellow for Energy Studies, and Co-Director, Middle East Energy Roundtable, Center for Energy Studies
For the Middle East, the energy-climate dilemma is causing a shift in strategy. Oil-producing countries along the Persian Gulf are at the epicenter of the energy transition, but its slow pace suggests difficult times in coming decades rather than in the next year or two. Economic risks from softening oil demand loom largest, but others — including the potential reduction in strategic importance to Washington and rebalancing of domestic social contracts — add further exposures. On the plus side, the region holds attributes that give it an edge in cleaning up emissions. But it remains to be seen how assiduously regimes in the Middle East will pursue decarbonization.
The tensions are fundamental. The countries lining the Persian Gulf host the greatest and most accessible quantities of oil and gas resources in the world. Successful development has rendered Gulf economies and governance systems intensely reliant on energy revenues. On average, 70% of government budgets and 30% of GDP arise from oil and gas exports, although those figures vary greatly by country and year.1
The Gulf region is also on the leading edge of changes in the climate. The heatwave of 2016 sent temperatures in Kuwait and Iraq to 129.2 degrees Fahrenheit (54 degrees Celsius), the highest-ever reading in the eastern hemisphere. 2 Further warming in one of the world’s hottest regions means that global decarbonization must be prioritized to maintain livability. Emissions from the Gulf countries are substantial, even in comparison with major economies. On a per capita basis, the Gulf Cooperation Council (GCC) countries emit more than the United States (Figures 1 and 2).
Gulf societies have developed energy intensive lifestyles over the past five decades based on cheap — generally subsidized — fuels and energy services. Relative to GDP, the world’s top subsidizers of fossil fuels are mainly in the Gulf, led by Iran. The effects on demand have been stunning. Saudi Arabia ranks No. 41 by population, but is the world’s No. 4 oil consumer, surpassing Japan, Russia, Brazil and Germany (Figure 3).
Consumer subsidies are notoriously difficult to retract. Gulf governments managed partial reforms starting in 2014, which began to moderate oil demand, but growth returned in 2021 as COVID-19 pandemic effects dissipated.
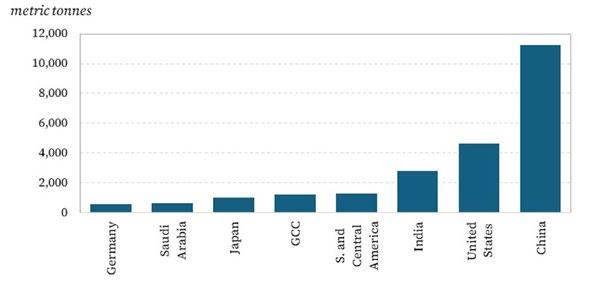
Source: Energy Institute, “Statistical Review of World Energy 2024.”
Note: Gulf Cooperation Council (GCC) does not include Bahrain.
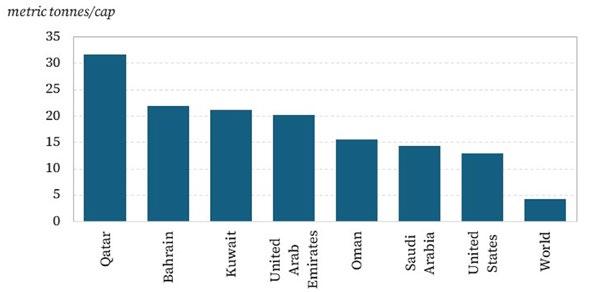
Source: World Bank, World Development Indicators, 2024.
JIM KRANE, PH.D.
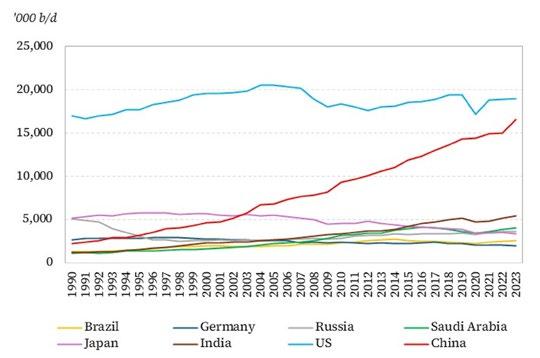
Source: Energy Institute, “Statistical Review of World Energy 2024.”
Alongside these challenges, the already sharp tempo of geopolitical crisis formation in Middle East has surged to brink levels in the past year. Wars focused on Israel and its occupied territories have bled into neighboring countries and sea lanes. Shipping costs and travel durations for the Gulf’s export-oriented economies have rendered their products less competitive in some markets, particularly liquified natural gas (LNG) bound for Europe. Longer term, the transition away from fossil fuels suggests a downgrade in the region’s strategic importance to the developed world.
In short, the Gulf region is the world’s key hydrocarbon supplier and reserves holder, a major consumer and subsidizer of fossil fuels, an early victim of the changing climate, and a global hub of armed conflict. As such it remains difficult to envision successful intervention on greenhouse gas emissions without concerted action by major Gulf governments, such as Saudi Arabia, the United Arab Emirates (UAE), and even Iran. As such, it is highly likely that global interest in the Gulf’s energy-climate travails will only increase.
Of course, with challenges come opportunities, and Gulf countries harbor big advantages that could render them ideal destinations for investment in energy transition technologies.3 These include copious solar radiation and vacant land, along with carbon-sequestering attributes, such as clustered emissions next to geological storage sites, and expertise and investment capital targeting hydrogen. Buildouts of renewable power generation and low-carbon hydrogen production, along with carbon capture and storage capacity, are in the nascent stages in the Gulf. A concerted push — if it happens — could diversify a preeminent oil supply region into a preeminent carbon management region.
Crafting workable policies to deal with the Gulf’s transition dilemma will require international support. In recognition of this and to ensure a voice at the table, Gulf policymakers have openly joined deliberations around the international climate agenda. For nearly 20 years, Gulf governments have pledged to build out renewable power and reduce emissions of carbon dioxide and methane. Early pledges were based around ambitious goals in solar and nuclear power generation. Later, further commitments were enshrined in the 2015 Paris Agreement and the subsequent announcements of net-zero carbon emissions by 2050 by the UAE and Oman or 2060 by Saudi Arabia, Kuwait, and Bahrain.
The evolution of stated goals, aspiration, and reality in the Middle East is characterized by a few targets being hit, but most targets being missed, with new targets being announced. For instance, did Abu Dhabi reach its 2008 goal that 7% of its power generating capacity be provided by renewable sources by 2020? Yes, it did. Did Saudi Arabia build the 23.9 gigawatts of solar generation capacity it promised by 2020? No, it did not.4 Strategies are evolving and include a variety of technologies.
Middle East governments often assign climate policy to their energy ministries and, if they have one, national oil companies. Saudi Aramco, the world’s largest oil producing and exporting firm, is a linchpin of Saudi climate strategy. Due to its world-leading carbon production, particularly the so-called Scope 3 emissions from global combustion of Saudi oil, Aramco holds significant influence in the world’s climate ambitions and agenda, just as decisions made in consuming countries will impact Saudi Arabia’s export revenue. One of the decarbonization pathways that Saudi Aramco has touted involves swapping conventional fuels for low-carbon replacements, many of which revolve around hydrogen. Hydrogen has emerged as a favored energy carrier given the prospects for avoiding greenhouse gas emissions while retaining a familiar business model for fuel supply chains that leverages the resource comparative advantages native to the region.
Aramco’s ambitions on hydrogen are shaping up as an important variable in energy transitions and are an indicator that Saudi Aramco’s remit is broadening from carbon extraction and distribution to full-cycle carbon management.5 Aramco’s engineering and investment capacity aims to convert the Saudi Arabia into an investment destination for climate - compliant industrial production. This will be achieved by decarbonizing existing assets — electrifying processes using renewables — and providing services in carbon removal, conversion, utilization, and sequestration.
Geopolitics remains central to any discussion of the Middle East, especially given the region’s makeup of small states with clashing national interests and relations. Most recently, Yemen’s Houthi movement stands out in this regard. The Houthi attacks on global shipping through the Red Sea, for example, has negatively impacted trade in energy commodities, with LNG carriers at the top of the list of cargo types.
The Houthi attacks present a new phenomenon in geo-economic conflict.6 A quasi-state group is using asymmetric tactics and weaponry not just to fight conventional armed forces, but to selectively thwart shipping in ways that serve as targeted economic sanctions against countries supporting Israel. The Iran-backed Houthi can do this by dint of access to inexpensive innovations in weaponry in combination with control of strategic territory astride one of the world’s great maritime chokepoints: the Bab elMandeb Strait.
JIM KRANE, PH.D.
As of late June 2024, the Houthi challenge to free and secure navigation remains unresolved. International military and diplomatic efforts have failed to halt the attacks, and the Houthi have proven resilient to attempts at deterrence. Regardless of how much longer this goes on, it raises an obvious question about whether the Red Sea shipping conundrum is a one-off or whether it is replicable elsewhere by others inspired by the Houthis’ unorthodox tactics.
The global oil market may be evolving in ways that could undermine the strategic importance of oilproducing countries, at least in the eyes of the U.S. government. The market is being reshaped by electric and more efficient mobility, broadening geographic diversity of oil production, especially from the U.S., and a rising share of oil being diverted to petrochemical use. These trends suggest U.S. voters and future U.S. administrations will be less directly exposed to price swings and other risks in the global oil market, and less reliant on Saudi Arabia for price stability.
Why is this significant? Diminishing risk exposure could reduce the imperatives for U.S. policymakers to spend so heavily on security provision in the Persian Gulf — more than $100 billion per year — or to resolve diplomatic rifts with major producers such as Saudi Arabia.7 Moreover, it can be argued that the general shift in pressures on the Organization of the Petroleum Exporting Countries (OPEC) cartel — from Russia becoming an active participant in negotiating production quotas to speculation regarding the UAE’s membership — emanate from diverging responses to energy transitions.8 This, in turn, raises questions about the long-term strategic importance of OPEC and its members, at least from the perspective of developed countries such as the U.S.
That stated, the strategic importance of the Gulf region in the climate equation is increasing. The Gulf’s cooperation is a prerequisite for any workable climate action, and the region’s carbon management advantages and capital investment capabilities make it an attractive partner for future climate actions. While these attributes are unlikely to fully offset the negatives from a decline in oil rents and loss of oil’s monopoly as a transportation fuel, they provide promising pathways for Gulf leadership.
Under any imaginable scenario, climate change and energy transitions pose a difficult future for the Gulf region. In addition to undermining all-important oil rents — the political lifeblood of these monarchical regimes — these trends threaten the protection and diplomatic support of key allies, the survivability of the Gulf climate, and even the social contract between governments and society. The stakes could not be higher.
1. Unless otherwise noted, the percentages mentioned are author estimates.
2. Jason Samenow, “Two Middle East Locations Hit 129 Degrees, Hottest Ever in Eastern Hemisphere, Maybe the World,” Washington Post, last modified July 22, 2016, https://www.washingtonpost.com/ news/capital-weather-gang/wp/2016/07/22/two-middle-east-locations-hit-129-degrees-hottestever-in-eastern-hemisphere-maybe-the-world/.
3. Jim Krane, “Net Zero Saudi Arabia: How Green Can the Oil Kingdom Get?” (working paper, Rice University’s Baker Institute for Public Policy, October 27, 2022), https://www.bakerinstitute.org/ research/net-zero-saudi-arabia-how-green-can-oil-kingdom-get.
4. Later this year, we will release a full credibility index on the Gulf that measures how well different countries matched their energy and climate pronouncements.
5. Rami Shabaneh et al., eds., The Clean Hydrogen Economy and Saudi Arabia: Domestic Developments and International Opportunities, Routledge Explorations in Environmental Economics (London and New York: Routledge, 2024), https://doi.org/10.4324/9781003294290
6. Krane, “Houthi Red Sea Attacks Impose ‘Economic Sanctions’ on Israel’s Backers” (Houston: Rice University’s Baker Institute for Public Policy, March 1, 2024), https://doi.org/10.25613/64CZ-F553
7. Krane, “How the Energy Transition Is Imposing New Strains on US-Saudi Relations,” Orbis 68, no. 2 (2024): 294–314, https://doi.org/10.1016/j.orbis.2024.02.009
8. Kristian Coates Ulrichsen, Mark Finley, and Krane, “The OPEC+ Phenomenon of Saudi-Russian Cooperation and Implications for US-Saudi Relations” (Houston: Rice University’s Baker Institute for Public Policy, October 18, 2022), https://doi.org/10.25613/0B0F-J592; Krane, Ulrichsen, and Finley, “Should Abu Dhabi Quit OPEC? Reconsidering the UAE’s Membership” (Houston: Rice University’s Baker Institute for Public Policy, June 1, 2023), https://doi.org/10.25613/dt16-5153.
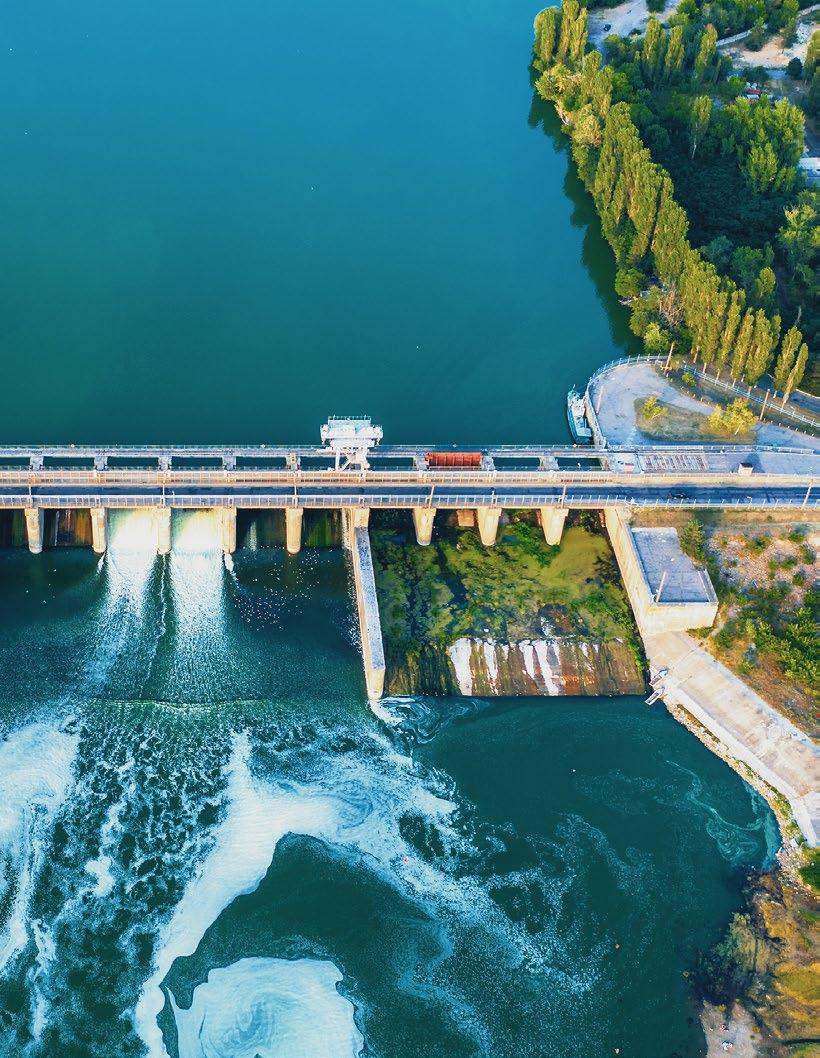

OSAMAH ALSAYEGH, PH.D.
Visiting Research Scholar, Center for Energy Studies, and Research Scientist, Energy and Building Research Center, Kuwait Institute for Scientific Research
The recent five-year Iran-Iraq gas deal, where Iran supplies Iraq with 50 million cubic meters per day of natural gas, and the diplomatic reestablishment between Iran and Saudi Arabia relations, which were broken in 2016, are indications of endeavors toward more regional cooperation in facing vital concerns, such as energy and water challenges.1 Despite geopolitical pressures, such as U.S. opposition to such agreements, bilateral and multilateral agreements are expected to develop between Persian Gulf states to support their economic stability and vital well-being, which are the key drivers in seeking such cooperation.
The Gulf countries — Bahrain, Iran, Iraq, Kuwait, Oman, Qatar, Saudi Arabia, and the United Arab Emirates (UAE) — held about 48% and 40% of the world’s proven oil and natural gas reserves, respectively, at the end of 2020. 2 They share several joint oil and gas fields that are expected to witness active joint development in the future (Table 1). Several Gulf countries have either not fully developed some of their energy production assets, or do not have sufficient resources to develop them, especially in the natural gas sector.
Iraq, Kuwait, and the UAE are net gas importers and their imports in 2022 constituted 50%, 40%, and 20%, respectively, of their gas consumption.3 Iraq imports gas from Iran, and the UAE sources gas from Qatar through the Dolphin pipeline. Kuwait is the only country where about 46% of its total imported gas comes from external regions, i.e., Africa, Europe, and North and South America.4 In early 2022, Kuwait signed a memorandum of understanding with Saudi Arabia to develop the joint offshore Arash/Durra gas field in the partitioned neutral zone. However, Iran has objected to such an agreement and demanded its share in the Arash/Durra gas field. Most likely the exploitation of the Arash/Durra field will not materialize in the short-term future until an agreement on the demarcation of maritime borders among the three nations is reached. Driven by their economic development and energy resource needs, these countries will eventually end up in joint rather than competitive exploitation of resources in this region.
OSAMAH ALSAYEGH, PH.D.
Countries
- Iran
- Kuwait - Saudi Arabia
- Iran - Qatar
- Iran
- Kuwait
- Saudi Arabia
Source: Attaqa.
Joint Field(s)
- Gas: Arash/Durra
- Undeveloped field.
Remark(s)
- Negotiation of disputes between Iran on one side and Kuwait and Saudi Arabia on the other side about the field’s sovereignty and demarcation of maritime borders.
- Gas: South Pars/North Dome - Under development.
- Oil: Esfandiar/Lulu
- Oil: Foroozan/Marjan
- Esfandiar has an estimated 500-million-barrel oil equivalent of proven reserve. Under development.
- Lulu is a developed field in the joint operation zone between Kuwait and Saudi Arabia.
- The current oil production of Foroozan is 40,000 barrels per day (bpd). Under development to double production.
- Marjan field produces 270,000 bpd with a 2.3 billion proven oil reserve.
Additional regional cooperation is expected to be developed through power grid interconnection. Currently, part of the Gulf region is interconnected through a power grid — operated by the Gulf Cooperation Council Interconnection Authority (GCCIA) — connecting Oman through the UAE to Saudi Arabia, Qatar, Bahrain, and Kuwait. Expansion plans for the GCCIA are ambitious. Iraq recently signed an agreement with the GCCIA to become part of the grid, and there are aims to extend to Eurasia and East Africa.5
GCCIA expansion that includes countries such as Iran and Turkey would provide reliability and stability to domestic power grids by facilitating greater arbitrage across regions. It could also serve as an additional pillar for the Gulf region to become a hub in producing and exporting clean energy to the world. The region’s geographic location makes it among the highest annual solar energy recipient of more than 2100 kilowatt hours (kWh) and its location is also blessed with wind speeds that can reach about 10 meters per second (m/s).6 These clean energy resources can be exploited regionally and exported to other regions. Direct economic and spillover benefits would be realized across several economic sectors that are vital for regional vitality, including energy, manufacturing, information technology and communication services, etc.7
In 2021, natural gas and oil products dominated the energy mix for power generation in the Gulf region with shares of 74% and 23%, respectively; hydro and other renewables shares were 2% and 1%.8 Given the partial present and full future power interconnection grid, the region’s exploitation of renewable energy in power generation and water desalination will greatly benefit mitigating emissions. Locally, steps toward expanding renewable deployment have been witnessed in the region’s largest and major player countries — Iran, Saudi Arabia, and the UAE. Common goals to reduce emissions can be another driver of regional cooperation in the long term.
All Gulf countries — except Iran — have under 1000 cubic meters per capita per year of natural renewable freshwater. This makes these countries’ water poor. Therefore, they are compelled to depend on energyintensive seawater desalination to meet their potable water demand. Despite Iran’s abundance of natural freshwater, there are currently 95 water desalination plants with a total capacity of 638,000 cubic meters per day, operational or being constructed across the country to address the challenges of unprecedented levels of drought.9 In addition, Iran plans to build water corridors linking the shores of Iran’s southern gulf to those of its northern Caspian Sea. The plan will connect the Strait of Hormuz to the central-eastern province of Kerman, transfer water to Hormozgan province on Iran’s gulf shores as well as eastern provinces and cities, bring water from the Gulf of Oman to the central province of Isfahan, and transfer water to Zahedan and Zabul in the southeastern Sistan and Baluchestan province.10
In Iraq, despite the presence of the Tigris and Euphrates Rivers, the country faces rising freshwater shortages. To meet the water demand, Iraq built a reverse osmosis plant to desalinate brackish and saline river water 20 km north of Basra (not seawater from the Gulf). Iraq also has a plan to build a seawater desalination plant in the southern Basra province.11
In 2000, the Arab Gulf states of the Gulf Cooperation Council (GCC) leaders decided to carry out a water interconnection study. The water interconnection network would supply freshwater to all GCC states from desalination plants that would be built on the Gulf of Oman and Arabian or Persian Gulf. Three desalination plants were proposed to be in Sohar in the Gulf of Oman, Sela in the UAE, and Khafji in Saudi Arabia. No further actions were taken until 2012 when the 14th GCC Consulting Meeting was held in Riyadh, Saudi Arabia, when the GCC leaders decided to carry out an additional study taking into account the outcomes of previous studies. A consulting company was awarded and executed the study.12 The project had been in stagnation without any tangible actions since 2013. It is worth noting that in the early 2000s, Iran proposed to supply Kuwait with 200 million gallons per day of fresh water from the Karun River through land and subwater 550-km pipeline. Deal negotiations between the Iranians and Kuwaitis have stopped since 2006 due to political disagreements and tensions between GCC states and Iran.13
Given the critical water poverty, and the Gulf states’ experience in operating and planning seawater desalination, water treatment, and water resources management and freshwater transmission across the Gulf region, the region, eventually, is expected to see bilateral talks for water supply deals within the shortterm future. Within the long-term future, a freshwater transmission network across the western Gulf bank region is likely to be materialized.
There are substantial regional challenges faced with regard to natural resource development and use, electricity generation and transmission development, and water availability across the Gulf region. Challenges generally bring opportunities, and there are significant opportunities to leverage the combined interests of countries across the region to attain a platform for regional growth. It remains to be seen to what extent some of the issues outlined herein — joint oil and gas field development, regional expansion of electricity grid interconnection, and joint water development and distribution — are fully capitalized for a Pareto-improving outcome. All the ingredients are in place for such outcomes, and there is certainly interest in achieving them. So, expect steps to be taken that improve overall regional well-being, although not likely all at once, even if other geopolitical issues at the root of regional conflicts remain.
OSAMAH ALSAYEGH, PH.D.
1. Nayera Abdallah, “Iraq Signs 5-Year Gas Supply Deal with Iran, Says State Media,” Reuters, last modified March 27, 2024, https://www.reuters.com/business/energy/iraq-signs-5-year-gas-supplydeal-with-iran-says-state-media-2024-03-27/.
2. Energy Institute, Statistical Review of World Energy, 2024, https://www.energyinst.org/statistical-review.
3. Osamah A . Alsayegh, “The Case of Cooperation on the Energy Transition in the Gulf,” Bourse & Bazaar Foundation, April 10, 2024, https://www.bourseandbazaar.com/articles/2024/4/10/the-case-forcooperation-on-the-energy-transition-in-the-gulf.
4. Kuwait Institute for Scientific Research, Kuwait Energy Outlook 2023, Kuwait Foundation for the Advancement of Sciences, https://www.kfas.org/Publications/KEO2023.
5. Ahmed Al-Ebrahim, “The GCC Interconnection: Supporting Energy Efficiency in the GCC” (PowerPoint Presentation, 1st IEF-EU Energy Day, Riyadh, Saudi Arabia, February 14, 2017, https://www.ief.org/_resources/files/events/1st-ief-eu-energy-day/1st-ief-eu-energy-day---gcciaperspective.pdf).
6. “Global Solar Atlas,” Energydata.info, https://globalsolaratlas.info/map; “Global Wind Atlas,” Energydata.info, https://globalwindatlas.info/en/
7. Alsayegh, Kristian Coates Ulrichsen, Jim Krane, and Ana Martín Gil, “Exploring the Energy Transition and Net-Zero Strategies of Gulf Oil Producers” (Houston: Rice University’s Baker Institute for Public Policy, May 11, 2023), https://doi.org/10.25613/1XGY-DF16
8. International Energy Agency (IEA), “Data and Statistics,” https://www.iea.org/data-and-statistics
9. Gabriel Collins, “Iran’s Looming Water Bankruptcy” (Houston: Rice University’s Baker Institute for Public Policy, April 4, 2017), https://www.bakerinstitute.org/research/irans-looming-waterbankruptcy
10. Banafsheh Keynoush, “With the Hope Line, Iran Aims to Boost Seawater Transfer to Fight Growing Drought,” Middle East Institute, June 9, 2021, https://www.mei.edu/publications/hope-line-iranaims-boost-seawater-transfer-fight-growing-drought; “Desalination Plants Capacity to Be Raised by 400,000 Cubic Meters,” Tehran Times, January 8, 2023, https://www.tehrantimes.com/news/480587/ Desalination-plants-capacity-to-be-raised-by-400-000-cubic-meters.
11. Robert Tollast, “Iraq and The Desalination Revolution: First Steps, Future Trends,” Iraq Energy Institute, May 1, 2020, https://iraqenergy.org/2020/05/01/iraq-and-the-desalination-revolution-first-stepsfuture-trends/; “Iraq Initiates Enormous Desalination Project,” Smart Water Magazine, August 31, 2023, https://smartwatermagazine.com/news/smart-water-magazine/iraq-initiates-enormousdesalination-project
12. “ Water Interconnection Project,” Secretariate General of the Gulf Cooperation Council, Riyadh, Kingdom of Saudi Arabia, 2013, accessed December 28, 2022, https://www.gccsg.org/ar-sa/CooperationAndAchievements/Achievements/EconomicCooperation/ CooperationintheFieldofElectricityandWater/Pages/Waterlinkproject.aspx
13. M. Eid, “Water and Security in the Arabian Gulf — A Challenging Strategic Relation,” Strategic Report 16, Center for Gulf and Arabian Peninsula Studies, Kuwait, 2021 (in Arabic).


FRANCISCO J. MONALDI, PH.D. Fellow in Latin American Energy Policy and Director of the Latin American Energy Program, Center for Energy Studies
Latin America has massive hydrocarbon resources, second only to the Middle East, but until recently regional production had stagnated or declined, even during the oil price boom of 2004–14. The main obstacles for the development of its potential have been aboveground risks, including regulatory intervention, macroeconomic uncertainty, and expropriation risks — partially rooted in resource nationalism and the dominance of national oil companies. A mix of ideology and opportunistic reneging have thwarted investment and production growth. In contrast to their northern neighbors, the U.S. and Canada, in which production boomed, the region largely wasted the opportunity given by the oil super cycle. According to my own estimates, Latin America could have been producing some 17 million barrels per day (bpd) of crude, if it had the appropriate institutional environment, but instead it was producing close to 9 million bpd in 2023.1
However, after seven years of steady decline with an accumulated drop of 25%, the region’s crude production has recovered by more than 9% over the last two years due to significant growth in Guyana and Brazil, with smaller increases in Argentina and Venezuela, more than compensating declines elsewhere in the region. 2 Brazil and Guyana are set to continue their notable upward trajectory in the next few years; the only question is the pace of development in their prolific offshore. Both countries are open to private investment and have a record of respecting property rights.
Guyana’s oil production is one of the most remarkable success stories in the last few decades. Offshore oil was discovered by Exxon in 2015. Production started in 2019, and by the end of the first quarter of 2024, it had reached 600,000 bpd. The U.S. Energy Information Administration (EIA) forecasts that Guyana’s production will surpass 800,000 bpd in 2025, adding more than 300,000 bpd in two years.3 In turn, Brazil’s production is expected to grow by more than 250,000 bpd by 2025.4 These increases will make Guyana and Brazil, along with the U.S. and Canada, the largest sources of production growth in 2024–25, allowing the production of Latin America to surpass the levels of 2017.
Argentina, despite its macroeconomic difficulties, should continue to grow, although arguably below its potential, due to an extremely attractive unconventional resource base and the probusiness Milei administration. Shale is less vulnerable to political risks, due to its unique characteristics, short cycle, and low sunk costs.5 In contrast, Colombia, Ecuador, and Mexico are all expected to continue their decline. The recent presidential election in Mexico points toward continuity in the polices that closed private investment opportunities and exacerbated the financial problems of Pemex. In Colombia, the Petro
administration has banned fracking and stopped bidding rounds for exploration, making the recovery of production in the next few years unlikely.
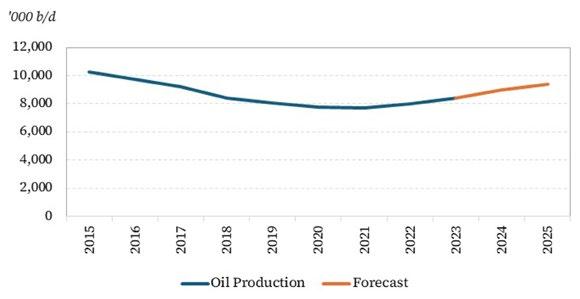
Source: Global Data and own forecast.
Venezuela, the Latin American country with the largest reserves and significant spare infrastructure, although much deteriorated, has the greatest upside potential. However, political and regulatory risks and U.S. sanctions set a low ceiling to its recovery, unless these constraints are eased. Will the recent sanction flexibilization and political negotiations lead to further investment and production growth?
Venezuela represents the biggest question mark in the regional outlook. Forecasts of oil production in the next two years vary widely, from 1.15 million bpd (an increase of 330,000 bpd) to 700,000 bpd (a decrease of 110,000 bpd) by the end of 2025, depending on sanctions’ flexibilization and political developments.6 For reference, production averaged 812,000 bpd in the first quarter of 2024.
To analyze the outlook for Venezuela, it is important to have some background. The nation’s production fell from 2.3 million bpd in 2015 to 498,000 bpd in 2020. The decline was the result of a combination of lower oil prices, cumulative lack of investment, U.S. sanctions, and 2020 COVID-19-related demand destruction. But the period prior to 2015 witnessed an equally dramatic collapse in the production of Venezuela’s national oil company, Petróleos de Venezuela, S.A. (PDVSA), which shockingly occurred during the price super cycle. Just before Chavez came to power in 1999, Venezuela produced 3.4 million bpd, of which PDVSA operated 3.1 million, and the rest was produced by private operators in service contracts. By 2015 PDVSA produced only 1.2 million bpd, and the joint ventures with foreign companies produced some 1.1 million bpd. PDVSA had taken over the large operations of Exxon and Conoco and some other smaller projects in 2006–07. While its partners in the Organization of the Petroleum Exporting Countries (OPEC) increased oil production by around a third, Venezuela’s total production fell by a third, with PDVSA’s operated production falling by close to two thirds.
FRANCISCO J. MONALDI, PH.D.
Neither the country nor the world paid much attention to the collapse of PDVSA because private companies compensated for a substantial portion of the decline, and the boom in the oil price avoided a decline in oil revenues. Not only did PDVSA’s production collapse but also its debt exploded, including its obligations with partners and contractors. Private operators were regulatorily and fiscally expropriated in the government’s insatiable search for additional revenues.7 So, when the price of oil declined at the end of 2014, the Venezuelan oil sector’s troubles became painfully evident.
PDVSA and the country were at the brink of default, and U.S. financial sanctions in 2017 made debt restructuring unviable. In 2019, sanctions closed the U.S. market, where Venezuela exported more than 500,000 bpd and from which it imported refined products and diluents for its extra-heavy oil production.
U.S. secondary sanctions in 2020 forced Venezuelan oil to the black market at heavy discounts, just when COVID-19 pandemic produced a demand and price collapse, making it impossible for PDVSA to sell some 500,000 bpd and prompting production shutdowns. Production bottomed at less than 400,000 bpd in the summer of 2020. With the subsequent price recovery, and the help of Iran in selling on the black market and as a supplier of diluents, production went back up to average 684,000 bpd in 2022, using all the existing spare capacity. But adding production capacity required new investments. Since the middle of 2020, there had been no drilling rigs operating in Venezuela, contrasting with the 60–70 operating when production was stable at around 2.5 million bpd.
Enter the Russian invasion of Ukraine on February 2022, which prompted the U.S. to initiate negotiations with the government of Maduro. That, in turn, led to negotiations between PDVSA and Chevron, the largest foreign investor in the country, resulting in a new contract giving the U.S. major control over the operations and exports of its four join ventures with PDVSA. In November 2022, the U.S. gave a license to Chevron through General License (GL) 41 to operate these joint ventures and export their production to the U.S. market. Chevron investments have lifted its production by more than 100,000 bpd, to around 190,000 bpd by June 2024.
In 2023 the U.S. negotiated a further relaxation of sanctions with Nicolás Maduro in exchange for steps allowing for competitive presidential elections in 2024, as part of the Barbados Agreement. GL 44 of October 2023 suspended sanctions to PDVSA for six months, conditional on electoral guarantees. The license improved the cashflow of PDVSA, by allowing it to sell in the formal market (primarily in India), some of the oil it used to sell in the black market (primarily in China) at lower discounts and costs. However, due to the short-term horizon of six months and the political conditionality, it failed to lead to any relevant additional investments. Production in non-Chevron projects only increased modestly due to increased diluent availability.
On April 17, 2024, the U.S. government announced the nonrenewal of GL 44, due the Venezuelan government’s lack of compliance with its electoral commitments by not allowing the winner of the opposition primaries, María Corina Machado, or her selected substitute to participate in the elections. However, the Biden administration strongly signaled that it would consider applications for individual licenses for companies to operate in Venezuela and do business with PDVSA.
Thus, the current U.S. sanctions policy remains considerably more flexible than the maximum pressure policy set by the Trump administration in 2020. Presumably, sanctions will be fine-tuned according to political developments in Venezuela and U.S. strategic priorities. Chevron’s license GL 41 was reconfirmed. European companies, such as Repsol and Maurel & Prom, obtained a licensed to continue operating in Venezuela. Other possible licensees include the Italian company, Eni, and Indian companies, such as Oil and Natural Gas Corporation Limited (ONGC) for operations and Reliance Industries for the purchase for Venezuelan oil.
Full normalization of relations between Venezuela and the U.S., and the subsequent removal sanctions removal looks improbable, unless there is a return to democracy. Presidential elections in Venezuela are set for July 28, 2024. Presidential elections in Venezuela were held on July 28, 2024. Maduro claimed victory, but there were credible claims of extensive fraud. U.S. elections are set for Nov. 5, 2024. The outcomes of both elections could impact the future of sanctions policy.
It was clear from the outset that Venezuelan elections were not going to be free and fair. Maduro’s approval rating is around 25%. He had bet on his proven strategy of banning some opposition candidates, sponsoring a coopted opposition, encouraging the real opposition’s divisions, and promoting abstention among the opposition voters by discouraging them with electoral abuses and the perspective of outright fraud. The problem is that the opposition became firmly united behind the leadership of Machado, and even though she was banned from running, she maneuvered to stay in the electoral competition by supporting another candidate. So, the country headed for a tumultuous election campaign, with the government losing by large margins in all reputable surveys but unwilling to concede defeat. At the time of this writing, at the end of July 2024, Maduro holds on to power with the support of the military but faces widespread discontent and international condemnation for the fraudulent elections.
In any case, the Biden administration, as well as a potential Harris administration, has incentives to remain in business with Venezuela. Energy geopolitics and immigration issues are two key strategic considerations. A second Trump administration might also prefer a more transactional approach to sanctions than the maximum pressure policy of his previous term. As a result, if Maduro clings to power, the most likely scenario is a world with sanctions but with licenses allowing operations by U.S. and other allied-country companies.
If Venezuela had a regime change, political stability, and an attractive and credible oil investment framework — three big “ifs” — production could increase significantly, by a yearly average 220,000–250,000 bpd with annual investments of around $8–9 billion. While such a scenario is unlikely, it can serve as a benchmark to analyze others.
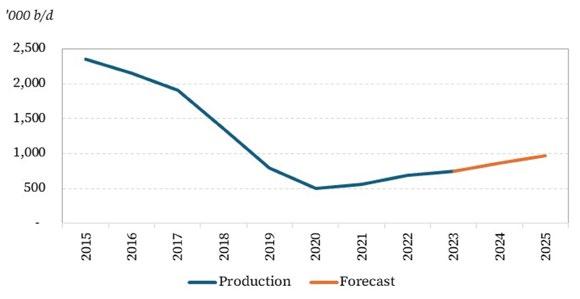
Source: Organization of the Petroleum Exporting Countries (OPEC) and own forecast.
In a scenario of some normalization of relations with the U.S. along with new Chevron-style contracts and licenses to Western companies, production could increase by 330,000 bpd in 2024 and 2025 to surpass 1.15 million bpd by the end of 2025. As indicated in Figure 2, a status quo scenario, with only the
existing contracts and licenses, would add a total of some 210,000 bpd in 2024–25, mainly in Chevron’s projects, to reach just above 1 million bpd by the end of 2025. In the unlikely scenario, in which the U.S. government cancels all licenses in 2024 — e.g. if political conflict escalates due to fraudulent elections and a repressive clampdown on the democratic opposition occurs — production would likely peak below 930,000 bpd in 2024–25 and gradually decline.
Latin America is poised to see significant increases in production over the next few years, especially in Guyana and Brazil. The offshore resources in these two countries alone are massive, and the countries’ openness to foreign investment makes them attractive plays. However, the region is also beset with significant uncertainties in other countries, all of which are above ground. Venezuela is at the top of the list in this regard.
Despite having massive resources, low geological risks, and significant brownfields ready for investment, Venezuela’s political risks, deteriorated state capacities and infrastructure, and fraught relations with the U.S. make a large production recovery in the short run unlikely. Rather, Venezuela is most likely to continue to be one of the most significant wild cards in the global market in the next decade.
1. Unless otherwise noted, the percentages and statistics mentioned are author estimates.
2. Energy Institute, Statistical Review of World Energy, 2024, https://www.energyinst.org/statistical-review
3. Eulalia Munoz-Cortijo and Matias Arnal, “Guyana Becomes Key Contributor to Global Crude Oil Supply Growth,” U.S. Energy Information Administration (EIA), May 21, 2024, https://www.eia.gov/todayinenergy/detail.php?id=62103
4. Sean Hill, “Four Countries Could Account for Most Near-Term Petroleum Liquids Supply Growth,” EIA, March 21, 2024, https://www.eia.gov/todayinenergy/detail.php?id=61583
5. Gabriel Collins et al., “Shale Renders the ‘Obsolescing Bargain’ Obsolete: Political Risk and Foreign Investment in Argentina’s Vaca Muerta,” Resources Policy 74 (December 2021), https://doi. org/10.1016/j.resourpol.2021.102269. For an earlier version of this paper, see Collins et al., “Shale Renders the ‘Obsolescing Bargain’ Obsolete: Political Risk and Foreign Investment in Argentina’s Vaca Muerta” (working paper, Houston: Rice University’s Baker Institute for Public Policy, February 24, 2020), https://www.bakerinstitute.org/research/political-risk-and-foreign-investment-argentinasvaca-muerta
6. For the upper range estimate, see Rystad Upstream Analytics, “Venezuela Oil Supply Outlook Hangs in Balance with Future of Oil Sanctions Unclear,” February 16, 2024. For the lower range estimate, see IPD Latin America, “Venezuela Production Forecast,” February 2024.
7. Francisco Monaldi, Igor Hernández, and José La Rosa Reyes, “The Collapse of the Venezuelan Oil Industry: The Role of Above-Ground Risks Limiting Foreign Investment,” Resources Policy 72 (August 2021), https://doi.org/10.1016/j.resourpol.2021.102116
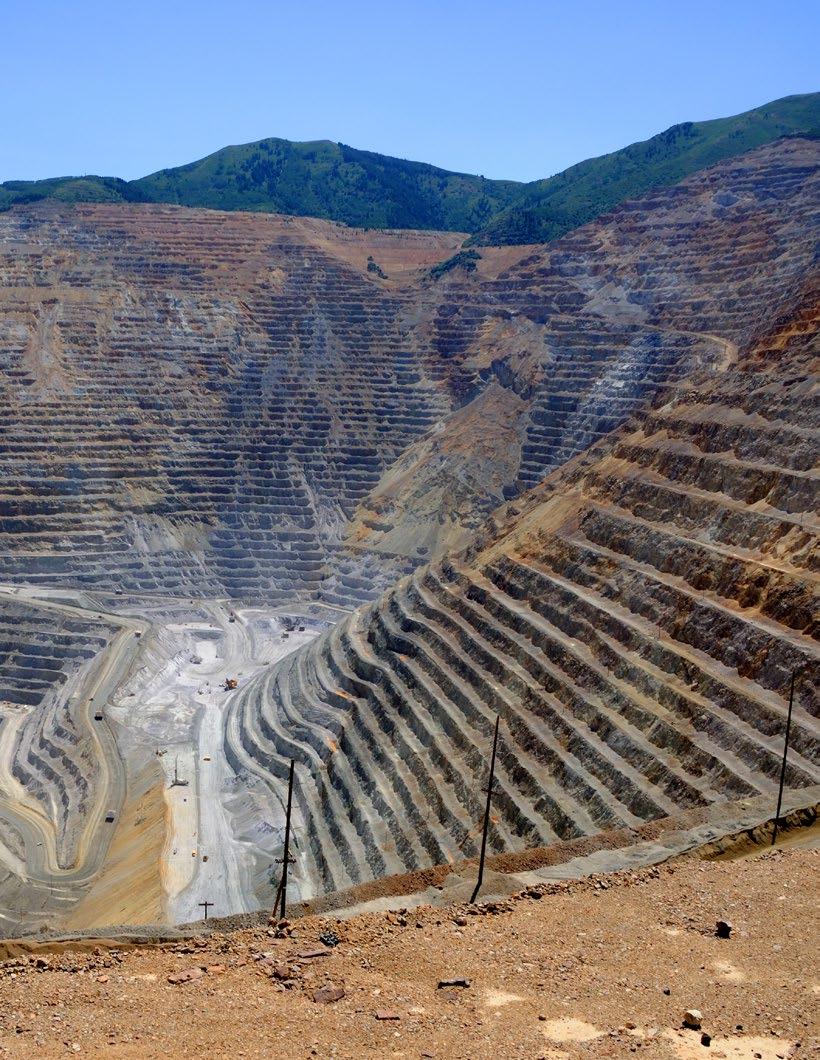

TILSA ORÉ MÓNAGO, PH.D.
Fellow in Energy and Market Design, Center for Energy Studies, and Lecturer, Master of Energy Economics, Department of Economics, Rice University
Reaching global net-zero goals by 2050 requires a significant transformation of the energy mix toward cleaner energy sources and technologies. Therefore, it requires greater supplies of critical minerals, which include copper, nickel, cobalt, lithium, and rare earths. Electrifying economies in ways that reduce the use of hydrocarbon fuels supposes not only massive expansion of the electricity transmission networks, but also large deployment of storage and battery technologies and significant presence of electric vehicles (EVs). These changes also require much larger amounts of minerals and materials; for instance, an EV requires six times more minerals than the typical internal combustion energy vehicle.1
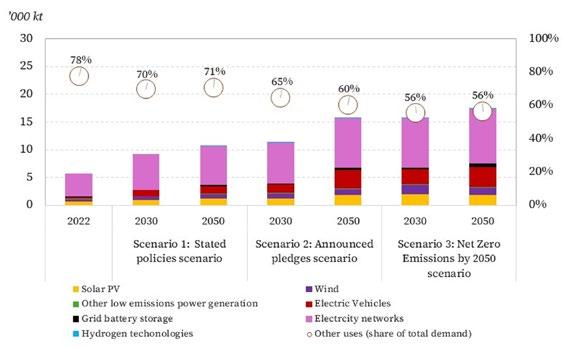
Source: International Energy Agency (IEA), “Critical Minerals Market Review,” 2023.
According to the International Energy Agency (IEA), the demand for critical minerals will at least double by 2030. 2 As indicated in Figure 1, global copper production will need to grow dramatically — double or triple its levels in 2022 — to meet the demands of energy transitions. Moreover, the use of copper will shift more heavily toward electricity networks, EVs, and solar photovoltaics (PVs). Even more dramatically, lithium demand is projected to increase anywhere between 5 and 12 times by 2050 relative to 2022 to feed growth in EVs and grid battery storage, depending on the scenario (Figure 2).
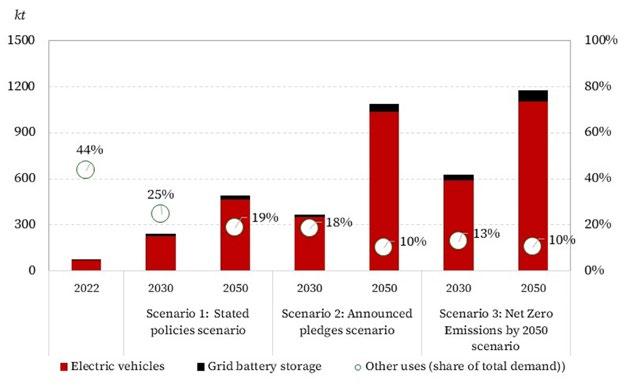
Source: IEA, “Critical Minerals Market Review,” 2023.
Critical minerals resources are geographically concentrated in a few regions. Chile, Argentina, Peru, Bolivia, and Brazil, to mention some, are of great relevance due to their reserves and current production levels of minerals, such as copper, lithium, zinc, silver, bauxite, etc. Currently, Chile and Peru account for about 35% of global copper production and 31% of global copper reserves (Figure 3). Similarly, Chile, Argentina and Brazil accounted for 37% of global lithium production and 53.2% of global lithium reserves at the end of 2022, excluding Bolivia’s estimated reserves of 23 million tons of lithium (Figure 4).3 Given the data presented in Figures 1 and 2, it is no surprise that these countries also stand to be significant players in the future of energy.
TILSA ORÉ MÓNAGO, PH.D.
FIGURE 3 — COPPER MINE PRODUCTION IN 2015, 2020, AND 2022
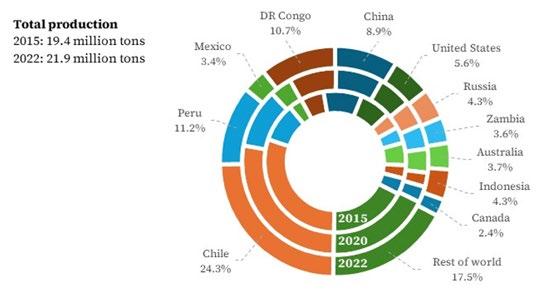
Source: U.S. Geological Survey, “Mineral Commodity Summaries.”
FIGURE 4 — LITHIUM MINE PRODUCTION IN 2015, 2020, AND 2022
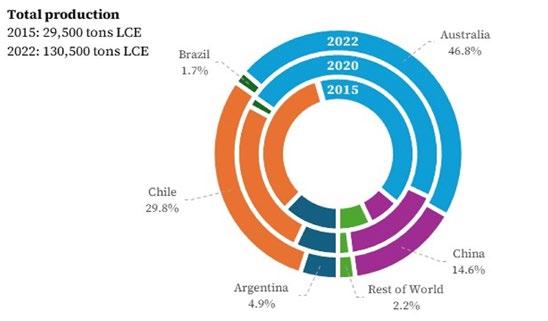
Source: Energy Institute, “Statistical Review of World Energy 2024.”
Global production of raw minerals has been responding to increased clean energy technology. Copper production has increased by 13.2% between 2015 and 2022, while lithium production has increased in 342% in the same period.4 Moreover, it is estimated that copper production in Peru and Chile will grow by 30% and 15% between 2022 and 2030, respectively.5 On the other hand, global mineral processing is highly concentrated in one country, China, which is a dominant player of the refined supply of many of key resources. China processes over 90% for manganese, 70% for cobalt, almost 60% for lithium, and approximately 40% for copper.6
Meeting the projected increases in demand requires important long-lived investments. For copper and nickel alone, meeting demand growth will require cumulative capital expenditures of $250 billion to $350 billion by 2030.7 By 2023, Chile and Peru secured portfolios of 31 and 27 copper mining projects worth $65.2 billion and $38.5 billion, respectively. These projects are expected to be developed through 2031.8 As for lithium projects, as of 2023 Argentina holds an estimated total project investment of $7 billion to be developed through 2032 by Rio Tinto, Arcadium Lithium, Posco, and Gangfeng Lithium, among others.9 Chile holds a total project investment of $2.3 billion to be developed by Sociedad Química y Minera (SQM), Salado Isolation Mining Contractors (SIMCO), and Minera Salar Blanco. Notably, fiscal terms are likely playing a role in attracting investments, as a royalty of 3% in Argentina for lithium mining is, all else equal, more attractive to private investment that a royalty of 40%, as is the case in Chile.10
Mineral supplies face heightened risks due to lengthy permitting processes and rising mining conflicts. A longstanding barrier to mining expansion is found in the permitting process, which can take years. The global average to develop mining production from discovery to first production is about 17 years for copper; in the case of lithium, the average is seven years in South America.11 This may explain why copper mining investment has been largely directed toward brownfield projects — specifically, capacity expansion or replacement — rather than greenfield projects.
Ore grade — the concentration of a desired mineral in mined material — is also important since mineral concentration is negatively correlated to operating costs. Locations with higher ore grades require less material removal during processing, which implies lower energy use and lower environmental impact. Globally, ore grades have been declining, which has caused higher operating and environmental costs. Currently, 0.6% of copper is the average ore grade, which is below the threshold for high grade at 1%. In Chile, average copper ore grades declined from 0.69% in 2015 to 0.59% in 2022.12
Socio-environmental conflicts and opposition from local and indigenous communities to mining activities are also barriers to the rapid expansion of mining projects. This opposition is intensified by pervasive social inequities, absence of effective public services, weak environmental protection, and a failing rent distribution system. For example, from 2000 to 2020, mining-associated conflicts in Chile and Peru almost quadrupled.13
Although a higher level of national government effectiveness is positively associated with income levels and good renewable energy policies and regulation, no clear relationship exists with mining conflicts (Figure 5). This may be explained by the fact that mining projects are usually developed within or close to indigenous communities’ lands, and these communities have been traditionally underrepresented and neglected. Out of a total of 284 mining conflicts registered by the Observatory of Mining Conflicts in Latin American (OCMAL) through 2020, 68% were in South America. Notably, water stress and water pollution concerns that lead to water conflicts are highly associated with mining conflicts, and, of course, mining conflicts increase with the number mining projects. Public consultations with local communities prior to project development seem to be a minor practice across countries in Latin America (Figure 6).
TILSA ORÉ MÓNAGO, PH.D.
FIGURE 5 — GOVERNMENT EFFECTIVENESS IN 2019; RENEWABLE ENERGY REGULATORY ENVIRONMENT INDICATOR IN 2019; AND CUMULATIVE MINING CONFLICTS THROUGH 2021
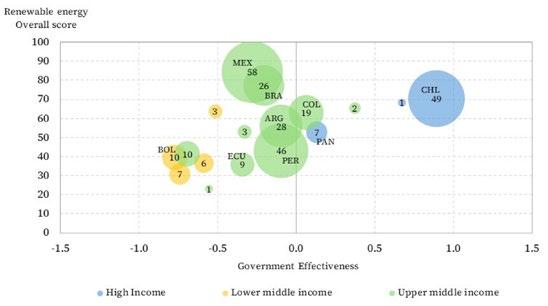
Source: Observatory of Mining Conflicts in Latin America (OCMAL); Regulatory Indicators for Sustainable Energy, 2019; and World Governance Indicators.
Note: Bubble size and annotations indicate number of conflicts.
FIGURE 6 — MINING AND WATER CONFLICTS AND PRIOR CONSULTATIONS IN SELECTED LATIN AMERICAN COUNTRIES THROUGH 2021
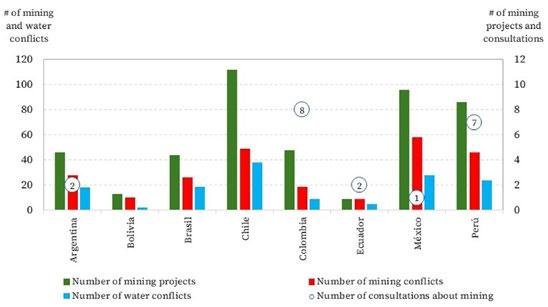
Source: OCMAL, “Map: Mining Conflicts in Latin America.”
The distribution of mining rents from the government is another point of conflict. Even decentralized models of rent distribution that have been implemented in countries such as Peru and Bolivia seem to fail in improving local communities’ well-being. Poor governance at the subnational level, rent-seeking behavior, and corruption may be some of the causes for inefficient public expenditure. Lack of communities’ ownership and lack of their participation in the decision-making process are also relevant factors.14
Some institutional improvements have been applied through legislation based on prior consultations in Peru (where they are obligatory and binding) and Chile. Innovative mechanisms to ameliorate risks have been found in roundtables between government and local communities in Peru and in early private-public dialogue in Chile.15
Companies are also working toward improving their extraction technology to minimize impacts, as happens with the typically water-intensive lithium extraction process from brines. In Chile, for example, mining companies have been switching to desalinated water sources while also increasingly relying on renewable energy sources. In addition, mining companies from Peru and Chile are collaborating on a binational roadmap for green hydrogen in mining to decarbonize the activity.
A successful path to reducing conflict while capturing the economic opportunity associated with increased mining activities is visible. But collaboration among the relevant stakeholders — government, companies, and communities — is crucial. This is no small task.
Governments must reduce red tape and streamline mining permitting processes while also taking into consideration necessary measures to secure local communities’ well-being and environmental protection. Alongside improved governance that emphasizes transparency and accountability, this can facilitate greater private investment and social welfare, while gaining communities’ trust. In fact, some scholars have found that the social license to operate in mining activities increases with governance capacity.16
It is also essential to develop mechanisms that allow larger engagement and participation of indigenous communities in the decision-making process. Only when these communities’ voices are heard will real progress be achievable. In the end, an optimal balance of environmental protection, political stability, and regulation clarity are crucial.
1. Natural Resource Division of Economic Commission for Latin America and the Caribbean (ECLAC), Lithium Extraction and Industrialization: Opportunities and Challenges for Latin America and the Caribbean (Santiago: United Nations, 2023), https://hdl.handle.net/11362/48965.
2. International Energy Agency (IEA), The Role of Critical Minerals in Clean Energy Transitions, IEA Publications, 2021, https://www.iea.org/reports/the-role-of-critical-minerals-in-clean-energytransitions; IEA, Critical Minerals Market Review 2023, IEA Publications, 2023, https://www.iea.org/reports/critical-minerals-market-review-2023
3. According to the Bolivian president, the estimated lithium reserves are 23 million metric tons (Daniel Ramos, “Bolivia Hikes Lithium Resources Estimate to 23 Million Tons,” Reuters, July 20, 2023, https://www.reuters.com/markets/commodities/bolivia-hikes-lithium-resources-estimate-23-mlntons-2023-07-20/).
4. On the other hand, global mineral processing is highly concentrated in one country, China, which is a dominant player of the refined supply of many of key resources. China processes over 90% for manganese, 70% for cobalt, almost 60% for lithium, and approximately 40% for copper (International Renewable Energy Agency [IRENA], “Geopolitics of the Energy Transition: Critical Materials,” 2023, https://www.irena.org/Digital-Report/Geopolitics-of-the-Energy-Transition-Critical-Materials).
TILSA ORÉ MÓNAGO, PH.D.
5. Benjamin Jones, Francisco Acuña, and Víctor Rodríguez, Cambios en la Demanda de Minerales: Análisis de los Mercados del Cobre y el Litio, y sus Implicaciones para los Países de la Región Andina (Santiago: ECLAC, 2021), https://hdl.handle.net/11362/47136
6. IRENA
7. Marcelo Azevedo et al., “The Raw-Materials Challenge: How the Metals and Mining Sector Will Be at the Core of Enabling the Energy Transition,” McKinsey & Company, January 10, 2022, https://www.mckinsey.com/industries/metals-and-mining/our-insights/the-raw-materialschallenge-how-the-metals-and-mining-sector-will-be-at-the-core-of-enabling-the-energy-transition As a reference, around $380 billion is the total investment in climate and energy committed by the U.S. via its Inflation Reduction Act.
8. S&P Global Market Intelligence, “Chile and Peru’s Copper for Energy Transition,” S&P Global, April 5, 2023, https://www.spglobal.com/esg/insights/featured/special-editorial/chile-and-peru-s-copperfor-energy-transition.
9. Diana Kinch, “Argentina ‘Most Attractive’ Lithium Triangle Jurisdiction for Brine Projects: Mine Developer,” S&P Global, April 12, 2024, https://www.spglobal.com/commodityinsights/en/marketinsights/latest-news/metals/041224-argentina-most-attractive-lithium-triangle-jurisdiction-forbrine-projects-mine-developer
10. Jack Quinn, “Latin America’s Lithium Sands Are Shifting,” Americas Quarterly, November 6, 2023, https://www.americasquarterly.org/article/latin-americas-lithium-sands-are-shifting/
11. IEA , The Role of Critical Minerals in Clean Energy Transitions. In Chile, copper mining permitting process my take 8 to 11 years; while in Peru, it takes 23 years in average.
12. María Cristina Betancour, “La Caída de la Producción de Cobre y el Desafío del Sector,” Ex-Ante, February 19, 2024, https://www.ex-ante.cl/la-caida-de-la-produccion-de-cobre-y-el-desafio-delsector-por-maria-cristina-betancour/
13. Rafael Poveda Bonilla, Estudio Comparativo de la Gobernanza de los Conflictos Asociados a la Minería del Cobre en Chile, el Ecuador y el Perú (Santiago: ECLAC, 2021), https://hdl.handle.net/11362/47569.
14. Manuel Glave and Gerardo, “Rent Distribution and Extractive Industry Conflict: The Latin American Approach,” Evidence and Lessons from Latin America (ELLA), January 2012, https://assets.publishing.service.gov.uk/media/57a08a5ee5274a27b2000575/121019_ECO_ ExtIndConMan_BRIEF3.pdf.
15. Poveda Bonilla.
16. Lenin H. Balza et al., “The Unwritten License: The Social License to Operate in Latin America’s Extractive Sector,” Inter-American Development Bank (IDB), August 18, 2022, https://ssrn.com/ abstract=4188882
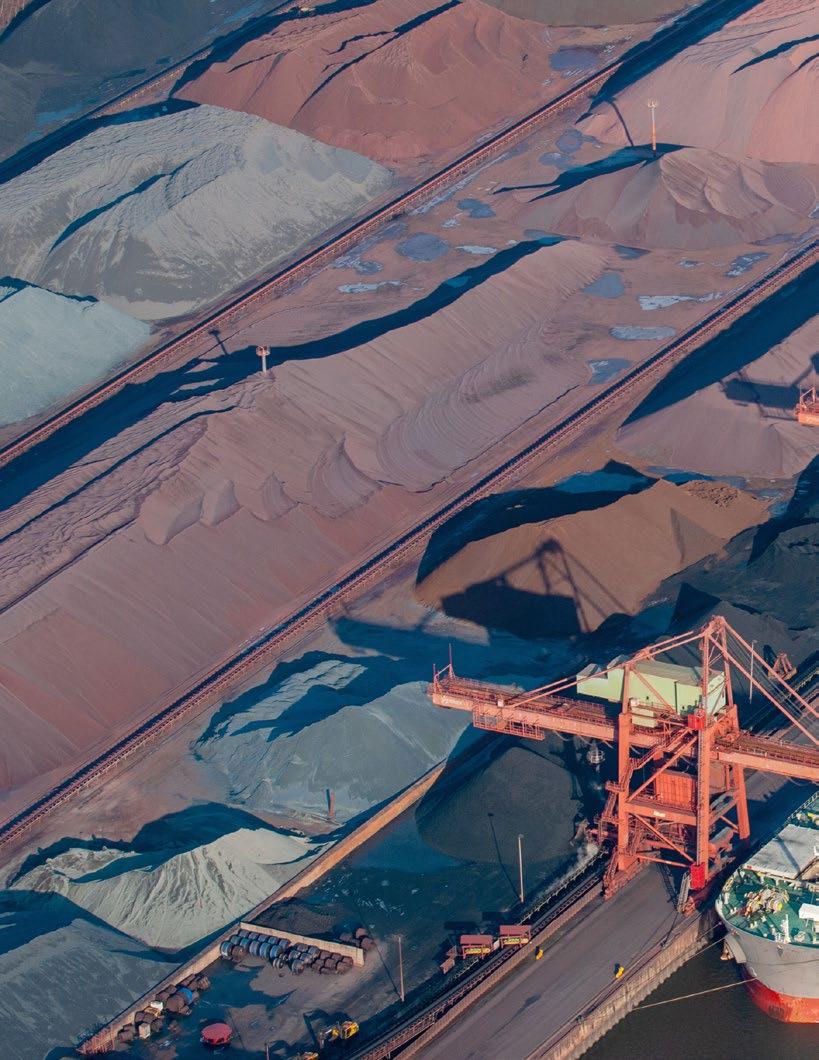
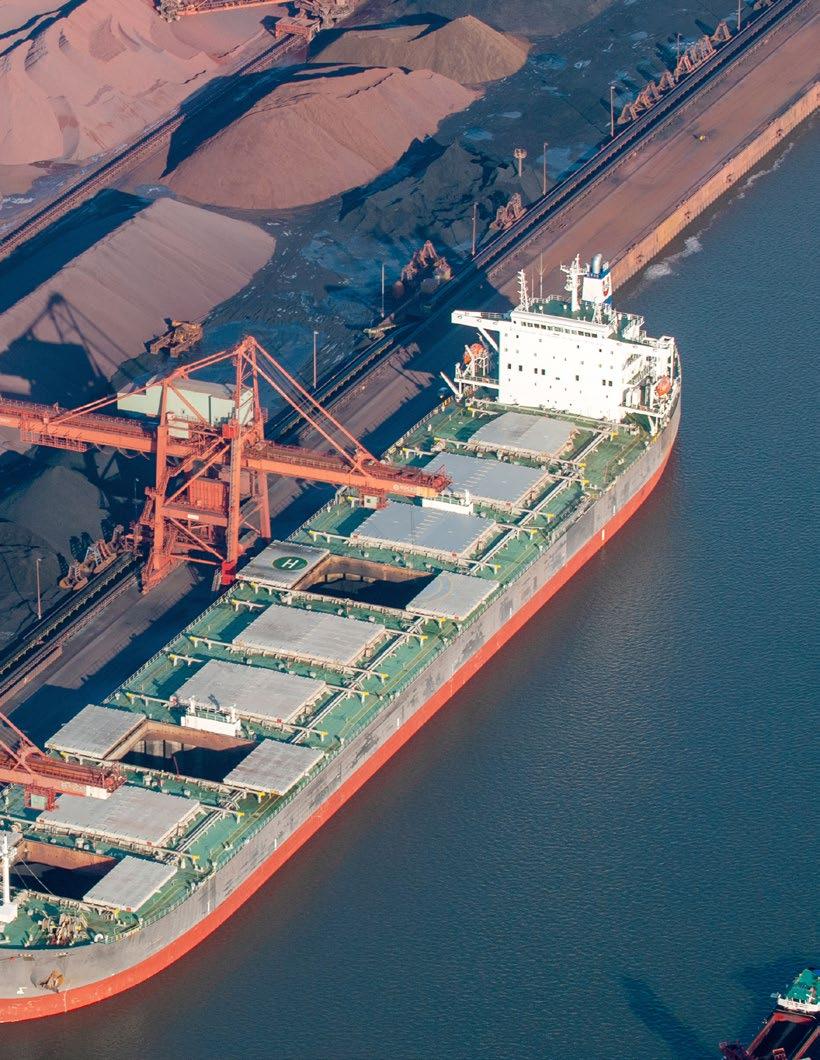

MICHELLE MICHOT FOSS, PH.D. Fellow in Energy, Minerals, and Materials, Center for Energy Studies
With the Bipartisan Infrastructure Law (BIL), Infrastructure Investment and Jobs Act (IIJA), Inflation Reduction Act (IRA), and Creating Helpful Incentives to Produce Semiconductors (CHIPS) and Science Act all in place, albeit with tax rules still evolving, and with the EPA’s clean vehicle rule finalized, and with other initiatives being pitched in a volatile election cycle, a fair question for inquiring minds is: What does it all mean for the coming year and beyond?1
A distinct possible answer is — not much, or certainly, not what we might, or have come to, expect. Those who view these actions as signals on climate commitments tend to also view them as first steps, baby steps even, in the drive to decarbonize and reshape both energy and economic systems in the U.S. and abroad. But they are much less about any of that and much more about increasingly complicated domestic political drivers and intensifying geopolitical competition. As such, these laws and regulations reflect an amalgam of pressures, aspirations, hopes, and fears on all sides. Not least is the fear of losing out in the obsessively tracked technology race with China, in a potentially China-anchored new world order. Crucially, views on the spate of U.S. government actions are predicated upon governments continuing to provide the taxpayer grease needed for returns on capital. Seldom asked is whether taxpayers will remain willing, if they ever really were, to be the de-riskers of last resort.
All of this should be fodder enough for heightened risk and uncertainty in outlooks. Worse still is a vital underlying assumption, if not fully explicit, across every bit of the energy transitions landscape — that materials supply chains will deliver on time and in a cost-effective way.
Confusion about materials supply chains overburdens energy technologies and businesses, and spills into political fronts. How the extractives industries interact with other economic sectors, such as supplydemand balances and price signals, over the next year or so and beyond is no longer a simple story about oil and gas investment, fuel deliverability, and prices. Now, and going forward, the mix of different commodities, their market fundamentals, and the associated reactions and responses from different stakeholders is much more complicated. This is true even before considering possibilities that resource owning governments, including the U.S. federal domain, might abrogate mining contracts, unilaterally increase takes — royalties and taxes — or mandate higher shares for their national mining companies.
With regard to the basic industries that deliver the critical raw materials inputs for manufacturing, a profound disconnect exists between political aspirations and the economic realities that drive investment decisionmaking. That disconnect reflects some truisms in modern societies. One, we tend not to know where stuff comes from; two, worse, we tend not to care; and three, we do not want the production of what we consume to happen in our proverbial backyards. Of course, these generalizations do not apply to every individual, but for modern societies as a whole, they fit.2
The disconnect is rooted in desires to promote long-favored energy technologies such as wind, solar, and battery energy storage for power grids and mobility. All of these were originally proposed as solutions for the energy security crises of the 1970s and ’80s, and later championed as solutions to concerns about climate change. However, these favored alternative energy technologies have a most inconvenient dynamic. In short, the thermodynamic attributes of key components of the green energy kit result in a shift to lower energy density technologies with higher materials intensity. Not only does this dynamic run counter to dematerialization trends linked with economic development, but it also, in simplest terms, means more capacity to displace energy dense, carbon-based fuels.3 Compounding the push to greater materials intensity is an electrifying world committed to renewable energy sources. Much more system-level support is needed to deal with variability associated with intermittent generation assets such as wind and solar.4
All of these factors, in turn, place more stress on materials supply chains that must expand considerably to keep pace.5 Meanwhile, like other industries, the materials businesses from upstream to downstream are being subjected to the same pressures to decarbonize and demonstrate sustainability, among many other challenges. This makes for a unique circumstance as minerals suppliers strive to respond to green energy requirements while also meeting continued growth in consumption of minerals and metals in traditional nonenergy sectors and for defense.6
The breadth of media coverage on critical minerals provides some evidence of the disconnect between political aspirations and economic realities. As evidenced by Figure 1, expressed interest in critical minerals clearly has evolved. A significant inflection has taken place since 2020, but the uptick began a decade earlier.
FIGURE 1 — EVOLUTION OF INTEREST IN CRITICAL MINERALS WORLDWIDE
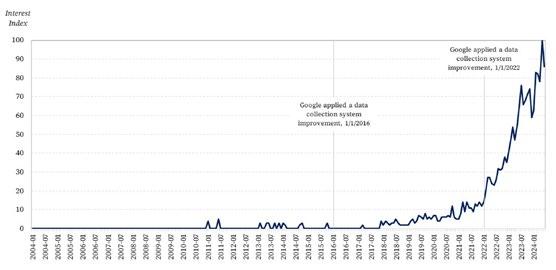
Source: The figure was constructed using data downloaded from Google Trends using the search term “Critical Minerals” for the entire world, covering January 2004 to June 2024.
MICHELLE MICHOT FOSS, PH.D.
Note: According to Google Trends, the Interest Index represents “search interest relative to the highest point on the chart for the given region and time. A value of 100 is the peak popularity for the term. A value of 50 means that the term is half as popular. A score of 0 means there was not enough data for this term.”
In the early part of the 2010s, falling costs of wind, solar, and battery components provided a boost to forecasts of increasing market shares for these technologies and drove greater advocacy efforts for more assertive policy and regulatory support. Any research or statements that hinted at potential stresses in raw materials supply were either discounted or viewed to be manageable.
At the end of the decade, the COVID-19 pandemic seemed to signal the dawning of peak oil demand.7 In addition, supply chain disruptions during the pandemic and as it eased increased transparency around China’s dominance of green energy materials and manufacturing, both of which were major reasons for perceived low costs of the green energy kit in the first place. Convergence of these developments triggered the first realizations of disconnect.
Exiting 2020, as the pandemic fog lifted, political imperatives for economic recovery combined with green energy aspirations to yield a flood of new green deal initiatives. In the U.S., they led to significant legislation in subsequent years that included the IIJA, CHIPs Act, and IRA, and have permeated agency rulemakings.
In 2021 and 2022, supply chain constraints coupled with a desired return to normalcy by consumers led to rapidly rising prices for oil and minerals commodities.8 Along with rising interest rates aimed at tamping inflation, higher costs undermined the projected profitability of green energy technologies. These same factors and the reliance on taxpayer support bolstered attention to domestic supply chains. The policy discourse became focused on reshoring, nearshoring, and job creation in an effort to bring home next generation manufacturing capability.
Importantly, political concerns about Chinese dominance across minerals supply chains have remained central to policy conversations focused on manufacturing. Over the past couple of years, closer examination of green energy requirements has brought new awareness of materials supply chain fragilities. This ultimately led to a growing recognition among enthusiasts of new energy technologies that significant political risks are associated with minerals and metals supply chains originating in Africa, South America, and other locations.9 Of course, improving domestic capabilities could help, but even if local opposition to mining and processing in the U.S. and Europe could be overcome, associated lead times are very long.
In 2023 and 2024, difficulties in executing large scale wind and solar projects and reduced interest in big ticket durables, such as subsidized battery electric vehicles (BEVs), began to weigh on metals prices.10 In addition, a flood of Chinese-produced raw materials and manufactured components such as batteries and solar equipment hit global markets, in part due to China’s economic slowdown. While the implications for lower minerals and metals prices might seem beneficial for investment in downstream applications, they do not serve the interests of expanding upstream supplies and recycling that will be needed for a seamless expansion of green energy technologies.
Prices are an important vector in determining capital flows into developing and maintaining activity along the entire supply chain. Within the mining industry, cost inflation — driven by long cycle times, higher compliance costs and labor expenses, and increased costs of capital — appears to be not only widespread but nontransitory.11 Low prices and high costs result in thin or negative profit margins that bode negatively for investor interest in developing new mining and processing capacity.
As indicated in Figure 2, commodity prices for metals have been significantly more volatile than the price of Brent crude oil. Much of this reflects the relative (to crude oil) lack of depth in metals markets. Strong policy-aided demand signals bumping against lumpy supply-side investments also drive price volatility. The cause is not relevant. Volatility bears implications for investment in the development of incremental
capacity. Capacity constraints ultimately slow the pace of adoption of technologies that require metals and materials.12
The best mining projects can withstand price volatility, and some operators may still be able to proceed with capital expenditures for decarb strategies and other sustainability imperatives. But those projects represent a relatively small portion of all mining assets.13 Investors everywhere, even in China with its heavy-handed state intervention, need to be made whole.14

Source: Prices accessed from S&P Global via license, and U.S. Energy Information Administration (Brent). Compiled by author.
Note: In contrast to other metals, copper is experiencing a strong boost in prices in 2024 as supply-demand dynamics around that commodity play out.
That suggests, of course, that the persistent question of China’s dominance along supply chains has bearing on price and on what is deemed a politically acceptable price, especially given aggressive green technology adoption goals. In a context of open, fungible global trade with a desire to get green energy technologies into the marketplace at scale and with pace, the source of production should not matter, and Chinese supply chain dominance should be of no concern. However, in a context of proactive domestic industrial policy with high expectations of domestic manufacturing content and jobs and associated economic benefits, Chinese supply chain dominance is, at the very least, uncomfortable.
In either case, it must be recognized that Chinese-produced green energy technology is subject to the same limiting constraints that green technology everywhere faces — the integrity, quality, and reliability of supporting electric power grids and systems must be sufficient for uptake. In many regions, this is a question that regulators, policymakers, and industry actors are grappling with as they push to reduce emissions.
MICHELLE MICHOT FOSS, PH.D.
Three major considerations flow from the disconnect between political aspirations and economic realities with implications for mid- and long-term outlooks. Each consideration must be reconciled in any forward view of metals and materials.
Forecasting is an inexact science, and forecasting commodity prices accurately has long been recognized to be near impossible. As seen in Figure 2, the swings in oil price over the last 10 years pale in comparison to movements in metals prices. If the past is an indicator of the future, this suggests forecasting metals prices will be fraught with uncertainty. To make matters even more difficult, since the collapse of the U.S. mining industry in the mid-1980s, much domestic metals trading and market analysis expertise has evaporated. In turn, the capabilities to sufficiently assess metals markets in order to evaluate market trends and investment opportunities, much less to regulate those same markets, have grown thin. This lack of depth leaves little ability to understand the wide variety of risks and uncertainties that pervade any outlook.
Few energy outlooks incorporate forward price signals other than oil and natural gas, and none accommodate the complex dynamics around metals’ and nonfuel materials’ supply-demand balances. Longer term outlooks are especially complicated given the range of possibilities for battery designs and chemistries, the enormous cones of uncertainty around electric power generation, transmission and distribution, the availability of recharging for an increasingly electrified transportation sector, and the huge uncertainties around the pace and timing of legacy vehicle fleet turnover.
To be clear, long-term outlooks are very cloudy when it comes to the pace of adoption of new technologies and their impact on the energy mix, and this is before considering the usual vagaries in GDP growth, population growth, and the evolution of regional manufacturing and international trade. All of that stated, the pace of energy transitions will very likely be set by the availability of critical minerals and metals. But it is a two-way street: A lack of clear market signals impedes raw materials investments — minerals, metals, chemicals, and more — while constraints in raw materials availability impedes manufacturing and deployment.
The world needs carbon, the basic building block of life. The bulk of intermediate and final materials are derivatives of hydrocarbon molecules.15 Delivering those materials in cost-effective ways without hydrocarbons as a raw material input is a mystery yet to be solved.16 This conundrum is a distinct problem for outlooks in general. Carbon materials are a critical part of new energy technologies — from plastics to composites to resins to lubricants to semiconductors. Any assumption that carbon materials can be removed from the picture biases against sustaining investment in producing carbon-based materials required for new energy technologies while imposing risks to energy supply-demand balances overall.
In the years ahead, advancements in developing new carbon materials, such as carbon nanotube (CNT) fibers, holds the potential to compete in metals applications.17 Given the significant research being conducted to find cost-effective approaches for generating high value carbon-based materials from hydrocarbon feedstocks, in which hydrogen also is an output, this space bears close watching.18 In fact, a very good question is: Should more focus be placed on carbon materials solutions, especially given the robust carbon assets in the U.S.?
The next 12 to 18 months will do much to reveal sensitivities as corporate capital spending strategies are stress tested.19 Inflation following the COVID-19 pandemic has done much to uncover interest rate dependencies in the clean energy technology sectors, along with mining and specialty materials. It also heightened growing concerns about government fiscal deficits and debts, as the U.S. IRA and other manufacturing subsidies are piled on top of pandemic recovery spending. The ultimate governor affecting the pace and timing of materials-dependent energy transition policies is likely to be the politics of government budgets and — in the U.S. and Europe — the appetite for growing dependence on Chinadominated supply chains for wind, solar, batteries, and BEVs.
1. The White House, “Fact Sheet: The Bipartisan Infrastructure Deal,” November 6, 2021, https:// www.whitehouse.gov/briefing-room/statements-releases/2021/11/06/fact-sheet-the-bipartisaninfrastructure-deal/; The White House, “Inflation Reduction Act Guidebook,” last modified September 21, 2023, https://www.whitehouse.gov/cleanenergy/inflation-reduction-act-guidebook/; The White House, “FACT SHEET: CHIPS and Science Act Will Lower Costs, Create Jobs, Strengthen Supply Chains, and Counter China,” August 9, 2022, https://www.whitehouse.gov/briefing-room/statementsreleases/2022/08/09/fact-sheet-chips-and-science-act-will-lower-costs-create-jobs-strengthensupply-chains-and-counter-china/; IRS, “Credits and Deductions under the Inflation Reduction Act of 2022,” https://www.irs.gov/credits-and-deductions-under-the-inflation-reduction-act-of-2022; and United States Environmental Protection Agency, “Final Rule: Greenhouse Gas Emissions Standards for Heavy-Duty Vehicles — Phase 3,” last modified June 17, 2024, https://www.epa.gov/regulationsemissions-vehicles-and-engines/final-rule-greenhouse-gas-emissions-standards-heavy-duty
2. While ignorance can often be attributed to a lack of education, research suggests that willful ignorance can be a choice motivated by a desired outcome (Linh Vu and Margarita Leib, “Why Some People Choose Not to Know,” opinion, Scientific American, December 11, 2023, https://www.scientificamerican.com/article/why-some-people-choose-not-to-know/).
3. This is noted, among other places, in Oliviero Bernardini and Riccardo Galli, “Dematerialization: LongTerm Trends in the Intensity of Use of Materials and Energy,” Futures 25, no. 4 (May 1993): 431–48, https://doi.org/10.1016/0016-3287(93)90005-E; and Kenneth B. Medlock III and Ronald Soligo, “Economic Development and End-Use Energy Demand,” The Energy Journal 22, no. 2 (April 2001): 77–105, https://doi.org/10.5547/ISSN0195-6574-EJ-Vol22-No2-4. For tables comparing energy output across various generation technologies, see Michelle Michot Foss, “Minerals and Materials for Energy: We Need to Change Thinking” (Houston: Rice University’s Baker Institute for Public Policy, January 24, 2021), https://doi.org/10.25613/qw8k-zn61; Gabriel Collins and Foss, “The Global Energy: Transition’s Looming Valley of Death” (Houston: Rice University’s Baker Institute for Public Policy, January 27, 2022), https://doi.org/10.25613/Y18Q-PM32; and Foss, “Mining, Minerals, and Materials in the Age of Sustainability and Alliances” (Houston: Rice University’s Baker Institute for Public Policy, February 8, 2024), https://www.bakerinstitute.org/research/mining-minerals-and-materials-age-sustainabilityand-alliances. Very large installed capacities are needed to generate equivalent units of electric power from wind and solar relative to coal, natural gas, and nuclear. The very large deviations between energy density and specific energy in gasoline and diesel, and that inherent in top-of-the-line lithiumion batteries underlies range anxiety for electric vehicles. Political risks flow accordingly.
4. The research base supporting this conclusion is expanding. See Robert Idel, “Levelized Full System Costs of Electricity,” Energy 259 (November 2022), https://doi.org/10.1016/j.energy.2022.124905; Peter R. Hartley, Medlock, and Shih Yu (Elsie) Hung, “ERCOT and the Future of Electric Reliability in Texas” (Houston: Rice University’s Baker Institute for Public Policy, February 7, 2024), https://doi.org/10.25613/EP4G-KW61; Gürcan Gülen et al., Competitiveness of RenewableGeneration Sources, The University of Texas at Austin’s Bureau of Economic Geology, Center for
MICHELLE MICHOT FOSS, PH.D.
Energy Economics, 2018, https://www.beg.utexas.edu/files/energyecon/CEE_Research_Note_ Competitiveness_Generation_Apr18.pdf; and Gülen, Net Social Cost of Electricity: Policy Smog and Waning Competitive Markets, Lack of Consumer Participation, Importance of the Grid, and Scalability Challenge, The University of Texas at Austin’s Bureau of Economic Geology, Udden Series 7, 2019, https://doi.org/10.23867/US0007D.
5. Currently, wind, solar, and batteries for stationary energy storage and mobility constitute roughly 10–30% of metals demand, depending upon the metal. The share is much higher for lithium, at around 60–70%. Most outlooks that incorporate net-zero targets put increases in demand for these metals at double or more current use. For example, see the International Energy Agency (IEA), Global Critical Minerals Outlook, 2024, https://www.iea.org/reports/global-critical-minerals-outlook-2024/outlookfor-key-minerals
6. See Foss, “Mining, Minerals, and Materials.” For a broader view of sustainability, see Rachel A. Meidl and Medlock, “The Pride and Prejudice of Sustainability: Rethinking Sustainability from a Systems Perspective” (Houston: Rice University’s Baker Institute for Public Policy, November 8, 2023), https:// doi.org/10.25613/20CH-3Z48
7. See, for example, Simon Evans, “Analysis: World Has Already Passed ‘Peak Oil,’ BP Figures Reveal,” CarbonBrief, September 15, 2020, https://www.carbonbrief.org/analysis-world-has-already-passedpeak-oil-bp-figures-reveal/.
8. Foss, “Building a Clean Energy Future Means Securing Vital Minerals Today,” opinion, The Hill, July 28, 2022, https://thehill.com/opinion/energy-environment/3577676-building-a-clean-energy-futuremeans-securing-vital-minerals-today/.
9. Several analyses examine aboveground mining risk in these regions. See, for example, Gavin Strong, “In Latin America, Risks Offset Rewards for Mining Sector,” Control Risks, June 27, 2022, https://www.controlrisks.com/our-thinking/insights/in-latin-america-risks-offset-rewards-formining-sector-amid-high-commodity-prices; and Vincent Rouget, “Political Risks in Africa’s Top 8 Mining Markets,” Controls Risks, January 30, 2023, https://www.controlrisks.com/our-thinking/ insights/political-risk-issues-to-watch-in-africa-top-8-mining-markets
10. See, for example, Jennifer McDermott et al., “Offshore Wind Projects Face Economic Storm. Cancellations Jeopardize Biden Clean Energy Goals,” Associated Press, last modified November 4, 2023, https://apnews.com/article/offshore-wind-orsted-cancellation-biden-new-jersey-3f2ff7c983 2210ce862f6e7179fae439; and Camila Domonoske, “EVs Won Over Early Adopters, But Mainstream Buyers Aren’t along for the Ride Yet,” National Public Radio (NPR), February 7, 2024, https://www.npr.org/2024/02/07/1227707306/ev-electric-vehicles-sales-2024.
11. This was a persistent view at the Prospectors and Developers Association of Canada (PDAC) convention in Toronto, March 3–6, 2024.
12. A robust literature in economics and business exists on the various implications of lumpy capital investment, ranging from impacts on price volatility to monetary policy to investment. Lumpy investment is characterized as such because the targets are typically large and not divisible. Projects that have large lead times, require significant capital outlay, and cannot be scrapped into parts for cost recovery tend to fit this definition. Lumpy investments include energy and mining assets, such as power generation facilities, refineries, mines and metals processing as smelting and refining, and so on.
13. Meidl, Foss, and Ju Li, “Waste Management of Alternative Energy Supply Chains” (Houston: Rice University’s Baker Institute for Public Policy, March 2, 2022), https://doi.org/10.25613/BB1T-4K23.
14. For a case study on how it all happens, see Foss and Jacob Koelsch, “Need Nickle? How Electrifying Transport and Chinese Investment Are Playing Out in the Indonesian Archipelago” (Houston: Rice University’s Baker Institute for Public Policy, April 11, 2022), https://doi.org/10.25613/30S0-Y623.
15. Foss, “The ‘Criticality’ of Minerals for Energy Transitions. Hydrocarbons? Yes, Hydrocarbons” (Houston: Rice University’s Baker Institute for Public Policy, February 8, 2021), https://www.bakerinstitute.org/research/the-criticality-of-minerals-for-energy-transitionshydrocarbons-yes-hydrocarbons. For another version of this publication, see Foss, “How Fossil Fuels, Ironically, Are Critical in the Development of Renewable Energy Sources,” Forbes, February 8, 2021, https://www.forbes.com/sites/thebakersinstitute/2021/02/08/the-criticality-of-minerals-for-energytransitions-hydrocarbons-yes-hydrocarbons/?sh=256a5d89140d. Meidl, “Schrödinger’s Cat Paradox: Carbon Is the Enemy. Carbon Is Not the Enemy.” (Houston: Rice University’s Baker Institute for Public Policy, August 9, 2023), https://doi.org/10.25613/5ED9-S212
16. No net-zero outlook scenario fully incorporates oil and gas value chain financial balances with losses in revenue from fuels sales.
17. On circular carbon and carbon nanotube (CNT), see Dana Goerzen, Daniel A. Heller, and Meidl, “Balancing Safety and Innovation: Shaping Responsible Carbon Nanotube Policy” (Houston: Rice University’s Baker Institute for Public Policy, February 28, 2024). https://doi.org/10.25613/ PV4W-V980
18. See, for example, Carbon Hub, Rice University, https://carbonhub.rice.edu/. CES is operating two projects for Rice Carbon Hub, one of which is focused on metals displacement by CNT.
19. Foss, 2024, “Can ‘Policy Push’ Industries Survive When Profitability Is Aspirational?,” LinkedIn post, March 2024, https://www.linkedin.com/feed/update/urn:li:activity:7177073859823640576/


STEVEN R. MILES, J.D. Fellow in Global Natural Gas, Center for Energy Studies
For the past 50 years, worldwide reliance on liquified natural gas (LNG) has continuously grown despite regional conflicts, economic recessions, technological shifts, blockades, a global pandemic, climate change-related policies, government taxes, tariffs, price caps, new regulations, and other market interventions. Whether that trend continues will be tested starting in 2024 and continuing over the next few years.
FIGURE 1 — GLOBAL LNG LIQUEFACTION CAPACITY BY REGION, 2000–28
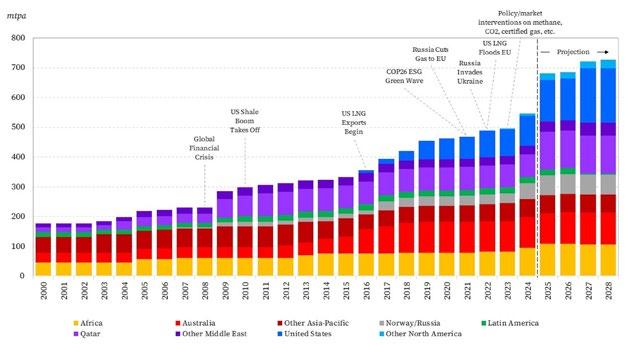
Source: Data for figure are from Cedigaz, author’s annotations.
As to be expected, given the growth in liquefaction capacity seen in Figure 1, LNG demand has risen
STEVEN R. MILES, J.D.
significantly since 2000, increasing almost four-fold. Despite such impressive growth, the near-term outlook for LNG is highly uncertain. In fact, LNG market developments over the near term will be influenced by three dominant, intertwined themes — trade and geopolitics, cumulative decarbonization regulations, and the U.S.’s LNG “pause.”1 The impacts of changes in these three thematic areas will have far-reaching implications that will shape the global LNG market and regional gas markets for years to come.
For the U.S. LNG export industry, flexibility is a cornerstone of supply agreements. This allows exporters and downstream purchasers to resell or divert cargoes to other destinations without the need for approval from either governments or LNG suppliers. Such contract flexibility makes U.S. LNG supply an attractive option for portfolio players, injects much needed liquidity into the global market, and has altered the global supply portfolio dramatically over the last decade. 2
U.S. LNG export projects require approval from the U.S. Department of Energy (DOE), as the Natural Gas Act states that LNG exports are deemed to be in the public interest unless otherwise determined by the DOE. With the exception of prohibiting exports to four sanctioned countries — North Korea, Iran, Libya, and Syria — the DOE has never rejected an application for an LNG export permit.
However, in the last sentence of a recent website post that has apparently received scant, if any, notice, the DOE suggested one outcome of its “pause” in issuing new LNG export permits could be to mitigate the risks caused “by selling our energy resources to competitor countries that don’t align with our interests and those of our allies.”3 Such a criterion has never been part of the public interest standard under the Natural Gas Act to date.
If the Biden administration is preparing to block permits for new LNG exports to China, for example, this would have major repercussions.4
1. As noted above, the U.S. has never rejected LNG exports to any country unless that country is fully sanctioned for terrorist-supporting activity. Is the Biden administration proposing to sanction all petroleum product sales to China on this basis? If so, what other publicly traded commodities are the U.S. considered banning from export to China? Agricultural products?
2. Even if the DOE were merely to give a priority to export applications that named destination countries other than China, such a policy would be of no benefit as U.S. LNG contracts are destination flexible; free to board (FOB) buyers could flip the cargoes back-to-back to buyers who would take them to China. If such an approach is used, the DOE would merely have deprived U.S. LNG project developers from securing long-term contracts, which are vital for securing project financing, from a specific set of customers. Moreover, it would create an arbitrage value between customers in China and customers who are elsewhere that would be captured by others.
3. The reaction of China to an announced embargo could potentially be disastrous, as many consider the U.S. embargo of petroleum products to Japan in 1941, for example, to have been.
China’s purchases of long-term LNG from the U.S. have been growing, particularly in the run-up to, and immediately following, Russia’s invasion of Ukraine in 2022 (Figure 2).5 In the six months before the war, China signed contracts for 91% of the firm LNG sold worldwide: most of that from U.S.-based projects using 12 companies, all but one of which were state-owned and nine of which had never purchased LNG previously.6 Even so, the appropriate policy reaction for the U.S. is not to ban China from buying LNG from the U.S.; rather, it is to stimulate other customers, such as European buyers, to commit to more long-term contracts. Interestingly, even in the immediate wake of the disruption of Russian pipeline supplies, European buyers continued to purchase the majority of LNG on a spot basis rather than signing long-term contracts.7
While there have been some notable public announcements more recently, this remains true today.
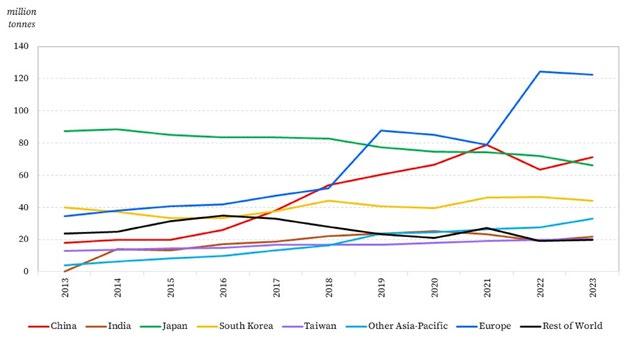
Source: Figure data sourced from Cedigaz.
The last several months have seen a dizzying array of new government initiatives in various countries with the goal of monitoring, measuring, reporting, standardizing, limiting, or taxing carbon dioxide and/or methane in the natural gas and LNG value chain. Some are final; others will likely soon become so; many have garnered public attention; and a few have slipped by in the torrent with little public notice. Some examples include:
• Under the Inflation Reduction Act, a Waste Emissions Charge (methane fee) for certain levels of methane emissions and fugitive methane will be imposed, starting at $900 per metric tons (mt) of CH4 in 2024 and rising to $1,500 per mt for emissions in 2026 and later. The methane fee will be applied to methane reported by emitters under subpart W of the Greenhouse Gas Reporting Program (GHGRP).
• That methane fee is being applied to LNG producers by the EPA amending subpart W of the GHGRP to require LNG liquefaction project owners to report methane emissions from their acid gas removal units — the major methane emitting components — making them potentially subject to the methane fee.
• DOE has paused processing applications for LNG export permits to assess, among other things, the impact of greenhouse gas emissions due to LNG exports, leaving LNG export applicants to
R. MILES, J.D.
wonder what methane intensity or emission limits might be imposed on applicants.
• The IRS is finalizing rules to determine which types of hydrogen production facilities will qualify for section 45V tax credits, and whether methane intensity will be a factor in allowing some power to be provided by natural gas facilities.
• The Securities and Exchange Commission (SEC) has issued its final rules requiring public disclosure of Scope 1 and 2 emissions, as well as risks due to material climate events. These rules are not equivalent to those imposed by the EU, or by the state of California, and will lead to significant duplication of recordkeeping and reporting costs.
• The EU has extended its carbon tax to include LNG cargoes into Europe starting in 2024. The EU has further agreed to start monitoring methane emissions of countries and companies and to define acceptable limits for fossil-fuel imports across the value chain. A first draft refers to LNG import contracts, but a complete methane tax on all LNG imports exceeding defined methane limits or a new import duty under the EU Carbon Border Adjustment Mechanism (CBAM) are both realistic possibilities. Japan, South Korea, and Canada are among other countries examining various forms of carbon and/or methane taxes or tariffs.
As shown below, an EU carbon tax could be enough to affect the competitiveness of a U.S. LNG project. Taken together, the various taxes, tariffs, and reporting requirements and regulations of the types listed above could have a compounding impact on the U.S. LNG industry. These warrant a close inspection and analysis.
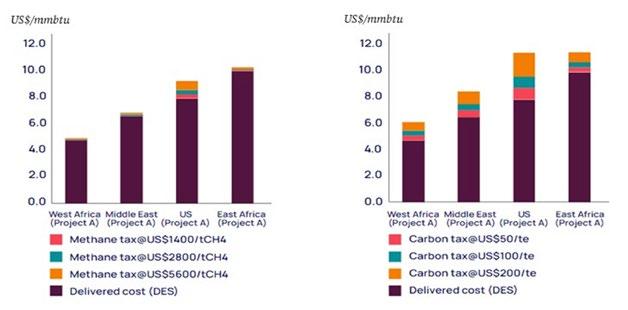
Source: Figure reproduced from Wood Mackenzie.
Much has been written about the DOE’s “pause” in reviewing applications to export LNG to non-free trade countries — except that nothing in the public domain has been written about how DOE should formulate a strategy going forward that will do all it said it plans to accomplish. How does one support free trade, help our allies, protect American consumers, and, perhaps most importantly to the Biden administration, “decarboniz[e] the natural gas value chain to achieve net-zero emissions by midcentury”?8
How exactly does one do a full accounting for emissions along the entirety of an LNG value chain? It may seem simple, but it is not (Figure 3).9 For example, tying upstream emissions to specific producers and gas sales (even assuming measurement technologies can allocate emissions within a field or production area to specific gas producers and streams), and then trying to track those emissions through the mixing bowls of Henry Hub or any of the other major gas transfer hubs requires more estimation than calculation. Similarly, after the point of title transfer when a cargo is delivered FOB from a liquefaction facility in the U.S. is a challenge, to say the least. LNG becomes blended with the residual heel LNG in the ship, and later blended again with LNG from other sources in the buyer’s receiving terminal storage tanks. It could even be reloaded and reexported, compounding the blending phenomenon. This then begs a very relevant question: How will the emissions accounting be done for the entire lifespan of a given facility? In short, there is enormous uncertainty around measurement and reporting requirements, not to say how assessments will be made prior to a facility receiving an export authorization, which will have significant implications for the growth prospects of the U.S. LNG industry.
While the number of uncertainties and intensity of headwinds seems to be mounting for the LNG industry, significant positive signs are present. To begin, the global demand for natural gas continues to grow. As recently noted in the Energy Institute’s annual “Statistical Review of World Energy,” despite global natural gas demand remaining relatively flat in 2023 relative to 2022, global gas demand has increased by 19% since 2013, or roughly 1.7% per year.10 Moreover, the apparent flattening of global demand over the last couple of years is entirely attributable to the situation in Europe, where demand has fallen by about 10 billion cubic feet per day (bcf/d) since 2021 in the wake of Russia’s invasion of Ukraine, meaning it has grown by a similar amount everywhere else.
In addition, despite the overall natural gas demand reduction seen in Europe, LNG imports to the region have increased by 61.6 billion cubic meters (bcm) from 2021 to 2023 help offset the loss of pipeline imports from Russia.11 Of course, this growth will not continue, as the situation in Europe is hopefully an aberration driven by the conflict in Ukraine, but the current level of imports will not likely abate substantially in the near-term given the lack of substitutes for natural gas to Europe. Importantly, the declines seen in imports to many other regions over the last couple of years are not likely to persist given the energy needs of developing economies in those regions. Asian buyers, in particular, saw cargoes diverted away to help Europe in 2022; however, those buyers are likely to want to resume their purchases as the crisis in Europe passes and LNG prices moderate.
In total, the global LNG market has grown by 222 bcm since 2013, a pace of 5.3% per year.12 It is likely to continue to grow, as long as supply is available and as import-dependent economies look for flexible power supply and industrial heating options that have lower carbon intensity than coal. Carbon tariffs in Europe and elsewhere on steel, aluminum, fertilizer, and other products should also begin to tilt the playing field toward imported products made with lower carbon- and methane-producing fuels, favoring LNG.
STEVEN R. MILES, J.D.
The longer-term outlook for U.S. LNG exports remains bright, notwithstanding the aforementioned structural uncertainties that could raise costs. But the near term is clouded by the ever-present concerns about adequate investor returns, which are fueled by a lack of clarity on agency interpretations of recent legislation, uncertainties in the political theater about various environmental initiatives in Europe and the U.S., trade tensions between the U.S. and China, and willingness among certain buyers — especially in Europe — to execute long-term offtake agreements amid uncertainties about long-term demand. Suffice it to say that the LNG market is sailing into seas it should be well-adept at navigating — choppy and deep.
1. Gabriel Collins and Steven R. Miles, “Is the US Preparing to Ban Future LNG Sales to China?” (Houston: Rice University’s Baker Institute for Public Policy, April 25, 2024), https://doi.org/10.25613/TA53-BN97.
2. For more on this, see Peter R. Hartley and Kenneth B. Medlock III, “Debt and Optionality in U.S. LNG Export Projects,” The Energy Journal 44, no. 2 (March 2023), https://doi. org/10.5547/01956574.44.2.phar; and Medlock, “US LNG Exports: Supply, Siting and Bottlenecks,” May 16, 2023, https://www.bakerinstitute.org/research/us-lng-exports-supply-siting-and-bottlenecks, from Energy Futures Initiative (EFI), The Role of U.S. Natural Gas Exports in a Low-Carbon World, April 2023, https://efifoundation.org/topics/the-role-of-u-s-natural-gas-exports-in-a-low-carbon-world/.
3. U.S. Department of Energy (DOE), Office of Fossil Energy and Carbon Management, “The Temporary Pause on Review of Pending Applications to Export Liquefied Natural Gas,” February 2024, https:// www.energy.gov/sites/default/files/2024-02/The%20Temporary%20Pause%20on%20Review%20 of%20Pending%20Applications%20to%20Export%20Liquefied%20Natural%20Gas.pdf.
4. Collins and Miles.
5. Figure 2 appears in Stephen Stapczynski, “China’s Taking Control of LNG as Global Demand Booms,” Bloomberg, February 19, 2023, https://www.bloomberg.com/news/articles/2023-02-19/china-smoving-to-take-control-of-liquefied-natural-gas-as-global-demand-booms.
6. Miles and Collins, “China’s Big Gas Bet Raises Questions about Complicity with Russia,” Foreign Policy, June 12, 2023. https://foreignpolicy.com/2023/06/12/china-natural-gas-russia-ukraine-war-energy/.
7. Collins and Miles, “Why Is Europe Not Replacing Russian Pipeline Gas with Long-Term LNG Contracts?” (Houston: Rice University’s Baker Institute for Public Policy, September 13, 2023), https://doi.org/10.25613/3FRC-FA56.
8. DOE.
9. Figure 3 appears in Massimo Di Odoardo et al., “Call of Duties: How Emission Taxes on Imports Could Transform the Global LNG Market,” Wood Mackenzie, March 2024, https://www.woodmac.com/horizons/emission-taxes-could-transform-global-lng-market/. The note accompanying the figure reads: “Methane taxes of US$1,400, US$2,800 and US$5,600 per tonne of CH4 have been used, equating to taxes of US$50, US$100 and US$200 per tonne of CO2e, respectively, assuming a global warming potential (100-year GWP) of 28, in line with the IPCC Fifth Assessment Report” (Wood Mackenzie).
10. Energy Institute (EI), Statistical Review of World Energy, 2024, https://www.energyinst.org/statistical-review
11. EI.
12 EI.


MARK FINLEY Fellow in Energy and Global Oil, Center for Energy Studies
Oil remains the world’s leading energy source, as has been the case for several decades (Figure 1). While the long-term role of oil in energy transitions remains uncertain, oil market developments will continue to have profound economic and geopolitical impacts for the U.S. and around the world in the near-term. As the U.S. election season ramps up, prices at the pump will remain a bellwether for consumer and business confidence and politicians’ approval ratings. Accordingly, crude oil and refined products will remain in the eyes of consumers, companies, and policymakers, even amid the long-term transition of the U.S. and global energy system.
FIGURE 1 — WORLD ENERGY CONSUMPTION BY FUEL 2023
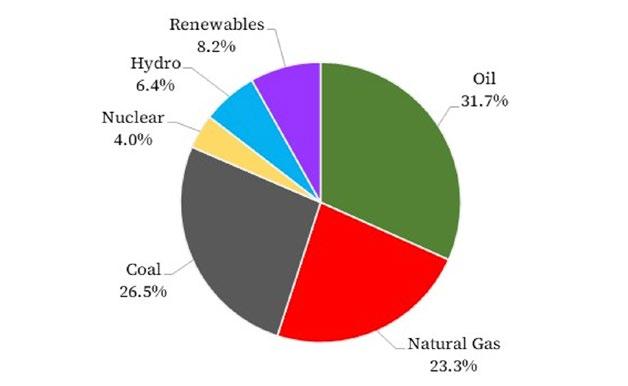
Source: Energy Institute, “Statistical Review of World Energy 2024.”
MARK FINLEY
That is easy! When it comes to the oil market, it is important to watch global trends in supply, demand, and inventories.
As of mid-June 2024, there is an unusually large disagreement among the major forecasters over the pace of global demand growth this year, as well as into the more distant future. The year 2023 saw continued strong growth — the tail end of the COVID-19 pandemic demand recovery. Most forecasters expect a marked deceleration of demand this year, with the U.S. Energy Information Administration (EIA) and the International Energy Agency (IEA) projecting growth of 1.1 million barrels per day (bpd) and 1 million bpd, respectively.1 In contrast, the Organization of the Petroleum Exporting Countries (OPEC) maintains a very bullish view, projecting growth this year of 2.2 million bpd. 2
The path of global demand over the course of 2024–25 will play a critical role in determining oil prices. In particular, China’s economic activity and the risk of a recession in countries around the world will impact the demand outlook.
Finally, looking beyond considerations of economic growth and price, much of the debate around demand is centered on the pace of electric vehicle (EV) uptake and efficiency improvements. Will we begin to see a material slowing of oil demand in road transport, or will peak oil demand continue to be just out of reach?
In addition to demand growth, the ability of the global refining system to keep pace with demand is something to watch. Most obviously, recent drone attacks by Ukraine on Russian refineries could impact fuel exports with Russia playing a particularly important role as an exporter of diesel fuel. Elsewhere, while new refineries in Asia, the Middle East, and Latin America should keep pace with regional demand, ongoing rationalization of refinery capacity in Europe and Organization for Economic Co-operation and Development (OECD) Asia — and repurposing of refineries to biorefineries — could help to support regional refining margins and impact global refined product flows. Sophisticated U.S. refineries appear well-suited to remain competitive, with the U.S. having replaced Russia in recent years as the world’s largest exporter of refined products.
Over the past decade, the U.S. has accounted for an astounding 90% of global oil supply growth, driven by the shale revolution. But is that about to change? After yet another year of surprisingly strong growth — 1.5 million bpd for crude and natural gas liquids (NGLs) — U.S. oil production is expected to slow dramatically this year. EIA is currently projecting growth this year and next of just 0.4 million bpd and 0.6 million bpd, respectively. Ongoing pressure from financial investors to prioritize cash flow over drilling, industrial consolidation, and maturing of the shale resource all point to a slower growth trajectory. Yet, U.S. producers have continued to surprise analysts with their ingenuity. Better drilling and hydraulic fracturing techniques, application of data analytics, and longer lateral wells have contributed to U.S. supply consistently exceeding expectations.3 Going forward, how will the balance of these forces play out? Has upstream ingenuity reached a point of diminishing returns, or are there still technical and operational gains to be made?
The large group of oil-producing countries in the OPEC+ group — including OPEC and ten other producers led by Russia — has instated a series of large production cuts in recent years to support prices in the face of strong supply growth in the U.S. and elsewhere. Most recently, members including Saudi Arabia and Russia have added so-called voluntary cuts in addition to official quota reductions, with the current plan calling for those cuts to remain in place through September 2024, then being very gradually eased as market circumstances allow. Recent market dynamics have seen the group continually deepening and lengthening the duration of their production restraint.4 These cuts have created tensions within the group, albeit manageable ones.5 OPEC heavyweight Saudi Arabia has so far chosen to deal with occasional overproduction among group members — most notably by Russia and Iraq — with a mix of negotiating carrots and sticks, but has not opted to trigger a price war by increasing its own production.
From an energy security perspective, the upside of aggressive OPEC+ production cuts is a large buffer of spare production capacity, which the IEA estimates is, as of May, nearly 6 million bpd, largely held in Saudi Arabia, the United Arab Emirates (UAE), and other Arabian Gulf producers. In a supply disruption, spare capacity represents the market’s first line of defense, if producers elect to use it.
For the near term, a couple of key questions exist, connecting market balance and OPEC+ decisionmaking. Will trends in global demand and non-OPEC supply finally allow the group to relax their production restraint? If market conditions do tighten, will the group choose to increase output, or let prices rise? Alternatively, if the market becomes increasingly over-supplied, as recently noted in the IEA’s outlook to 2030, will OPEC+ members continue to restrain production in an effort to support prices, or trigger a price war to expand market share?6
Fifty years after the Arab Oil Embargo, the Hamas attacks in Israel on Oct. 7, 2023, and resulting Israeli invasion of Gaza stoked fears of a broader regional conflict.7 So far, we have not seen material disruptions to regional oil production, although Houthi attacks on shipping in the Red Sea have resulting in significant diversions of cargoes, increasing sailing times and adding incrementally to transport costs. If the conflict spreads — or threatens to spread — to oil-producing countries or threatens oil flows through the strategic Strait of Hormuz through which over 20 million bpd of crude and refined products flow, the impact on prices would be significant.8 The mere threat of such a disruption raises the stakes, especially if actors capitalize on that threat for geopolitical gain. Importantly, key regional producers have so far avoided any discussion of using oil as a political weapon.
As always, geopolitical issues more broadly will continue to loom large for the oil market. Among factors currently in play are Western sanctions on Russia — including the G7 price cap — Ukrainian attacks on Russian energy infrastructure, and the status of U.S. sanctions on Venezuela and Iran, each of which can disrupt production and flows of both crude oil and refined products.9 Similarly, domestic policy choices in China regarding export quotas for refined products, with China now the world’s largest oil refining nation and a significant exporter of refined products, can have far-reaching implications for global market balance.
While U.S. domestic policy has the potential to evolve significantly over the next few years, options for materially impacting the market are very limited. Simply put, there is not much a U.S. president can do to influence prices of crude oil or refined products in the near term.
The key exception to this is the use of the Strategic Petroleum Reserve (SPR). Even after the large release following the Russian invasion of Ukraine — the largest SPR withdrawal on record — the U.S. stockpile still holds some 360 million barrels of crude oil. Including other IEA member countries, strategic stocks of crude oil and refined products exceed 1.2 billion barrels — a formidable tool along with OPEC spare capacity for managing any future supply disruptions.10 The U.S. president has broad authority to decide whether to release crude oil from the SPR, either unilaterally or in coordination with other countries. Additionally, the president has authority to manage the pace of already-funded purchases of crude for the stockpile, as seen by the on-again, off-again nature of modest SPR purchases as oil prices have fluctuated.11
Beyond the SPR, the pace of federal permitting for drilling and regulation of methane and other drillingrelated emissions remains contentious. Of course, the pace of U.S. upstream investment has been constrained by a host of economic, financial, and technical factors, with federal policy far from presenting the most challenging obstacle for U.S. drillers. With the heavy majority of onshore domestic oil production taking place on private land, policy changes regarding the development of federal lands are unlikely to present a significant hurdle for upstream investment across the entirety of production opportunities in the U.S. Moreover, the lags between issuing permits and developing and implementing drilling programs mean that the impact of any such change is unlikely to significantly impact the trajectory of U.S. production over the next year or so, even on federal lands.12
Oil is the single most strategic commodity in the world, and by far the largest source of energy for the U.S. and global economies. This fact will remain true, at least into the medium term. Even amid a growing focus on long-term transitions of the U.S. and global energy systems, industry, governments, and analysts will continue to track oil market developments and their impacts on producers and consumers. The slate of issues currently in play, coupled with the ongoing importance of oil in the domestic and global energy mix, as well as an election in the U.S. that could change the view of the investment landscape for oil, makes tracking the development of 2024–25 interesting, at the very least, and certainly not boring.
1. U.S. Energy Information Administration (EIA), Short-Term Energy Outlook, July 9, 2024, https://www.eia.gov/outlooks/steo/; International Energy Agency (EIA), Oil Market Report — June 2024, 2024, https://www.iea.org/reports/oil-market-report-june-2024
2. Organization of the Petroleum Exporting Countries (OPEC), “Monthly Oil Market Report,” https://www.opec.org/opec_web/en/publications/338.htm. These differences extend to the groups’ 2025 outlooks, with OPEC projecting continued strong demand growth of 1.8 million bpd, while the EIA and IEA are projecting growth of 1.5 million bpd and 1 million bpd, respectively.
3. Claudio Galimberti and Mark Finley, “OPEC+ Cuts Should Tighten the Market,” Rystad Energy, January 22, 2024, https://www.rystadenergy.com/insights/opec-cuts-should-tighten-the-market. For a version of this piece published with the Baker Institute, see https://www.bakerinstitute.org/research/opec-cuts-should-tighten-market.
4. Finley, “OPEC+ Agrees to Additional Production Cuts: Market Responds with a Shrug” (Houston: Rice University’s Baker Institute for Public Policy, December 6, 2023), https://doi.org/10.25613/0DQK-6847
5. Jim Krane, Kristian Coates Ulrichsen, and Finley, “Should Abu Dhabi Quit OPEC? Reconsidering the UAE’s Membership” (Houston: Rice University’s Baker Institute for Public Policy, June 1, 2023), https:// doi.org/10.25613/dt16-5153
6. IEA , “Slowing Demand Growth and Surging Supply Put Global Oil Markets on Course for Major Surplus This Decade,” June 12, 2024, https://www.iea.org/news/slowing-demand-growth-and-surging-supplyput-global-oil-markets-on-course-for-major-surplus-this-decade
7. Krane and Finley, “Rising Oil Prices, Surging Inflation: The Arab Embargo 50 Years Ago Weaponized Oil to Inflict Economic Trauma,” The Conversation, October 11, 2023, https://theconversation.com/rising-oil-prices-surging-inflation-the-arab-embargo-50-years-agoweaponized-oil-to-inflict-economic-trauma-214670. For a version of this piece
8. published with the Baker Institute, see https://www.bakerinstitute.org/research/arab-embargo-50years-ago-weaponized-oil-inflict-economic-trauma-sound-familiar.
9. EIA , “The Strait of Hormuz Is the World’s Most Important Oil Transit Chokepoint,” November 21, 2023, https://www.eia.gov/todayinenergy/detail.php?id=61002.
10. Finley and Anna Mikulska, “Wielding the Energy Weapon: Differences Between Oil and Natural Gas” (Houston: Rice University’s Baker Institute for Public Policy, June 26, 2023), https://doi.org/10.25613/ G9P2-3F78.
11. This figure is for IEA member countries only and excludes strategic stockpiles in China and several other oil-importing countries. The size of China’s stockpile is not publicly available.
12. Timothy Gardner, “US Speeds Up Purchasing for Strategic Petroleum Reserve as Oil Prices Dip,” Reuters, June 7, 2024, https://www.reuters.com/business/energy/us-seeks-6-million-barrels-oilstrategic-petroleum-reserve-2024-06-07/; Shelby Webb, “DOE Cancels Purchases for Strategic Oil Reserve,” E&E News, Politico, April 4, 2024, https://www.eenews.net/articles/doe-cancels-purchasesfor-strategic-oil-reserve/
13. In addition to federal lands, oil production in federal waters in the Gulf of Mexico is significant — currently roughly 1.8 million bpd — but the lead times for deepwater projects means that changes to offshore leasing policy are unlikely to materially impact domestic production over the next several years.


MAHMOUD A. EL-GAMAL, PH.D.
Rice Faculty Scholar, Center for Energy Studies, and Professor of Economics and Statistics and Chair in Islamic Economics, Finance, and Management, Department of Economics, Rice University
In May 2023, the Federal Funds Rate topped 5% for the first time since the Great Recession of 2007–08.1 From that time onward, market participants’ predictions have reversed course several times about when the Federal Reserve might stop raising interest rates to fight inflation and when it might reverse course and start reducing interest rates again. As of mid-June 2024, the picture remains murky. At one extreme, some are still forecasting two or more interest rate cuts before the end of the year. At the other extreme, some forecast a possible interest rate hike before the end of the year. 2
FIGURE 1 — WEST TEXAS INTERMEDIATE (WTI) AND SUPERNORMAL BACKWARDATION WITH PERCENTAGE DIFFERENCE BETWEEN CL1 AND CL4
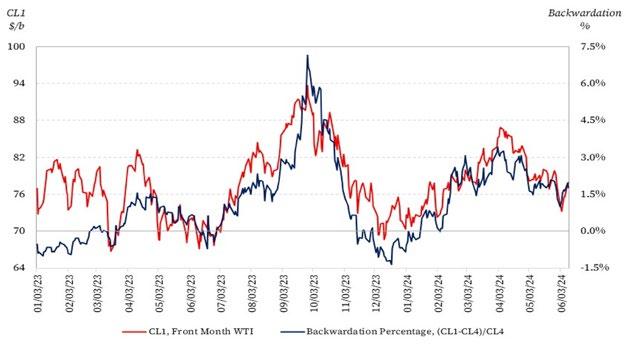
Source: Data for CL1 and CL4 are collected from U.S. Energy Information Administration (EIA) (until April 5, 2024), Barchart (for historical May and June 2024 contract prices), and Yahoo Finance (July through October 2024 contract prices). CL1-to-CL4 backwardation percentage is calculated from the concatenated data by author.
MAHMOUD A. EL-GAMAL, PH.D.
For analysts interested in forecasting oil prices in the near term, the financial market sport of Fed watching — trying to anticipate monetary policy changes — is a must because it has implications for commodity prices and the term structure of futures prices. Figure 1 shows that over the past year, oil prices have closely followed the market condition termed, “supernormal backwardation”: the degree to which the front-month price is abnormally high, percentage-wise, relative to later — here fourth — month futures contract prices.3 This analysis was motivated by the insight that financial speculators prefer to trade in the most liquid front-month West Texas Intermediate (WTI) contract, which serves as tail-wagging-the-dog, purely-financial speculation in short-term futures contracts that may be driving longer-tenor futures prices.
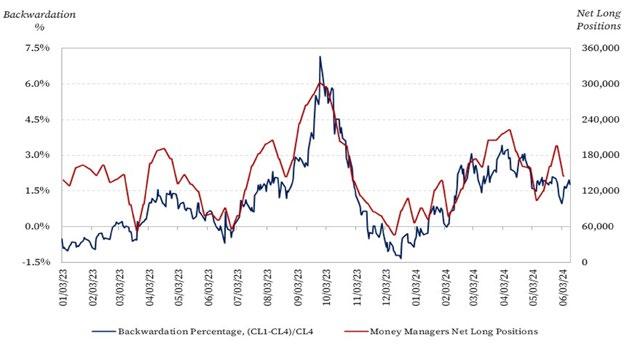
Source: Net Long positions are taken from Commodity Futures Trading Commission’s Commitment of Traders reports.
Figure 2 validates our insight that speculators tend to invest in the most liquid front-month contract. It shows that since May 2023, the degree of supernormal backwardation has followed very closely the net long positions of money managers in oil futures contracts. In other words, this supports the hypothesis that the speculative behavior of money managers has strongly influenced oil prices over the past year. Indeed, money managers have invested in oil futures, as well as other commodity futures, as financial assets that are relatively uncorrelated with bonds. When bonds underperform, the shift to investing in oil futures tends to raise the front-month price. Bond prices fall when interest rates rise, a phenomenon that almost caused a domino-effect worldwide banking crisis when the medium-sized Silicon Valley Bank failed in March 2023. Hence, rising interest rates provide a financial market signal that influences oil futures.
There is ample direct evidence of purely financial speculation in commodities in the recent Fed monetary policy cycle. As early as April 2022, when the Fed had just started raising interest rates to fight inflation, Bloomberg reported that investment advisors at Bridgewater had advised investors to switch from bonds to commodities. The article was explicitly titled: “With Bonds in A ‘Coma,’ Buy Commodities.”4 By February 2024, Bloomberg reported that the most successful hedge fund, Citadel, which considers commodities to be one of their five core investment strategies, “along with equities, credit and convertibles, quantitative strategies and fixed income and macro,” had made profits of more than $8 billion in 2022 and $4 billion in 2023 from their commodities investments.5 Investors seeking returns in this asset class may focus on different commodities at different times. Indeed, earlier and later in the cycle, they focused primarily on gold, silver, and copper. However, oil became the primary focus in this mini bubble after the terrorist attack of Hamas on Israel on Oct. 7, 2023.
It now remains to show that fluctuations in money managers’ net long positions, which drove fluctuations in oil prices, followed Federal Reserve policy forecasts of Fed watchers. CME Group’s FedWatch Tool’s historical data can be used to construct a series of the implied probability of no interest rate cuts in the following six months starting at each date.6 Those probabilities are imputed from prices of CME options on the secured overnight offer rate (SOFR), which is calculated from aggregated data on banks’ overnight Treasury bill repo agreements. While the methodology for estimating these unconditional probabilities is questionable, it is sufficient for our purpose.
FIGURE 3 — SUPERNORMAL BACKWARDATION OF WTI AGAINST IMPLIED PROBABILITY OF NO RATE CUTS IN FOLLOWING SIX MONTHS
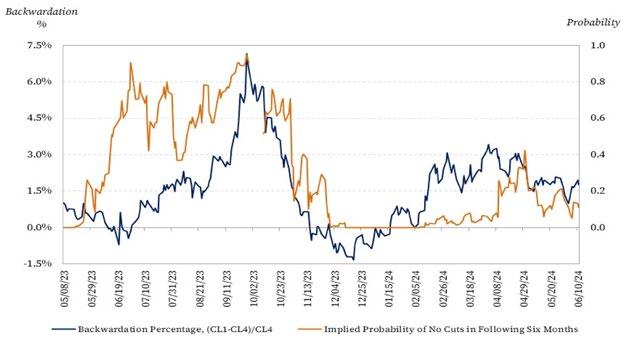
Note: The Implied Probability data series is calculated by the author using the CME Group’s FedWatch Tool’s historical data files.
Figure 3 shows that the periods with a calculated heightened probability of no interest rate cuts over the following six months, which are detrimental for bonds, are periods during which supernormal backwardation of the WTI forward curve and front-month WTI prices rises significantly. The two most
MAHMOUD A. EL-GAMAL, PH.D.
prominent episodes were around October 2023 and early 2024. It is easy to attribute the rise in oil prices in October 2023 only to the terrorist attack by Hamas on Israel, Israel’s military response, and the fear of greater Middle East military hostilities. This geopolitical narrative is an important part of our explanation for why liquidity would flow to oil markets, rather than other commodities like metals, as we had seen earlier and later. Still, an essential driver of that mini bubble in commodities is the relative unattractiveness of bonds when interest rates are not expected to fall significantly in the near future.
In addition to fundamental market analysis — based on the physical market supply and demand of oil — and geopolitical analysis — focused on potential disruption or manipulation of the physical market — those interested in forecasting oil prices should also join the ranks of Fed watchers. As monthly data on inflation and unemployment are released, Fed watchers update their beliefs by forecasting near-term interest rate cuts if inflation declines quickly or unemployment rises quickly, and vice versa. Fed watchers also monitor speeches by various Federal Reserve Bank presidents for hints about future policy changes. All financial markets react to those data and hints, including oil markets. The remainder of 2024 into 2025 will look no different.
1. Jeff Cox, “Fed Increases Rates a Quarter Point and Signals a Potential End to Hikes,” CNBC, last modified May 4, 2023, https://www.cnbc.com/2023/05/03/fed-rate-decision-may-2023-.html.
1. On June 11, 2024, the Atlanta Fed estimated, based on CME options prices, that the probability of an interest rate hike before the end of 2024 was approximately 2.8%, while the probability of two or more cuts was approximately 12.3% (Federal Reserve Bank of Atlanta, “Market Probability Tracker,” https://www.atlantafed.org/cenfis/market-probability-tracker). As recently as late April, Barclays had increased their estimated odds of an interest rate hike before the end of 2024 to 29% (Gertrude Chavez-Dreyfuss, “Inflation-Wary US Rate Options Market Cautiously Price for 2024 Fed Hike,” Reuters, April 29, 2024, https://www.reuters.com/markets/us/inflation-wary-us-rate-options-marketcautiously-prices-2024-fed-hike-2024-04-29/). The wide range and fluctuation of estimates inferred from options data is indicative of the high degree of uncertainty that is likely to persist throughout the year.
2. Mahmoud A . El-Gamal, Amy M. Jaffe, and Medlock, “Cheap Money, Geopolitics, and Supernormal Backwardation of the WTI Forward Curve,” Economics of Energy and Environmental Policy 12, no. 1 (2023): 57–79, https://doi.org/10.5547/2160-5890.12.1.melg.
3. John Gittelsohn, “With Bonds in a ‘Coma,’ Buy Commodities: Bridgewater’s Patterson,” Bloomberg, April 8, 2022, https://www.bloomberg.com/news/articles/2022-04-08/with-bonds-in-a-coma-buycommodities-bridgewater-s-patterson
4. Devika Krishna Kumar, “Citadel Made More Than $4 Billion from Commodities in 2023,” Bloomberg, last modified February 22, 2024, https://www.bloomberg.com/news/articles/2024-02-22/citadelmakes-more-than-4-billion-from-commodities-in-2023
5. CME Group, “FedWatch,” https://www.cmegroup.com/markets/interest-rates/cme-fedwatch-tool.html
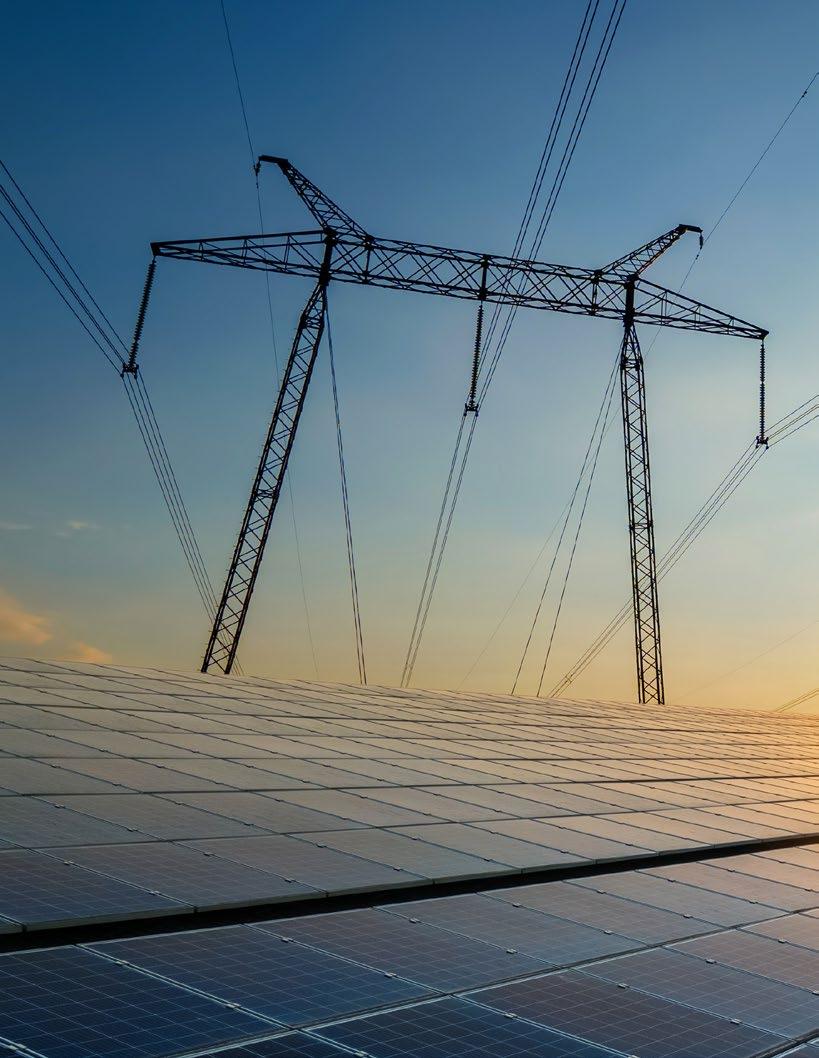
KENNETH B. MEDLOCK, III, PH.D.
James A. Baker, III and Susan G. Baker Fellow in Energy and Resource Economics, and Senior Director, Center for Energy Studies
Energy transitions are complex. Integrating new technologies to achieve scalable solutions requires coordination along existing supply chains — in some cases, the development of new supply chains — and involves economics, politics, and regulation. Market design that promotes transparency and price formation is critical to attract investment that is sufficient to achieve stated aspirations. Moreover, scarcity is present in many dimensions for all forms of energy — resources, raw materials, land, water, human capital, logistics, etc. — yet it is rarely recognized in its entirety. For instance, wind and solar are renewable sources of energy, but harvesting them for delivery of energy services requires land and various types of materials, such as plastics, resins, lubricants, minerals and metals, etc., which are all depletable.
As energy markets transition, understanding the roles of legacy, scale, and technology is critical to what the future will bring. First, legacy is defined by existing infrastructures and energy delivery systems, and it is the foundation on which change will be built. Moreover, legacy is different everywhere, having been influenced by regional comparative advantages. Second, scale matters because energy systems are large and must accommodate energy affordability and reliability, while also supporting continued economic growth. Finally, technology constantly evolves, and ultimately signals how different energy sources will compete.
The influences of legacy, scale, and technology will render efforts to decarbonize energy systems to look different everywhere, hinging on resource endowments — nature, minerals, energy, human capital, etc. — that define comparative advantage. In fact, the current global energy system is already characterized by very different regional energy portfolios for this very reason. Hence, lowering the carbon footprint of energy systems will require multiple solutions given the scale of existing energy systems. Economics matter, and the principle of comparative advantage is key to understanding what will happen and where it will happen in a cost-effective manner.
Market structures also matter. If there is limited market participation for activities involving new technologies, deals to support investments along the supporting supply chains must be bilateral. Bilateral market arrangements require identification of a specific counterparty with sufficient risk tolerance, which can limit the scale of the activity. If, however, there are many market participants — i.e., market depth and liquidity — investments along the supply chain face lower risk because direct counterparty interaction is not needed. This leads to greater levels of investment.1
As energy transitions unfold, governments must remain mindful of an old, but important, concept: energy security. History has taught that energy disruptions are highly correlated with wholly undesirable macroeconomic dislocation, and recent events — i.e., Russia’s invasion of Ukraine — have provided a stark reminder of the importance of energy security. As such, it will remain a central consideration to
KENNETH B. MEDLOCK, III, PH.D.
policymaking, with different regions taking different approaches, typically prioritizing domestic energy sources whose supply chains are less exposed to foreign influence. 2
All of this considered in the context of energy transitions, it is important to understand the “what” and “why” of the most impactful transitions affecting energy markets in the last 25 years: the shale revolution in the U.S. and demand growth in Asia. Each drove profound changes in the global energy system, impacting supply-demand balance, global trade, and geopolitics. Breaking it down, the shale revolution is a product of innovation in the upstream that was able to leverage existing infrastructures, market structures, and human capital to rapidly alter the U.S. upstream. The tremendous demand growth seen in Asia since the turn of the century is a product of rapid economic growth that fueled new demands for energy. Hence, the two biggest drivers of change in energy markets over the last 25 years have been: 1) innovation and 2) economic growth. In fact, these two factors have always been the largest instigators of long-term structural change in energy systems, and they are likely to remain so for the foreseeable future. Understanding how they will manifest going forward is vital to understanding energy transitions.
An article in “The Energy Journal” published in 2016 showed that a shift from fossil fuels to renewable energy could be accompanied by a protracted period of higher energy prices and slower economic growth, i.e., an energy crisis.3 The crisis is optimal, in a neoclassical growth setting with endogenous technological progress, because capital is shifted away from the incumbent energy resource (fossil fuels) to the new entrant (renewables), which forces the cost of energy to rise to cover the capital costs of remaking the energy system. Among other findings, a fundamental lesson in that research is not that a protracted energy crisis is looming. Rather, it is that capital chases returns, so returns must be sufficient to drive investment. This is critical for technology adoption, the role of subsidies, and fixed costs of deploying new energy technologies.
Over the last several years, in the U.S. and elsewhere, policies — such as direct subsidies and portfolio standards — and cost-reducing innovations have propelled wind and solar energy growth. Recently, policies directed at fostering energy transitions, such as the Infrastructure Investment and Jobs Act (IIJA) and the Inflation Reduction Act (IRA), have expanded the scope of subsidies for multiple new technologies.
Shifts in investor and consumer sentiment are also motivating firms to take steps to reduce their net CO2 footprints. Many firms have issued net-zero CO2 emission decrees and have begun to publish annual sustainability reports. In doing so, they are bringing a relatively new degree of transparency to their operations as they respond to investor pressures to reduce their environmental footprint and demonstrate performance.
So, the stars seem aligned to propel new technologies and drive rapid transitions. But what does that mean?
The scale of energy systems and the legacy of infrastructures that characterize them means that the astonishing growth of wind and solar energy have had very little impact on fossil energy resources. In fact, oil demand increased by an annual average of 1.1 million barrels per day from 2000 to 2023, with natural gas demand growing at an annual average clip of 6.5 billion cubic feet per day and coal use increasing by 182.8 million metric tons per year over the same period. As can be seen in Figure 1, focusing on average annual growth rates (AAGR) of new energy sources does not recognize the scale of other energy sources, or the growth rates needed to replace them.
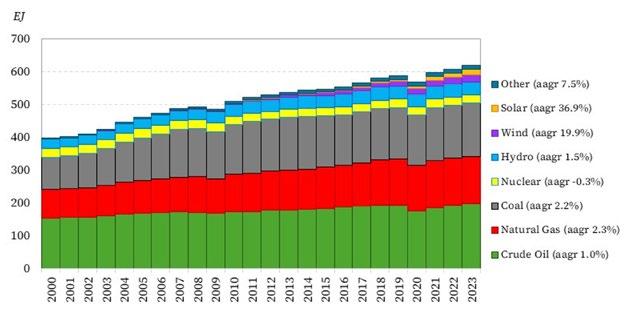
Source: Energy Institute, “Statistical Review of World Energy 2024.”
Note: The average annual growth rate (AAGR) for the period pictured is included in the legend.
Application
Low-Emission Electricity Generation
Low-Emission Hydrogen Production
Low-Emission Hydrocarbon Fuels
Low-Emission Transportation
Carbon Capture, Utilization and/or Sequestration
Other Energy Options
Options
• Renewable electricity (wind and solar)
• Hydroelectricity
• Geothermal
• Nuclear energy (fission and fusion)
• Utility scale battery storage
• Steam methane reforming (SMR) using natural gas with carbon capture and sequestration
• Electrolysis using low emission electricity
• Methods using natural gas with pyrolysis
• Ammonia/methanol from low-emission hydrogen
• E-methane and e-fuels
• Sustainable aviation fuels (SAF)
• Battery electric and plug-in hybrid electric vehicles
• Hybrid internal combustion engine (ICE) vehicles
• Efficiency improvements
• Fuel cell vehicles
• Capture at fossil fuel combustion or processing
• Direct air capture (DAC)
• Carbon-to-value technologies, including carbon nanotube (CNT) applications
• Nature-based carbon sequestration
• Heat pumps
• Bioenergy
• Waste-to-energy
• Energy efficiency gains through process improvements, artificial intelligence and data processing, and material science applications
Note: This list is not meant to be exhaustive. Rather, it is meant to provide a set of potential technologies that could be implemented.
KENNETH B. MEDLOCK, III, PH.D.
Suffice it to say, fossil fuels will very likely be an important part of the energy mix for some time. Accordingly, the portfolio of options to successfully decarbonize economic activity must expand. Fortunately, the list of technologies that show promise is growing, as indicated in Table 1. But we are still left to wonder: Which technologies will succeed?
Not all technologies prove successful. History teaches us this repeatedly. Nevertheless, policy can play a constructive role, if it recognizes the critical role of supply chains and ways technology integrates into them.
Every production process involves a supply chain connecting raw material inputs to a production process to deliver a final product, and potentially a coproduct, to end-users (Figure 2). If any part of the complex set of interactions along a supply chain breaks down, coordination failure ensues, and the commercial viability of investments at any point in the supply chain is compromised.4
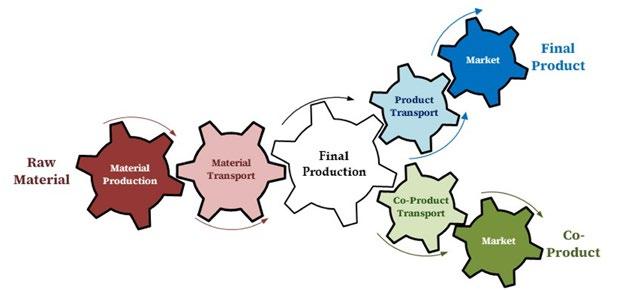
Source: Author.
Importantly, value must be generated at every point in the supply chain for it to develop from the onset and then remain functional. As the capital intensity of each step in the supply chain increases, the value created at that step must increase commensurately to cover cost. For energy, technology is embodied in large, long-lived infrastructure that requires significant upfront capital investment. Once a petrochemical facility or power plant is built, for example, it takes years to recoup the massive capital outlay, and technology is embodied in the infrastructure. As such, the fixed cost burdens of new technologies must not only recoup their own fixed costs, but the overall system must also cover stranded costs for equipment that may be retired prematurely, or risk insolvency.
To understand how this impacts technology adoption, consider the following. Imagine we work in a university lab that is focused on production technologies for a product called, “widgets.” In this world, widgets are a manufactured good that is in high demand. One day, we have a breakthrough with a technology we have been developing that will cut the cost of producing widgets in half. We quickly work with university administration to secure patents and intellectual property protections, and the university issues a press release about our disruptive, game-changing technology that stokes a massive media response. All is good in our lab.
Next, we have a conversation with the world’s largest widget manufacturer about our technology. They are intrigued, and we are convinced they will license the rights to our technology so they can deploy it, guaranteeing years of royalty revenues for our lab and the university. They ask for six months to perform their own internal assessment, signing all the necessary intellectual property protections. All is good in our lab.
After six months, the company comes back to us, declining the option to continue discussions. We cannot understand what went wrong. Then, six months later, compounding our frustration, we learn the company has adopted a technology from a competing lab at another university that only cuts production costs by 10%. This, of course, throws us into a frenzy. Our mindset devolves into conspiracy theories, and we even agree to write a book about it. All is not good in our lab.
What happened?
The company, when performing its internal assessment, evaluated the technology’s impact on their production cost, which confirmed what we had found in our lab. But they also evaluated the adoption cost and found it to be exceedingly high. They determined that they would need to replace multiple parts of their supply chains, which are all capital intensive. This presented a fixed cost barrier to adoption for the technology that the cut in production costs could not overcome.
In contrast, the technology from the competing lab could simply bolt into existing — or legacy — infrastructure, making its fixed cost of adoption very low. So, even though the production costs did not fall as much, its adoption was commercially viable.
Such complexities abound in any capital-intensive industry, like energy. It has a lot to do with why disruptive technologies are exceedingly rare in such industries. Even wind and solar technologies are not disruptive, as they can effectively bolt into existing electricity grids to provide energy without requiring a massive overhaul of the entire system. If a new technology requires development of an entirely new supply chain, then it may face overly burdensome fixed costs of adoption, which can push the technology into the valley of death. Technologies that can leverage legacy infrastructures generally face fewer hurdles to adoption and can more easily diffuse into the market.
The current wave of policy interventions to propel new technologies and accelerate energy transitions is not a new phenomenon. Consider, for example, the energy crises of the 1970s and 1980s. High energy prices coupled with stagnating to declining domestic oil and gas production triggered concerns about energy security and economic growth. This led to policies that favored domestic energy sources, such as coal, nuclear, wind, and solar, along with bans or restrictions on certain oil and gas related activities in effort to ensure adequate domestic supplies. Even large segments of industry threw support behind robust intervention. At the request of the Secretary of Energy, the National Petroleum Council (NPC) examined these concerns and made policy recommendations in a report from 1987 that expressed several familiar sentiments:
KENNETH B. MEDLOCK, III, PH.D.
The decline in … industry capability … when combined with growing demand, will result in even greater dependence on imports. The nation must address the increased vulnerability that will inevitably result from a continuation of these trends.
[There were numerous] proposals that call for immediate intervention by the U.S. government. These include, singly or in combination: establishing floor prices or import fees; levying consumption taxes; and providing domestic production and/or exploration incentives.5
Little has changed in the last four decades.
Currently, the U.S. government is putting support behind several different market interventions, each aimed at tilting investment into new energy technologies. Of course, attracting investment into each part of a supply chain is dependent on the returns earned. Only positive returns to invested capital will drive scale for any technology, and if a comparative advantage can be captured, there are policy levers, as well as market participant actions, that can facilitate technology uptake (Table 2).
• Low-interest loans
• Directly price (tax) externalities
• Subsidies for new technologies, i.e., infant-industry approach
• Portfolio standards that mandate specific types of purchases
• Contracts-for-differences, i.e., a price guarantee
• Grant programs
• Contracts providing firm long-term offtake for producers
• A liquid market that de-risks market entry
Source: Author.
Types of policy instruments currently in use
Market-participant driven outcomes
There are, of course, costs and benefits with any intervention. The primary impacts, as well as any unintended consequences, will ultimately define which interventions are successful. Notably, history in the largest energy commodity markets, such as crude oil and natural gas, teaches us that the emergence of market liquidity tends to result in the most scalable changes because it de-risks market entry and provides flexibility.
The IIJA, Creating Helpful Incentives to Produce Semiconductors (CHIPS) and Science Act, and IRA are examples of legislation that aim to accelerate deployment of new energy technology.6
• The IIJA, a.k.a. Bipartisan Infrastructure Law, passed the House on July 1, 2021 (vote: 221–201). After amendment, it passed the Senate with broad bipartisan support on Aug. 10, 2021 (vote: 69–30), and became law on Nov. 15, 2021.
• The CHIPS Act passed the House on July 28, 2021 (vote: 215–207). After amendment, it passed the Senate with broad bipartisan support on July 27, 2022 (vote: 64–33), and became law on Aug. 9, 2022.
• The IRA, originally introduced as the Build Back Better Act, was passed on purely partisan lines in the House of Representatives on Nov. 19, 2021 (vote: 220–213). After several amendments, it passed the Senate on Aug. 7, 2022 (vote: 51–50) with the tiebreaking vote cast by Vice President Kamala Harris and became law on Aug. 16, 2022.
Each of these is legislation, so they have staying power, even if they passed along slim party-line margins. Undoing legislation, even when contentious, is difficult.7 There are pathways for legal challenge, and agency rulemaking based on interpretation of legislation is in the crosshairs following the recent Supreme Court ruling on the Chevron doctrine, although the full ramifications of that ruling remain to be seen.8 However, the benefits of these legislative acts are likely to accrue most heavily to businesses in Republican-held Congressional districts.9 Thus, repealing it will be difficult, especially once the benefits begin to impact constituencies in those districts. As to whether these seminal pieces of legislation are truly game-changing, the devil is in the details. Impacts will vary regionally as different regions of the country have distinct comparative advantages and legacy infrastructures that better suit them to capture different benefits of the legislation. But, even then, there is an Achilles’ heel — infrastructure.10
How markets are promulgated will also matter. Take hydrogen, for example. With limited market participation, deals to support investments along the value chain must be bilateral, which can limit entry. Transparency and liquidity are important elements of a market that achieves significant scale.11 Investing in infrastructure is a real option that is only exercised when profitable. In the absence of market depth, a liquidity premium exists that renders option value lower, thus reducing investment. Of course, the path to a transparent, liquid hydrogen market will not be instantaneous. Rather, it will likely evolve as a set of regional utility-style markets that favor incumbency rather than new entry. However, to the extent this leads to regional price dislocations, interstate trade will be encouraged. At that point, the entire regulatory architecture of a national hydrogen market could evolve significantly.
Regardless of which political party is in power, expect more policy debate about energy transitions. Much of this is rooted in the fact that there are costs and benefits that are not distributed evenly. Make no mistake, addressing environmental externalities is a good thing. But so are economic growth, improved standards of living, and social welfare gains. Perceptions about how these are all impacted are at the heart of debates.
In the end, the impacts of policy on economic growth and consumer costs will drive political acceptance. Economic growth has historically been characterized by reducing capital intensity (capital per $ GDP) and dematerialization (reducing the materials per $ GDP).12 The push to electrify everything with renewables and batteries is pushing the energy system toward higher capital intensity and lower energy density, which is at odds with over a century of modern economic growth. This is made even more problematic by the rising anti-globalization mantra. Subsidizing higher capital intensity endeavors and erecting barriers to potential trading partners have a crowding-out impact. This is not good for economic growth, and it is inflationary. People must still see improvements in standards of living if they are to be supportive of any policy direction. Make no mistake, politicians understand this.
1. One can think of this through the lens of real options. Investing in infrastructure is a real option. One only exercises the option when profitable. In the absence of market liquidity, a liquidity premium exists that renders the option value lower, thus reducing investment. Liquidity increases scale.
2. See, for example, Kenneth B. Medlock III, “China’s Coal Habit Will be Hard to Kick,” Barron’s, October 6, 2021, https://www.barrons.com/articles/chinas-coal-habit-will-be-hard-to-kick-51633462019; and Medlock, Amy Myers Jaffe, and Meghan O’Sullivan, “The Global Gas Market, LNG Exports and the Shifting US Geopolitical Presence,” in “US Energy Independence: Present and Emerging Issues,” ed. Jaffe, special issue, Energy Strategy Reviews 5 (December 2014): 14–25, https://doi.org/10.1016/j. esr.2014.10.006.
3. See, Peter R. Hartley et al., “Energy Sector Innovation and Growth: An Optimal Energy Crisis,” The Energy Journal 37, no. 1 (January 2016): 233–58. http://www.jstor.org/stable/24696708.
KENNETH B. MEDLOCK, III, PH.D.
4. Avoiding this risk provides a commercial justification for holding inventories.
5. National Petroleum Council, Factors Affecting U.S. Oil & Gas Outlook: A Report of the National Petroleum Council, February 1987, npc.org/reports/reports_pdf/1987-Factors_Affecting_US_Oil_n_Gas_Outlook.pdf
6. Infrastructure Investment and Jobs Act (IIJA), Pub. L. No. 117-58, 135 Stat. 429 (2021); Creating Helpful Incentives to Produce Semiconductors (CHIPS) and Science Act, Pub. L. No. 117-167, 136 Stat. 1366 (2022); and Inflation Reduction Act (IRA), Pub. L. No. 117-169, 136 Stat. 1818 (2022).
7. We have seen this in recent history with the Affordable Care Act (ACA), which passed the House of Representatives along party lines and triggered significant debate in subsequent campaigns. However, the ACA has yet to be overturned.
8. The recent Supreme Court ruling has overruled the Chevron doctrine that held since Chevron U. S.A. Inc. v. Natural Resources Defense Council, Inc., which gave agency interpretation of the statutes they administer priority (Loper Bright Enterprises v. Raimondo, 603 U.S. 22-451 [2024], https://www. supremecourt.gov/opinions/23pdf/22-451_7m58.pdf).
9. For more on this topic, see “Map: Energy, Environment, and Policy in the US” (Houston: Rice University’s Baker Institute for Public Policy), https://www.bakerinstitute.org/energy-environmentand-policy-us.
10. Medlock, “Recent Legislation Can Dramatically Impact the US Energy System — If Infrastructure Isn’t an Achilles’ Heel” (Houston: Rice University’s Baker Institute for Public Policy, August 7, 2023), https:// doi.org/10.25613/7ZT2-WK51.
11. Medlock and Shih Yu (Elsie) Hung, “Developing a Robust Hydrogen Market in Texas” (Houston: Rice University’s Baker Institute for Public Policy, February 16, 2023), https://doi.org/10.25613/YKKH-8K02.
12. Medlock and Ron Soligo, “Economic Development and End-Use Energy Demand,” The Energy Journal 22, no. 2 (April 2021): 77–105, https://doi.org/10.5547/ISSN0195-6574-EJ-Vol22-No2-4.


CHRISTOPHER BRONK, PH.D.
Nonresident Scholar, Center for Energy Studies, and Associate Professor, Hobby School of Public Affairs, University of Houston
Benjamin Franklin is reputed to have said, “An investment in knowledge pays the best interest.”1 Right now, a transformation in knowledge is afoot. Information arrives in an unending torrent. It is important to make better sense of this torrent by using computer-human teaming to combine multiple streams of information to see the patterns of discourse and influence on energy issues from the local to global level. In the last year, we have witnessed one of the biggest information and computing breakthroughs of at least a decade — ChatGPT and its Large Language Model (LLM) contemporaries. Despite the hype in the area, there is a need to make sense of ever-deepening pools of information on almost any topic while at the same time using artificial intelligence (AI) to create new information.
To expand the analysis of energy, we must harness rapidly evolving information tools that link quantitative data with news, online media, video streams, and other computer-mediated interactions. A key goal is to better understand how information can be wielded by nation-states and other entities on topics from renewable technologies and data center operations to climate mitigation schemes and international collaborations.
Make no mistake, market data regarding energy products and services remains as important as ever for understanding the field; however, AI technologies may allow us to make better sense of the larger discourse surrounding energy and politics, from local to national to international. Whether tracking statements by world leaders, evaluating new technology investments, or debunking disinformation, utilizing the latest computational tools to better explain our complicated world will become the norm.
As a series of global energy transitions progresses, new methods for understanding markets, regulation, politics, security, social movements, and technology will be critical for coping with information overload. Fortunately, monitoring of energy activity can be greatly aided by new computational technologies that read government proposals, news reporting, and other forms of information to provide unique insights. By coupling human and machine intelligence, in what has been referred to as a centaur model, can offer an innovative capacity for sensemaking and awareness. 2 In the past, we might convene experts to write a
CHRISTOPHER BRONK, PH.D.
study on an emergent topic. Now, we have the capacity to have a first pass summary on almost any issue in minutes.
In the world of energy and geopolitics, it is important to monitor rapidly evolving drafts of law and other policy on a global scale. Tracking only a single piece of proposed regulation can consume considerable analytical capacity. At any time, dozens of different proposals may be passing through legislative bodies. In fact, this applies to issues beyond legislation. A Centaur model can provide situational awareness and be up-to-date on proposed laws and rulemakings, industry positioning, and international sanctions without the need for a deep dive by experts.
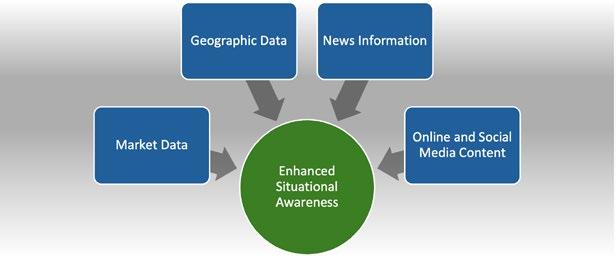
Source: Author representation.
In energy technology, we are continuously asked when an emerging technology may be ready for widespread commercialization and adoption. An exemplar is new forms of nuclear fission energy often referred to as compact nuclear energy. In a typical scenario, industry and academic experts might be brought together to produce a study on the topic. But human interaction with AI can allow a quick assessment of scholarly papers, industry presentations, press releases, public speeches, and other data to have an ongoing assessment of where the compact reactor technology is headed and what players are advancing it. Then, an assessment of technology readiness can proceed much more quickly, facilitating a more rigorous analysis of where the regulatory, social, and/or economic deficiencies may lie.
Regarding geopolitical events, an AI-human hybrid research system could quickly and thoroughly compile the announcements of relevant leaders, translate and summarize news stories, and overlay satellite imagery to assess threats to supply chains and infrastructure. It could also compare news coverage in the United States against news coverage in other countries to assess missed developments, and it could mine for data from alternate voices affecting markets and policy on social platforms, such as Telegram, X, or Instagram. Such a complete picture would allow a deeper look into issues where versions of the same event diverge. In turn, this would allow for a better understanding of the links between messaging and motive, which can be very informative in a geopolitical context.
To be clear, building out AI tools to better understand the global energy system does not translate to the replacement of deep expertise rooted in years of training and experience accumulated in government,
industry, and academia. Rather, AI tools, as they are developed, can be done in a way that makes subject matter experts more capable and effective. This will be especially true in times of geopolitical crisis that require rapid response capabilities. For instance, the activities of political leaders often intersect with potential international conflicts. As one example, the conflict in Ukraine — from the launch of Russia’s invasion to various aspects of the ongoing crisis — is very much a reflection of statements made and actions undertaken by Russian President Vladimir Putin and Ukrainian President Volodymyr Zelenskyy. A rapid assessment of the totality of comments made combined with expert analysis can provide important insights that may be effective aids in managing collateral impacts or even assist in conflict resolution. As another example, tensions between Venezuela and Guyana have recently emerged as Venezuela’s Nicolás Maduro government has increasingly threatened its neighbor around energy developments in the Essequibo region. Advanced tooling on information resources regarding this international dispute can combine with world-leading expert analysis of everything from social media to commercial satellite imagery in providing valuable assessment of this or any simmering crisis.
As information is compiled using AI tools trained on various issues and topics over time, the increase in data availability for computational analysis will enrich the depth of expert analysis of a variety of issues in energy geopolitics. Moreover, as the pace of information accelerates, it will be possible to more rapidly make sense of global issues to elevate discourse aimed at finding achievable solutions for current issues, from geopolitics to regulation to technological innovation to commercial project development and more. The need for new ways to refine high volumes of data and information across multiple areas of expertise will drive significant innovations in how we process and use those signals. While data is not necessarily the new oil, it will increasingly be commoditized to afford advantages in decision-making that will be critical for success in commercial and diplomatic domains.
1. “About Benjamin Franklin,” Benjamin Franklin College, Yale College, https://benjaminfranklin.yalecollege.yale.edu/about-us/about-benjamin-franklin.
2. See, for example, Kevin Yamazaki, “Reconciling the AI-Human Conflict with the Centaur Model,” CIOReview, https://artificial-intelligence.cioreview.com/cxoinsight/reconciling-the-aihuman-conflictwith-the-centaur-model-nid-24514-cid-175.html.

RACHEL A. MEIDL, LP.D., CHMM Fellow in Energy and Sustainability, Center for Energy Studies
In an era where the imperatives of sustainability are often confined to the narrow corridors of climate action and carbon metrics at a specific site or use rather than the entire supply chain, there is a pressing need to expand our horizons. We stand at a pivotal juncture where the traditional paradigms of industry and governance must be reimagined. This vision calls for a holistic approach that interweaves the intricate tapestry of environmental integrity, social equity, and economic vitality across the entire supply chain and life cycle of an energy system. We are beckoned to pioneer a transformative path that not only mitigates emissions more broadly than those that are just carbon-related but also fosters resilience, cultivates innovation, and propels us toward a truly sustainable future.
Even though there has recently been increasing discussion about corporations backing away from environment, social, and governance (ESG) investing, this does not speak to broader trends and efforts on sustainability.1 To begin, ESG and sustainability are not the same, despite many groups using them interchangeably. 2 Rather, sustainability is complex and must be approached from a systems-level that incorporates environmental, socioeconomic, and commercial perspectives to foster lasting Paretoimproving gains. This is a reality that many firms are beginning to internalize, which will drive them to manage their sustainability efforts differently going forward.
Trends suggest that sustainability will remain a dynamic and critical area of focus in 2024 and beyond, presenting both challenges and opportunities for businesses, investors, and policymakers. The current milieu — characterized by persistent supply chain constraints, escalating geopolitical discord, heightened concerns about energy security, growing focus on nearshoring and protectionism, ongoing shifts in the global economic order, multidimensional energy and material transitions, and acute waste issues — has catalyzed a greater emphasis on resilience measures, sector-specific reporting frameworks, and enhanced product stewardship across life cycles. These developments, among others, are propelled by a combination of regulatory mandates and consumer advocacy, signaling a pivotal shift in the operational and governance paradigms of modern enterprise. While climate change and carbon emissions remain urgent issues that demand action, a narrow focus that fails to acknowledge the interdependency or importance of other factors across supply chains can create dangerous blind spots. Carbon tunnel vision fails to adequately address energy access, reliability, and security, and it can lead to neglecting other critical issues, such as loss of biodiversity, resource depletion, affordability of goods and services, and social inequalities.
The Group of Twenty (G20), an intergovernmental forum, addresses key issues such as international financial stability, climate change mitigation, and sustainable development, and the group plays a crucial role in shaping global policies. The Think20 (T20) operates as the G20’s ideas bank, gathering and disseminating analyses by think tanks with a goal to inform the G20 negotiations and final declarations. It is generally recognized that G20 policy declarations can pose challenges for developing countries and should strike a balance between global economic interests and the specific needs of developing countries. As such, one of the three core priorities for the G20 in 2024, hosted by Brazil, is “energy transition and sustainable development in its social, economic and environmental aspects.”3 Against this backdrop, the T20 has established six task forces to examine the core priorities.4 Policy recommendations cover a range of issues, including:
• Enabling the bioeconomy, circular economy, and role of critical minerals.
• Promoting skill development for communities and workforces of the future.
• Fostering access to information, public participation, and justice in energy transitions.
• Integrating biodiversity and sustainable food systems.
• Furthering trade and finance through nature-based investments.
• Developing solutions in the Global South.
Similar priorities have emerged in the Conference of the Parties (COP) proceeding, where the alignment of views between developed and developing nations regarding energy transitions and sustainability remains a critical point of discussion. The path toward sustainable energy and material transitions overlooks the unique pace and trajectory that will be faced by different regions of the world given varying stages of economic development, distinctive natural resource endowments, socioeconomic conditions, geopolitical circumstances, and other factors. The vision of COP is to achieve a sustainable future, yet there is minimal application of systems-level sustainability because climate action and emissions reduction are the primary points of emphasis. Sustainability, if not managed in an equitable and realistic way, can produce unintended consequences that exacerbate inequalities, trigger rebound effects, and shift burdens across global systems.
The plastics industry will remain an important player in global manufacturing, with 2024 and 2025 providing opportunities for growth. A key element of this growth in the plastics industry is projected to come from the increasing demand for high-performance polymers in various sectors, such as automotive, aerospace, energy, and electronics. Despite the continued demand for plastics, the industry is an everevolving space that is increasingly facing public pressure to reduce carbon emissions and adopt more sustainable practices in the production, use, and disposal of plastic items. In 2024, dozens of policies at the state, federal, and international levels have been filed on stewardship, extension of producer responsibility, recycling content mandates, regulation of plastic products, right-to-repair, or the role of ACM recycling as a circular strategy.5
A legally binding instrument on plastic pollution is in the final stretch in 2024. Ongoing efforts in the negotiation of the U.N. Global Plastics Treaty aims to be international in scope and address the full life cycle of plastics, including design, production, and disposal.6 Intergovernmental Negotiating Committee (INC) meetings will continue throughout 2024 with the treaty finalized and adopted by participating countries in 2025 during the conference of the plenipotentiaries.
The market for recycled plastic has become progressively significant in recent years as more states, brands, and private industries have adopted initiatives to reduce waste by encouraging recycling and by manufacturing products from recycled materials. As these initiatives continue to expand, so will demand for recycled plastic. ACM has the potential to play a role in the shift to a circular economy by diverting hard-to-recycle plastics from landfills and incinerators, and by filling an unmet demand for high-quality plastics that can be processed in predictable, controlled, and regulated processes with precise operating parameters (Figure 1).7 However, ACM raises a number of concerns, including life cycle impacts, social equity, environmental justice, and potential competition with traditional mechanical recycling. The merits of ACM will continue to be debated while multisectoral groups throughout the INC negotiation cycle work to develop verifiable, measurable, and auditable guidelines for the responsible production of ACM to inform the outcome of the treaty.8
The National Academies of Sciences, Engineering, and Medicine recently established the Roundtable on Plastics Committee.9 The committee’s aim is to examine systemic solutions across each stage of the plastic life cycle and examine interventions in plastic production, product and material design, waste management, environmental and health impacts, and data collection, management, and modeling to understand the complexity of issues in reducing plastic waste. Throughout 2024–25, roundtable committee members will deliberate these issues and develop workshops and consensus studies that offer an opportunity for separate, ad hoc study committees to provide in-depth analysis and advice for the policy and research communities and the broader public.
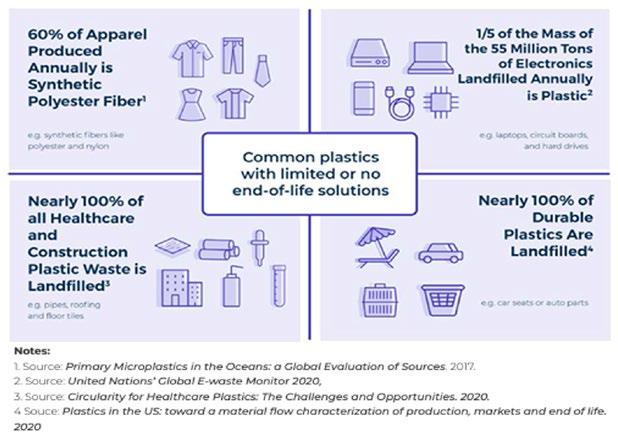
Source: Figure sourced from Closed Loop Foundation.
Industries and investors face enormous uncertainty in the year ahead. Throughout 2024 and beyond, the demand from customers, investors, and regulators requiring traceability and transparency in supply chains and product sustainability information across life cycles will gain momentum. In the EU alone, the Corporate Sustainability Due Diligence Directive will require certain businesses to collect and analyze supply chain data across a range of ESG factors. Additional supply chain sustainability regulations are also coming in 2024, such as the EU Green Claims Directive.
Life cycle assessments (LCA) are becoming essential in decision-making while the expansion and appropriate scoping will grow in importance as it is integrated into mainstream business strategy and financing decisions, and as it continues to reinforce and justify major policy decisions at the national and global levels. For instance, LCAs underpin the implementation of the U.S. Department of Treasury’s eligibility for receiving certain energy tax credits under the Inflation Reduction Act, is under consideration in the U.N. Global Plastics Treaty, and ESG investments continue to be rationalized with narrow LCA interpretations. Altogether, these underscore the significance of life cycle solutions to manage the growing complexity and scope of sustainability disclosures. Failure to contextualize, properly scope, and communicate LCAs have led to gross misinterpretation by decision-makers and the public, resulting in misguided policies that continue to create blind spots and shift risks.10 Throughout 2024 and into 2025, LCAs will face scrutiny over narrowly applied focus on climate and emissions with boundaries not representative of the full life cycle, inconsistent scope, data quality, and temporal and regional data sets that yield unrepresentative results. More attention will be given to expanding LCAs to a wider range of environmental impacts as well as understanding the interplay of social and economic dimensions.
Throughout 2024 and 2025, companies will grapple with persistent challenges related to interpreting and adhering to divergent climate and sustainability disclosure and reporting mandates while balancing legal obligations, investor expectations, and shifting global standards. Legal challenges have prompted the U.S. Securities Exchange Commission (SEC) to pause implementation of climate-related disclosure rules.11 California enacted two significant climate-related disclosure laws that go beyond SEC’s proposal, mandating disclosure of direct (Scope 1), indirect (Scope 2), and value chain (Scope 3) greenhouse gas emissions as well as disclosure of climate-related financial risk.12
In Europe, from 2024 the Corporate Sustainability Reporting Directive (CSRD) will require certain businesses to disclose and assure their sustainability information. CSRD considers all ESG disclosures to be material unless explicitly stated otherwise, constituting an enormous inflow of sustainability data requiring limited assurance within a compressed timeframe. Meeting the growing demand for ESG assurance is complicated by a lack of skilled experts available to meet the increasing needs.
The objective of both the European Sustainability Reporting Standards and the International Sustainability Standards Board (ISSB) is to develop sector-specific standards that recognize the distinct ESG challenges encountered by various sectors. The European Commission has postponed the deadline for sectorspecific standards from June 2024 to June 2026, while the ISSB is persisting in its efforts to establish these standards. Meanwhile, firms will continue using sector-specific reporting frameworks, such as Global Real Estate Sustainability Benchmark (GRESB), the Sustainability Accounting Standards Board standards, and the U.N. Principles for Responsible Investment, alongside the CSRD and ISSB. As ESG reporting and sustainability regulations gain complexity and jurisdictional reach, navigating the intricacies of compliance is becoming an exercise in adaptability. Entities are required to implement extensive
changes to operations, aligning with edicts that emphasize accountability and transparency. These adjustments extend beyond mere reporting; they are reshaping business models, supply chains, and internal governance structures.
Sustainability as a framework is not directly connected to financial markets. It is bound by the principles of managing resources that aim to provide ecological, social, and economic equilibrium while recognizing there are trade-offs across the three domains. Choosing whether to focus attention and resources on ESG issues more narrowly, or on sustainability more broadly is not just a question of perspective; it is also a question of intention. Deeper analysis of the shortcomings and uncertainties associated with conflicting reporting requirements will be needed in 2024 and beyond, including how they align with a systemslevel perspective of sustainability across the commercial, financial, socioeconomic, and environmental vectors. Moreover, market design, policy, and innovation will each play a pivotal role in connecting and strengthening each of these vectors in ways that deliver systems-level sustainability.
1. See, for example, Nicole Goodkind, “ESG Investing Is Dying on Wall Street. Here’s Why,” CNN, October 23, 2023, https://www.cnn.com/2023/10/23/investing/premarket-stocks-trading/index.html.
2. Rachel A. Meidl and Kenneth B. Medlock III, “The Pride and Prejudice of Sustainability: Rethinking Sustainability from a Systems Perspective” (Houston: Rice University’s Baker Institute for Public Policy, November 8, 2023), https://doi.org/10.25613/20CH-3Z48.
3. Foundation 20, “Political Year: G7 and G20,” https://foundations-20.org/political-year/
4. Meidl is a member of T20 Brasil’s Task Force 02: “Sustainable Climate Action and Inclusive Just Energy Transitions,” on the subtopic, “2.1: Fostering Sustainable, Inclusive, and Just Energy Transitions” (https://t20brasil.org/en/tf/2/tf02-sustainable-climate-action-and-inclusive-just-energy-transitions).
5. Marissa Heffernan, “Ten EPR Bills Introduced in 2024 So Far,” Resource Recycling, last modified March 13, 2024, https://resource-recycling.com/recycling/2024/03/01/ten-epr-bills-introduced-in-2024-sofar/; Megan Quinn, “Tracking the Future of US Recycling Policy in Congress,” Waste Dive, last modified March 13, 2024, https://www.wastedive.com/news/tracking-the-future-of-us-recycling-policy-incongress/570778/; Maria Rachal and Quinn, “Massachusetts Advances Plastic Bag Ban, Lawmakers Consider Packaging EPR,” Packaging Dive, June 24, 2024, https://www.packagingdive.com/news/ massachusetts-plastic-bag-ban-packaging-epr/719617/; Rachal, “Packaging EPR Compromises Met with Apprehension and Hope,” Packaging Dive, May 29, 2024, https://www.packagingdive.com/ news/extended-producer-responsibility-circularity-caa-american-beverage-recycling-partnershipupstream/717177/; and Matt Crawley, “Plastics and Advanced Recycling: Legislation to Watch in 2024,” MultiState, February 20, 2024, https://www.multistate.us/insider/2024/2/20/plastics-andadvanced-recycling-legislation-to-watch-in-2024
6. “Global Plastics Treaty,” Plastic Oceans International, https://plasticoceans.org/global-plastics-treatyintergovernmental-negotiating-committee/
7. Figure 1 appears in Paula Luu et al., “Assessing Molecular Recycling Technologies in the United States and Canada,” Closed Loop Foundation, 2021, https://www.closedlooppartners.com/foundationarticles/assessing-molecular-recycling-technologies-in-the-united-states-and-canada/
8. Meidl is a science and policy expert for the Ocean Plastic Leadership Network, providing strategic input and guidance in the cross-value chain development of “Responsible Production Guidelines for Progressive Advanced/Chemical/Molecular Recycling of Plastics” to help inform the ongoing negotiations for the global plastics treaty.
9. Meidl is a member of The National Academies of Sciences, Engineering, and Medicine Roundtable on Plastics Committee whose multi-sectoral forum examines issues associated with national efforts to reduce plastic pollution across all aspects of the life cycle. The goal is to pave the way for a sustainable circular economy for plastics.
10. Life cycle assessments (LCAs) underpin Section 45V of the IRA but is limited to lifecycle carbon intensity from well-to-gate. Basing the credit solely on lifecycle carbon intensity and disregarding other relevant verifiable life cycle insights across the actual cradle-to-grave or cradle-to-cradle (e.g., water use and waste management) encourages preselecting presumed clean hydrogen winners. For instance, the availability of water (which is used as a feedstock for electrolyzers), along with water quality, water treatment, and desalinization in some locales. Understanding the administrative regimes that govern water use, rights, jurisdiction, etc. could all be factors that impede the success and sustainability of green hydrogen over time. This is especially true in areas of water scarcity where competition over resources for food production would be exacerbated. Aligning with the principles of sustainability, a true lifecycle approach from an emissions perspective should capture upstream and downstream supply chain activities, including the mining, processing, and transportation of minerals used in solar panels, wind energy, and electrolyzers. LCAs should also take into account the supply chains of natural gas and coal for other hydrogen production methods, including transportationrelated emissions and any capture and storage of emissions of hydrogen production. While an emissions profile is important, it does not by itself translate to sustainability unless a broader set of environmental, social, and economic metrics are captured, assessed, and verified.
11. Securities and Exchange Commission, “The Enhancement and Standardization of Climate-Related Disclosures for Investors,” April 12, 2024, https://www.sec.gov/files/rules/other/2024/33-11280.pdf.
12. S.B. 253, Reg. Sess. (Ca. 2023), https://leginfo.legislature.ca.gov/faces/billNavClient.xhtml?bill_ id=202320240SB253; S.B. 261 Reg. Sess. (Ca. 2023), https://leginfo.legislature.ca.gov/faces/ billNavClient.xhtml?bill_id=202320240SB261.


EDWARD M. EMMETT Fellow in Energy and Transportation Policy, Center for Energy Studies
Throughout history, the strength of nations, economies, industries, and businesses have been tied to the ability to move people and goods. Until the harnessing of steam, using wood and coal as fuel, modes of transportation were limited to those moved by the power provided by humans, animals, wind, and water. With the harnessing of steam power, ocean going ships became faster and more reliable, and riverboats opened access to inland areas. Steam as a power source brought about a transformative new mode of transportation — the railroad — and suddenly the ability to connect distant regions was enhanced. The continent of North America was tied together by ribbons of steel that created vast new areas for settlement and expanded commercial markets.
Petroleum based fuels brought an even more significant change to the world of transportation. Steamships transformed into vessels fueled by bunker fuel rather than coal. Railroad locomotives switched from burning wood and coal to diesel electric power. Even more important, petroleum-based fuels helped facilitate the invention of the internal combustion engine, which in turn brought society into the automotive age with the development of automobiles and trucks. Over the last century, airplanes have become commonplace and, of course, are powered by aviation fuels from petroleum. The economic efficiency of petroleum-based fuels in transportation services is undeniable, as evidenced by the fact that all major transportation modes either switched from steam to petroleum-based fuels or technologies were developed to take advantage of such fuels. Moreover, petroleum-based fuels have been the dominant source of energy for all modes of transportation for the past century.
The world of transportation is changing dramatically. The combustion of petroleum-based fuels has driven concerns and concomitant policy measures about local air quality impacts of nitrogen oxides, volatile organic compounds (VOCs), and particulate matter (PM) emissions, all of which negatively impact air quality.1 Technologies, such as catalytic converters, and improvements in fuel standards and combustion efficiency have helped to lessen, but not eliminate, these concerns. Most recently, mounting concern about CO2 emissions and their impacts on climate change has brought new pressure on government officials and transportation providers to find ways to reduce carbon emissions that emanate from the exhausts of ships, trains, automobiles, trucks, and airplanes. 2 Despite the promise of some of the technology pathways that have been proposed, the future is far from clear because large scale disruptions or significant increases in cost in the transportation system is neither politically or economically advisable.
EDWARD M. EMMETT
In order to fully grasp the importance of transportation, it must be recognized that the health of an economy is highly dependent on its transportation system. By way of analogy, consider the circulatory system of the human body. A circulatory system in an individual carries oxygen and nutrients to organs and tissues so that they may function efficiently and in coordination to ensure the well-being of the individual. Arteries carry oxygenated blood away from the heart, while veins carry deoxygenated blood back to the heart. A system of organs along the path ensures oxygen and nutrients are loaded into the circulatory system through exchange via capillaries, while CO2 and waste are unloaded from it. Every part of the system works in concert for the overall health of the individual. If the function of any part — from the heart to arteries to veins to capillaries — is inhibited, various degrees of limited body function, or even death, occurs.
A transportation network is the circulatory system of an economy. If anything disrupts the flow of goods and services to points where they are needed, or waste products away from where they are produced, an economy will not function efficiently, resulting in inevitable disruptions. Hence, the loading and unloading of goods and services in an economy’s transportation system at various points of exchange, as well as the movement of those goods and services along it, must be relatively seamless. Otherwise, the health of the economy suffers. As such, transportation policy — from policy that impacts infrastructure to fuel production and delivery — must tread carefully lest it could damage the economy.3
Indeed, we see evidence of policy flexing to recognize potential costs associated with previous actions when presidential and/or congressional actions are taken to mitigate rising fuel costs, even when those same administrations have taken steps to phase out petroleum-based fuels — when fuel efficiency mandates are relaxed, when deadlines extended, and when congestion pricing policies are delayed. Given that we have seen each one of these examples play out over the last four years, it is obvious that policymakers are at least aware of the cost-benefit calculus in policy that impacts the economy’s circulatory system.
Despite the oft touted adoption of electric vehicles across passenger fleets and commercial fleets that move small freight, cleaner transportation is not as simple as transitioning from petroleum products to electricity.4 To begin, airplanes cannot be realistically powered by electricity, at least not currently, and handle the same requisite freight and passenger loads. The long-haul trucking industry faces similar difficulties, and has, in fact, pushed back against electrification as being impractical due to the size and weight of batteries, their limited range, and the cost of adoption.5 Additionally, independent owner-operators and trucking companies are concerned about the costs associated with replacing their current equipment, so they would prefer to find a fuel that allows utilization of existing assets.6 Likewise, shipowners have expressed reluctance to scrap existing bunker fueled ships for newer, more expensive ships, especially when other fueling options — e.g., biofuels and hydrogen derivatives — for fleets can be made available.7
Hovering over the transition to other fuels for almost every transportation mode is the question of dependability of supply. For the trucking industry, the truck stop industry must be able to adapt to new fuel requirements. For ocean shipping, ports must be able to meet the fuel needs of new ships. Airlines, air cargo carriers and airports need to be on the same page when it comes to aviation fuels. In other words, the adoption equation in transitions in transportation is not only a function of the availability and cost of the new technology but also a function of the cost of the full supply chain needed to support fuel production and delivery to the point of use.
Going forward, the transportation industry is facing a dilemma. How are environmental concerns addressed while simultaneously maintaining operational efficiency and avoiding unnecessary upward
cost shifts for moving goods and people? In answering that question, for the first time in history, modes of transportation may end up going in multiple different directions when it comes to the fuels each mode ultimately chooses.
In addition to electricity, the transportation industry is researching a wide variety of other fuels as it seeks to reduce the carbon footprint associated with using traditional petroleum-based fuels. Sustainable biofuels sourced from cooking oils, animal fats, and agriculture products, as well as hydrogen, methanol, ammonia, and various e-fuels are among the options being tested. Some ocean carriers are already ordering ships powered by liquefied natural gas (LNG), bio/e-methanol, bio/e-methane, ammonia, and hydrogen. Airlines are already using sustainable aviation fuel as a supplement to basic aviation fuel. Railroads are testing hydrogen locomotives. The trucking industry is decarbonizing local delivery — i.e., the last mile — by using vehicles powered by electricity, compressed natural gas (CNG), and sustainable diesel. Long-haul trucking companies are considering sustainable diesel as a drop-in fuel for existing equipment, and fuel suppliers are researching new engines fueled by hydrogen and other alternative fuels.
There are many questions to be answered about transportation fuels of the future:
• How much of each fuel can realistically be produced in quantities sufficient to become the fuel of choice for a segment of the transportation industry?
• What is the supply chain needed to support each fuel option, and what changes to the delivery infrastructure must be made?
• How will each mode of transportation choose the best fuel, and will there be a commonality of use within each mode?
• For those fuels that can serve multiple transportation modes, will there be enough for competing modes?
• What role will governments play in deciding the fuels of the future, and will they avoid the temptation to dictate a monolithic answer for each mode?
• Will the fuels marketplace be driven by the transport providers or by the fuel suppliers?
• What role will original equipment manufacturers play in the choice of fuels for each transportation mode?
• Will there be geographic differences in fuel used by various modes?
• What is the time frame for the transition to new fuels for each mode?
Regardless of how these questions are answered, there will be a set of trade-offs to consider so that economic well-being is not severely encumbered. This will manifest in different ways through different economic and policy channels directed at freight movement and passenger mobility, and take shape in ports and the airline, trucking and rail industries, as well as across major cities. Moreover, as new fuels become technically viable, their attractiveness will hinge on both the fixed costs of adoption and the marginal cost of use. The future of transportation is uncertain, but it will, as it always has, continue to evolve, although perhaps not in the ways we might expect. In the end, the health of economies everywhere will depend on it.
EDWARD M. EMMETT
1. For a summary of these issues, see Environmental Protection Agency (EPA), “Smog, Soot, and Other Air Pollution from Transportation,” last modified April 25, 2024, https://www.epa.gov/transportationair-pollution-and-climate-change/smog-soot-and-other-air-pollution-transportation.
2. For a discussion of these issues, see EPA, “Carbon Pollution from Transportation,” last modified May 14, 2024, https://www.epa.gov/transportation-air-pollution-and-climate-change/carbon-pollutiontransportation.
3. Indeed, we see evidence of this when presidential and/or congressional actions are taken to mitigate rising fuel costs, when fuel efficiency mandates are relaxed or deadlines extended, and when congestion pricing policies are delayed.
4. International Energy Agency, “Trends in Electric Cars,” 2024, https://www.iea.org/reports/global-evoutlook-2024/trends-in-electric-cars.
5. Sean McNally, “New Report Pegs Costs of Electrifying U.S. Commercial Truck Fleet at $1 Trillion,” American Trucking Associations, March 19, 2024, https://www.trucking.org/news-insights/newreport-pegs-cost-electrifying-us-commercial-truck-fleet-1-trillion
6. Thomas Wasson, “Trucking Electrification Throttled by Excessive Ownership Costs,” Freight Waves, May 16, 2024, https://www.freightwaves.com/news/trucking-electrification-throttled-by-excessiveownership-costs
7. Keith Dawe et al., “Future Biofuels for Shipping,” Global Maritime Forum, March 28, 2022, https://www.globalmaritimeforum.org/news/future-biofuels-for-shipping. More recent explorations involve hydrogen-derivative fuels and e-fuels, as opposed to battery electric, see “Maersk Mc-Kinney Moller Center Unveils Ammonia-Fueled Boxship Design,” The Maritime Executive, May 24, 2023, https://maritime-executive.com/article/maersk-mc-kinney-moller-center-unveils-ammonia-fueledboxship-design.

The following is a curated library of recent publications and resources. More is available by visiting our website at https://www.bakerinstitute.org/center/center-energy-studies.
Resource: Electricity in Texas
Resource: Map: Energy, Environment, and Policy in the US
• Long-Term Reliability in ERCOT: Some Critical Issues to Consider
• What Does Success Look Like? Ensuring a Smooth Transition to the Next-Generation Power Grid
• Baker Briefing Podcast: Adapting the Texas Power Grid to Meet Evolving Energy Needs
• ERCOT and the Future of Electric Reliability in Texas
• Approaching a Tipping Point for the Electric Grid
• Revamping the Texas Power Grid: Insights from Rice University’s Electricity Research
• What Happened in Texas? Understanding the February 2021 Blackouts
• Economics of Energy & Environmental Policy at 10 — An Introduction
• Federal Energy Legislation and the Infrastructure Achilles’ Heel: The Energy Market Impacts of the IIJA, CHIPS Act, and IRA
• A Pricing Mechanism to Jointly Mitigate Market Power and Environmental Externalities
• Baker Briefing Podcast: Is the Texas Power Grid ‘Fixed’
• Two Years After Devastating Winter Storm, What Can We Say about the Isolated Texas Grid?
• Houston Energy Dialogues 2022
• Resource Adequacy in ERCOT: How Long-term Market Design Reforms Could Enhance Reliability
• Connecting Past and Future: A History of Texas’ Isolated Power Grid
Resource: Baker Institute China Energy Map
• Ukraine’s Electricity Sector: Urgency and Resilience in a Time of War
•Annexation of Taiwan: A Defeat from Which the US and Its Allies Could Not Retreat
• Testimony to US-China Economic and Security Review Commission
• Is the US Preparing to Ban Future LNG Sales to China?
• A US-Led Energy and Food Abundance Agenda Would Reshape the Global Strategic Landscape
•Baker Briefing Podcast: Will Taiwan’s Energy Policy Doom Its Push for Sovereignty?
• Testimony to the US House Committee on Financial Services
• New President, Nuclear Energy, and Net Zero: How Will Taiwan Vote on Its Energy Future?
• The US-China Economic Relationship Needs ‘Robust De-Risking,’ and a Little Strategic ‘Decoupling’
• Reaping the Whirlwind: How China’s Coercive Annexation of Taiwan Could Trigger Nuclear Proliferation in Asia and Beyond
• Silicon Hegemon: Could China Take Over Taiwan’s Semiconductor Industry Without Invading?
• Why Is Europe Not Replacing Russian Pipeline Gas With Long-term LNG Contracts?
• How Long Will it Take for China’s Nuclear Power to Replace Coal?
• China’s LOGINK Logistics Platform and Its Strategic Potential for Economic, Political, and Military Power Projection
• Putin Is Bulldozing Russia’s Energy Exports and Pushing the Energy Transition
• Toward Smart Sustainable Cities in the MENA Region
• Global Energy: Qatar ’s LNG Expansion
• Economic Ramifications of Energy Transition Investments in the Arab Gulf States
• Houthi Red Sea Attacks Impose ‘Economic Sanctions’ on Israel’s Backers
• Chaos in Energy Markets Then and Now: 50 Years After the 1973 Arab Oil Embargo — A Review
• COP28: Spotlight on the UAE
• The Arab Gulf Helps Fuel the Global Economy. What It Means for the Energy Transition
• The Arab Embargo 50 Years Ago Weaponized Oil to Inflict Economic Trauma — Sound Familiar?
• Exploring the Energy Transition and Net-Zero Strategies of Gulf Oil Producers
• Can the Eastern Mediterranean’s Gas Potential Translate Into Reality?
• Should Abu Dhabi Quit OPEC? Reconsidering the UAE’s Membership
• Exploring the Energy Transition and Net-Zero Strategies of Gulf Oil Producers
• Lessons From Kuwait: How the Country’s Rentier Democracy Is Slowing Its Energy Transition
• Building Water and Energy Security in the GCC through an Integrated Policy Approach
• How Economic and Political Factors Drive the Oil Strategy of Gulf Arab States
• How Arab -Chinese Cooperation Could Impact the Global Energy Transition
• Chile’s New Lithium Strategy: A Market Boost or Miss?
• Energy Transformation, Social Inclusion and Economic Prosperity in Latin America: An Introduction
• An Oil Workers Union Leader Could Be The Next Governor Of Argentina’s No. 3 Petro-Province, Santa Cruz
• The July 30 Gubernatorial Election in Chubut, Argentina’s No. 2 Petro-Province
• Baker Briefing Podcast: Latin American Energy and Politics
• Governing Parties Prevail In 4 Argentine Mining & Petro Province Election
• Financial Liabilities and Environmental Implications of Unplugged Wells for the Gulf of Mexico and Coastal Waters
• Paving the Road for Competitive Green Hydrogen Hubs: Does Chile Have a Chance?
• A Political Earthquake In Argentina’s Vaca Muerta: The 2023 Neuquén Gubernatorial Election
• Alberto Wertilneck Set to Return as Governor of the Vaca Muerta’s Río Negro Province
• Incumbent Governors on Track for Victory in Argentina’s Lithium & Copper Belt Provinces: Jujuy, Salta & San Juan
• The Battle For Control of the Vaca Muerta is Formally Underway: Neuquén 2023
• Wind of Political Change Blowing in Argentina’s Vaca Muerta?
Resource: Global Minerals Production Dashboard
Resource: Global Minerals Trade Dashboard
• Testimony to the US House Committee on Energy and Commerce
• Mining, Minerals, and Materials in the Age of Sustainability and Alliances
• Chile’s New Lithium Strategy: A Market Boost or Miss?
• Testimony to the Senate Committee on Energy and Natural Resources
• Need Nickel? How Electrifying Transport and Chinese Investment are Playing Out in the Indonesian Archipelago
• Defining the ‘Minerals Heartland’ of the Future — From Africa to Central Asia
• Of Chinese Behemoths: What China’s Rare Earths Dominance Means for the US
• Climate Dogmas and Energy Realpolitik
• BIPP/CES Hosted NATO Industry Group on Critical Materials Supply Chains
• Baker Briefing Podcast: Forces Shaping the Global LNG Market
• Global Energy: Qatar’s LNG Expansion
• OPEC+ — To Increase, or Not To Increase?
• Is the US Preparing to Ban Future LNG Sales to China?
• Testimony to the Texas House of Representatives Select Committee
• OPEC+ Agrees to Additional Production Cuts: Market Responds With a Shrug
• US Cannot Meet Its Paris Commitments Through Energy Alone
• Why Is Europe Not Replacing Russian Pipeline Gas With Long-term LNG Contracts?
• Wielding the Energy Weapon: Differences Between Oil and Natural Gas
• US LNG Exports: Supply, Siting and Bottlenecks
• Canada’s Natural Gas Distribution Network is the Latest Target for Russian Hackers
• Drilling Down on the OPEC+ Oil Production Cuts
• Why Natural Gas Price Caps in Australia are Poor Policy
• Why Gas Stoves Matter to the Climate — and the Gas Industry: Keeping Them Means Homes Will Use Gas for Heating Too
• Natural Gas Balance in Europe: Germany as a Case Study
• German Natural Gas Market Balance Dashboard
• The World of Energy in 2023: Mixed Message?
• OPEC+ — To Increase, or Not To Increase?
• Chaos in Energy Markets Then and Now: 50 Years After the 1973 Arab Oil Embargo — A Review
• Want Power in the Oil Market? Hold Spare Capacity! (But Not Too Much)
• OPEC+ Cuts Should Tighten the Market
• OPEC+ Agrees to Additional Production Cuts: Market Responds With a Shrug
• US Cannot Meet Its Paris Commitments Through Energy Alone
• US Gulf Coast Energy: A Hurricane Season Cheat Sheet
• Diverging Storylines in the World of Energy Came Together Last Year
• Wielding the Energy Weapon: Differences Between Oil and Natural Gas
• Exploring the Energy Transition and Net-Zero Strategies of Gulf Oil Producers
• Financial Liabilities and Environmental Implications of Unplugged Wells for the Gulf of Mexico and Coastal Waters
• Drilling Down on the OPEC+ Oil Production Cuts
• Dueling Legacies: Which Sultan Deserves Credit for Oman’s Oil-Driven Development?
• Natural Gas and Oil Markets Update
• How Economic and Political Factors Drive the Oil Strategy of Gulf Arab States
• Keeping up With the Jones Act. Changes a Pandemic and Price War Could Bring.
Resource: Carbon Capture in Texas
• What Does Success Look Like? Ensuring a Smooth Transition to the Next-Generation Power Grid
• ERCOT and the Future of Electric Reliability in Texas
• A Pricing Mechanism to Jointly Mitigate Market Power and Environmental Externalities
• Balancing Safety and Innovation: Shaping Responsible Carbon Nanotube Policy
• The US Can Lead in the Hydrogen Economy — If the Treasury Encourages Lifecycle Thinking and Diverse Investments
• The U.S. Could Leapfrog The World In Producing Clean Hydrogen—But Only If Treasury Encourages Diverse Investments
• Developing a Robust Hydrogen Market in Texas
• Houston Energy Dialogues 2022
• Toward Sustainability: Understanding the Challenges
• Why Brain Health Must Lead Migration System Reform
• ESG Moving Forward: Lessons from the Past, Visions for the Future
• Balancing Safety and Innovation: Shaping Responsible Carbon Nanotube Policy
• The Pride and Prejudice of Sustainability: Rethinking Sustainability From a Systems Perspective
• Schrödinger ’s Cat Paradox: Carbon Is the Enemy. Carbon Is Not the Enemy.
• Assessing Houston’s Flood Vulnerability 6 Years After Harvey
• The US Can Lead in the Hydrogen Economy — If the Treasury Encourages Lifecycle Thinking and Diverse Investments
• The U. S. Could Leapfrog The World In Producing Clean Hydrogen—But Only If Treasury Encourages Diverse Investments
• Brain Capital is Key to a Sustainable Future
• Finding ‘Win-Wins’ From Environmental Litigation Losses
• Closing the Loop on the World’s Fastest-growing Waste Stream: Electronics
• Paving the Road for Competitive Green Hydrogen Hubs: Does Chile Have a Chance?
• Baker Briefing Podcast: Is Texas the Next Hydrogen Hub?
• Developing a Robust Hydrogen Market in Texas
• Hierarchical Biopolymer-based Materials and Composites
• Why Classif ying PVC as Hazardous Waste Undermines America’s Zero-Waste and Energy Transition Goals
• Why Gas Stoves Matter to the Climate — and the Gas Industry: Keeping Them Means Homes Will Use Gas for Heating Too
• Houston Energy Dialogues 2022
• Climate Dogmas and Energy Realpolitik Transportation
• Baker Briefing Podcast: The Future of Fuels
• Baker Briefing Podcast: Tesla, Taxes and Texas