Barney Johnson, Benjamin Maslin, Bethan Batson, Chinmay Kale, Christopher Adams, Grace Lee, Junqing Wang, Lucas Theis, Prity Chatterjee, Wan Arman
MARCH CONTRIBUTORS
Ana Moldovan, Ana-Maria Arhire, Bel Summer, Billy Sayers, Chelsea Wong, Claudia Petre, Dima Saca, Eleni Vlataki, Hamssini Sukumaran, Iman Syafiqah, James Thein, Judith Deak, Lydia Newman, Meylan Fernandez, Olly Shad, Petya Atanasova, Sophie Macpherson, Vero Beaudet
DOCUMENT IS INTENDED TO BE READ AS TWO PAGES SIDE-BY-SIDE
ACKNOWLEDGEMENTS
The contents of this research booklet came as the result of thousands of hours of work by a large cohort of contributors, and it is with immense gratitude that we thank each and every one of them who helped in the completion of this great undertaking. In particular, we give enormous thanks to our unit leads and external assessors for their consistent support, encouragement, and thoughtful insights, without which this task would have proven undoubtedly more difficult. We would also like to thank Cardiff University and the Welsh School of Architecture in their support of Unit’s research and continued studies into Liveable Urbanism.
UNIT LEADS
Dr. Shibu Raman
Selim Halulu
EXTERNAL ASSESSORS
Prof. Sergio Porta
Prof. Arunava Dasgupta
Furthermore, special thanks to all previous cohorts of students from this unit who have contributed to the research of Unit Liveable Urbanism, whose work has provided an enormous repository of information on which to build on and further develop.
UNIT OVERVIEW UNIT AIMS & APPROACH
Liveable Urbanism unit is a vertical studio unit consisting of the MArch and BSc 3 students from Welsh School of Architecture at Cardiff University. Studio typically engage with a city that is undergoing tremendous urban transformation whilst addressing environmental challenges, issues of waste management, tackling equity and economic resilience.
Since 2018, the studio unit has been working with rapidly growing cities that are funded by smart city missions in India in collaboration with the School of Planning and Architecture, New Delhi, Indian Institute of Architects (IIA), SCSM College of Architecture Kochi, Experimental16 at the AA, Complexity Planning Unit and Manchester University, Uniciti and UDSU at Strathclyde. In 2021-22, we have collaborated with the Kochi Mayor’s office, Cochin City Corporation and Centre for Heritage Environment and Development (C-HED) to develop a comprehensive vision for a sustainable, resilient, and liveable future for Kochi.
Studio focus on the link between urban form, sustainability and quality of life and the projects explore relational propositions that conditions and are conditioned by the complex layers of the city. Approaching cities as complex dynamic system, give students an opportunity to understand the complex interactions between the physical, social, environmental and economic subsystems within a city.
The studio had four distinct phases that included:
1.Grounding: where the students learned tools and developed skills to read and model cities as complex systems, conduct literature, archival research, critical analysis of existing masterplans and developed a critical position on the sustainable and liveable city to define the focus of their individual design thesis.
2. Research: to explore and expand understanding of the theme identified earlier, identify gaps in knowledge, develop research methods and devices and explore those themes during the study trip to India.
3.Action: developed a strategic urban response addressing key issues identified from research to develop a coordinated urban strategy mediating each project in the unit.
4. Re-action: developed a proposal for a comprehensive architectural intervention. The catalyst project will trigger the transformation of Kochi towards a liveable city.
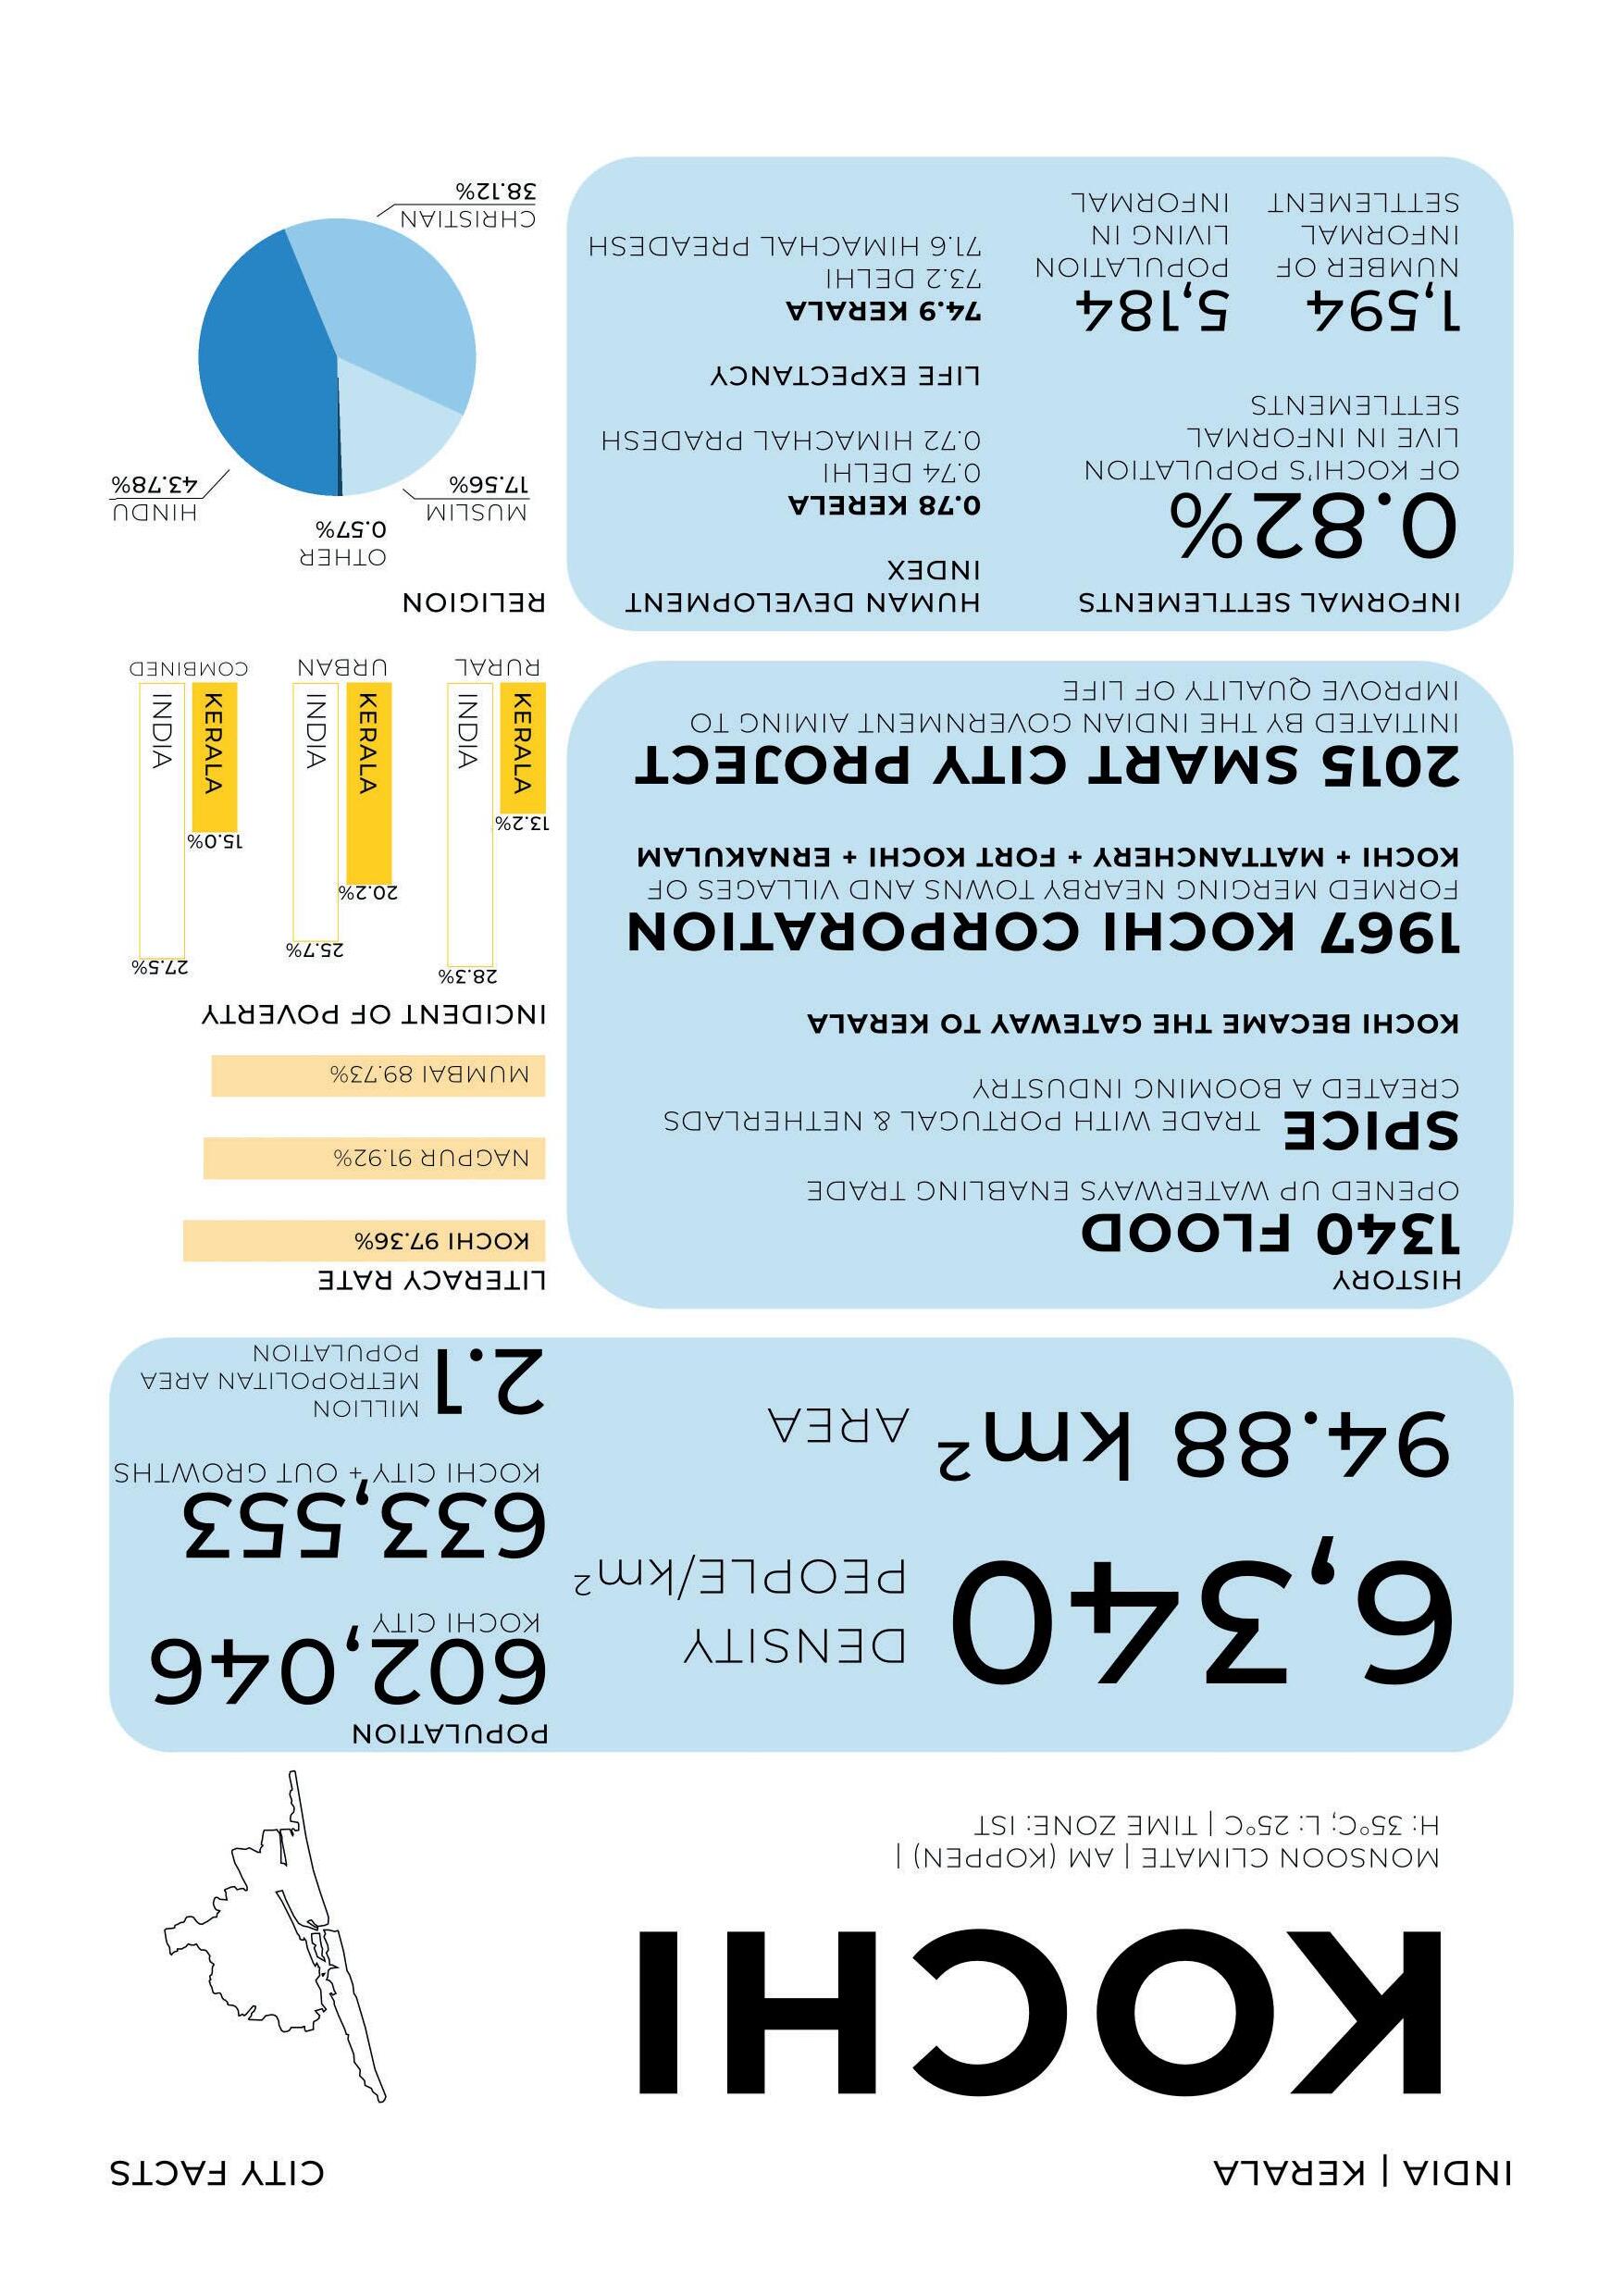
Kochi is a coastal city with a population of 0.67m in the southern Indian state of Kerala. It is an important port town with great industrial, and tourism potentials, and is one of the 100 cities that was selected for smart city funding from the Government of India.
The studio unit approaches cities as a complex dynamic system completing a comprehensive analysis of Kochi engaging its social, economic, environmental, governance and spatial subsystems as well as how each individual system interacts with another. Initially, through a comprehensive literature review on concepts surrounding liveable and sustainable cities, will develop a critical position on what makes cities liveable. In this unit, interactions with stakeholders will evoke the understanding of ideas for future scopes of development through Kochi. The application of smart tools and remote data collection techniques (see chapter 3) overcome a lack of morphological, social, and environmental data.
Following a comprehensive approach to make Kochi more liveable, we aim to improve the quality of life for citizens, addressing the key issues that has a negative impact on quality of life in the city.
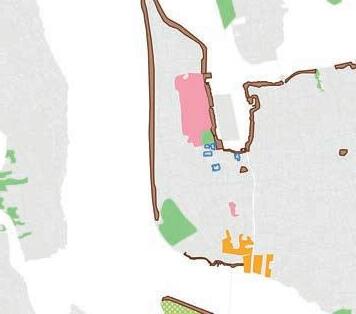
Studio unit developed an extensive base map of Kochi using an open-source GIS platform. During the research phase, we established strong relationships with key stakeholders of urban development in the city, documented the morphological conditions of the urban area and key buildings within the city using 3d scanner and drone survey, mappilary and recorded community voices through an extensive questionnaire survey. The analysis of these allowed us to develop a deeper understanding of the physical and morphological aspect of Kochi as well as how they influence behaviour, environment and ecology and all other aspects which impact the everyday life and liveability. The stakeholder interviewees involved local architects, governing bodies, policymakers, business bodies and the Mayor of Kochi, which allowed us to develop the dynamic relationship between decision making, ambition, vision, politics as well as management which add a different layer of complexity facing the city.
The key themes that the studio explored in the city scale include aspects of morphology, flood risk, ecological and environmental qualities and challenges and urban demographics.
Through the diverse research approaches, a comprehensive urban strategy has been developed, which will subsequently branch out into individual interpretations presented through personal design thesis, inter-connected set of flexible and resilient interventions and strategies aiming to address the root-causes of identified issues facing the city. Each approach within the urban strategy has been developed as a detailed architectural proposal, acting as a catalyst of change for Kochi’s transformation towards a more sustainable, liveable city.
LITERATURE REVIEW
Through the literature review we aim to define what could be a liveable city. What affects the quality of life for those who reside in the city? What is the relationship between the built environment, or physical layer of the city, to various aspects of quality of life? It will explore cities as complex systems where everything is connected with everything so any intervention in one layer of the liveable city is seen as a complex system within multiple layers of economic, environmental, social and spatial systems. Any of those layers, whether it is policy, eco-logical intervention or social interventions would have a reaction in other layers.
CHAPTER LEADS: LYDIA NEWMAN & SOPHIE MACPHERSON
LIVING STANDARDS IN CITIES
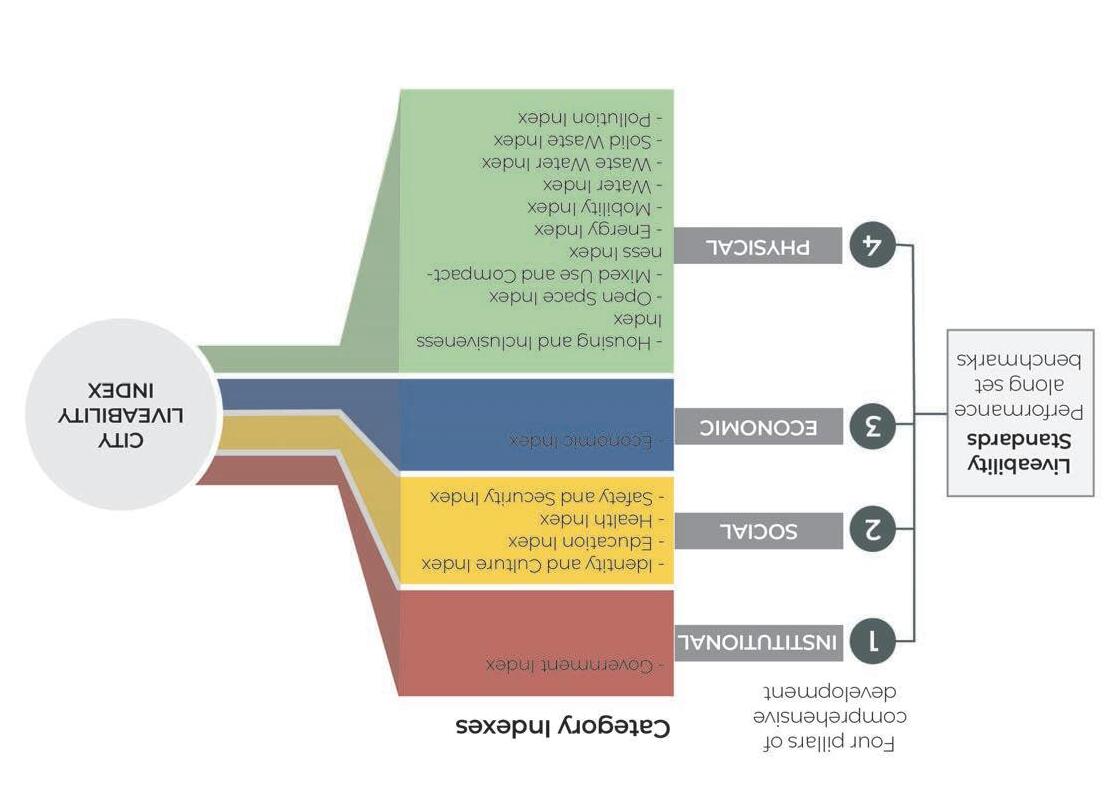
Recent decade as seen the Planning Commission in India focusing more on urban development instead of rural development with national missions such as Jawaharlal Nehru National Urban Renewal Mission (JNNURM) and Smart City Mission. As part of this the Ministry of Urban Development (Government of India) has developed a Liveability index containing 74 indicators which are grouped in 15 categories (see Fig )
EASE OF LIVING INDEX
The rapid unplanned urbanisation of cities has manifested a number of challenges to the factors of liveability. Although the concept has been present for a few decades, forming liveable cities for its citizens has been an ongoing aspiration for designers, policy makers and city planners. Detailed exploration of the concepts to improve quality of life in relation to a built environment has been carried out by many organisations. A relevant challenge has been the adaptation of this global concept into the Indian context and mainstreaming it into the urban policy and planning framework of the cities.
Through initiatives such as the Ease of Living Index 2019 of the Ministry of Housing and Urban Affairs (MoHUA), urban practitioners and policymakers along with the Government of India are now actively working towards the reality of enhancing the liveability of Indian cities.
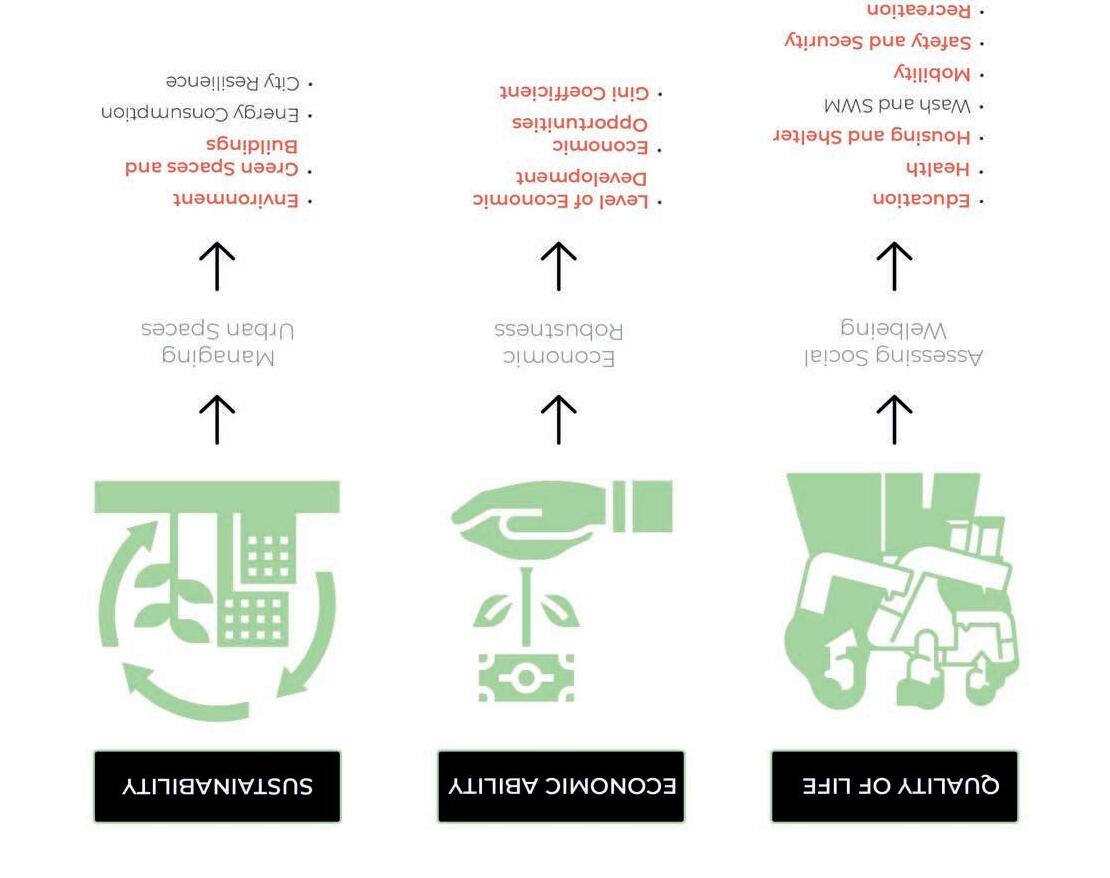
Ease of Living Index is a framework to examine the wellbeing of citizens and ultimately improve quality of life. The Index assesses the liveability of 114 cities in India across 3 sets of pillars, which include a total of 14 categories and 50 indicators (Ease of Living 2019). Interweaving the social, economic and sustainability pillars, this scheme allows Indian cities to move towards utilizing liveability in their urban framework.
In India, urban development policies and strategies are often centred on infrastructure development for economic development and regularly employ planning policies and standards from the West. However, these approaches by the central government have been considered as ‘piecemeal’ efforts at the city level as the centrally sponsored urban development schemes provide ad-hoc solutions which tend to lack public consultation. There is a need for identifying aspects of enhancing liveability at a local level itself which can further transform the floating concept of ‘liveability’ into a tangible reality (Liveable Urbanism 2020-2021).
Fig.1.2. The model to compute the Liveability Index (Government of India 2019).
Fig.1.3. The factors highlighted overlap with the Quality of Life Assessment (Ease of Living Index 2019).
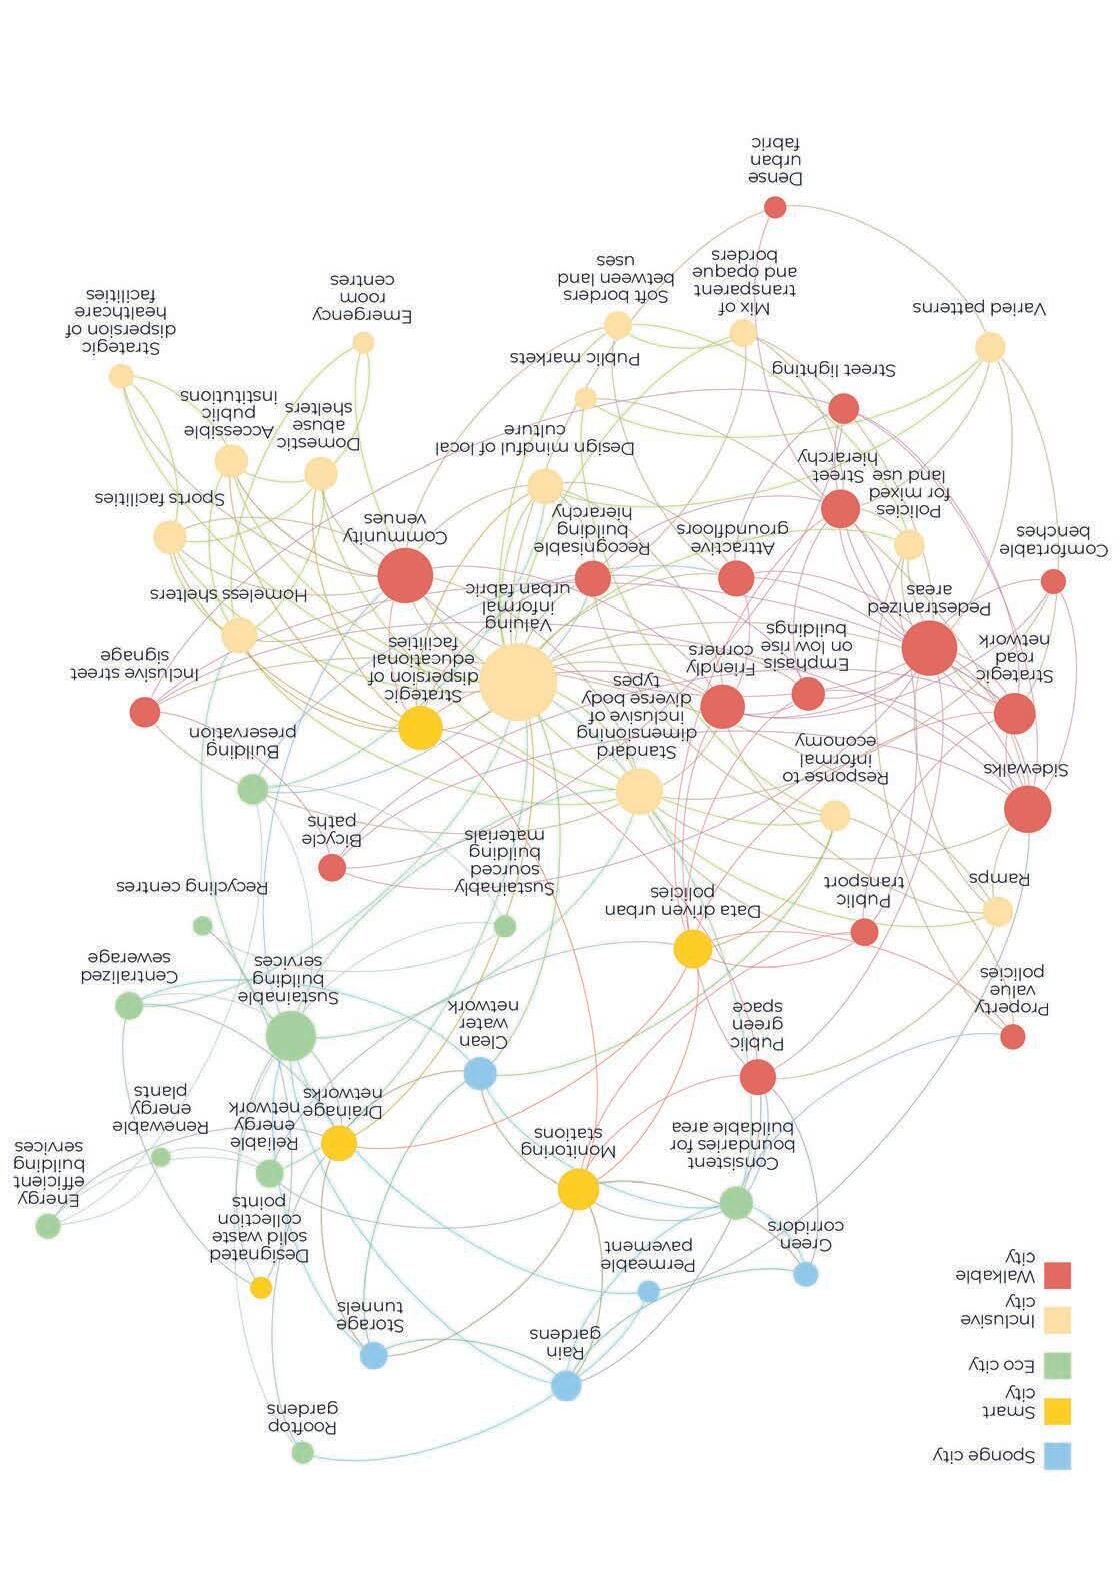
Fig.1.11.
urban development models (Liveable Urbanism Unit 2021-2022).
Fig.1.12. A collage reflecting the relationships between various urban development models (Liveable Urbanism Unit 2021-2022).
INTRO TO KOCHI 02
CHAPTER LEADS: JUDITH DEAK & CLAUDIA PETRE
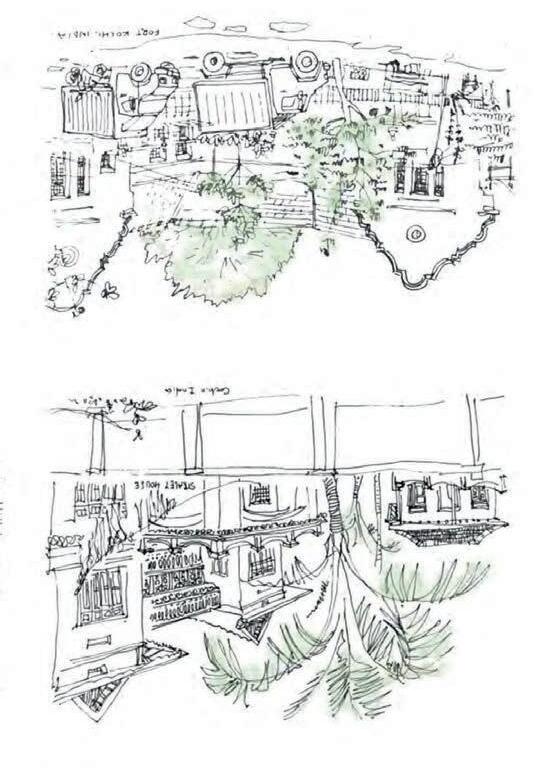
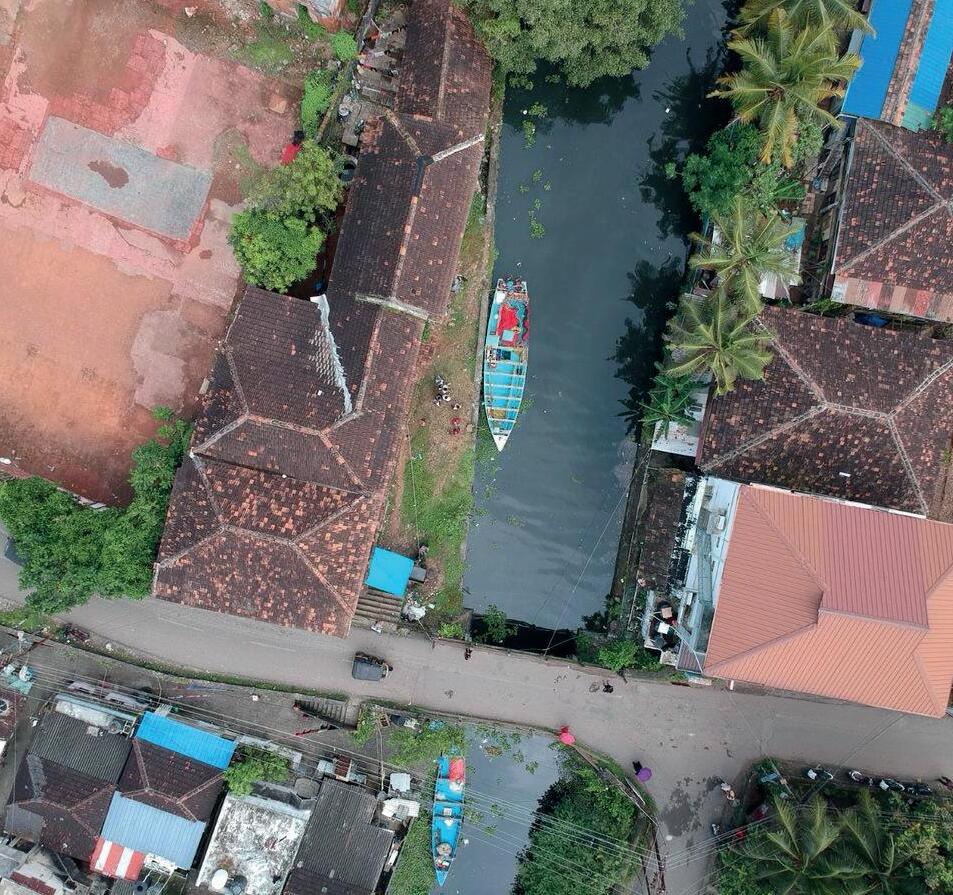
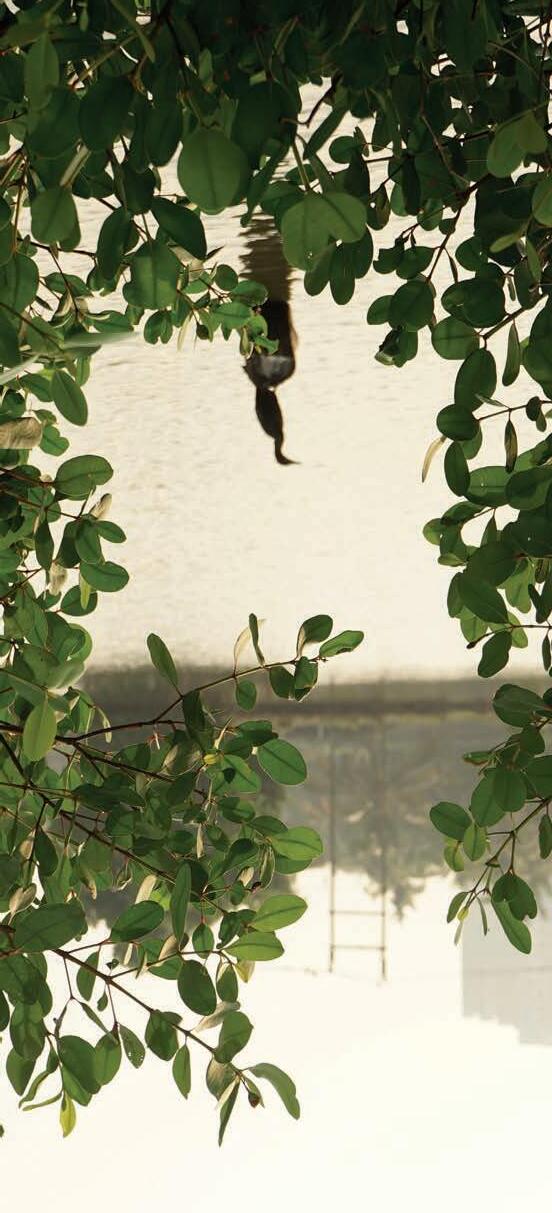
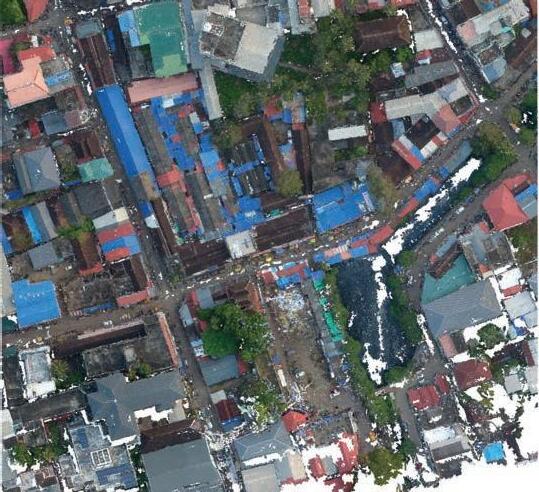
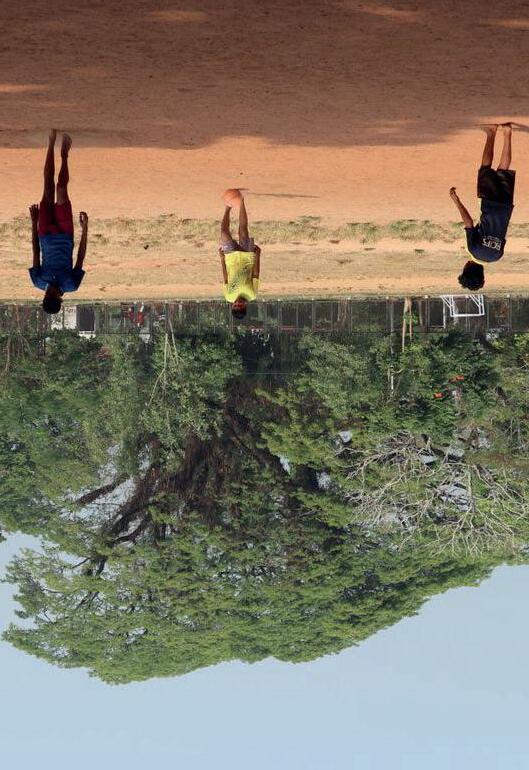
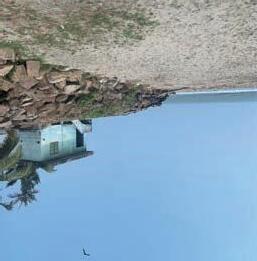
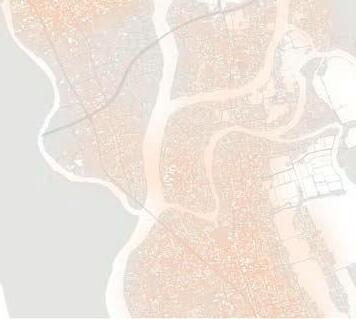
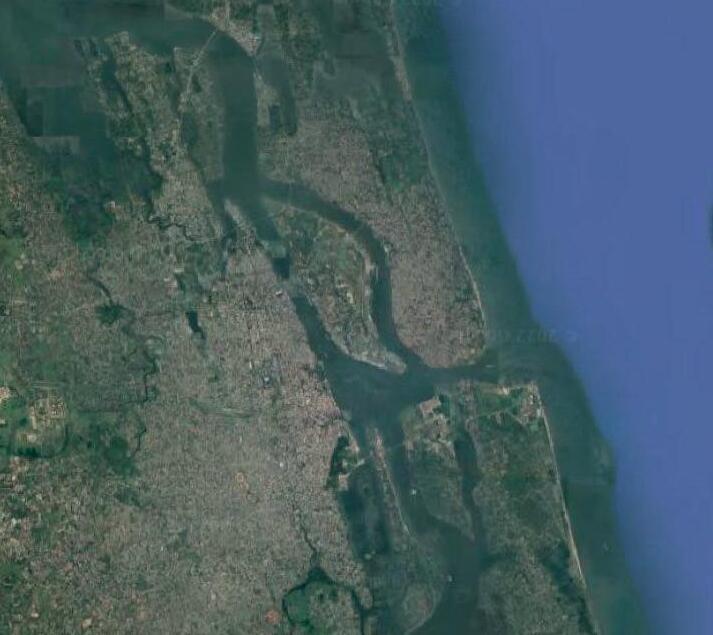
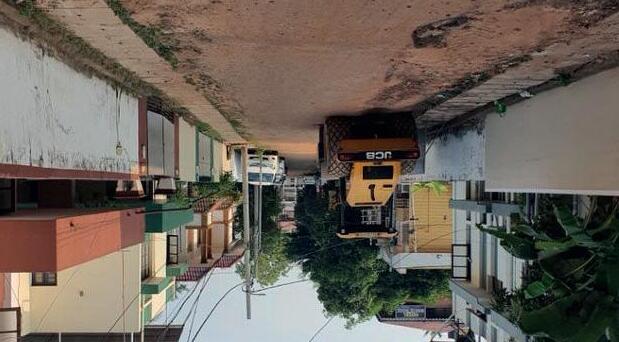
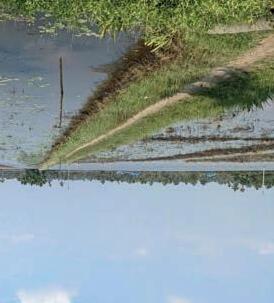
Fig.2.1. Drone photograph of Koch.
Fig.2.2. Census analysis (based on Kochi City Population Census 2011-2022 2011).
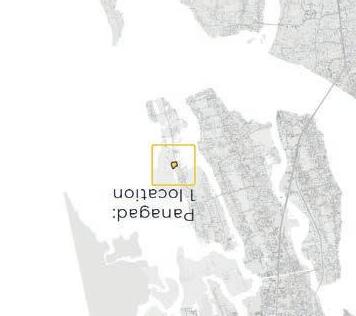
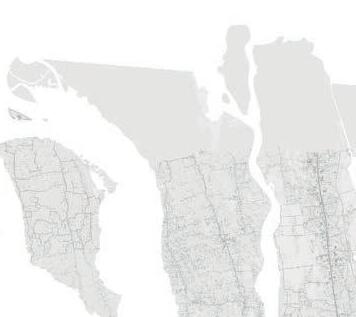
LOCATING KOCHI
Kochi (formerly known as Cochin) is a major city located on the Southwestern tip of India in the state of Kerala. Due to its access to the Arabian Sea, it is the harbour that has defined Kochi’s urban development since its founding in the late 14th Century. From Arab spice traders, to Jewish merchants, and Portuguese, Dutch and British explorers. As such, the city has gained an incredibly diverse range of cultural and religious denominations, each owing to these waves of trading migrants over the many distant centuries (Cochin.org.uk n.d.)
More recently, the city has seen development as a major financial, commercial, and industrial centre in Kerala, and has gained a burgeoning status as a major hub for tourism within India. Furthermore, as well as economic primacy; the city has also gained political primacy - housing the headquarters of the Indian Southern Naval Command, alongside a number of other major government and state institutions (Cochin.org.uk n.d.)
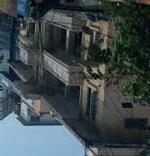
However, in its rapid recent development in the last century, the city has experienced increasing crises of liveability. From urban sprawl, to congestion, pollution, and unwalkability to name but a few - these issues are increasingly inflicting a negative impact on Kochi’s many inhabitants. These are issues which affect developing cities globally, and are critical to solve as the world’s urban population continues to balloon.
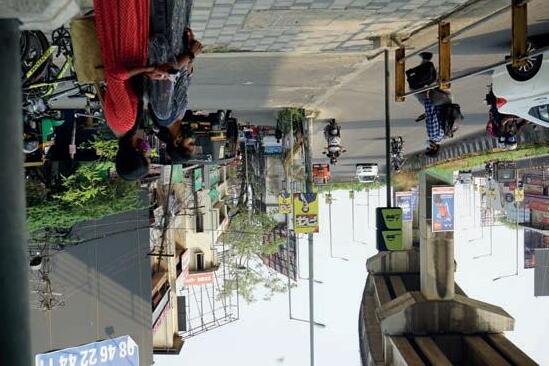
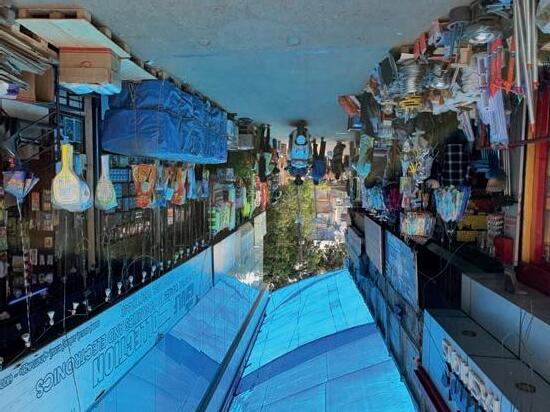
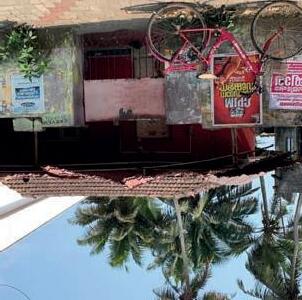
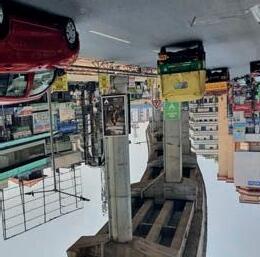
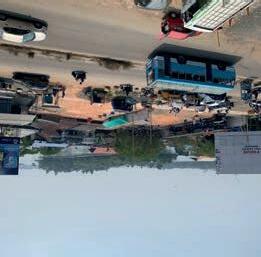
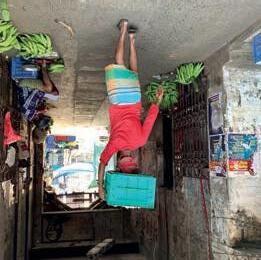
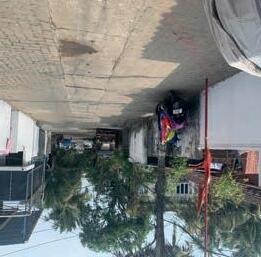
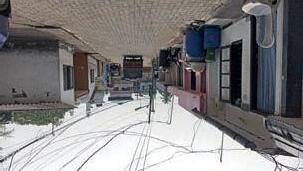
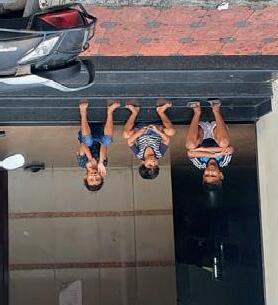
Market place and small social interactions.
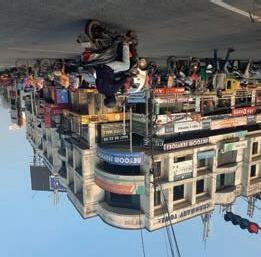
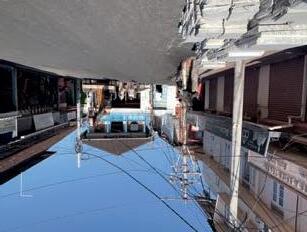
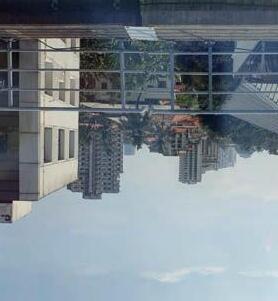
Fig.2.4. Road, overground metro and pedestrian infrastructure.
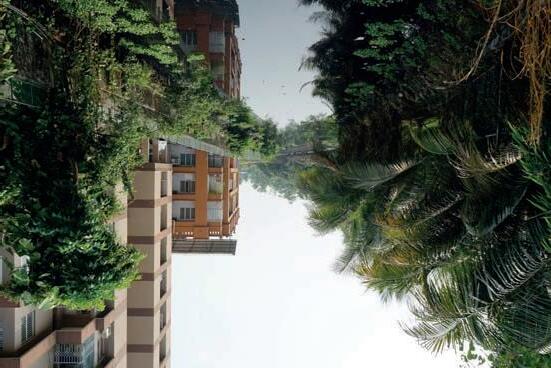
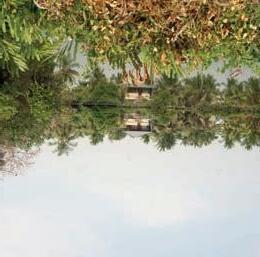
Fig.2.5. Very limited public access to the canal which is also dotted with garbage.
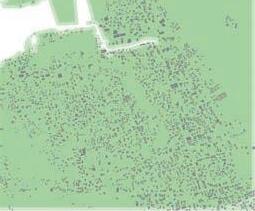
Fig.2.3. Outlines of Indian states and focus on Kerala.
Fig.2.6.
Map of Indian states and territories
Map of southern India and Kerala
Kerala State
Greater Kochi
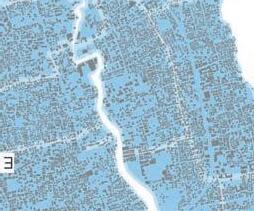
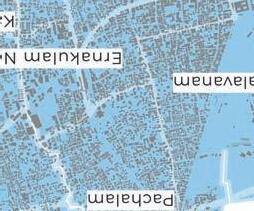
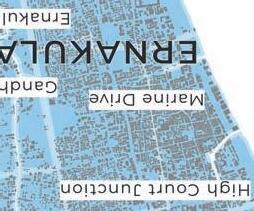
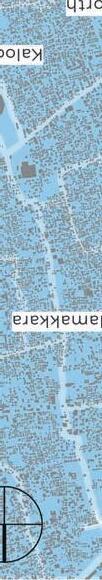
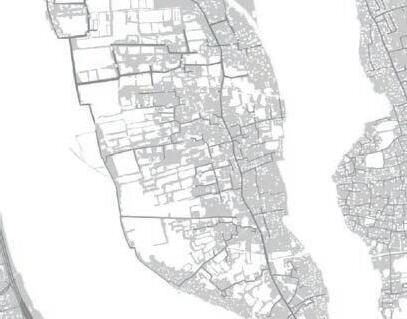
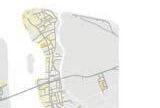
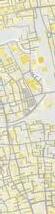
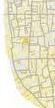
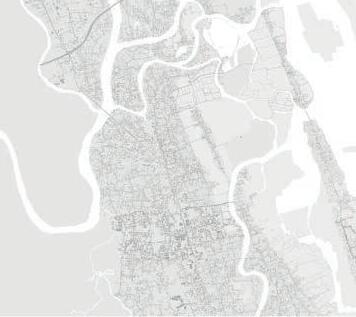
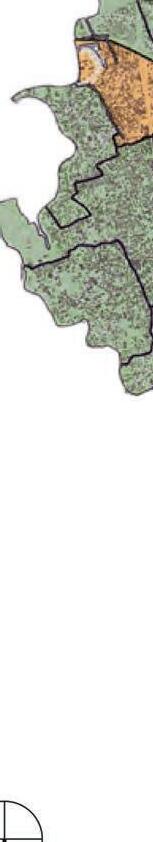
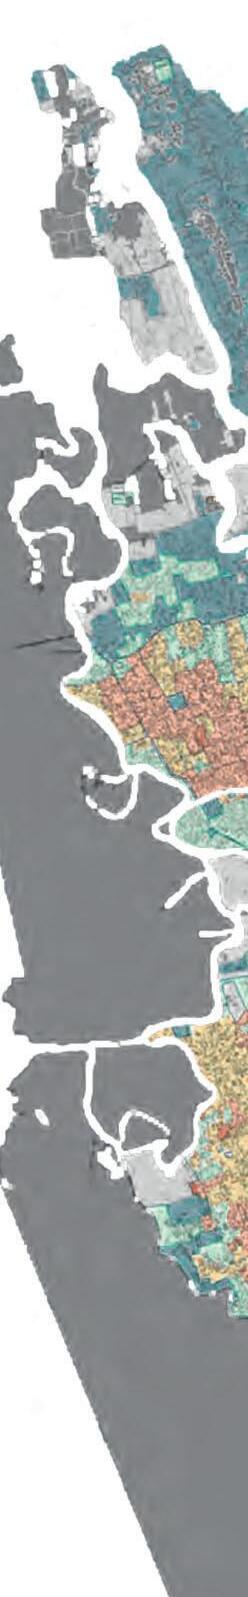
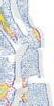
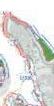
Fig.2.7. GIS map highlighting main neighbourhoods.
STAKEHOLDER INTERVIEW WITH LOCAL COMMUNITY LEADER:
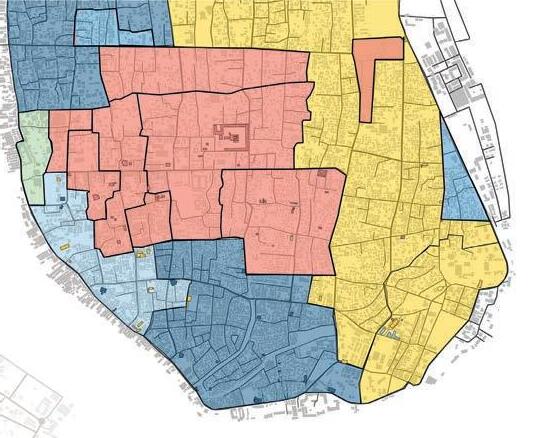
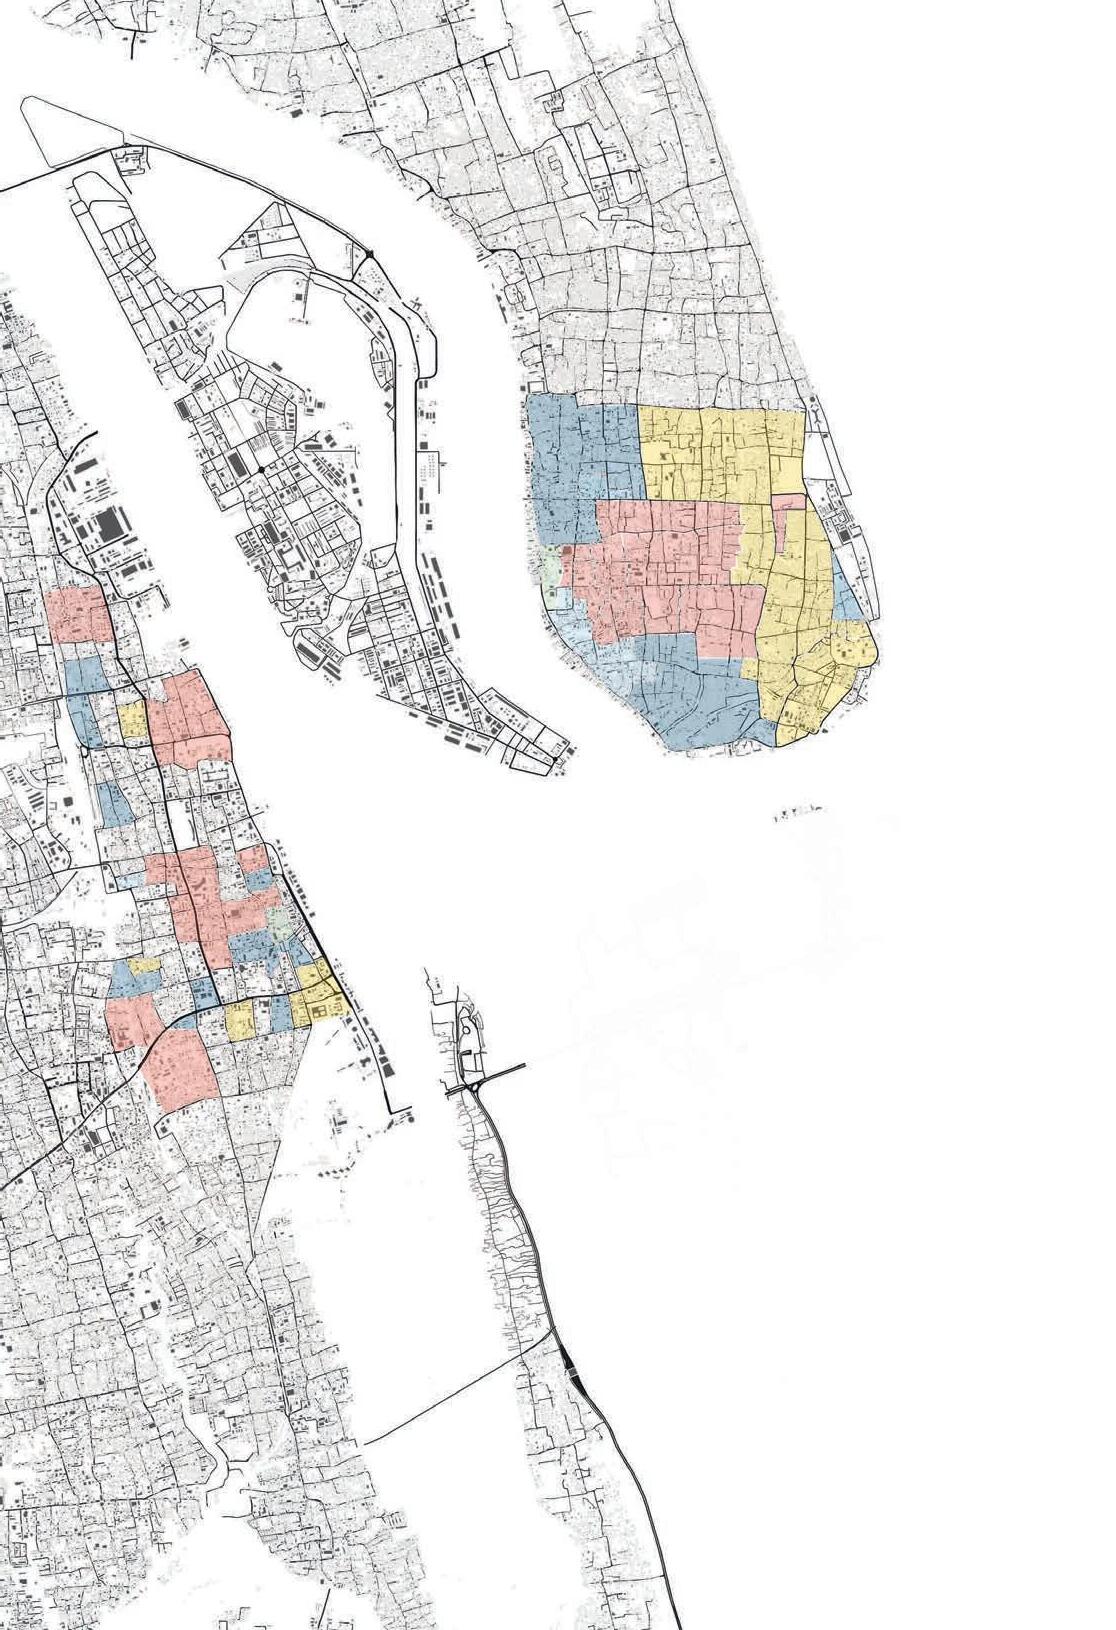
“Mattanchery is a very interesting place because from one end to the other those specific social and cultural identities have become political identities and there is actually alot of conflict.[..] As you go you will start noticing how even the houses for each community are different, and the spaces are different and they take a lot of these spatial configurations from the way they use spaces, which are directly related to their cultural identity [..] In Mattanchery they really work hard to maintain those differences, specifically because they live next to each other. As migrants they try to hold onto their traditional roots.[..] The older churches and older mosques are surprisingly similar to the temples because the traditional craftsmen are the same. The new architecture is very distinctly different.”
STAKEHOLDER INTERVIEWS WITH LOCAL RESIDENTS:
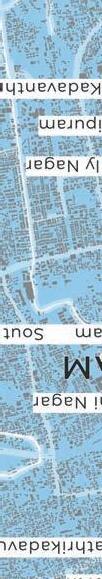
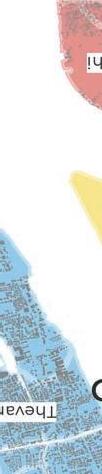
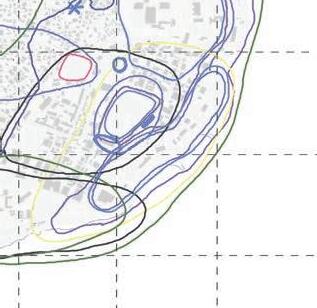
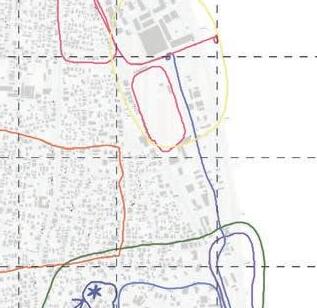
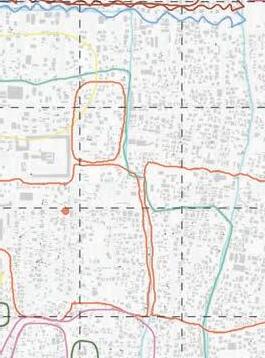
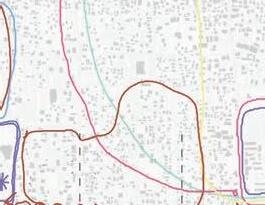
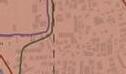
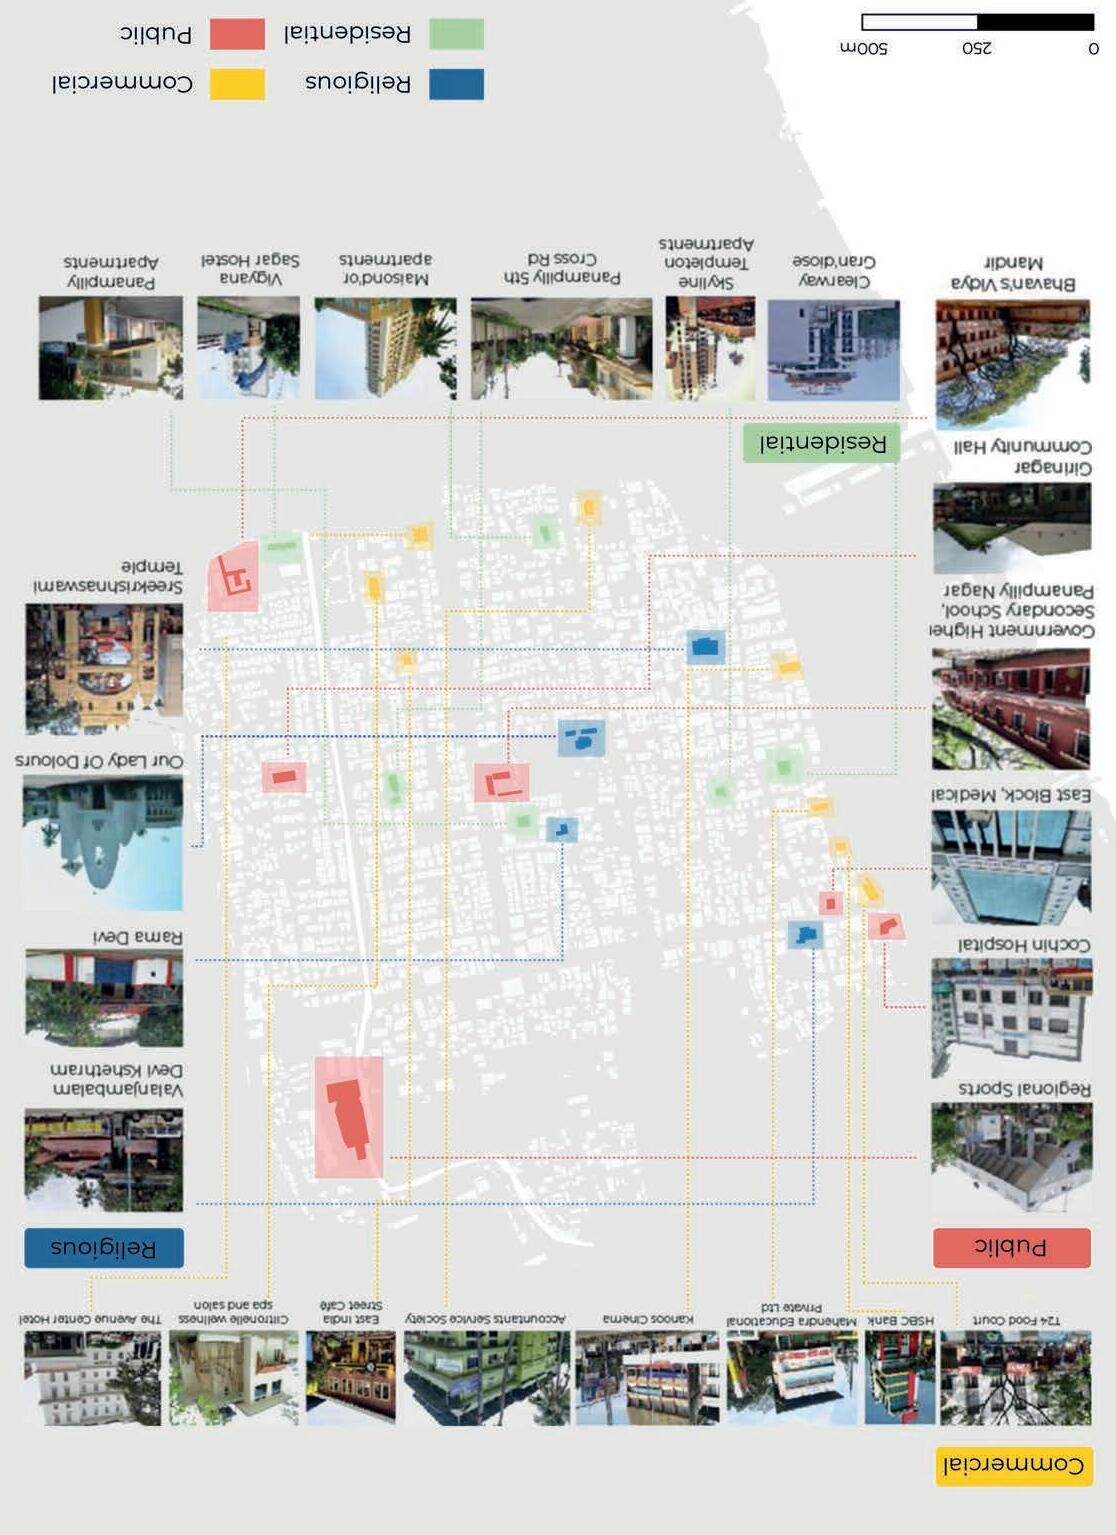
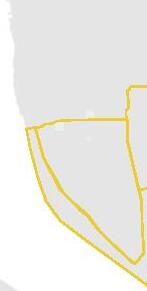
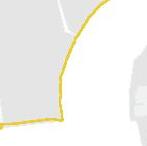
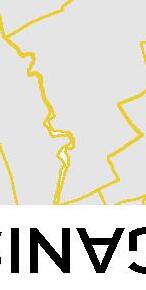
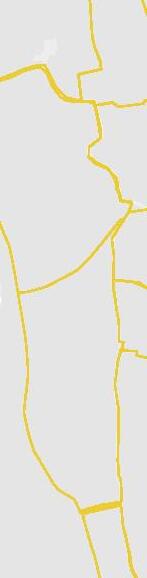
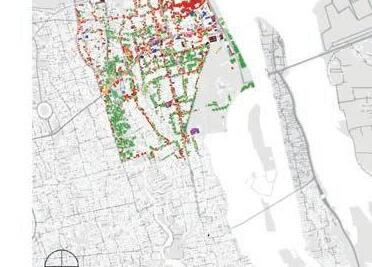
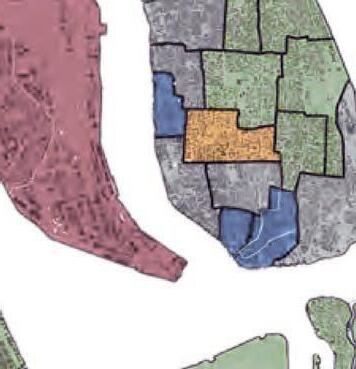
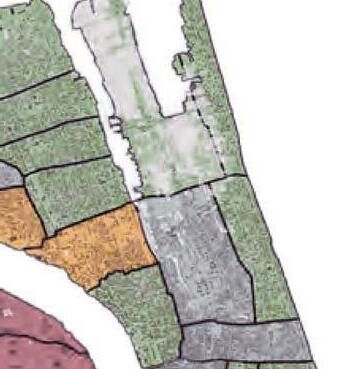
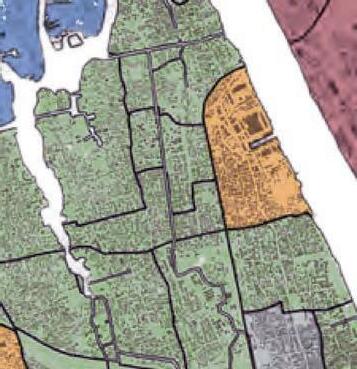
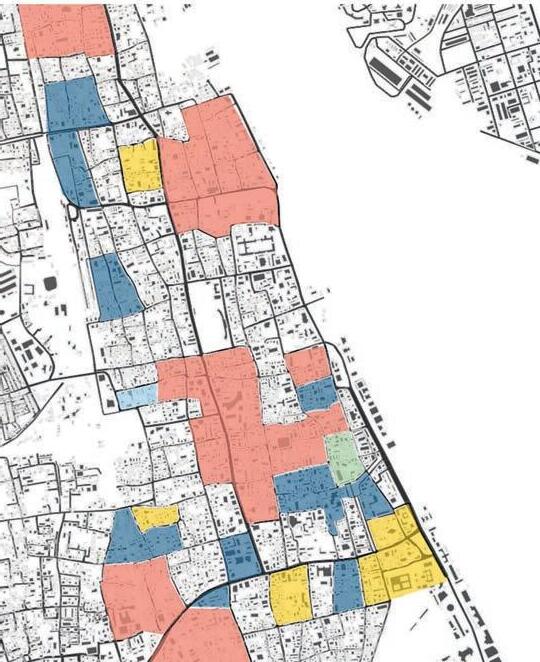
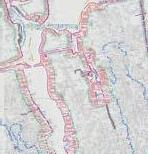
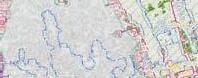
The map below illustrates interviews with 50+ community members from different religious groups and neighbourhoods that were undertaken to help further understand how these communities have congregated, the divisions that exist between them, and how these have been translated into space.
Residents were asked to circle their neighbourhoods, as well as surrounding ones. This exercise further confirmed that religious groups live seperated from one another, creating a unique cultural mosaic throughout the city.
Note: The different colours on the map correspond to interviews conducted with different groups of people.
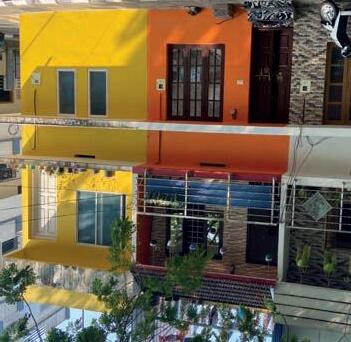
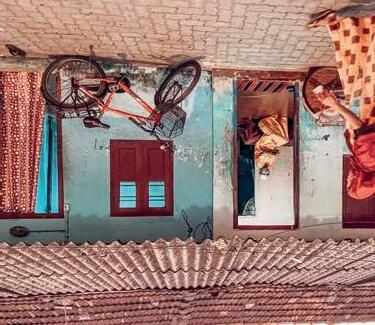
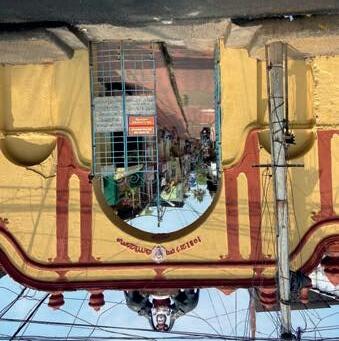
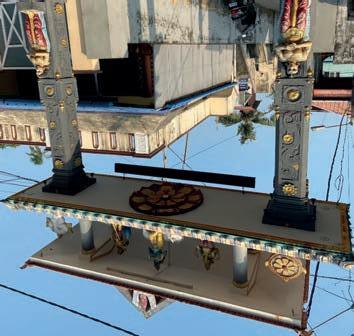
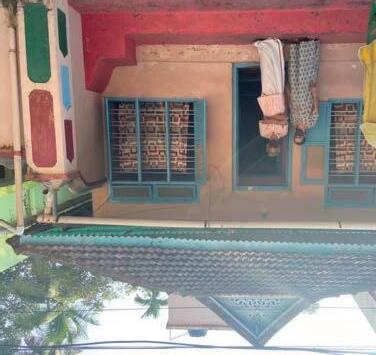
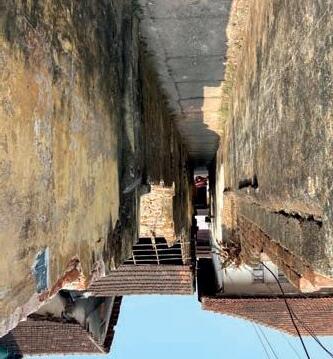
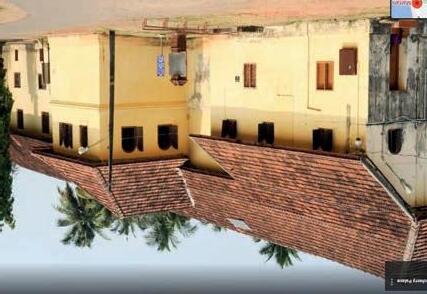
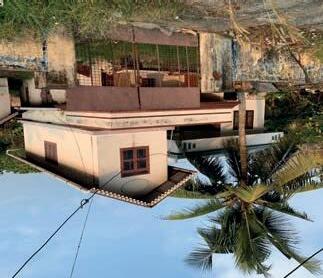
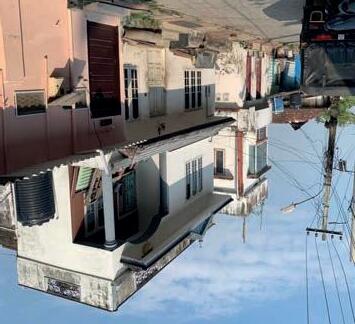
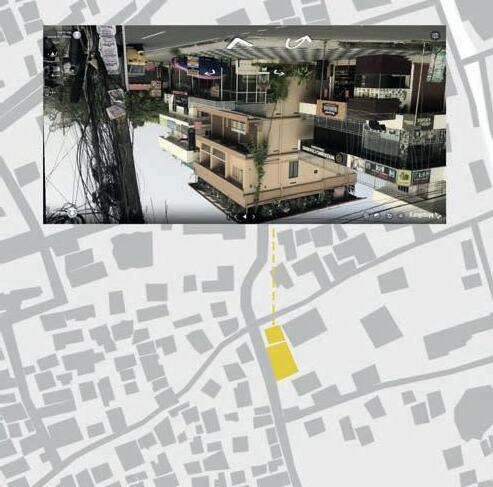
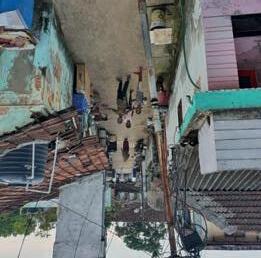
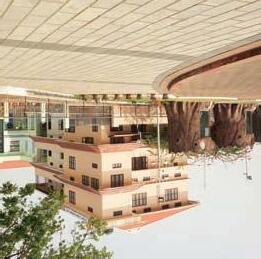
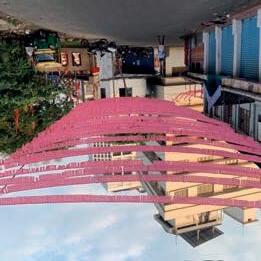
As Monolita pointed out in her stakeholder interview, each community works hard at maintaining their differences which can be clearly seen in the unique look and feel of each neighbourhood. Many of these communities are often defined through symbolic gateways (Image C+D) or gated off from other neighbourhoods with tall walls, creating spatial boundaries and uninviting dead public spaces between them (Image F).
-Monolita Chatarjee, Architect and Community Leader in Kochi.
D. GATEWAY TO SHIVA COMMUNITY
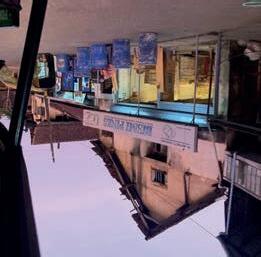
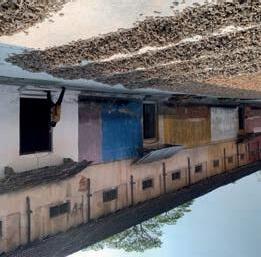
Fig.2.26. Photographs of unique neighborhoods in Kochi.
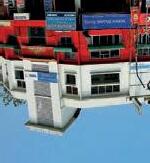
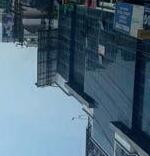
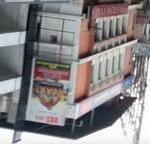
Fig.2.29. General aspect of buildings (Mapillary n.d. and Google n.d.)
Fig.2.30. General aspect of buildings (Mapillary n.d. and Google n.d.)
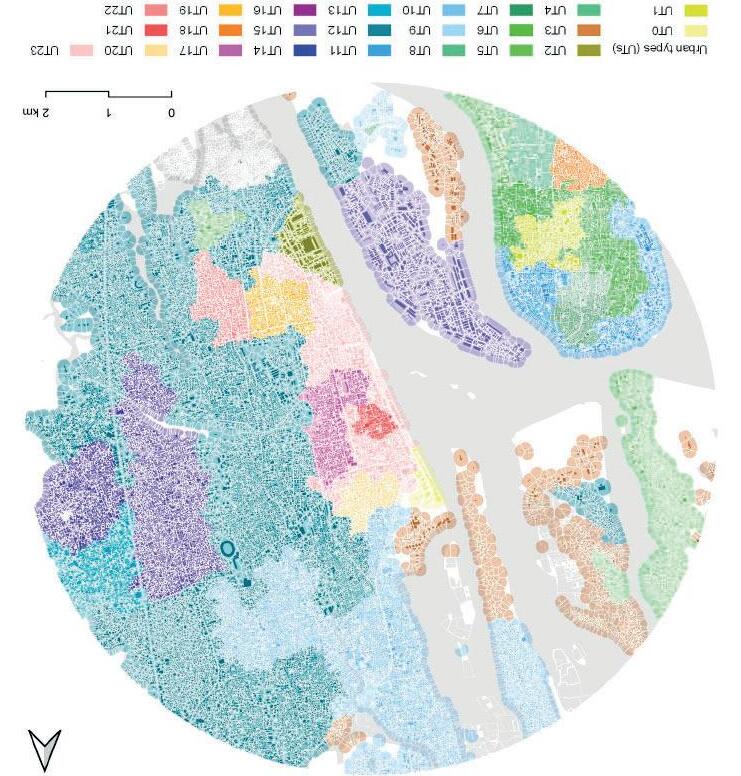
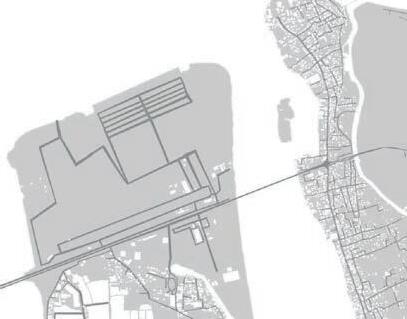
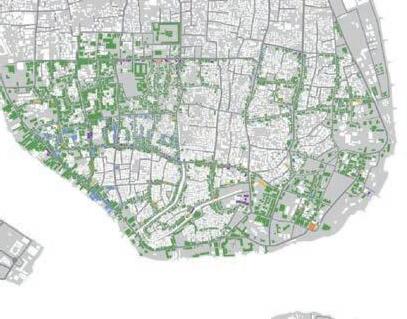
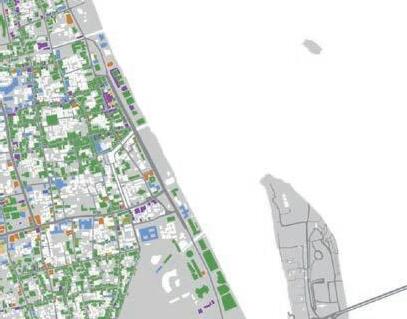
URBAN MORPHOMETRICS
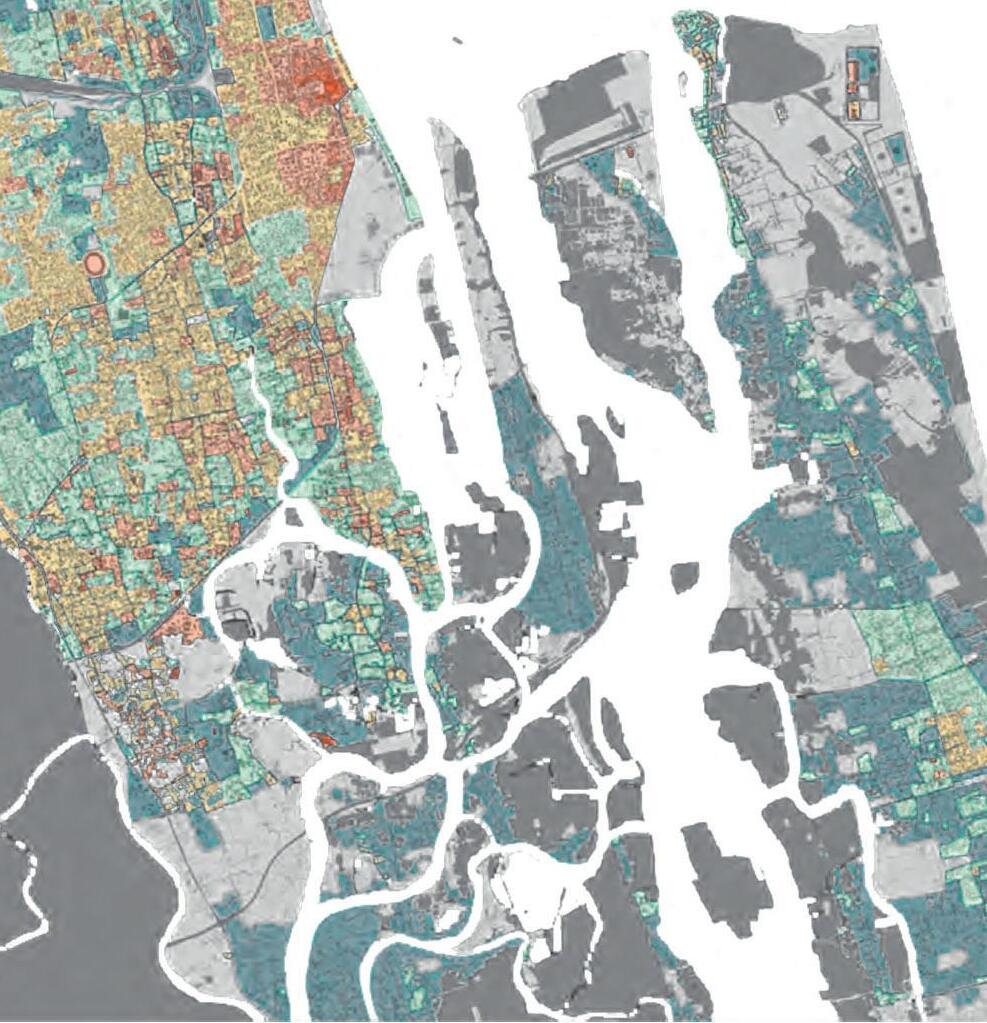
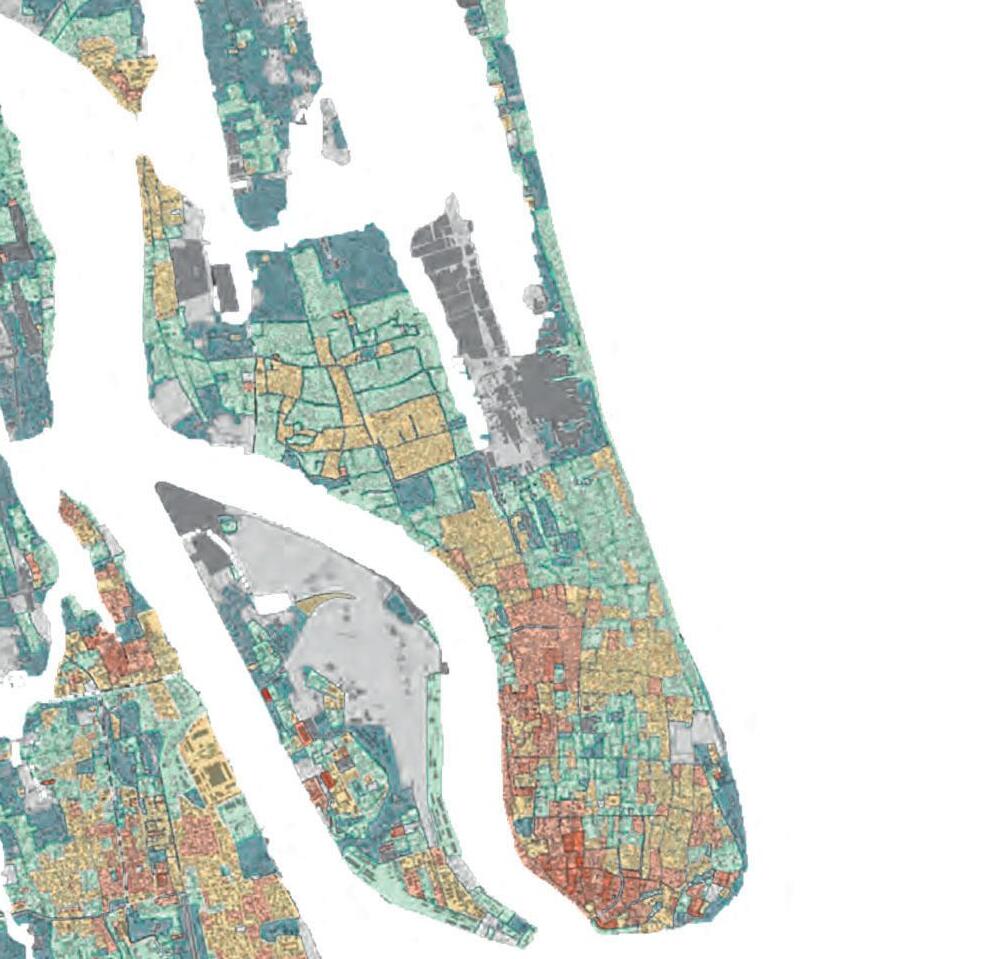
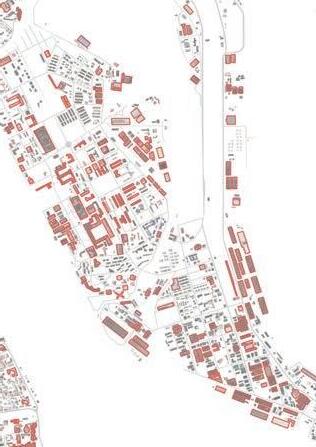
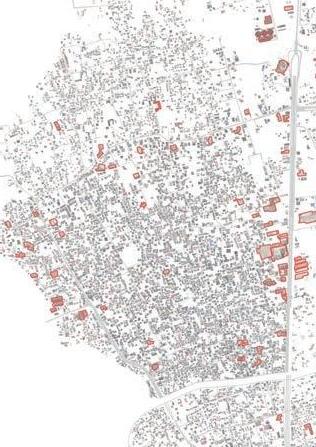
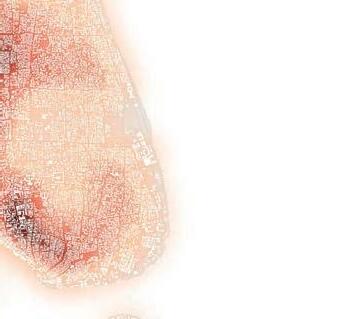
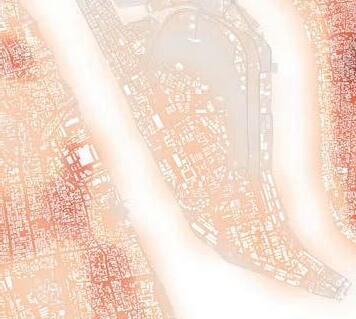
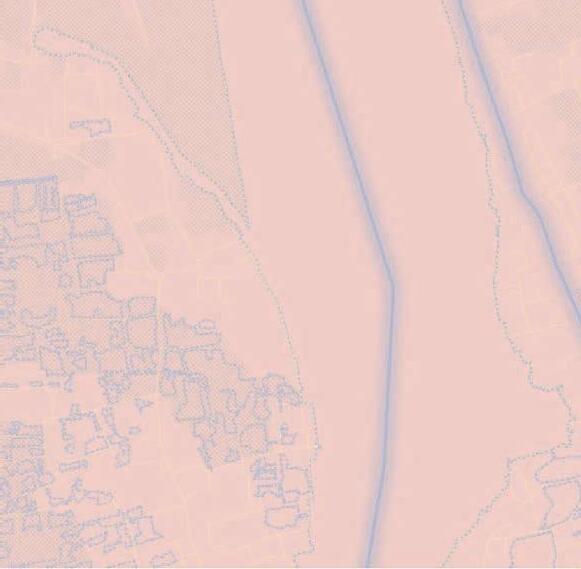
The area of historical warehouses, located around the top of the peninsula, are correctly classified as a separate UT (i.e., UT11): this is mainly characterised by a compact, medium built-up density, one two-storey building on tight cells, aligned to respond to street hierarchy, often hosting public and retail activities on the ground floor. (Venerandi 2021)
The most historical part, located in the west peninsula, is largely characterised by UTs in the green shades (e.g., UT6, UT7, UT8). These typically feature a rather uniform, informal urban fabric, with permeable street networks, blocks of regular size, traversed by pedestrian paths, high block, and cell coverage, with small cells and building footprints. Often occupied by makeshift buildings of one storey only, ground floors, especially along main streets, host a range of commercial activities (Venerandi 2021).
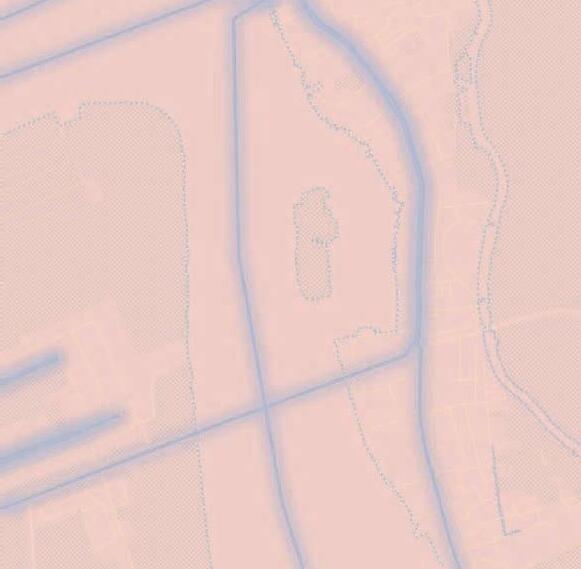
The morphometric profile of UT18 suggests a slightly coarser and less dense urban fabric, with roughly half of the cells falling in the first interval (up to 336.1 m2) and 34% being in the second one (i.e., between 336.1 and 650.9 m2). Building footprints follow a similar pattern, with most (40%) concentrating in the second interval, i.e., between 79 and 145.1 m2 (Venerandi 2021).
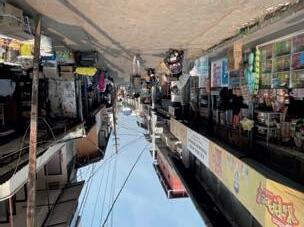
Ernakulam Market features above-average density, a relatively more chaotic urban fabric, with both compact and elongated buildings mostly not aligned with their respective cells, except in the three main streets of the area (Market street, Broadway, and Jew street). Each block has a high permeability due to frequent capillary roads and cul-de-sacs. The orientation of buildings is more regular along main roads while it breaks down towards the inner part of blocks (Venerandi 2021).
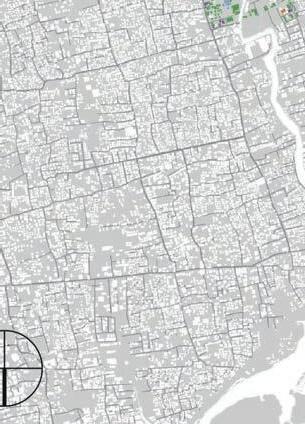
URBAN MORPHOMETRICS DISTRIBUTION
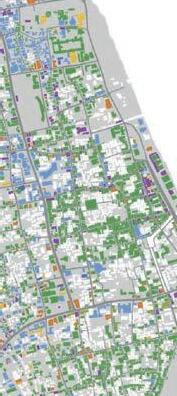
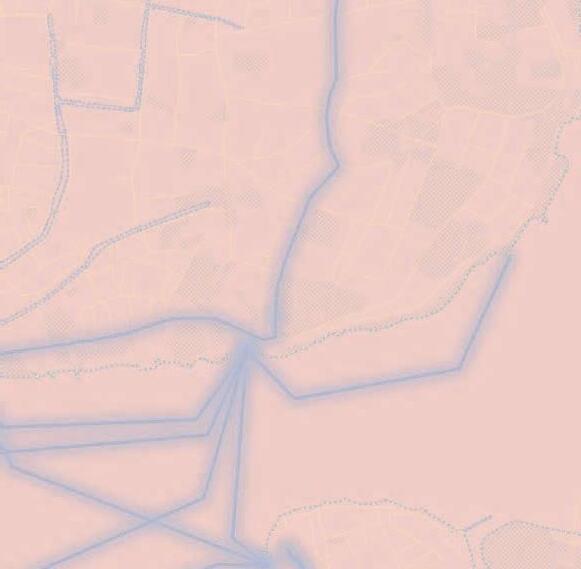
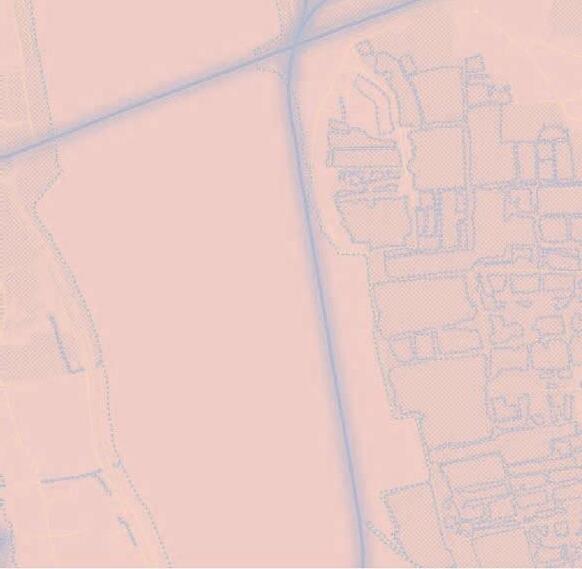
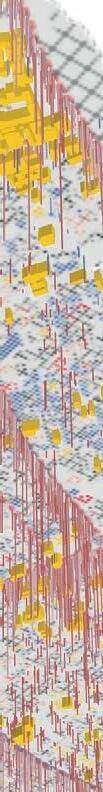
Urban MorphoMetrics (UMM) is a replicable methodology that captures the morphological uniqueness of homogeneous urban areas and helps to design new master-plans with the advantage of a controllable awareness of it. More specifically, UMM: (i) identifies homogeneous patterns of urban form in cities, i.e., urban types (UTs hereon) via a rich description of current urban form, based on hundreds of numerical spatial descriptors (morphometrics); (ii) extracts from each UT its own numerical form code by distilling a sub-set of six main morphological
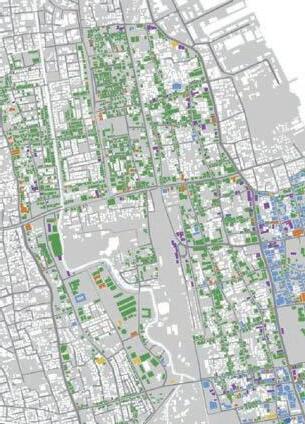
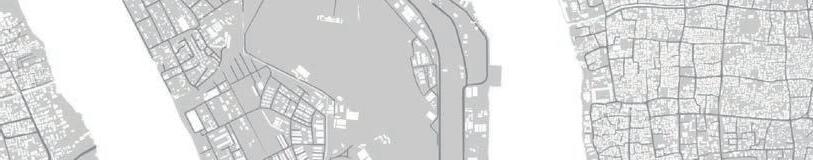
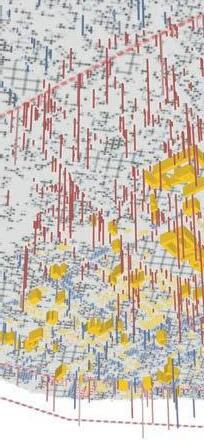
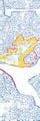
features, which are relevant to city planning and place design; (iii) operationalises these profiles to inform the formation of evidence-based design codes (DCs hereon) in designated areas. The application of the proposed methodology to Kochi (IN) reveals 24 distinct urban types with unique morphological features as presented on the opposite page (Venerandi 2021).
Mattancherry Palace, Mattancherry
Family house, Vypin
Aspinwall House, Fort Cochin Family house, Fort Cochin
Fig.2.31. Selection of typical buildings from specific areas (Google n.d.)
Fig.2.32. Morphometric taxonomy of Kochi. Buildings are colour-coded according to their respective UTs and level of similarity (Venerandi 2021).
The use of balconies creates a modern interpretation of the traditional veranda, creating shaded outdoor spaces. The bottom two floors are typically distinct from the rest of the building, providing an element of human scale, while facilitating retail space.
DRIVE
Buildings are typically made of concrete with extensive glazing, adopting a postmodern or neo-classical style.
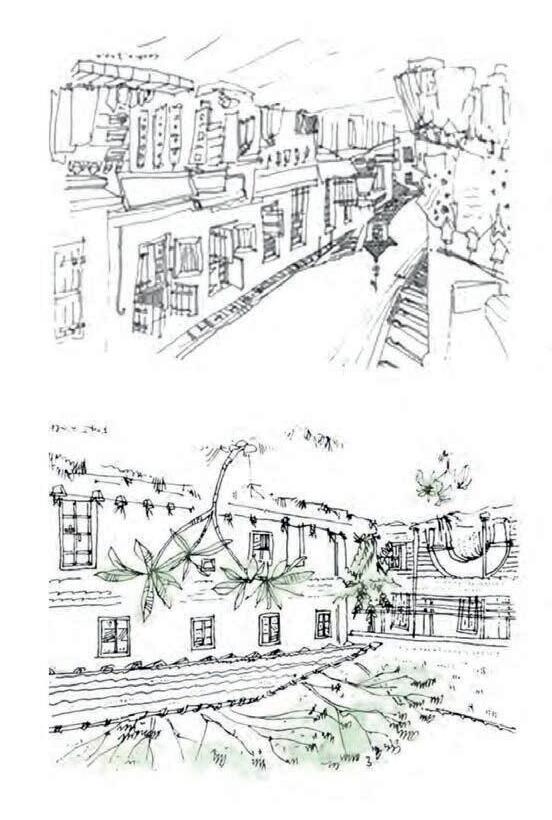
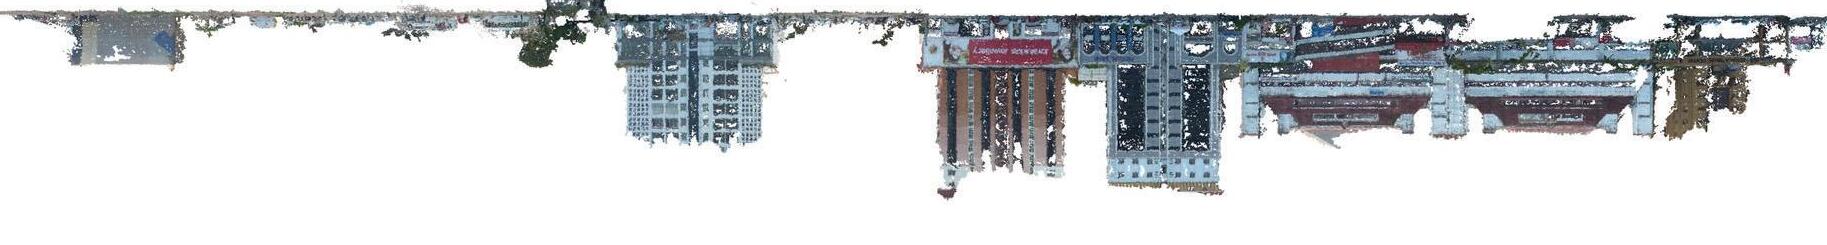
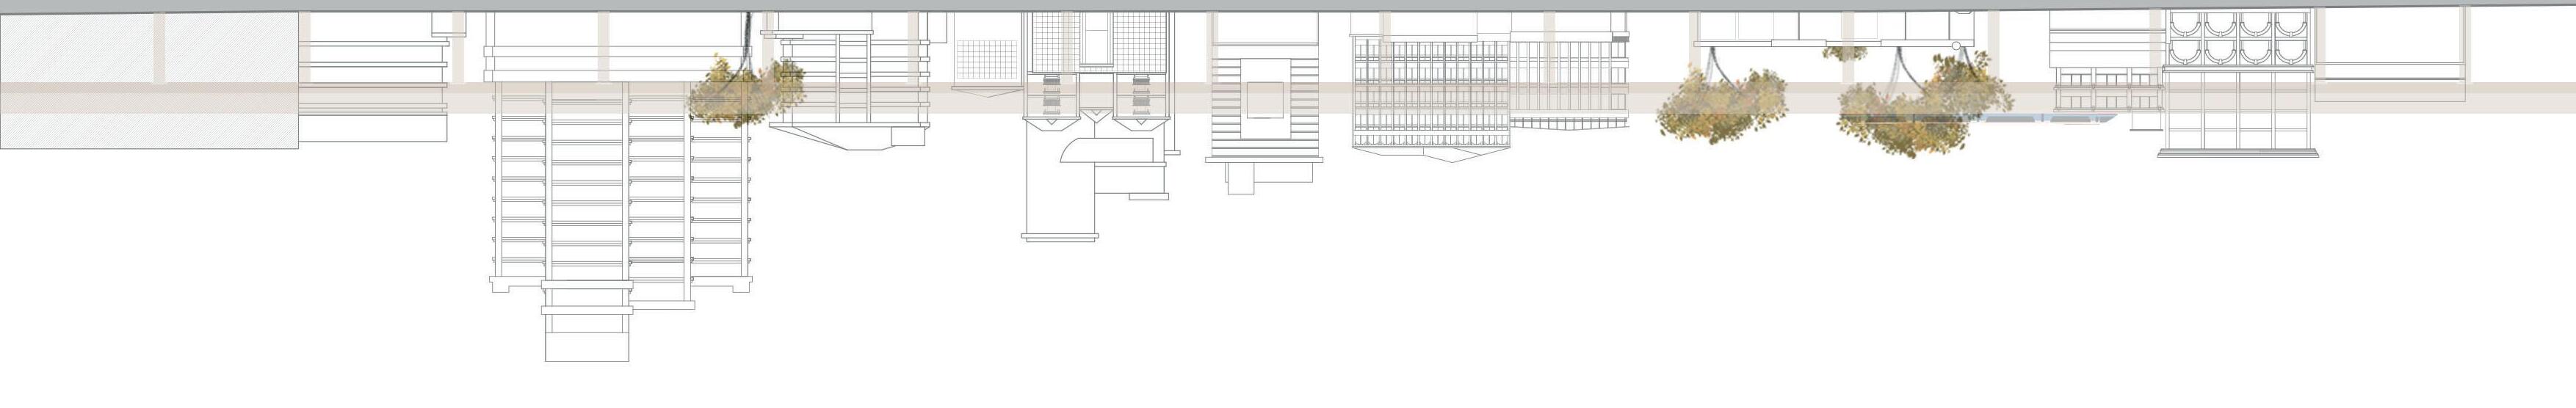
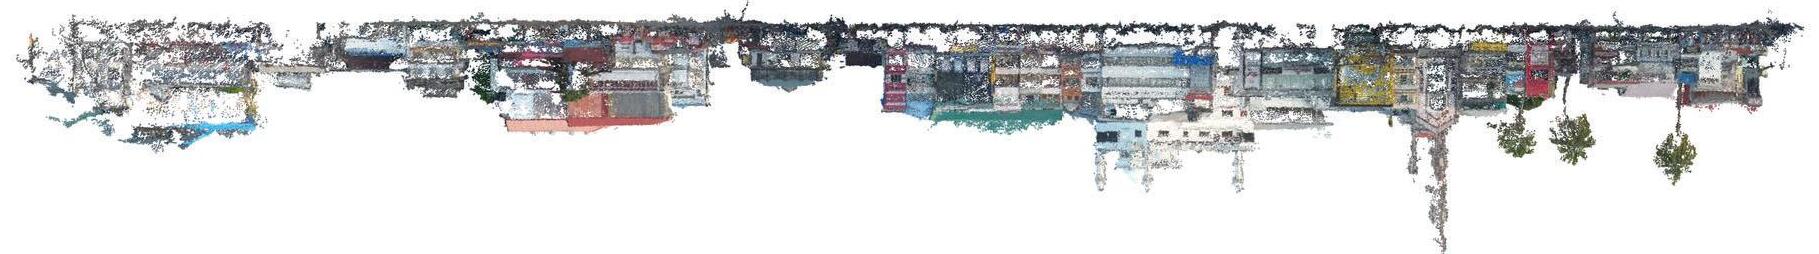
Fig.2.36. Drawings and 3D scans of street (based on Mapillary n.d. and Google n.d.)
Fig.2.37. Drawings and 3D scans of street (cited from Liveable Urbanism 2020-2021 2021)
MARINE
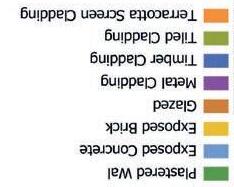
BUILDING MATERIALS
Main materials are plastered wall which can be seen painted in different colours. More varied types of materials can be found in Ernakulam compared to Fort Kochi - exposed concrete, and metal cladding are popular choices. Shopfronts on the ground level are often glazed. There is a relationship between the three main arterial roads as they are the major commercial roads across Ernakulam. Quality of spaces appear different between major roads and narrower streets - Broadway in between
M.G Road and Marine Drive - due to the presence of informal economic activities. Marine Drive appears better maintained due to it’s upper class target. The architecture combines European influences with local vernacular elements: white-washed walls, clay tile roofs, or flat roofs for residential towers. Generally, the high rise buildings build more recently don’t seem to follow any strict urbanistic guidelines in terms of façade treatment and style.
Banerji Road - connecting M.G Road to the downtown areas
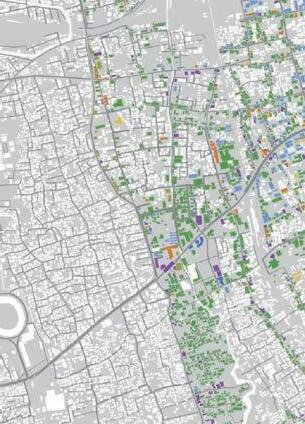
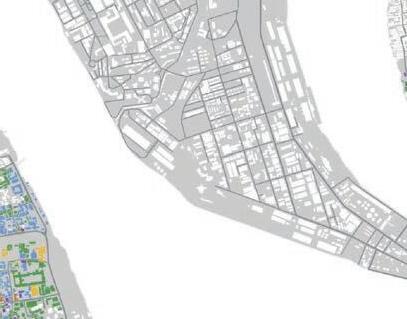
Fig.2.40. Focused areas with building materials identified.
Mahatma Gandhi Road (M.G Road)main arterial road of the city
S.A Road - second main arterial road of the city, and a more industrial aspect
Fig.2.41. Building materials identified.
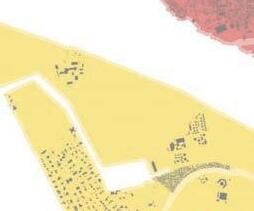
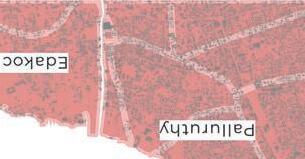
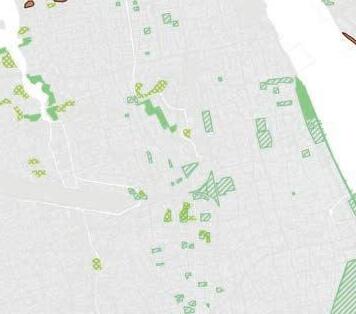
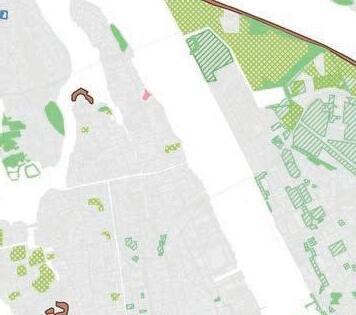
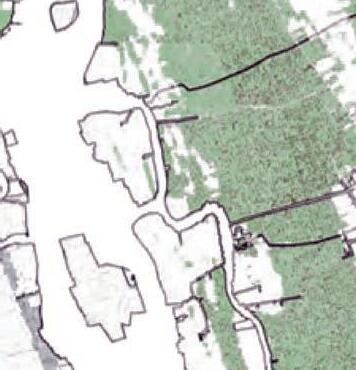
BIODIVERSITY
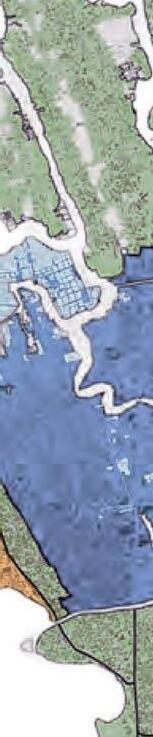
Kochi’s location makes it a natural harbour with the city spanning the backwaters, covering the northern end of a peninsula, several islands and a portion of the mainland (Sen 2020). An ecologically sensitive area, the Mangalavanam Bird Sanctuary is located in the heart of the city. It has a wide range of mangrove species (Sen 2020) and is a nesting area for several migratory birds and a roosting spot for large colonies of the Indian Flying Fox (Eol.org n.d.).
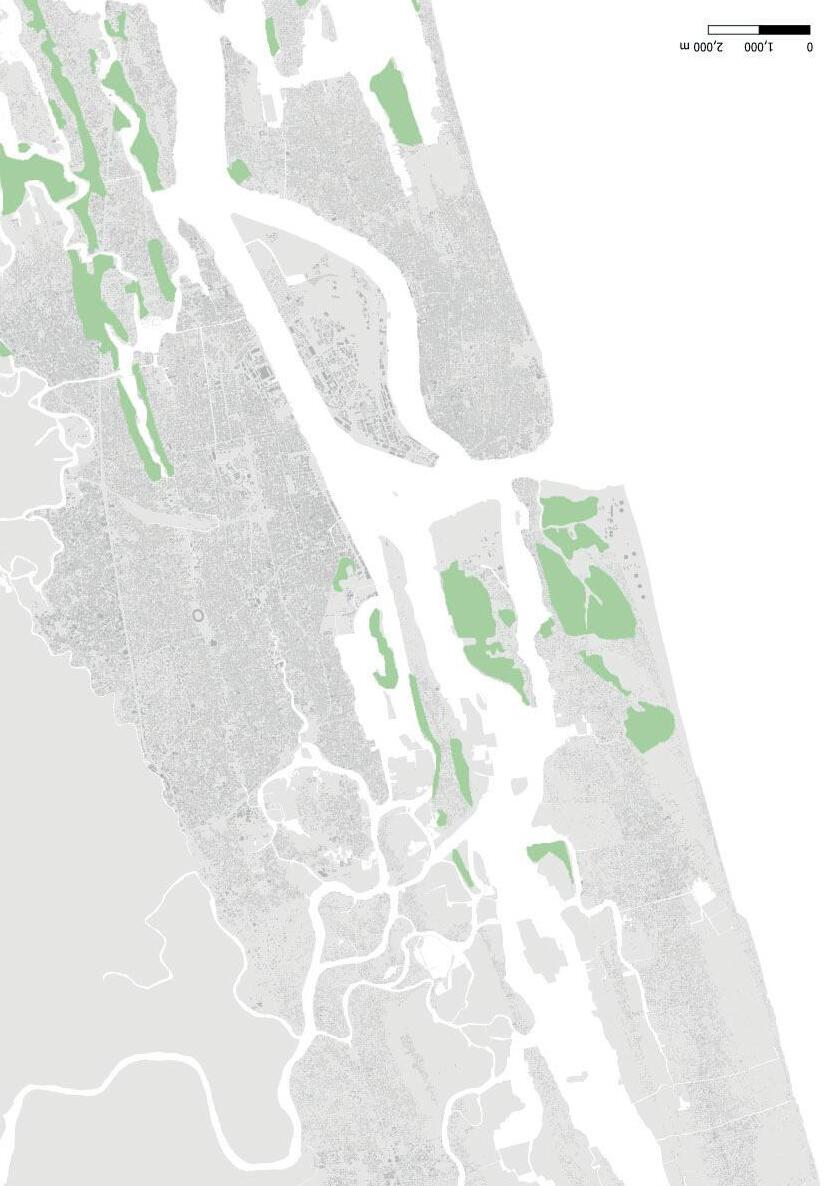
LAND USE AND VEGETATION
Approximately half the areas of Open Green Spaces, Open Ground and Sparse Vegetation land classes have trees, and therefore only 50% of their areas have been considered. Therefore the total tree cover in the city of Kochi is 6.65 sq. km and the total terrestrial area of the city is 78.31 sq. km (Sen 2020).
Coconut Cultivation, 38 ha50% Open ground. 11 ha
Mangrove, 119 ha50% Sparse Vegetation, 106 ha
Mixed Cultivation, 234 ha Tree Patch. 199 ha
50% Open Green space, 34 ha Tree Cover, 665 ha total
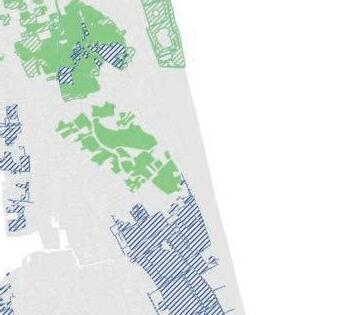
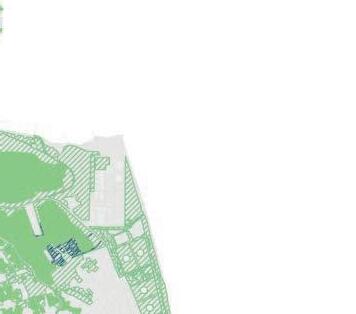
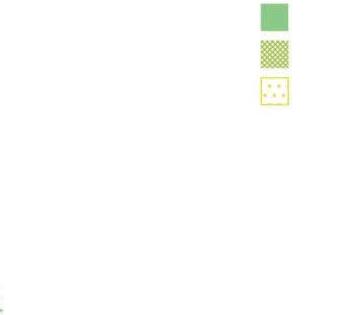
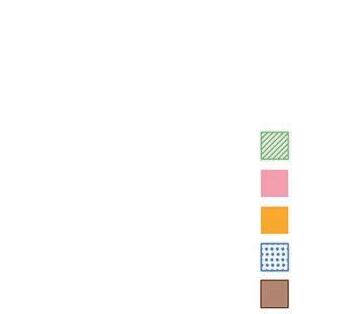
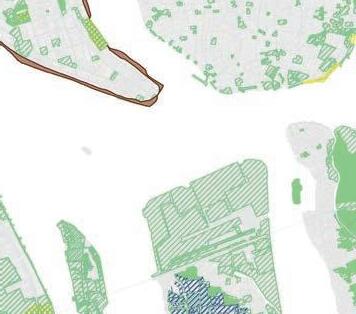
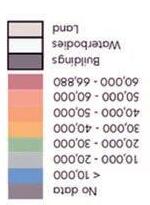
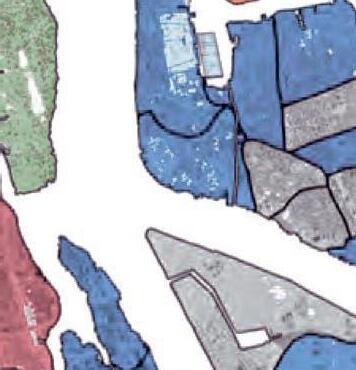
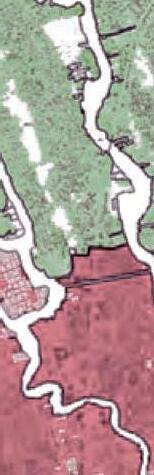
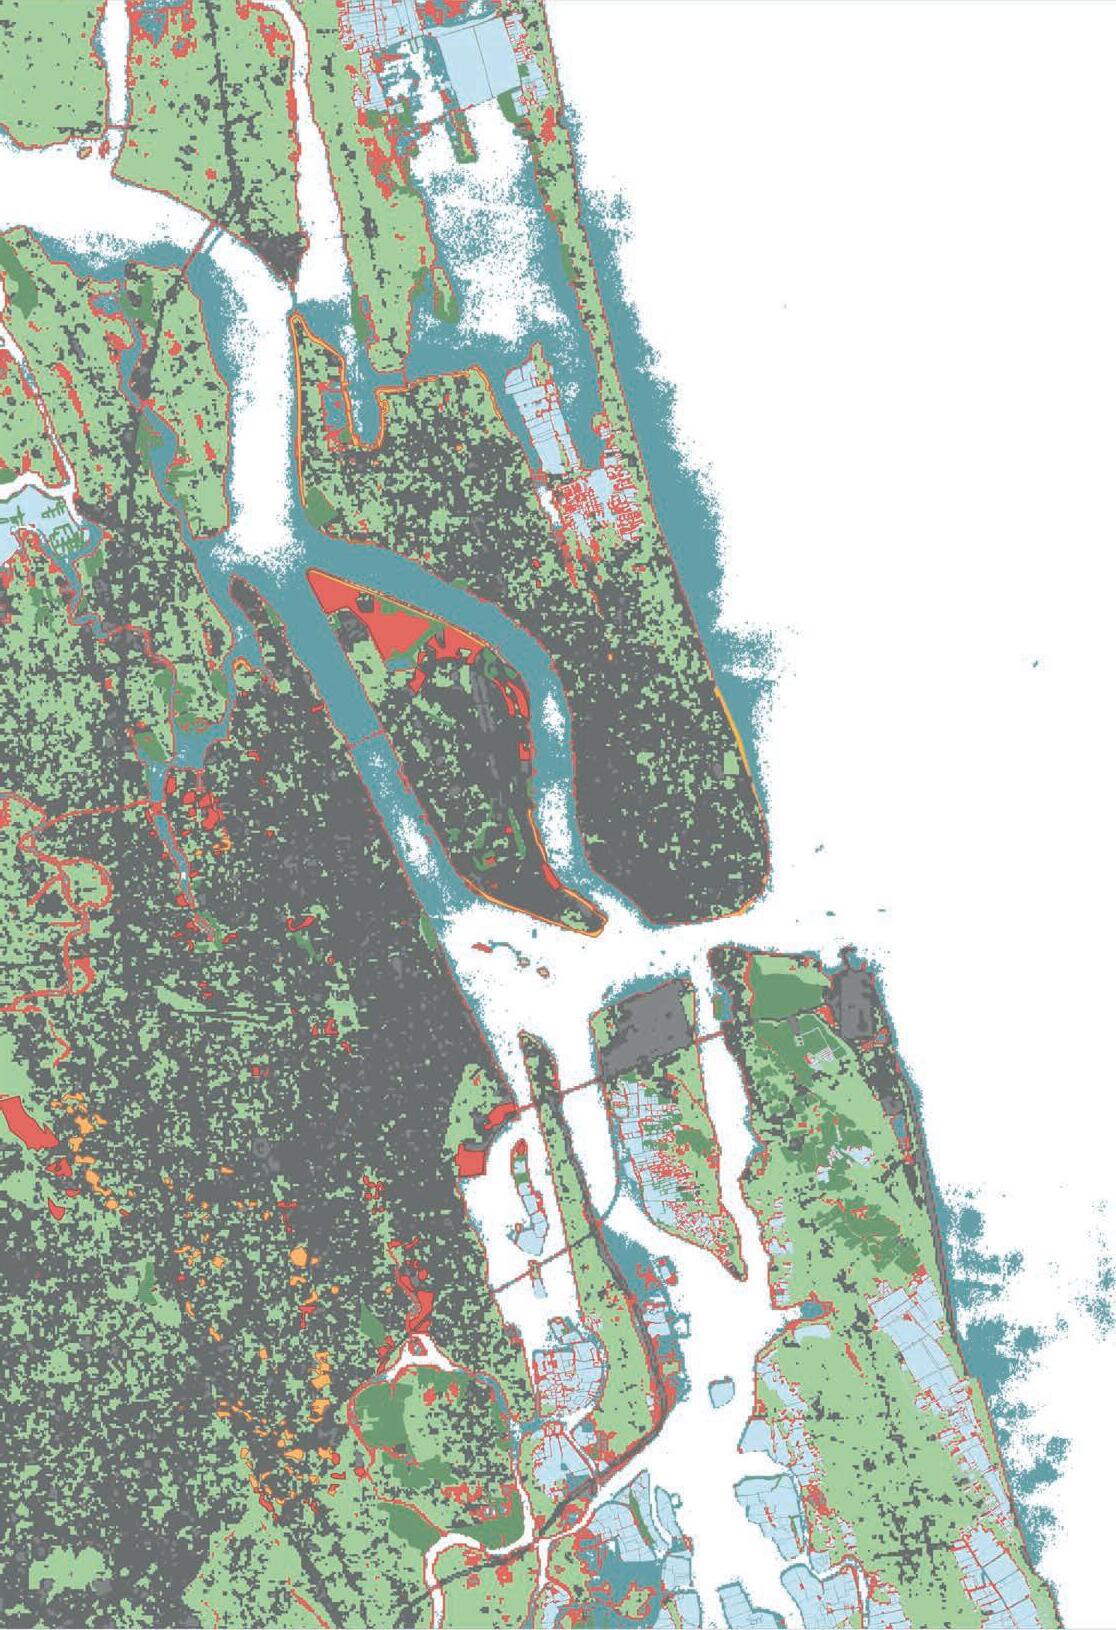
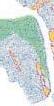
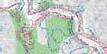
HABITAT CLASSIFICATION MAP
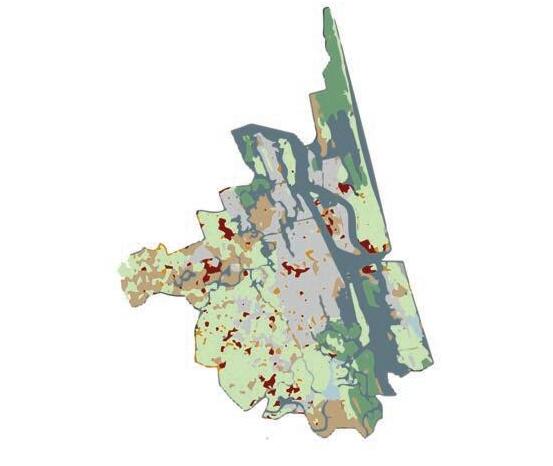
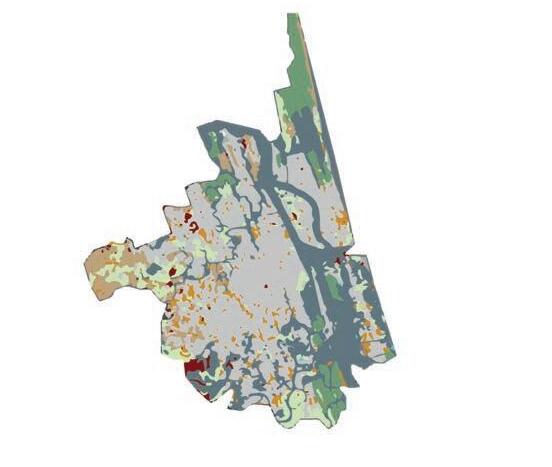
The coastal region, Vembanad backwaters, estuary, mangroves, wetlands, fresh water ponds, Pokkali paddy fields, other mixed cultivation, home gardens and public open spaces are the major biodiversity habitats of Kochi city (Sen 2020).
Inland Fish Culture
Open Green Spaces
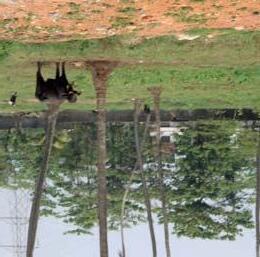
Fig.2.45. Bird spotted between mangroves in Nettoor (photograph by author)
Fig.2.47. Proportions between habitat types (Sen 2020).
Fig.2.46. Proportions between available land and tree cover (Sen 2020).
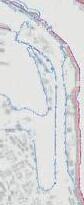
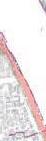
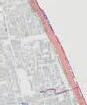
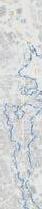
Fig.2.48. GIS map showing habitats of Kochi (based on Sen 2020).
Beach
Marsh
Mangrove
Fallow
Pond
Prawn Culture
Aquaculture
The India Koppen Classification records Kochi in the Monsoon Climate along the Western Coast. With proximity to tropical and humid subtropical environments (Britannica n.d.).
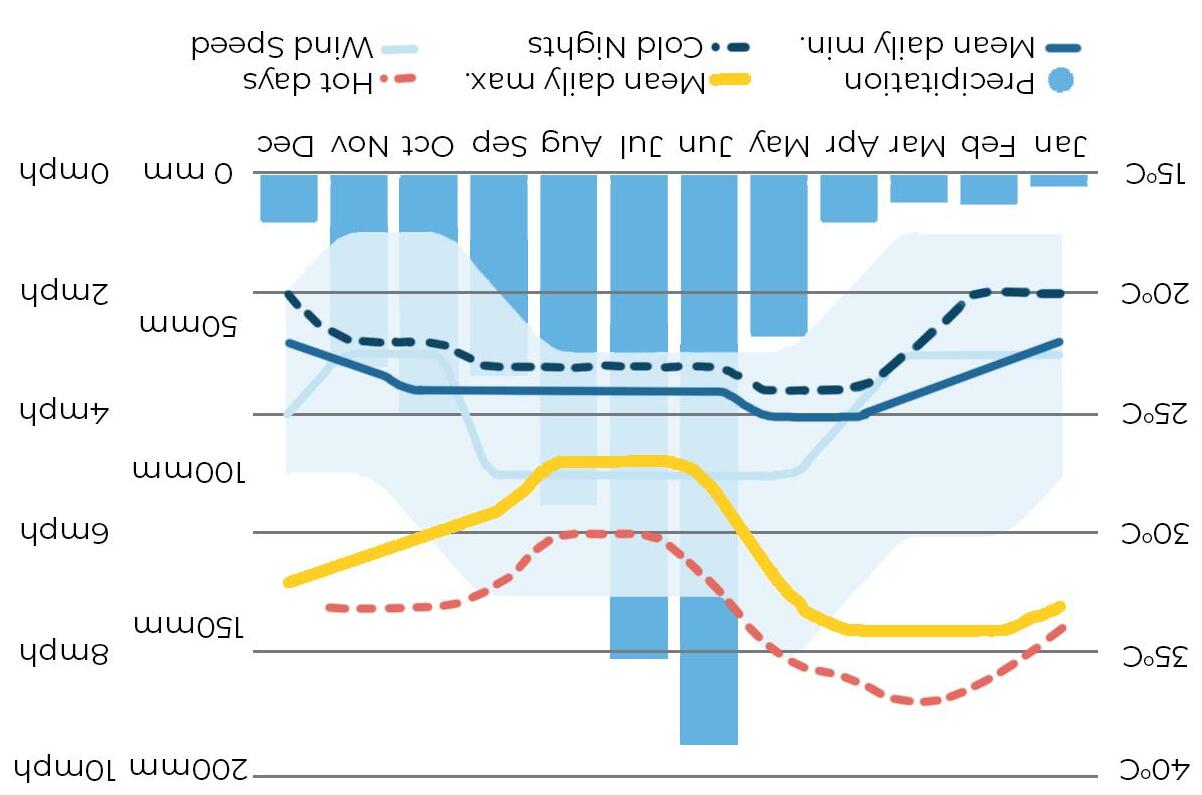
Precipitation Amounts
Due to its proximity to the equator and coastal location there is little seasonal change in temperature. Temperatures stay on average between 23 and 33 °C. The warmest month of the year is typically March and the coldest January. However these months are also the most varied in temperature with the largest range. (World Weather & Climate Information n.d.).
The abundance of water around Kochi with its intricate layout of canals makes for a humid environment, which favours breeding of mosquitoes. The canals and coast also create channels for cool breezes, particularly noticed in the afternoons from September to February. The windiest month in the city is May with average wind speed of 5.5mph (Meteoblue n.d.).
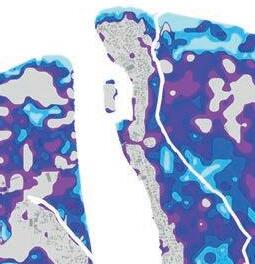
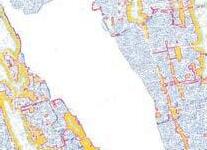
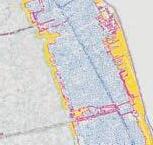
Climate change is expected to affect the city causing higher temperatures, while monsoons and winds have already become more severe each year. Moreover, the canal networks are susceptible to sea level rise which could affect many along its banks, including some fragile ecosystems (Mishra 2021).
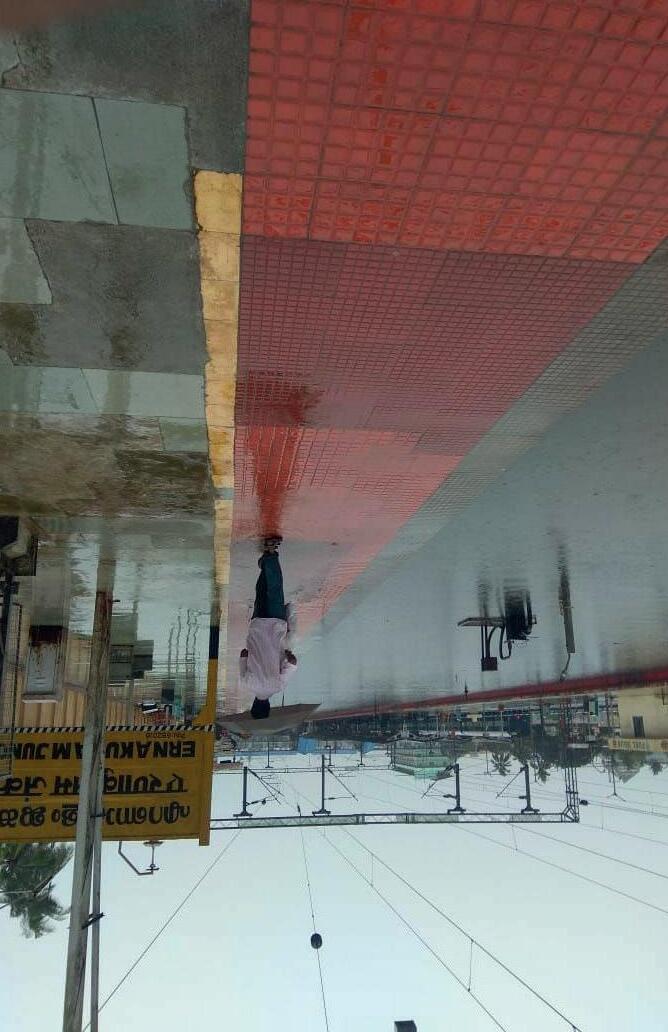
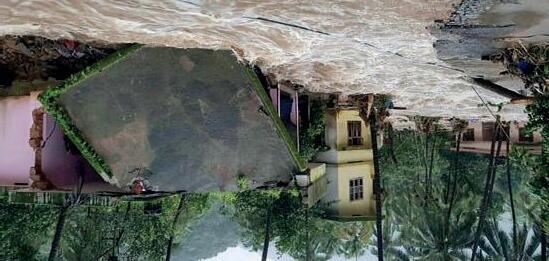
The biggest weather event Kochi faces is rain. The tropical climate creates a monsoon season with rain expected from May to December. Its location on the windward side of the Western Ghats brings heavy rains with little protection between June to September, called the South-West monsoon. Whilst October to December brings the North-East monsoon (typically lighter rain). Similarly the reservoirs to the East of the city in the Ghats fill up during the monsoon season, which has lead to widespread flooding of the area (Meteoblue n.d.).
Directions
India Koppen Classification
Monsoon Climate (Am)
Tropical savanna climate (Aw)
Warm desert climate (BWh)
Warm semi-arid climate (BSh)
Cold Desert climate (BWk)
Humid subtropical climate (Cwa)
Subtropical oceanic highland (Cwb)
Mediterranean continental (Dsb)
Warm Mediterranean climate (Csa)
Cold Semi-arid climate (BSk)
Fig.2.55. Precipitation table (based on Liveable Urbanism 2020-2021 2021)
Fig.2.56. Wind directions table (based on Liveable Urbanism 2020-2021 2021)
Fig.2.54. Ernakulam Junction Station Flooded during monsoon (Staff 2018)
Fig.2.57. Wind speed table (based on Liveable Urbanism 2020-2021 2021)
Fig.2.58. Precipitation table (based on Meteoblue n.d.)
Fig.2.59. Koppen classification of India (based on Liveable Urbanism 2020-2021 2021).
Development
03 METHODOL- OGY
The objective of this research is to prove the level of liveability in Kochi. The preliminary study provides a contextual introduction to the challenges of Kochi and its current level of liveability. This study informs the objectives of the research and sets out the research aims. To ensure the research supports the strategic aims set out, we subdivided into specific research groups, targeted at providing a rich understanding of the challenges and issues that affect liveability in different aspects of the city. From here we underwent specific analytical research studies, using quantitative and qualitative research methods.
CHAPTER LEADS: CHELSEA WONG & ANA-MARIA ARHIRE
Theoretical Framework
Assess liveability degree against the literature on liveable cities
Questions
Develop a preliminary methodology to test the theoretical data base gathered before the trip and engage with the city
Further develop the chosen methodology based on feedback from the seven days
GROUNDING WORKSHOPS
BRAINSTORMING
During the initial stages of the primer phase of the unit, Miro an online platform was used for brainstorming and mapping ideas and theories from our initial literature review and research into Kochi. The online platform allowed us to translate our ideas into a digital data base that was easily accessible by everyone at anytime. Brainstorming as a unit not only encouraged open and ongoing collaboration between one another but helped us generate a large number of ideas within a quick session. These initial ideas would later be easily refined and translated into more structural ideas.
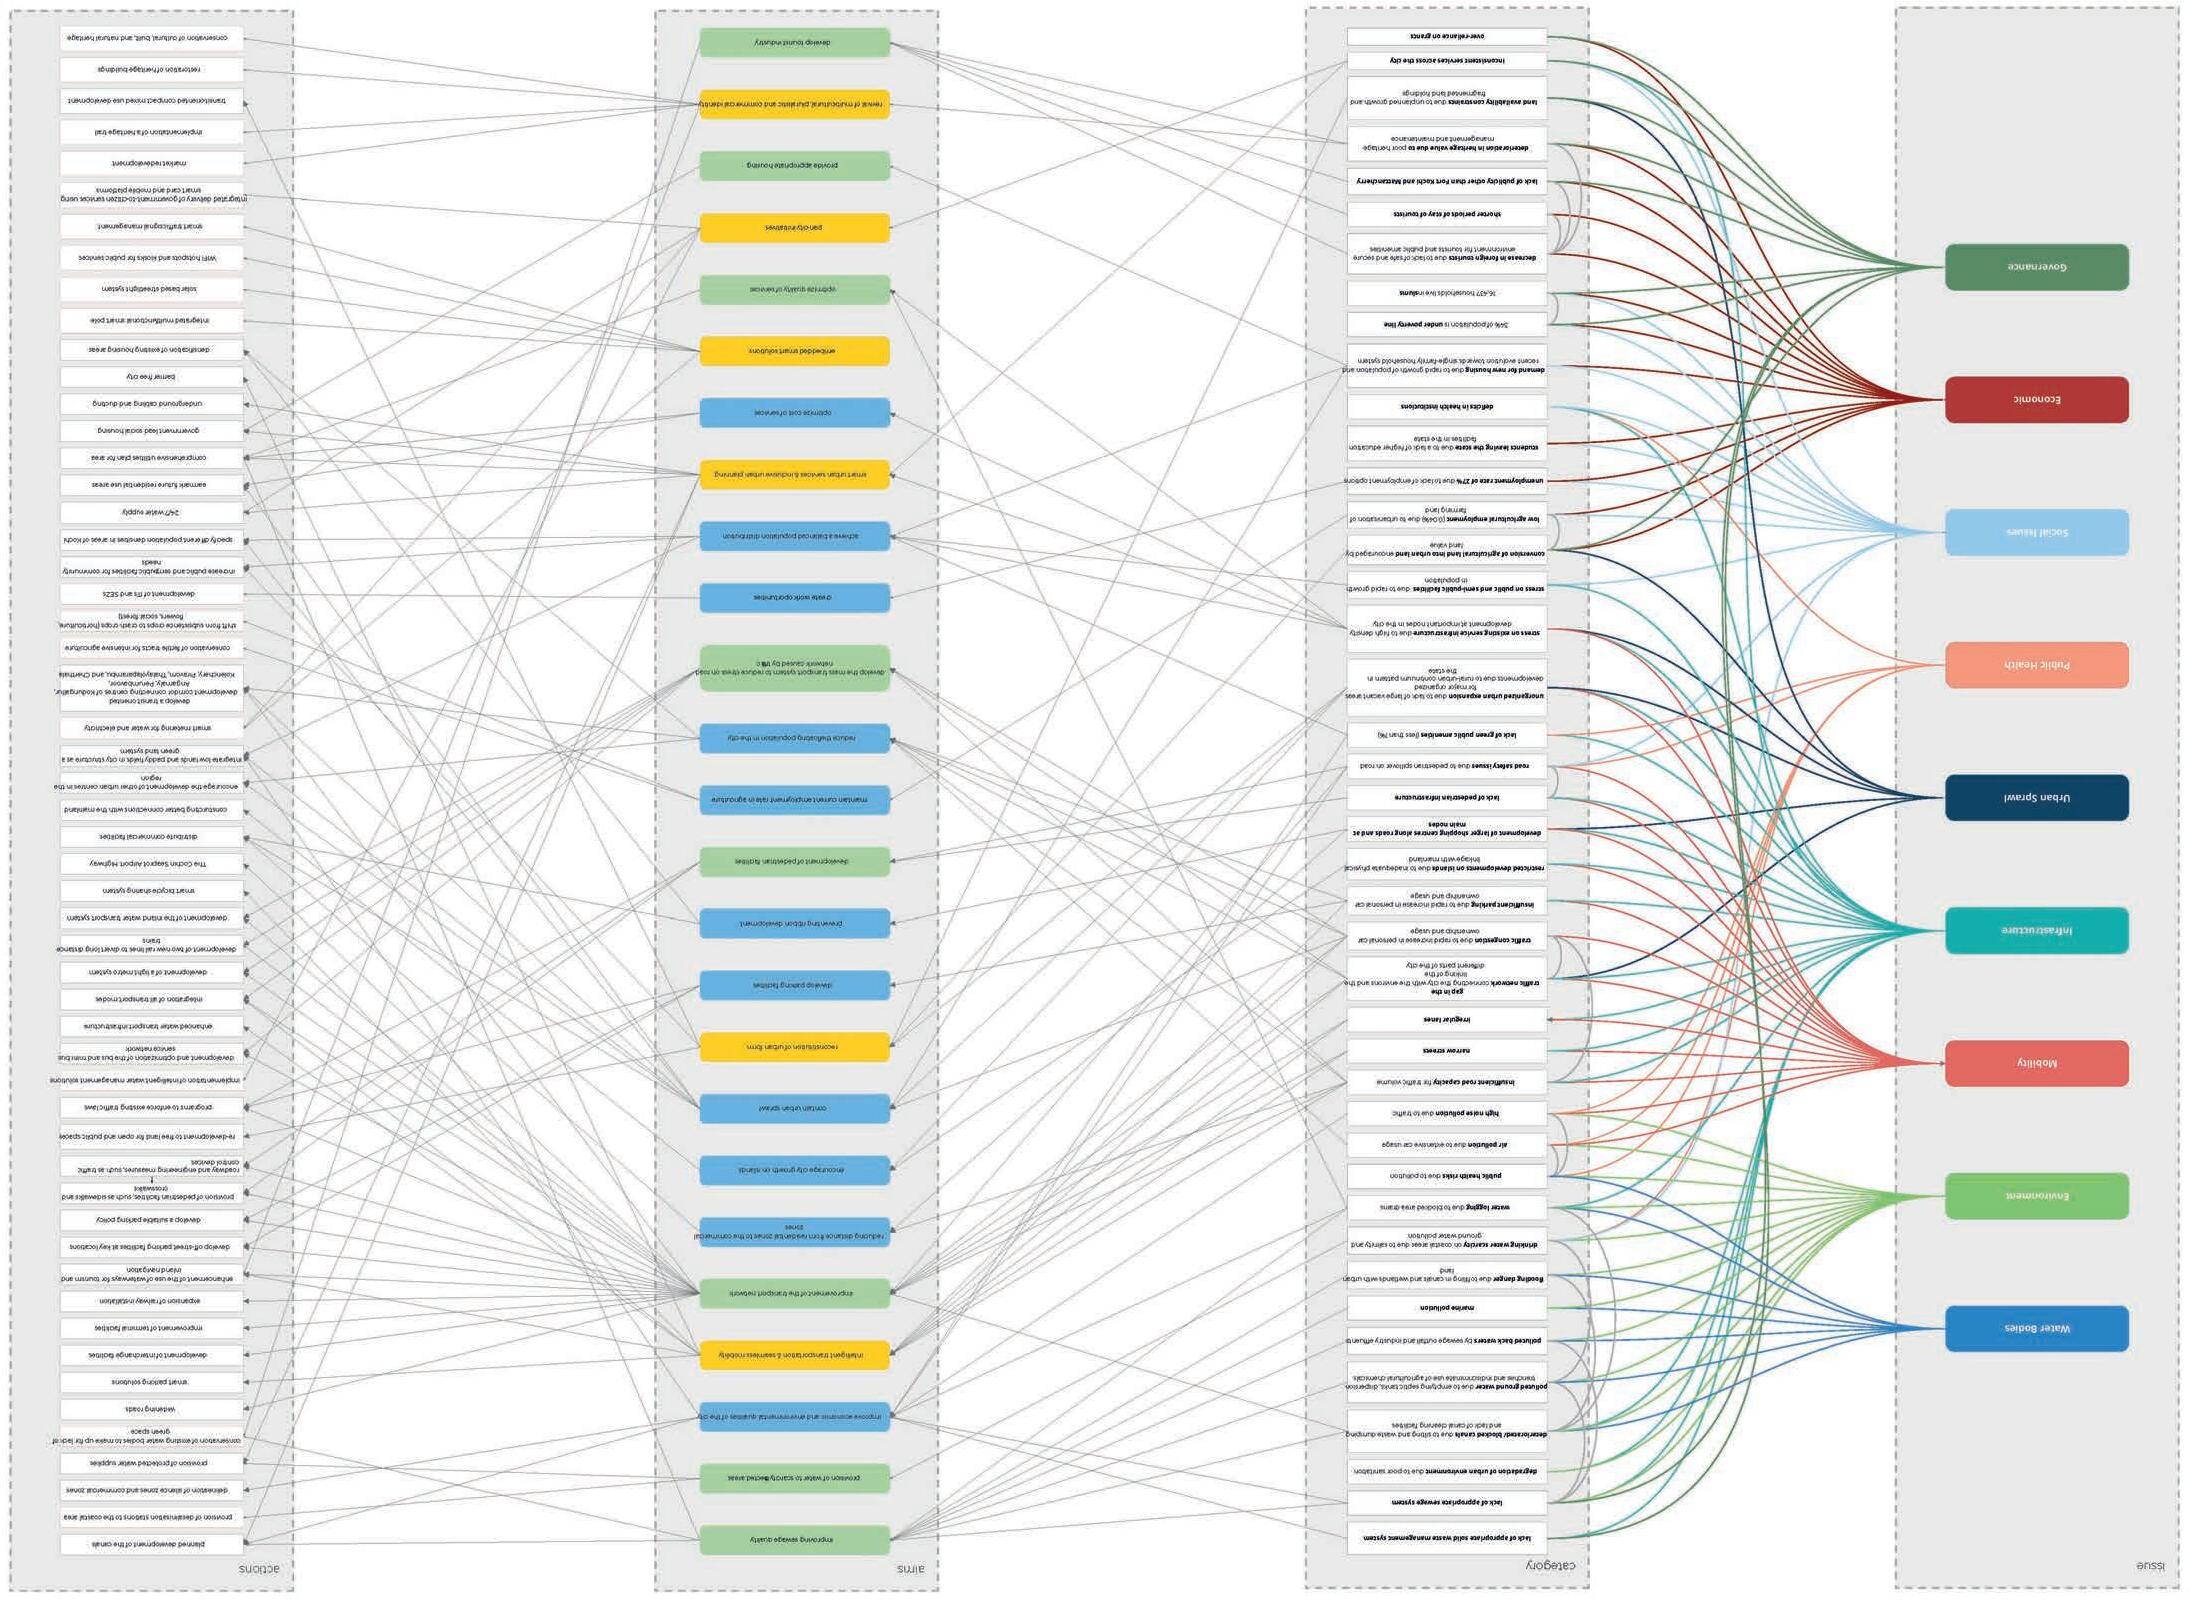
Mind maps to understand the connections between identified issues, potential solutions/goals and the actions that are needed to achieve them were mapped out. Different colours were used to categorise the data, this allows for links between certain aspects to be easily identified but also highlights the complexity of the issues. An exercise that maps out issues or interest with methods of collecting data was also carried out this helped further develop the methodology for our research.
The objective of this research is to prove the level of liveability in Kochi. This was determined through an analysis of data and tested against an understanding of liveability pre-established in the literature review. An initial urban strategy based around eight key aims has been outlined to increase liveability in Kochi. These aims are as follows:
• To promote active travel
• To promote an equitable city
• To prevent/reduce urban sprawl
• To promote living with nature
• To nurture an active lifestyle
• To promote Cultural identity
• Promote resilience to climate change
• Promoting Economic resilience
Kochi is a test-bed for the purpose of the thesis. Emerging projects aspire to global relevance.
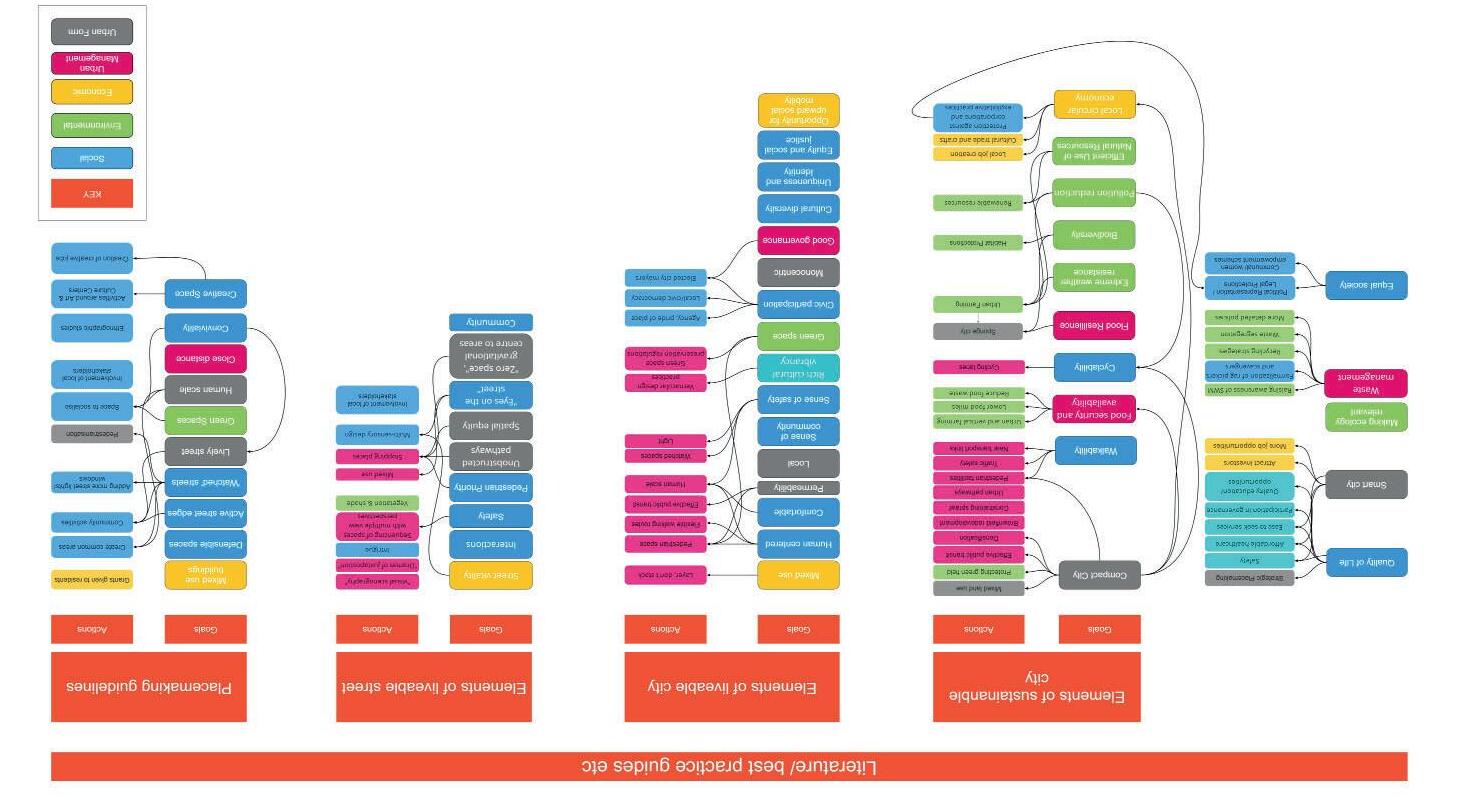
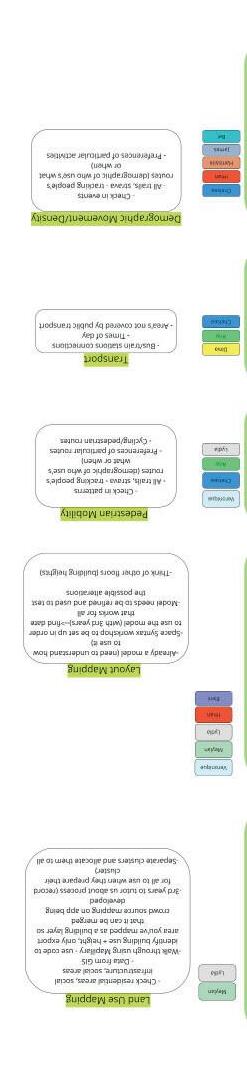
Fig.3.2. Concluding diagram of LU BSc students condensing theories of urban practice.
Fig.3.3. Concluding diagram of LU BSc students defining agents, indicators and strategies of reading layers of the city.
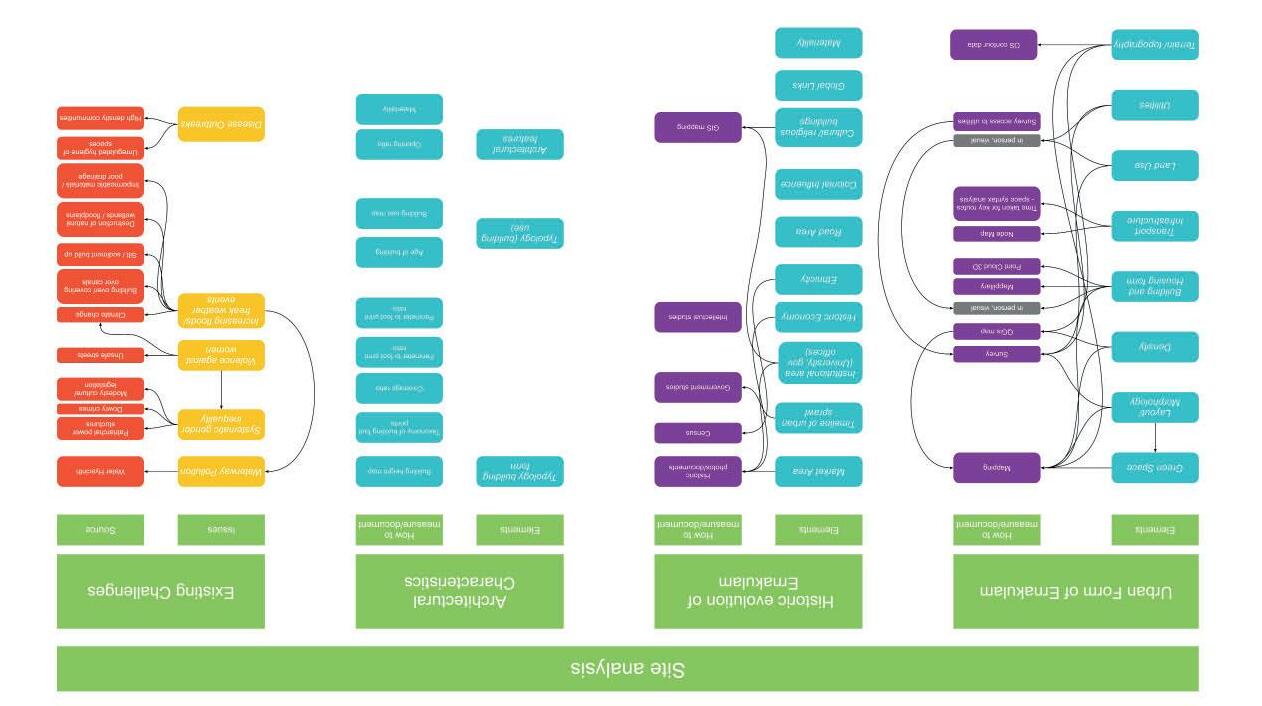
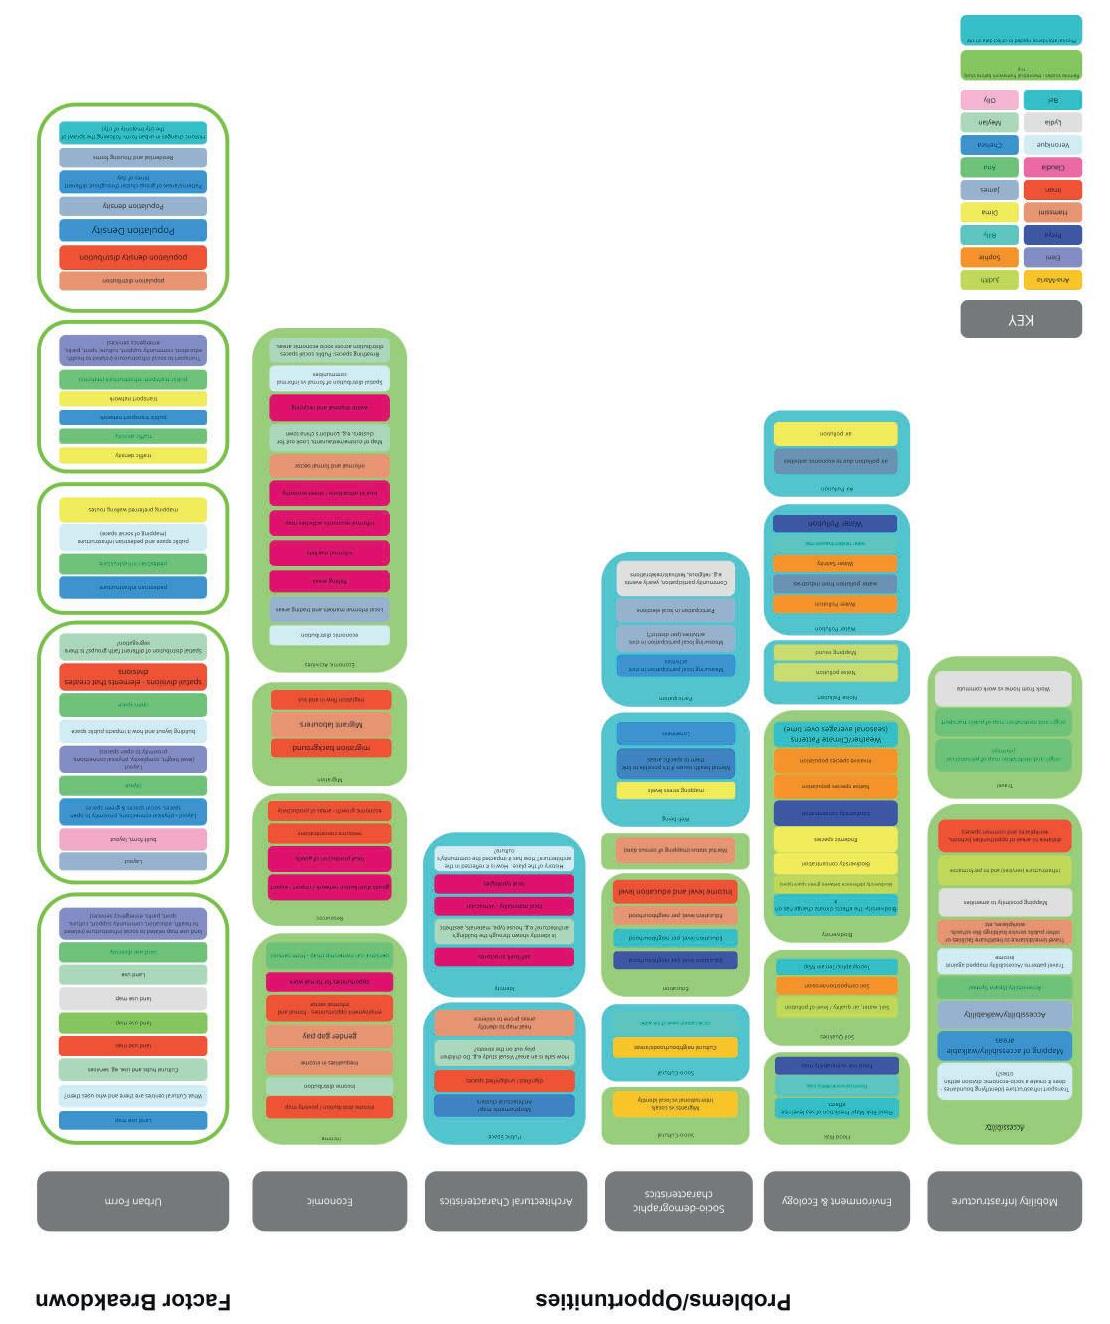
Fig.3.4. Concluding diagram of LU MArch students defining issues, challenges, opportunities, areas of intervention.
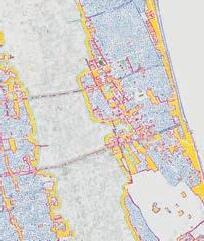
GIS MAPPING
One of the largest challenges to overcome was the serious lack of digital data specifically in CAD based mapping around Kochi and Kerala as a whole. As this is a fundamental necessity of any architectural project, it was vital that we created our own digital map.
The digital map was created on a software called QGIS which is an open source Geographic information system (GIS) platform. GIS is a computer-based tool that blends the function of a map and the function of a database which allows us to create, manage and analyse information. It integrates a variety of types of data by analysing spatial location through maps and 3D scenes. Through the combination of geography and data, we are able to have a better understanding of data such as patterns, relationships and situation of an area.
PREVIOUS QGIS MAPPING
The Liveable Urbanism 2020/21 unit worked collectively with the students at the SCMS to produce a city-wide GIS map that could be used as the base map for further urban research. The base map was made up of multiple layers of each type of urban element which are drawn as either polygons or lines. They are drawn over a Google satellite image as accurately as possible. The base map included:
- Buildings
- Road surfaces
- Road centre lines
- Plots
- Railways
- Waterways
- Water bodies
- Water boundaries
- Land edge
MAPPING NEW DATA
This year, as a unit we worked to improve the existing map that was created by the Liveable Urbanism 2020/21 unit. This process included identifying sources of datasets that was related to the different research questions we had and mapping them on the QGIS. This allowed us to present the data in different formats such as categories, graduated or rule based etc. This showed patterns or trends within the city for further analysis.
Through other sources of information such as Mapillary, Google Maps typical traffic data, Global Biodiversity Information Facility, etc. we were able to map out other data such as:
- Building use & occupancy
- Building heights (based on number of floors)
- Facade material
- Open spaces
- Pedestrian infrastructure & condition
- Gatedness
- Traffic data & vehicular density
- Noise, air, water & soil pollution
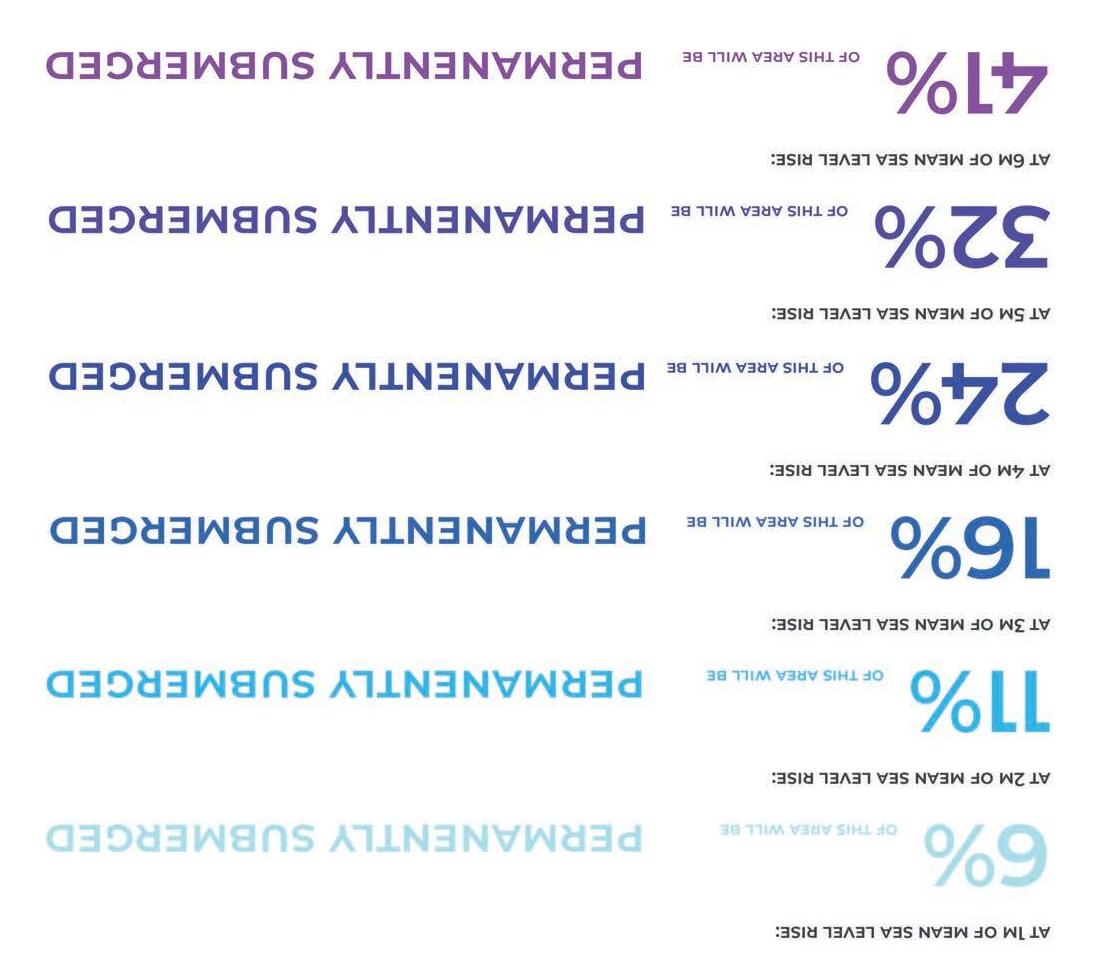
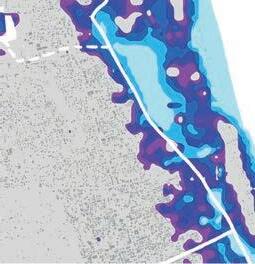
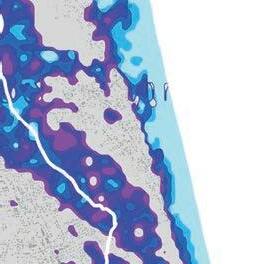
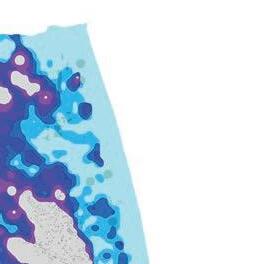
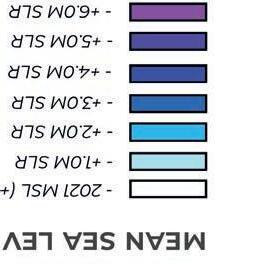
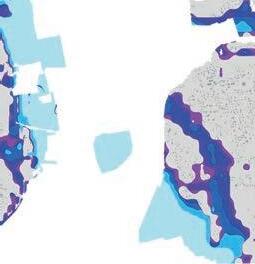
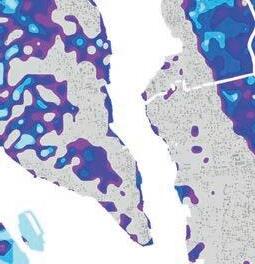
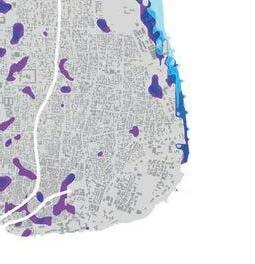
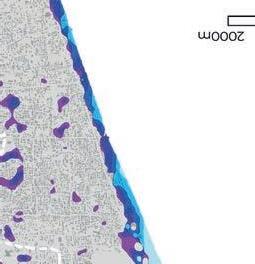
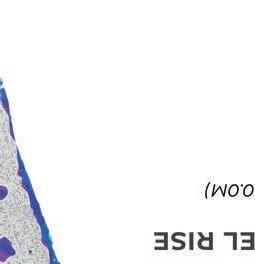
- Sea-level rise
- Mangrove affected areas
- Bird species richness
- Waste dumping & location of public bins
- Drainage
- Availability of drinking water
- Closing times
- Street food vendor
ORGANISING 01 MAPPING PROCESS
Slightly different process may have been adapted for different maps depending on complexity of data. The following is an example of the process of mapping with Mapillary Data, which is a service for sharing crowd sourced geotagged street-level imagery. Through the images that were avaialable, we were able to identify urban elements of each building which included:
DATA ENTRY 02
- Building use
- Building heights (based on number of floors)
- Occupancy
- Facade material
- Open spaces
- Pedestrian infrastructure
- Pedestrian condition
- Gatedness
01 - ORGANISING
The map was split into a number of plots, where each person was then assigned a plot to map to input data for. A key was created for different elements such as codes for different categories of land uses. This allowed for ease of documenting the data, this also ensured that data documented was coherent.
02 - DATA ENTRY
Images from Mapillary was analysed in terms of land use, building heights, construction material etc. and this was then documented for each individual building or street. The mapping exercise was dependent on the availability of Mapillary data which has resulted in some areas being unmapped.
03 - DATA ANALYSIS
Through the mapping exercise, patters or trends within the city were identified. For example, through the data mapped for sidewalk conditions which included, number of pedestrian pavements per street, pavement width and pavement conditions, we were able to have a better understanding of the walking infrastructure available within different areas of the city which was linked to the walkability of the city.
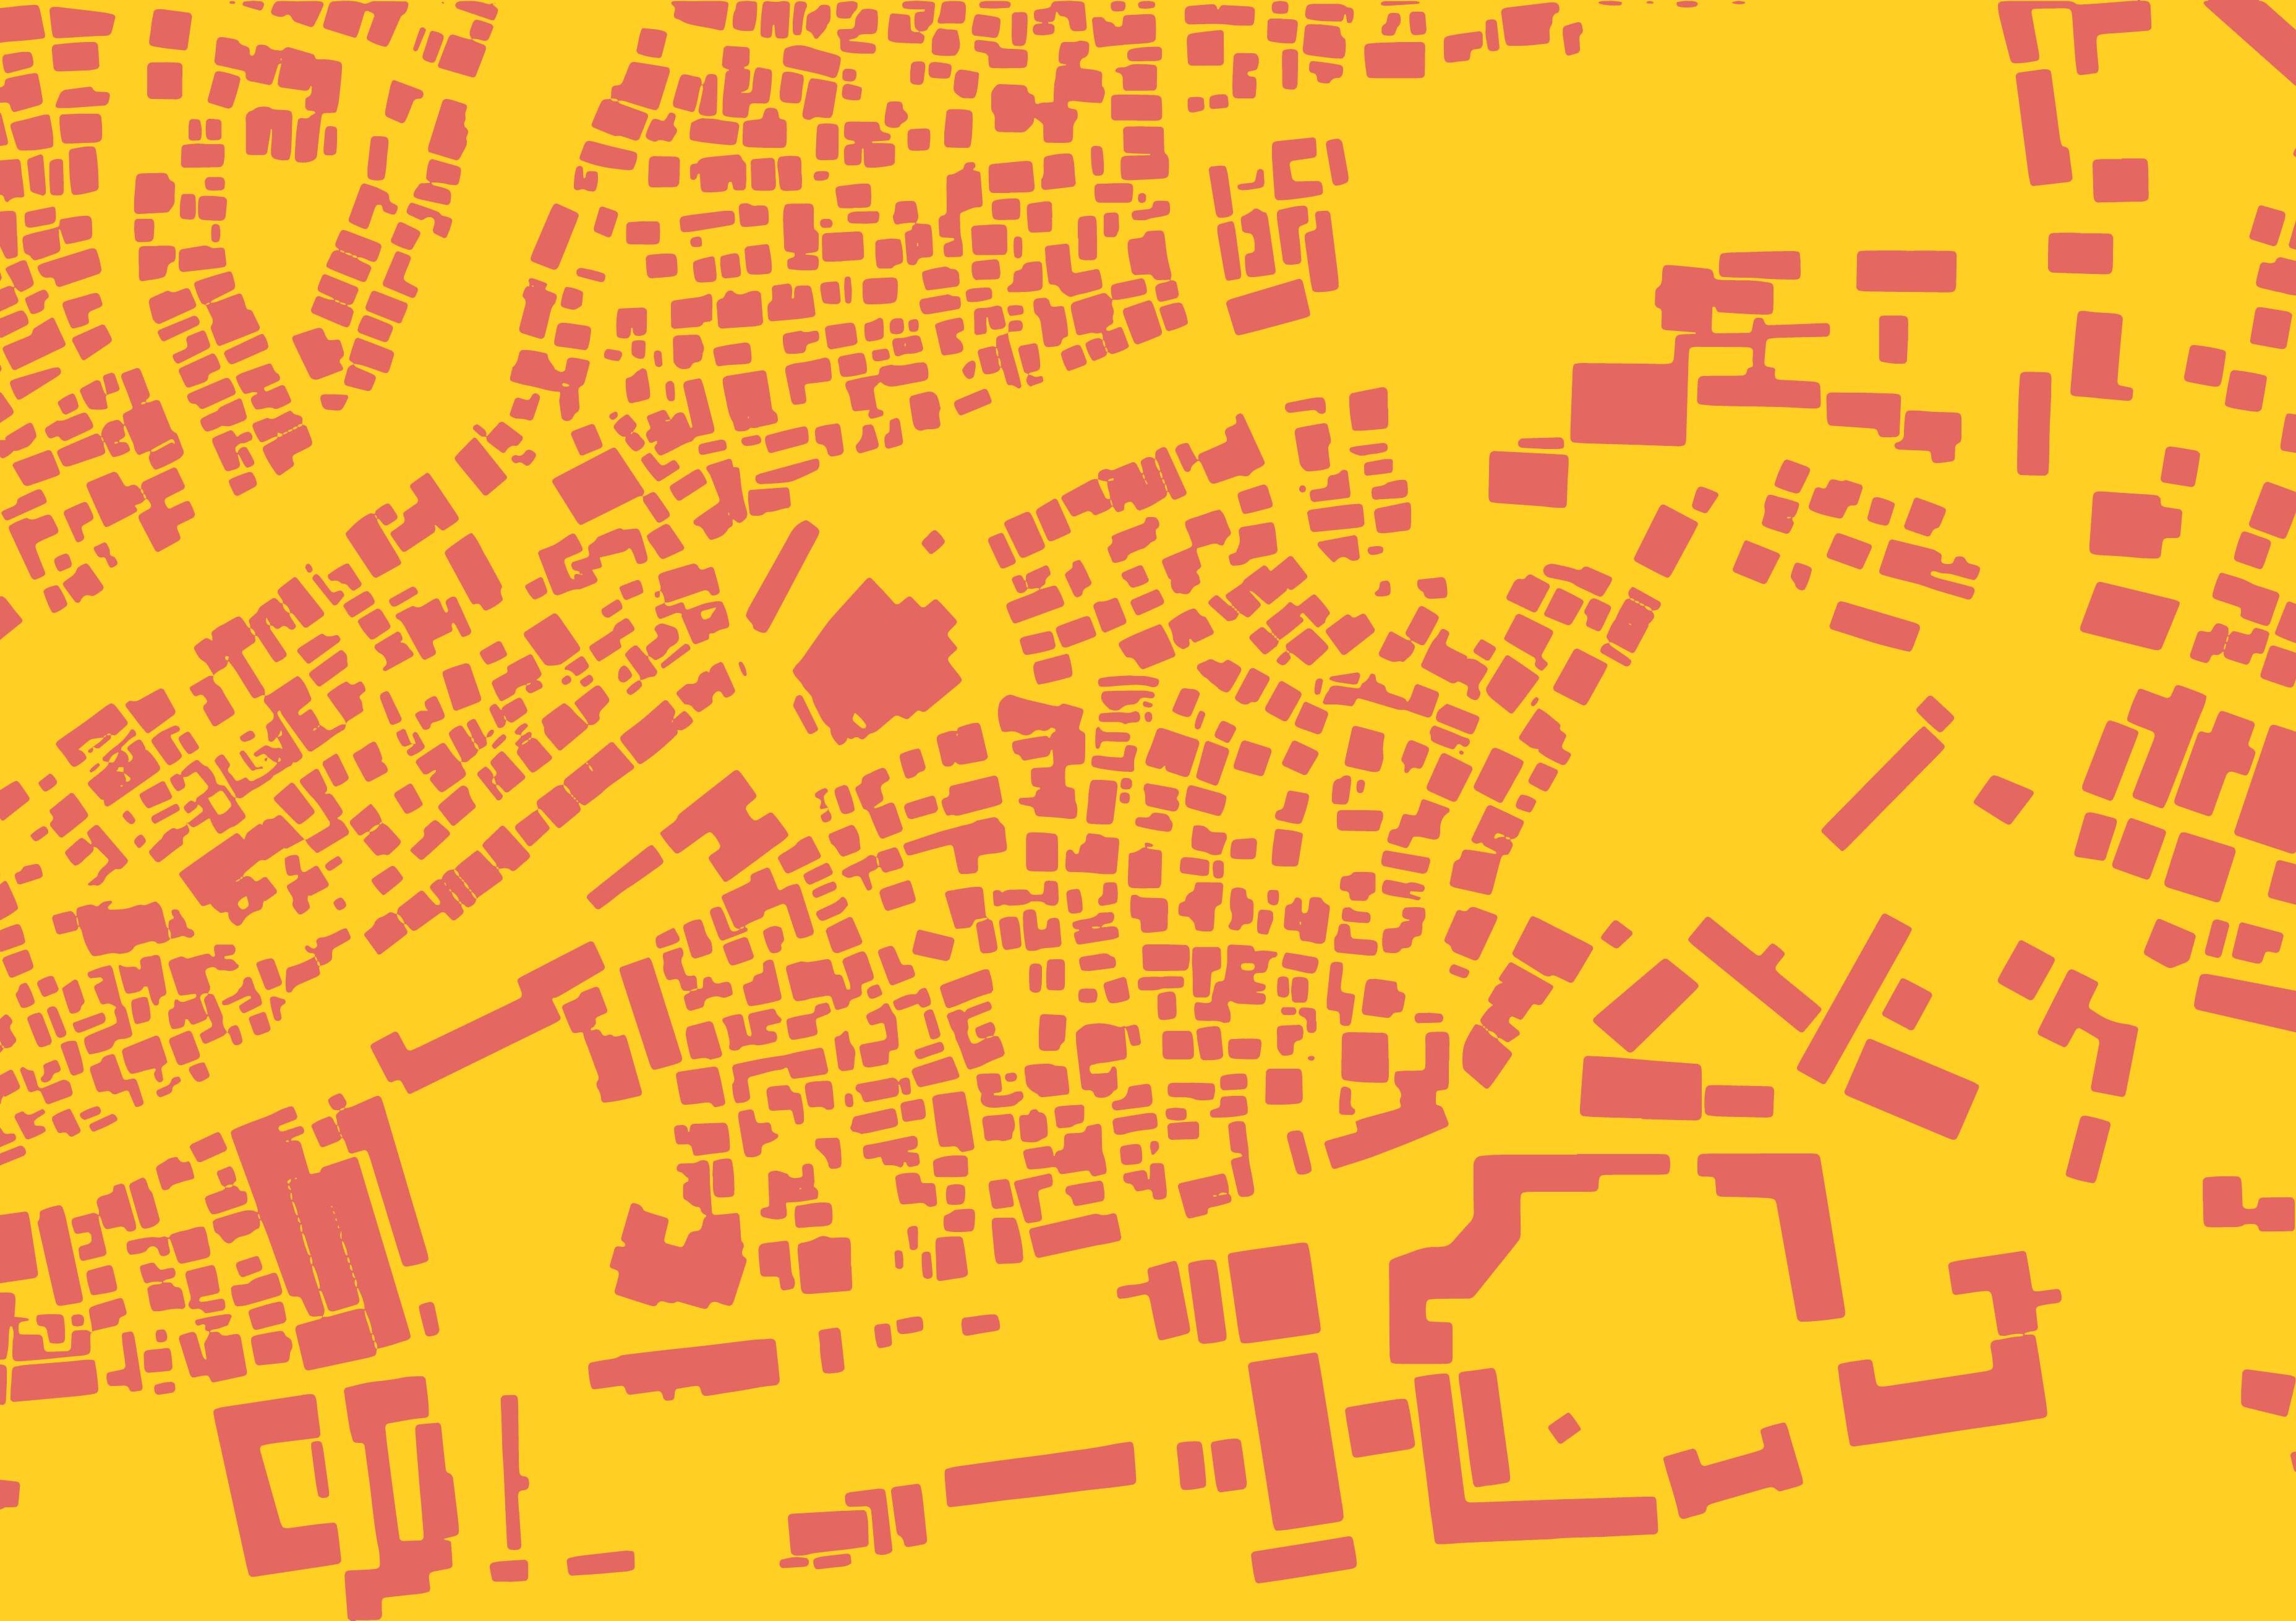
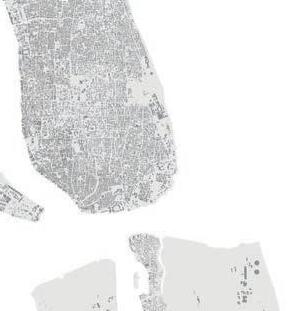
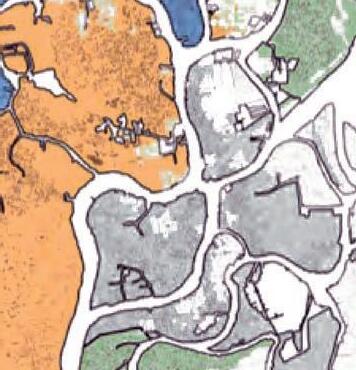
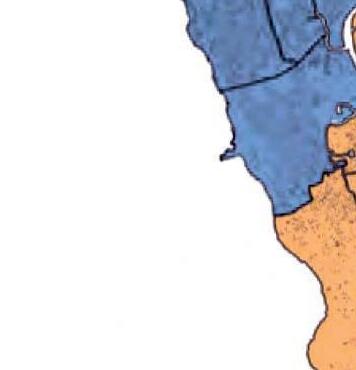
Fig.3.5. GIS base map of Kochi created by LU 2020/21.
SPACE SYNTAX
Space syntax was created by Bill Hillier and Julienne Hanson in 1984. It is a methematical model used to analuse network representations of space and human activity patterns in buildings and urban area (Overview Space Syntax n.d.).
In Space Syntax, spaces can be understood as voids such as streets, squares, rooms etc. These voids are defined by obstructions that might constrain access and or block views such as walls, furniture or fencecs etc (Al Sayed et al. n.d.).
For example, cities are made up of a combination of buildings that forms a network of spaces flowing in-between them. This network connects a series of street spaces that creates a discrete structure. The structure is the optimum result of shortest paths from all origins to all destinations in the spatial system, this relates to a pattern of connections (Al Sayed et al. n.d.).
On an urban scale, spatial structure can be uniform, deformed or organically shaped. The urban grid vary in the way they interweave connecting the path-whole structure. As they are of different scales, they would have different geometric properties (Al Sayed et al. n.d.).
Topological and geometric analysis of urban grids can be carried out using DepthmapX software that aids in the understanding of the structural configuration of the urban environment and its potentential impact on social behaviour and economic activity (Overview Space Syntax n.d.).
MAIN COMPONENTS
01 - REPRESENTATIONS OF SPACE
Spatial elements can be represented through their geometric forms and how people experience them. (Overview Space Syntax n.d.)
02 - ANALYSIS OF SPATIAL RELATIONS
Relationshops between spatial elements are formed based on their configuration. These relationships ar objectively analysed using various measures which inlcude integration and choice. These two measures reflect the two fundamental; selection of destination and selection of routes. Integration measures the access to spaces whilst choice measures the passing flow. (Overview Space Syntax n.d.)
03 - INTERPRETIVE MODELS
Spatial models can be developed to analyse, describe, explain or forecast various types of spatial and socio-economic phenomenas. These models can be used to investigate urban movement, urban crimme, accessibility of space etc. (Overview Space Syntax n.d.)
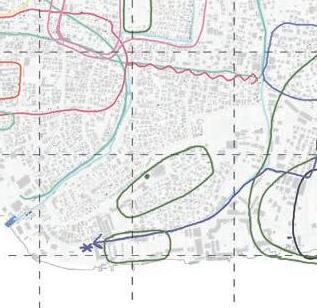
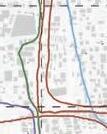
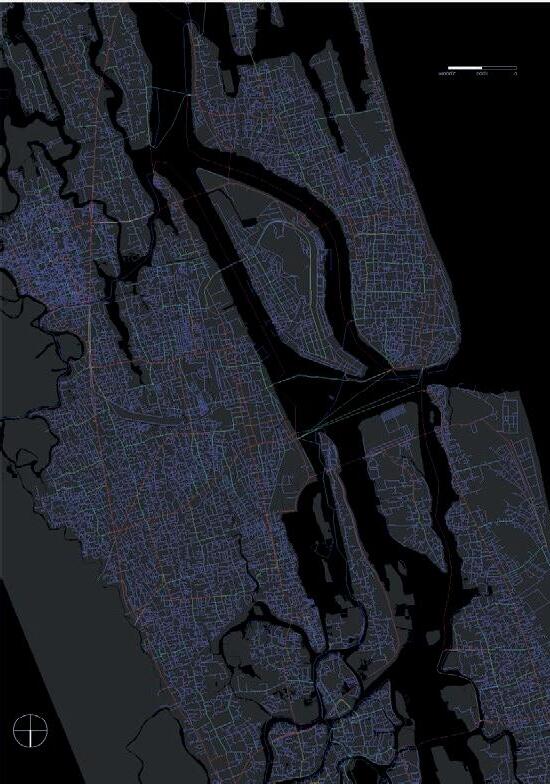
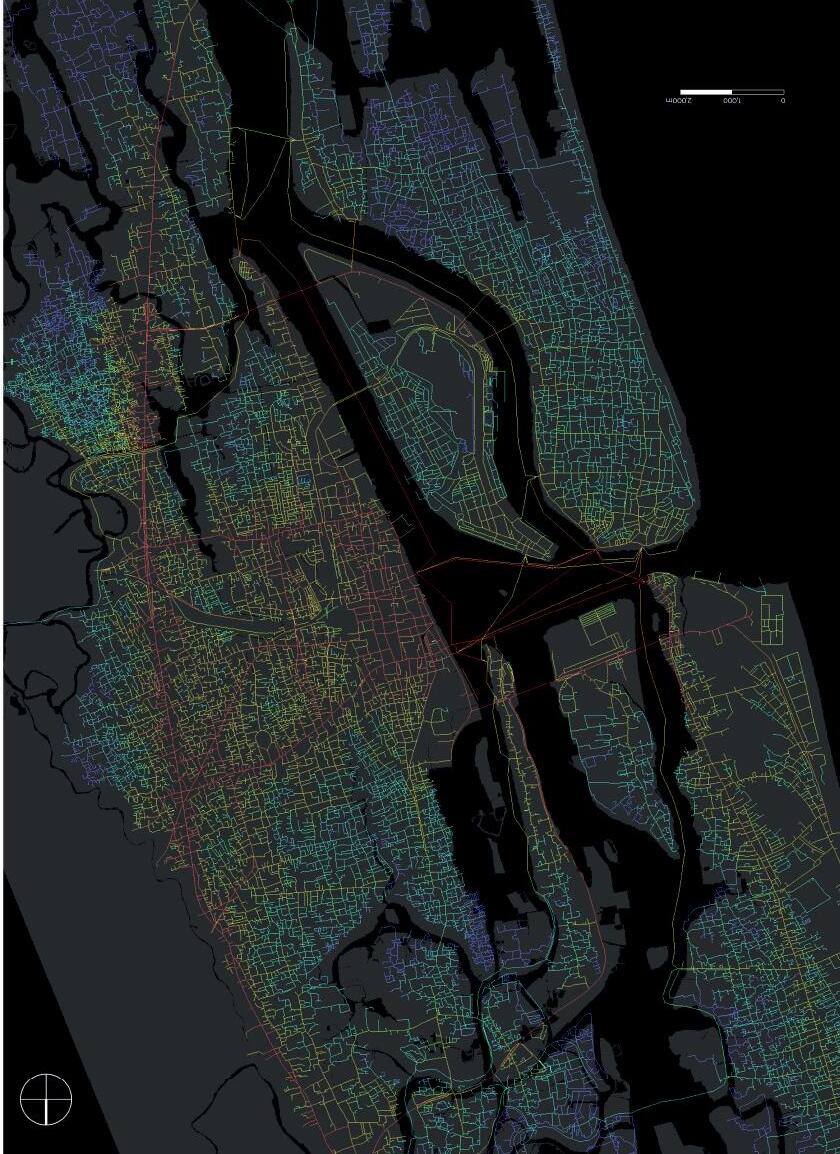
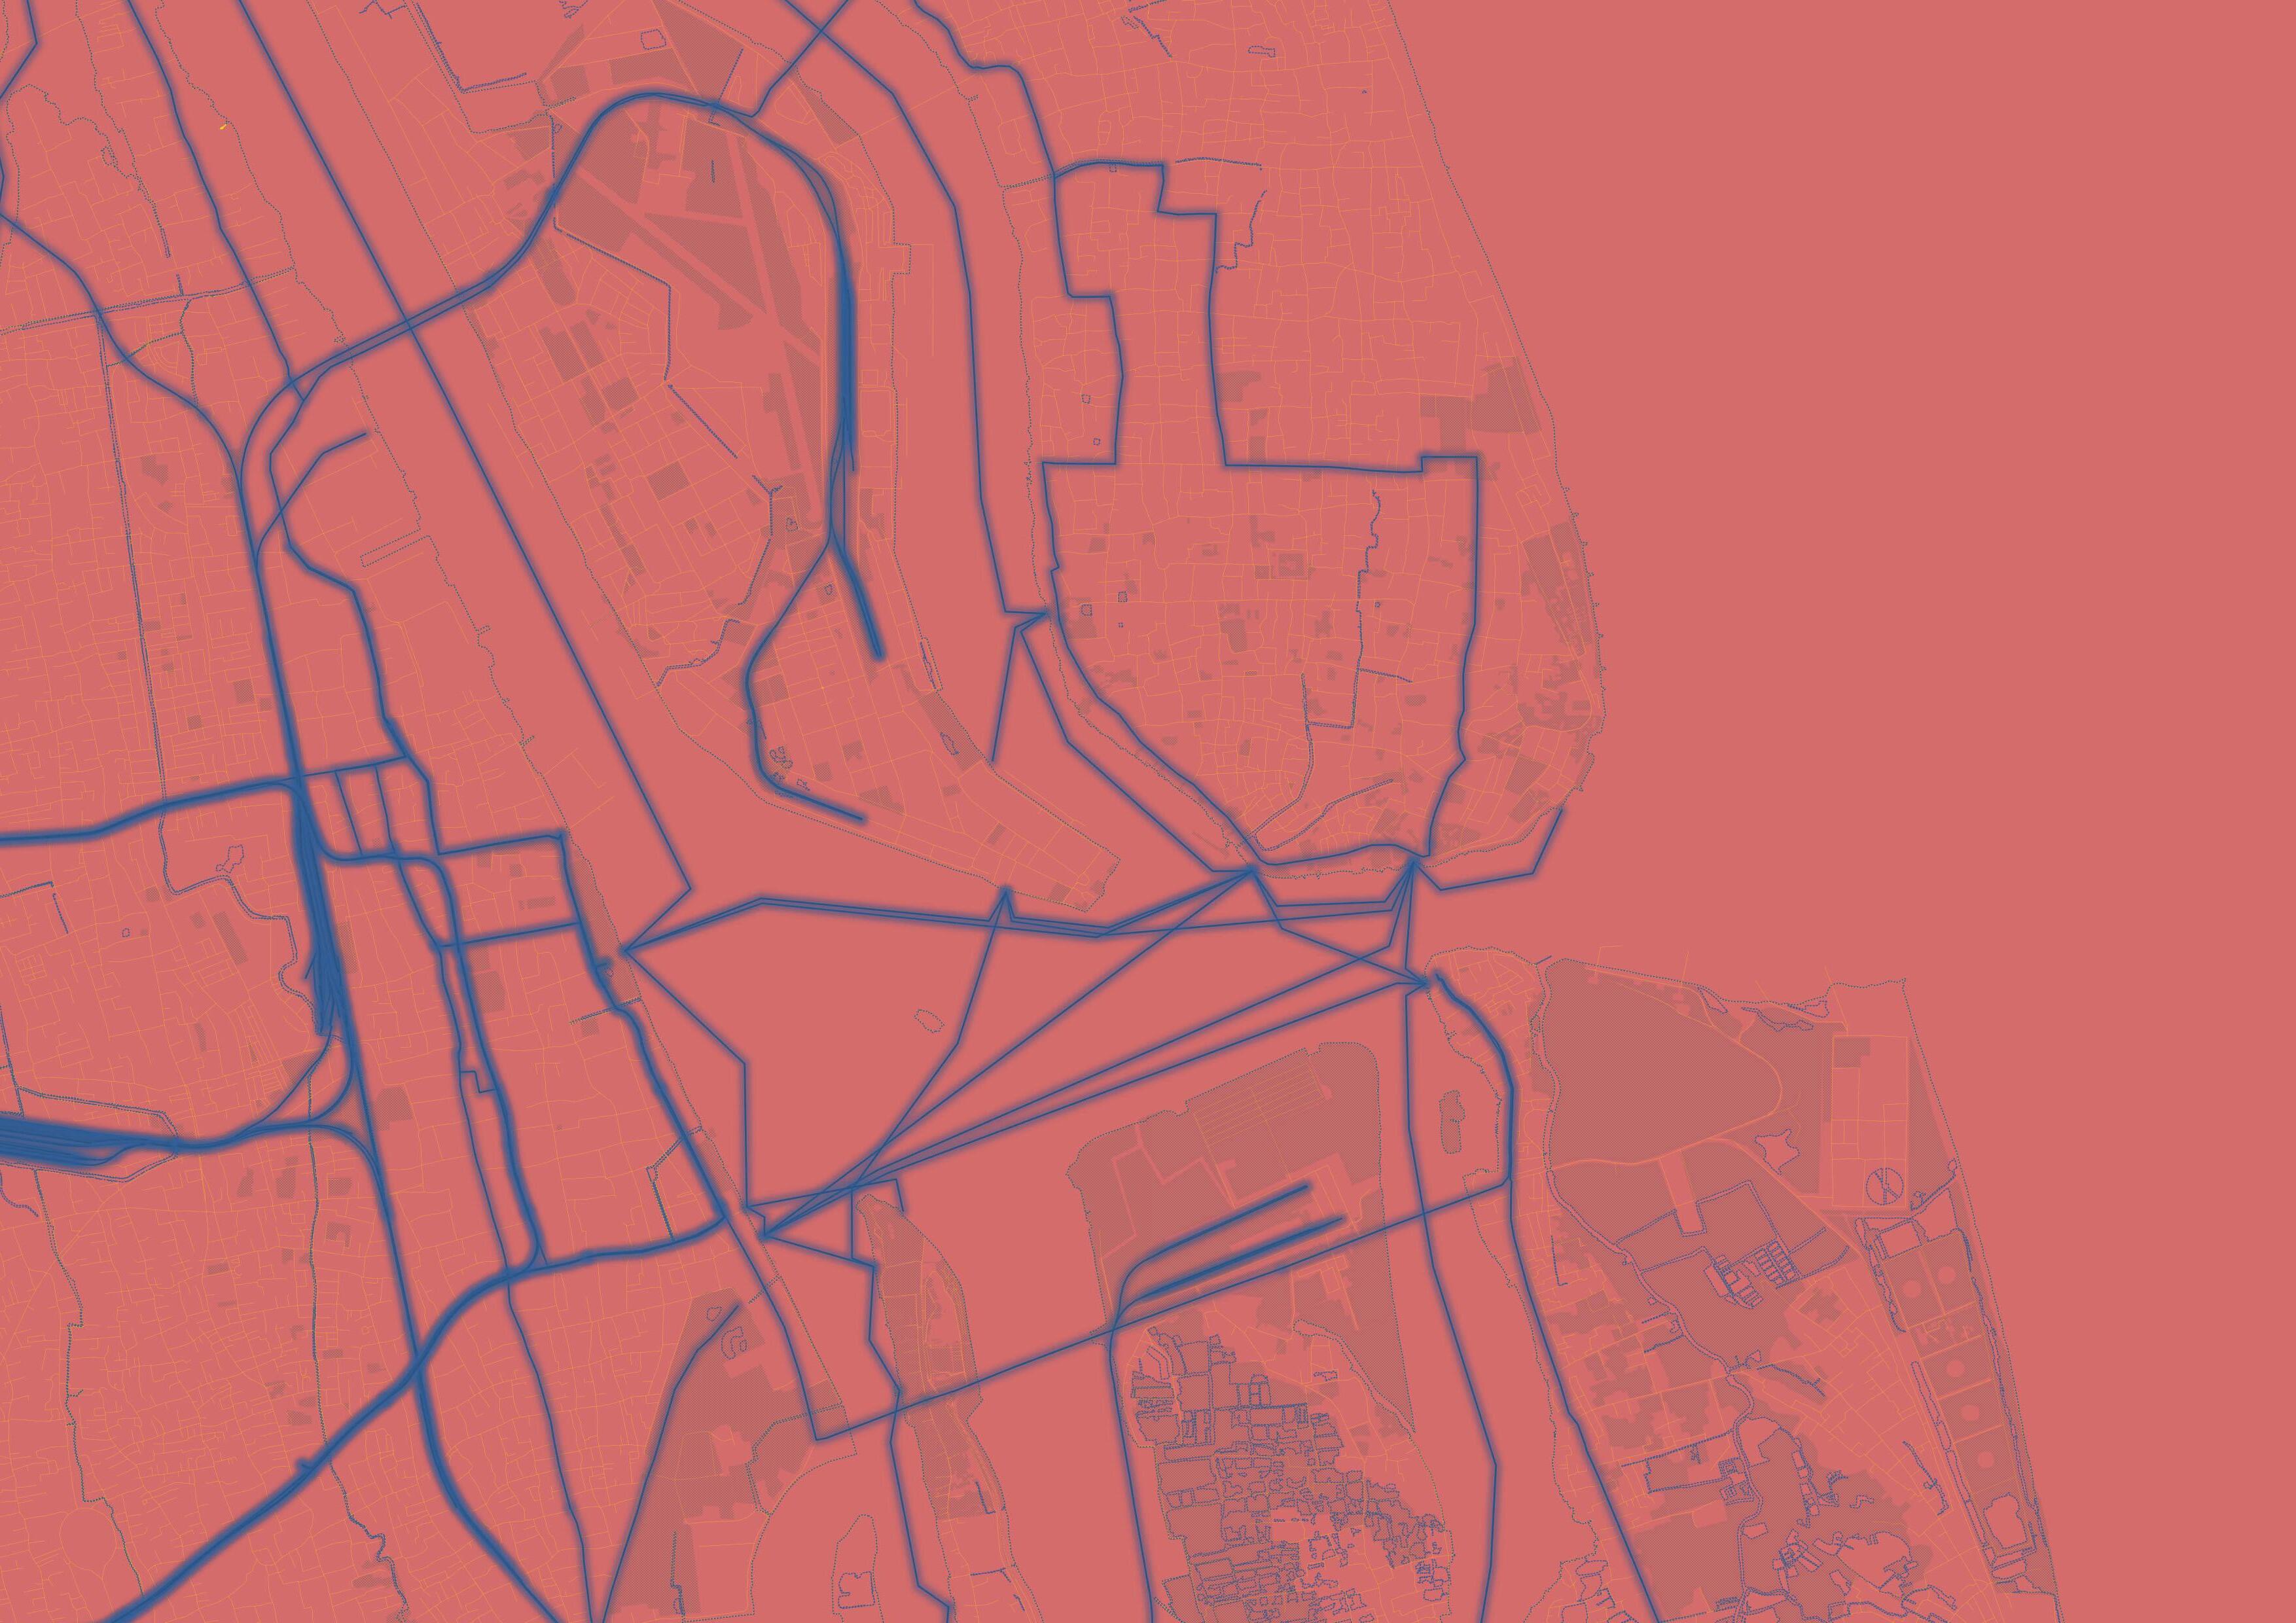
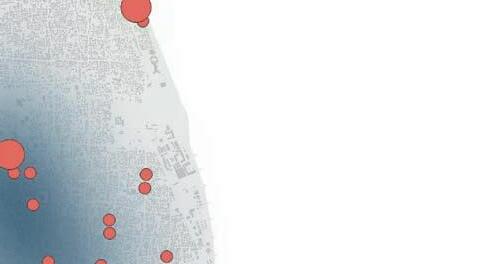
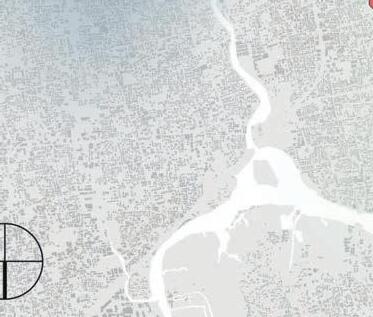
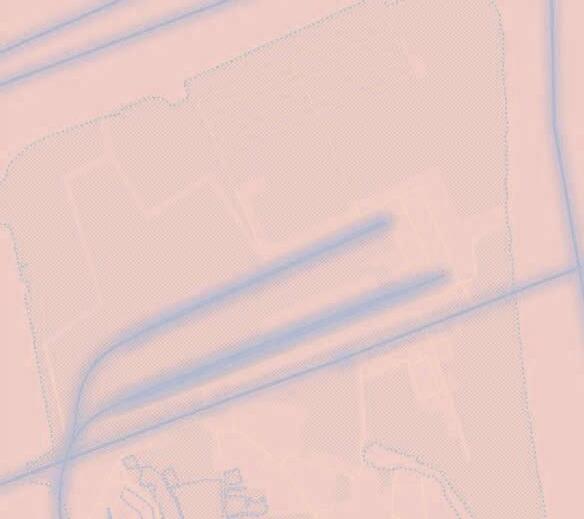
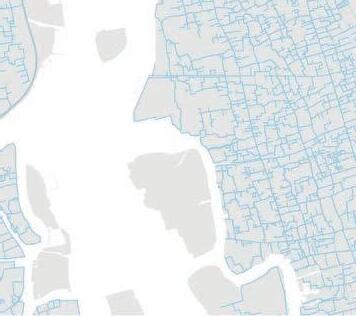
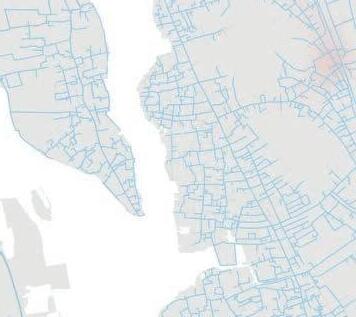
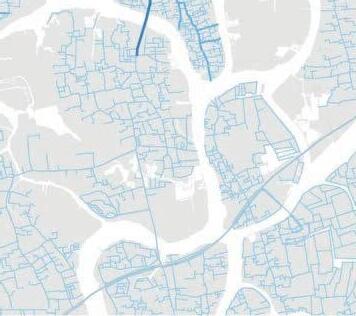
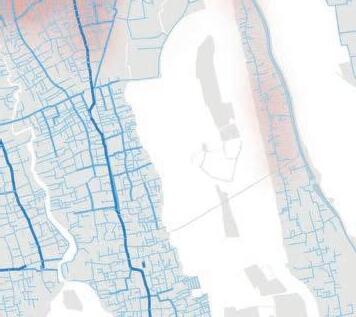
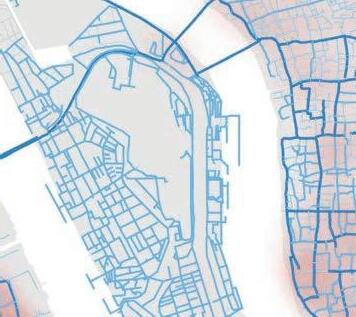
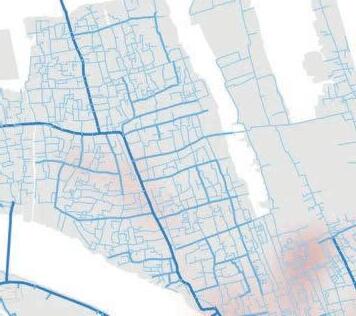
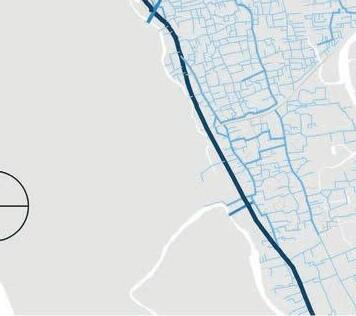
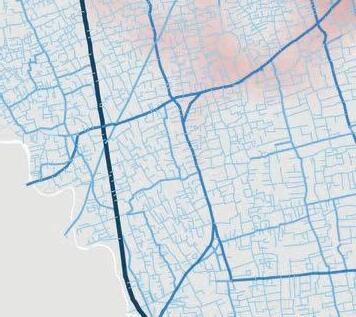
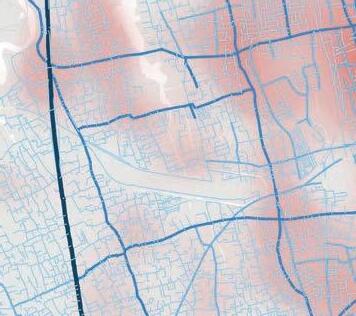
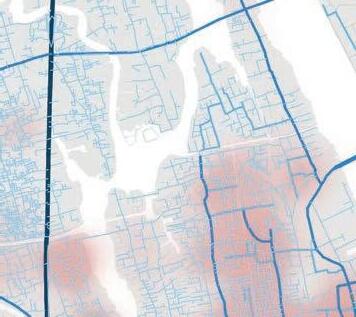
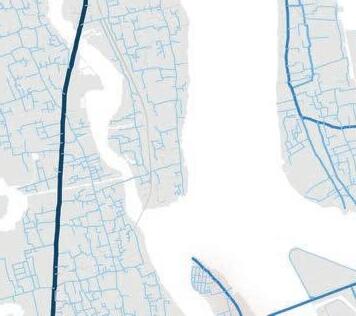
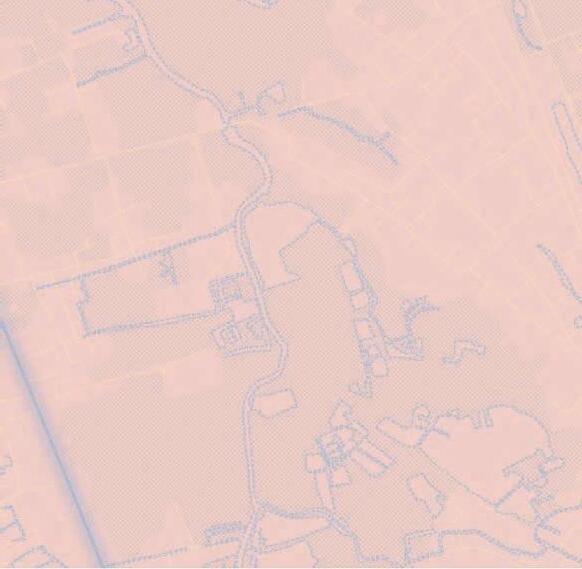
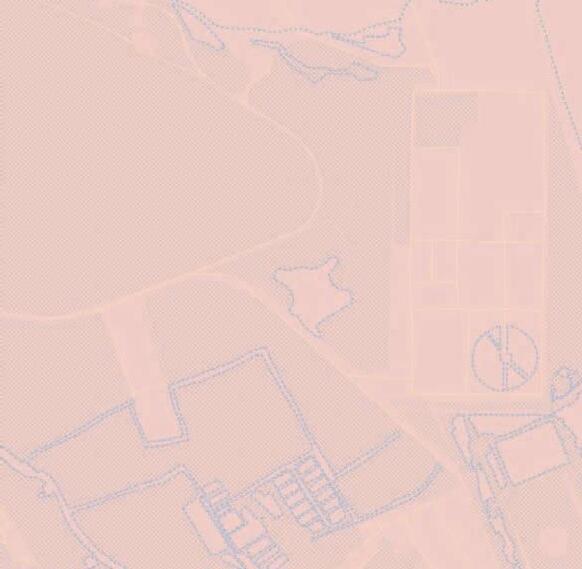
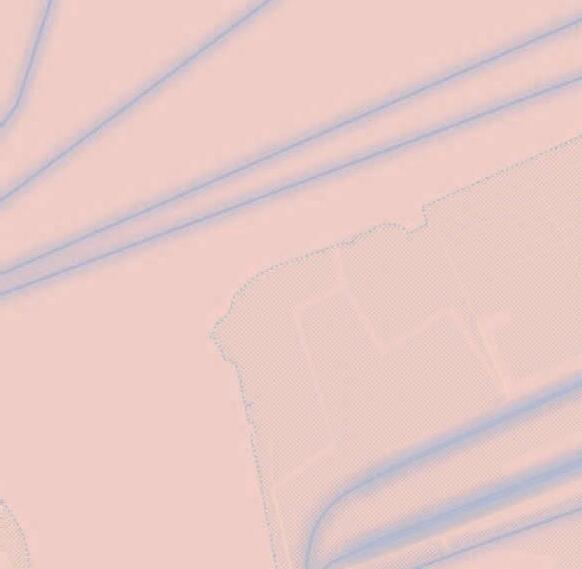
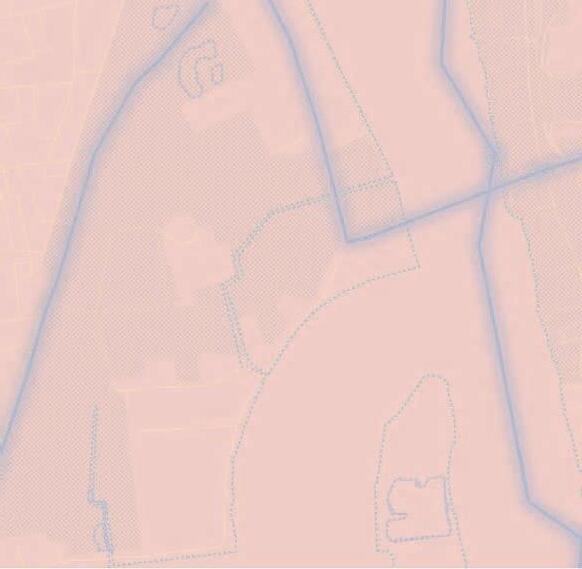
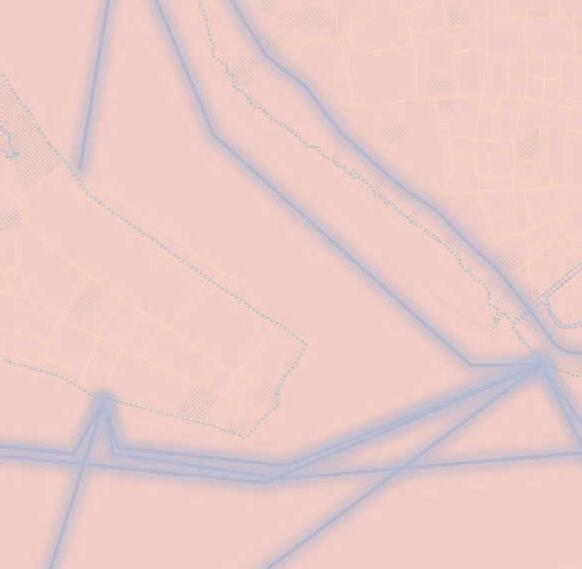
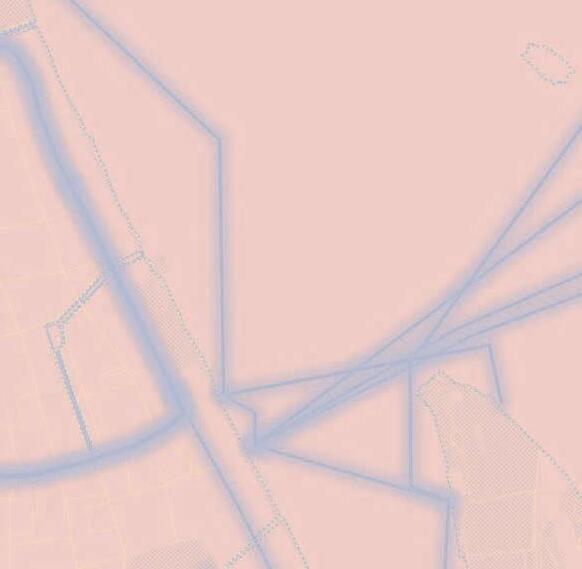
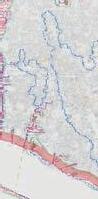
A space syntax model of Kochi’s road network was carried out to analyse the spatial configuration of the city’s road system. This is to form a better understanding of the city’s socio-economic processes and traffic patterns. A further analysis of the space syntax model can be found on page 172-174.
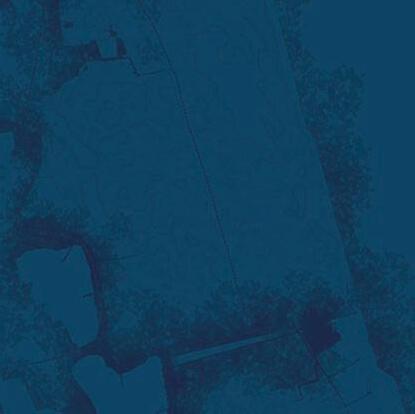
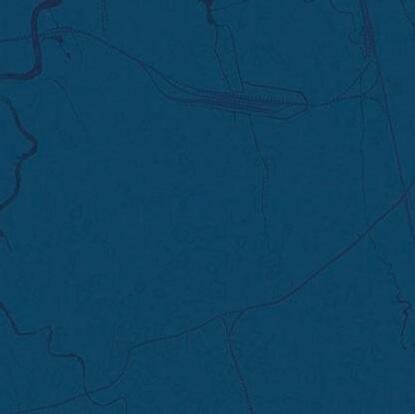
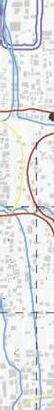
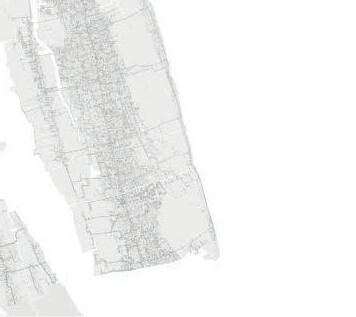
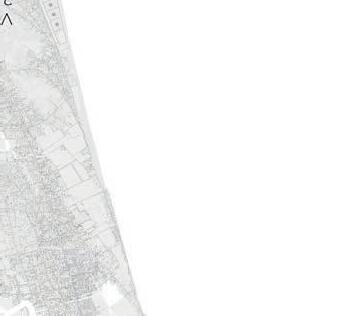
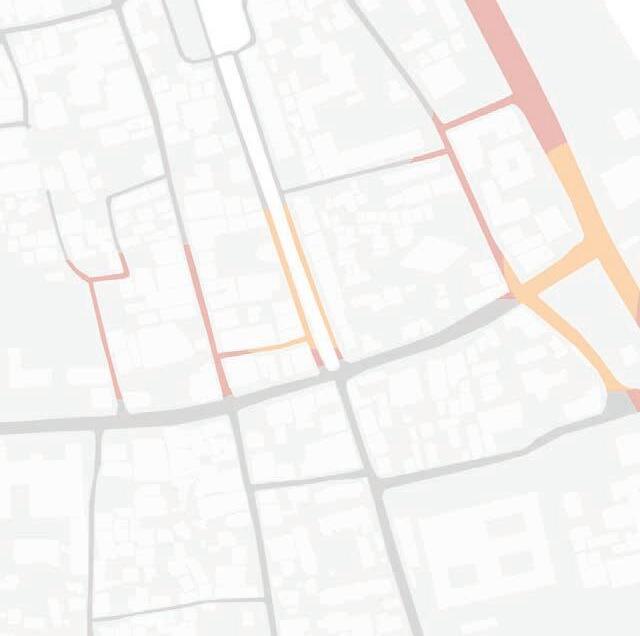
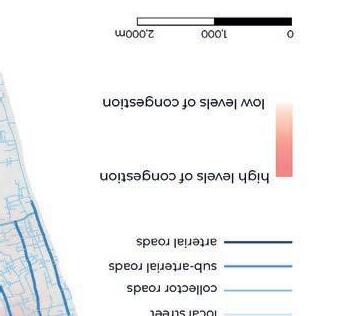
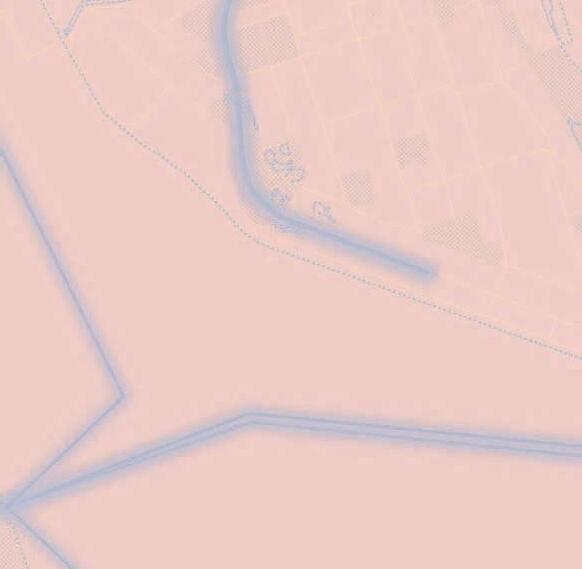
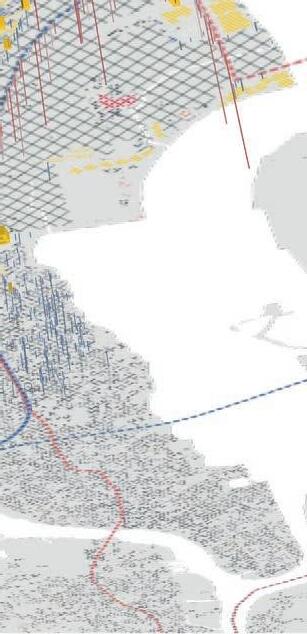
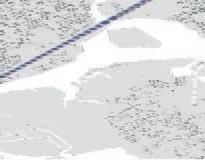
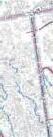
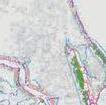
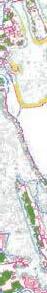
Fig.3.7. Road centerlines obtained from QGIS as spatial representation of Kochi’s urban form.
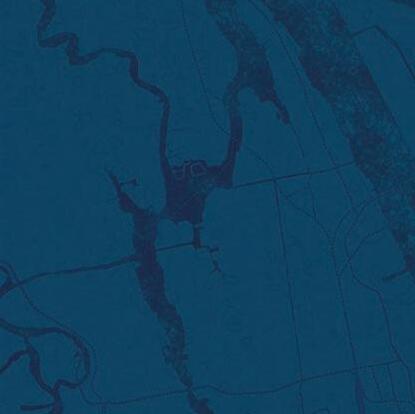
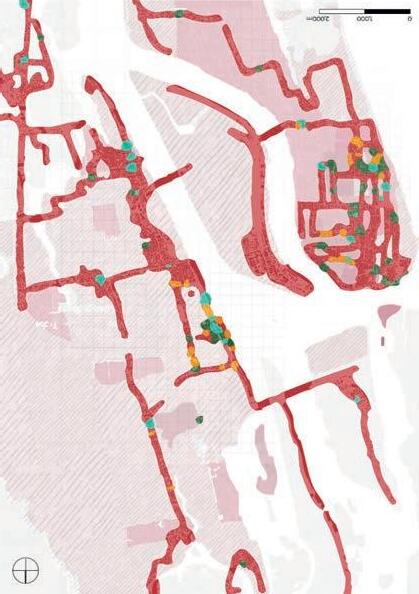
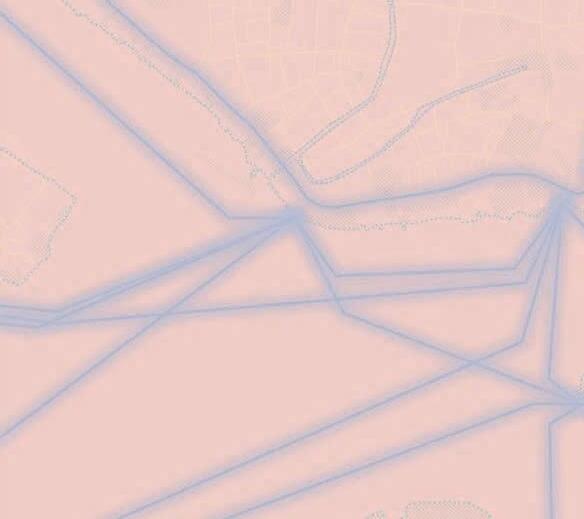
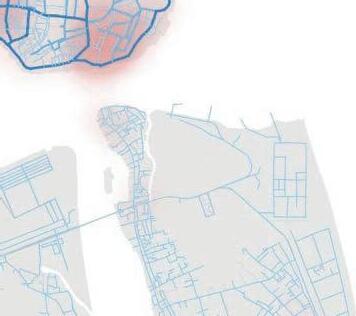
Fig.3.8. Choice map of Kochi proccessed with DepthmapX software.
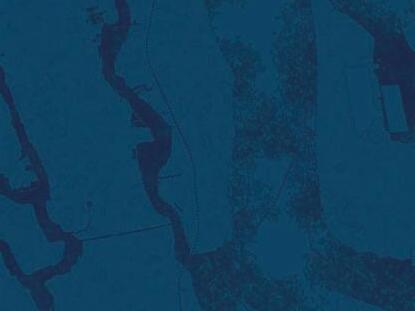
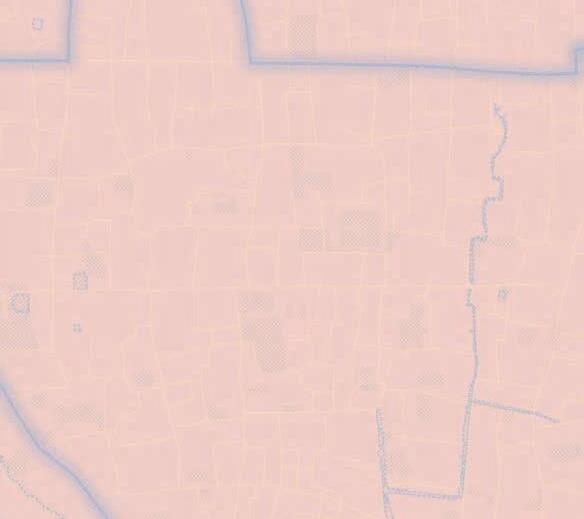
Fig.3.9. Global Integration map of Kochi proccessed with DepthmapX software.
FORMULATION OF SURVEY QUESTIONS
Surveys were used to help gain a better understanding of the issues and opinions of people who live in Kochi. This also allowed us to support the initial research and data that we found adding a layer of accuracy to the research.
Each of us submitted a list of questions we wanted to ask and this was then collated and refined by a team, similar questions were reworded to avoid repeating questions. The topics that were covered in the survey include:
- Wellbeing
- Flooding and canals
- Sanitation
- Waste and recycling
- Food and drink
- Equality
- Social and cultural identiy
- Transportation and mobility
- Crime
- Urban form
- Ecology and environmnet
Open ended questions were avoided as the intent of the survey was to have it translated to Malayalam. This would be an issue if we gathered a large number of responses in Malayalam as iwe would have to rely on a local to translate the data to Englisht.
Instead, close ended questions would be easier and quicker to answer making it more appealing to others to take part. The data collected can also be easily measurable and quantified.
SURVEY APP DEVELOPMENT
Similar to previous years, we have developed a survey app using ArcGIS Survey 123 software. This online survey allowed us to easily distribute it to a wider audience compared to distributing physical copies. This will also allow us to easily tabulate the data and identify trends in the results found.
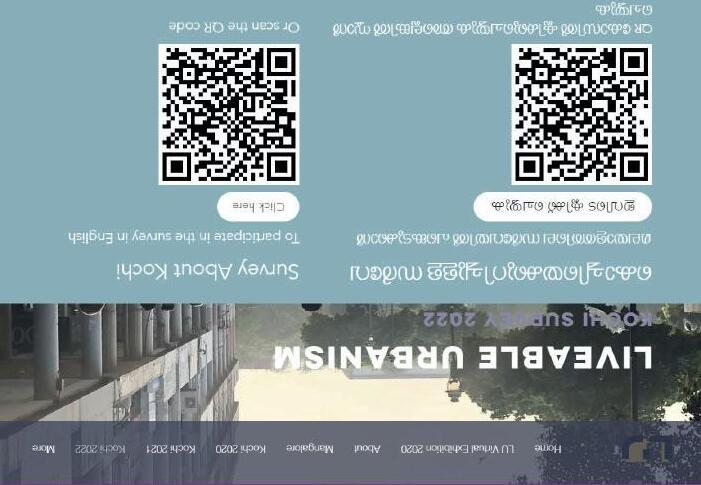
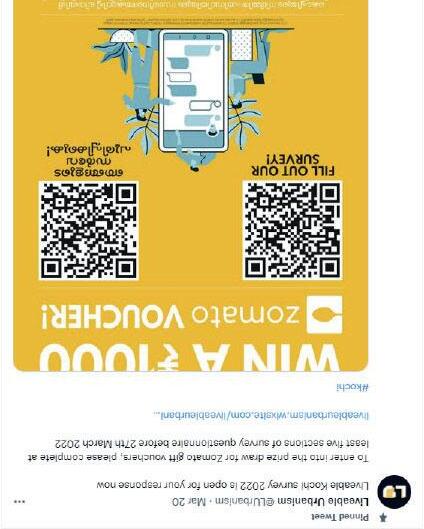
The process of the completing the survey was to have participants scan a QR code or follow a link there they would be redirected to a webpage. The survey was available in either English or Malayalam in order to reach a wider range of opinions.
As we had a large variety of questions and topics of interest, this resulted in the questionnaire having 65 questions not including the general demographical questions. Due to the long nature of the survey, participants may stop answering the survey mid way, resulting in us potentially not having enough responses for the questions towards the end.
In order to overcome this issue, the survey had a feature that allowed participants to choose from a list of topics that they were interested in answering. This meant they could choose to answer questions that they felt were important to them and would help give a better response.
Basic demographics were collected to help build a social profile of the participants who partook in the survey.
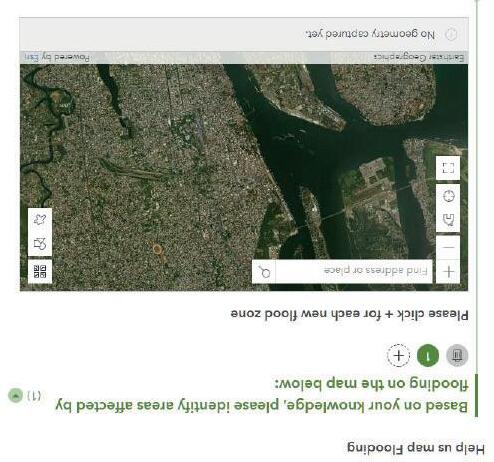
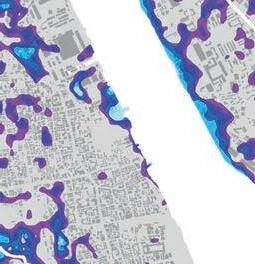
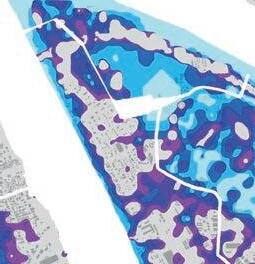
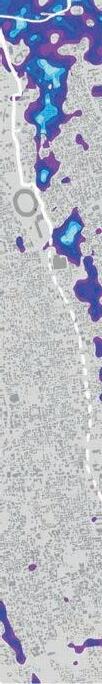
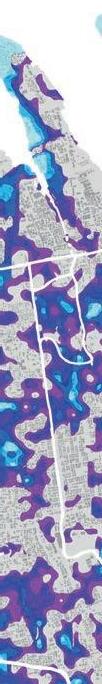
MAPPING FLOODING, SAFETY AND SOUND
The survey also had a section where locals could help with mapping their city in terms of flooding, safety and sound. This allowed us to identify the trends above which might not have been easily identifiable through on site research due to time constraints.
Fig.3.13. Liveable Urbansim website with QR code for survey.
Fig.3.14. English version of Kochi Survey.
Fig.3.15. Malayalam version of Kochi Survey.
Fig.3.12. Testing of survey app on mobile phone.
Fig.3.11. Mapping areas with risk of flooding.
RELEASE
The questionnaire survey was promoted on our social media platforms to spread news about our survey, a link and details about the various sections of the survey was highlighted through a prmotional video as well as post.
OUTREACH
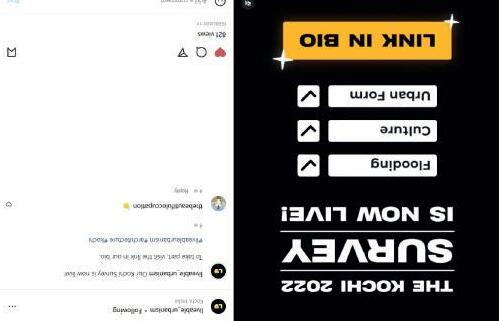
Name cards and stickers were created with our social media details and QR code to our survey app. These were handed out to the general public whilst we were carrying out our fieldwork in Kochi. Stickers were paste around Kochi on top of fliers or at local buisnesses with permission. The name cards were also useful as they allowed other individuals help us pass them on to their friends and family.
The initial response rate was low, this was due to both technical issues with the survey as well as not reaching a wide enough audience. t
In order to boost the number of response rate, paid promotional ads were used to target users who lived in Kochi who may not know Liveable Urbansim and what we do, this allowed us to quickly reach out to a wider audience.
A promotional giveaway was also carried out which acted as an incentive to get more individuals to complete our survey, participants who took part stood a chance to win a 1000 rupee Zomato voucher.
Emails were sent out to local organisations and our local contacts in Kochi detailing our survey and the giveaway to get a higher response rate.
Overall, there was an increase in engagement through the new methods used which has provided us with valuble information for our research.
RESULTS OF SURVEY
Overall, we have received 118 responses from the survey, the data collected is invaluable data about the city has helped gain a better understanding of Kochi as well as enhancing the integrity of our project. Individual topic results will be further discussed in chapter 3
Individual Topic Responses
Gender identity & Age
Fig.3.16. Front of Liveable Urbanism Name Card.
Fig.3.18. Back of Liveable Urbanism Name Card with QR code.
Fig.3.19. Stickers pasted around Kochi.
Fig.3.17. Promotional video for survey release.
Fig.3.20. Promotional giveaway event.
STAKEHOLDER INTERVIEWS
Stakeholder interviews were a key resource used to identify issue and to gain a better understanding of the city. These interviews could be categorised to formal and informal interviews. This mainly took place when we were in Kochi, being able to hear perspectives and to see some of the issues identified in real life has been helpful in terms of understanding the context better. Online zoom meetings were also held for participants who were not free when we were in Kochi or for individuals who did not travel to Kochi.
With permission, the conversations were recorded so that they could be easily transcribed once the interviews were completed, thus creating more quotable outcomes.
FORMAL INTERVIEWS
Based on our identified areas of interest which ranged formal or scheduled interviews were arranged with specific interviewees that were knowledgeable in the particular topic/topics, these individuals or groups were either from existing contacts or newly identified ones.
For example, speaking with a mental health specialist in regards to health and well-being, local fisherman about the process of catching, processing and selling fish, female activist in regards to crime and empowering women. Profiles of stakeholders can be found on page...
The structure of the interviews themselves were mostly informal and conversational, this allowed us to generate a more interactive and flexible conversation, whereby the respondents were able to guide or lead us to certain topics that may not have been aware about.
INFORMAL INTERVIEWS
Informal conversations were also held with random locals on the street, this allowed us to reach out to a larger demographic of individuals such as the youth and elderly who may have different perspectives on certain topics.
These conversations may not have been as comprehensive as the formal interviews as some individuals may not have a specific opinion or expertise in a particular fields. However, they allowed individuals to share aspects or more personal experiences and stories which added a depth to our findings. These were helpful in pointing us to certain areas, directions or issues we may not have spotted.
These data was then translated onto maps or diagrams but they are mostly reflected in the strategy, choice of site and programme visible in the individual proposals.
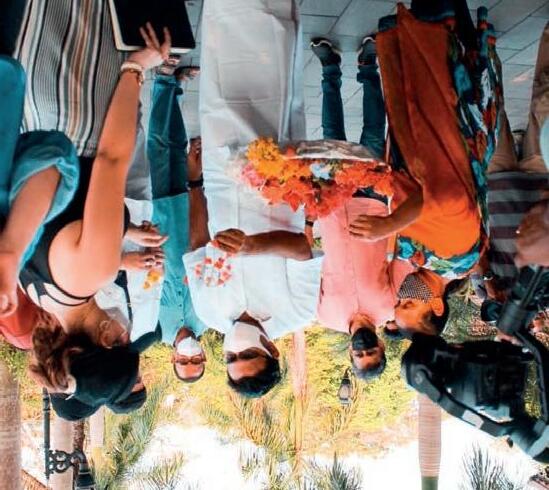
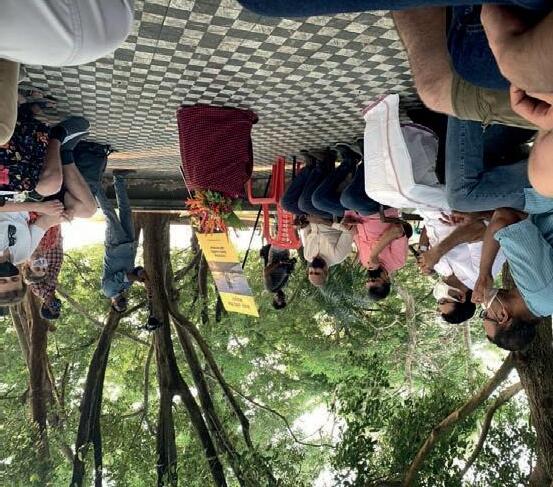
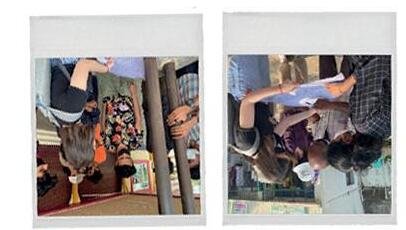
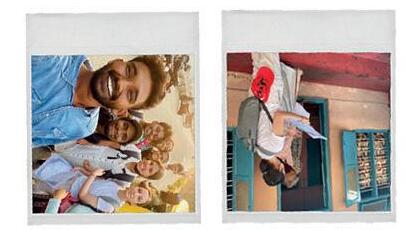
MEETING THE MAYOR
“I’d like to make my city a city of design ... I want my city to be placed in an international arena, for it to be known everywhere, I want my people to be known everywhere.” - Anil Kumar, Kochi Mayor
We were fortunate to have had the opportunity to meet and interview the mayor of Kochi whilst on our trip. This meeting was treated as a stakeholder interview where we had a conversation with the mayor regarding our individual research and interest within the city and his thoughts about them.
“I believe through this exchange, through this dialogue, through this engagement, there will be mutual benefits that will come out of this conversation.”
The meeting with the mayor took place at Subhash park that was located across from the Kochi Municipal Corporation Head Office. The mayor greeted us with a warm welcome where he presented us with different species of local flowers as a sign of welcome.
The mayor started with telling us a bit about Kochi, he spoke about how although he is aware of the many issues within Kochi there are also strengths which he is proud of, such as local social engagement, their healthcare system, their climate, the morphology of the city and many more.
The mayor was keen to listen to our opinions and our observations of the city and what we thought could be done to the city as well as any initial ideas for the city. He believed through this engagement he would be able to gain and learn something from us.
We proceeded with taking turns telling the mayor about our individual research and what issues we were trying to tackle within Kochi. We also had an opportunity to post questions to the mayor to hear his opinion on our topics creating a fruitful and insightful conversation.
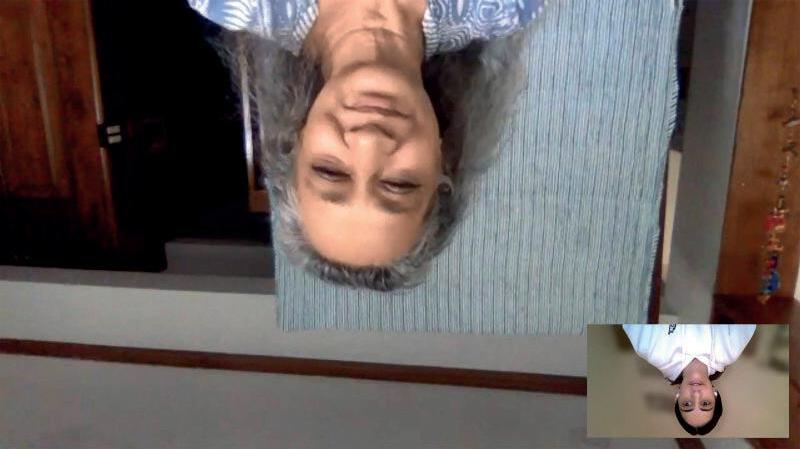
Fig.3.22. Zoom meeting with Sumaira Abdulali, noise pollution specialist.
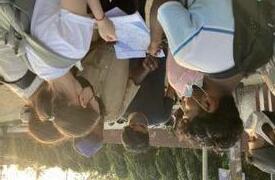
Fig.3.23. Interview with locals regarding perceived communities.
Fig.3.24. Meeting with Kurian Abraham ex President of IIA-Cochin.
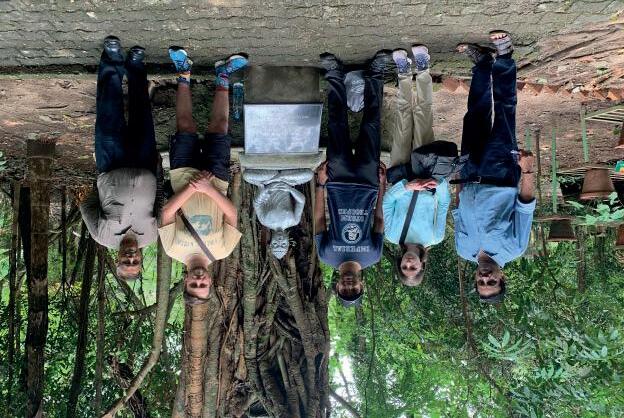
Fig.3.25. Meeting with Brandon S. Corrie, former Chief Conservator of Forests for Kerala Forest Department at Mangalavan Bird Sanctury.
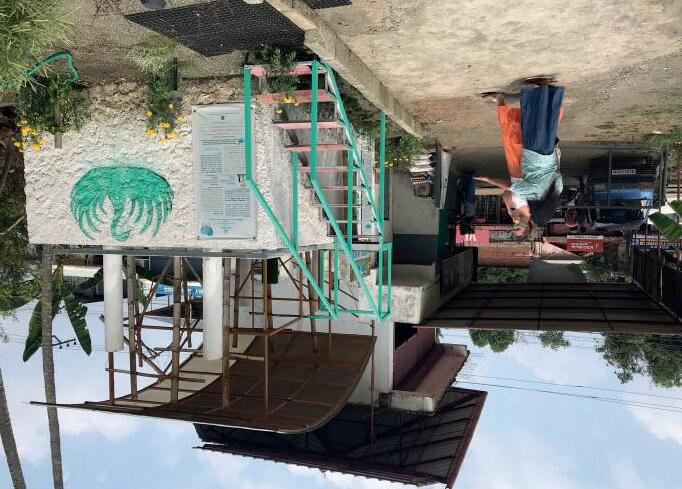
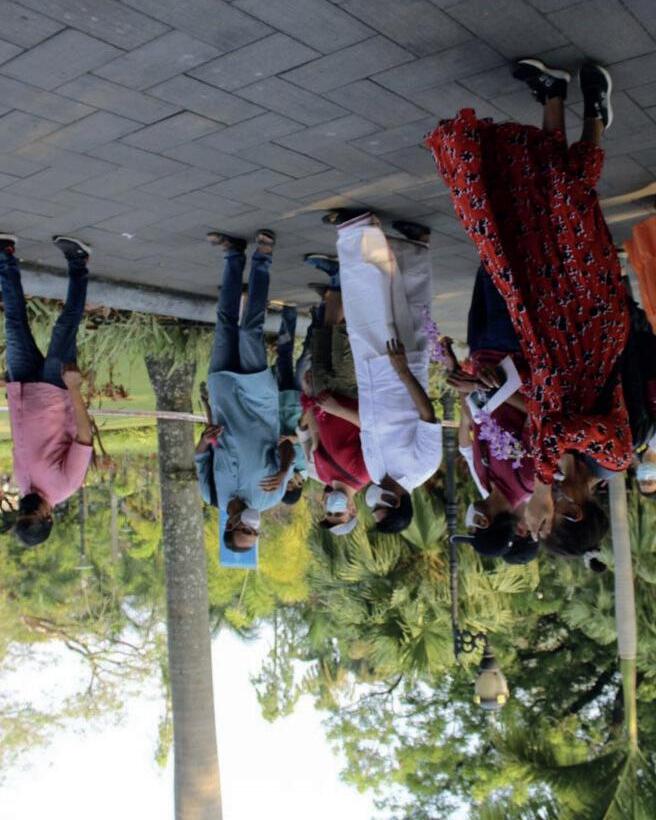
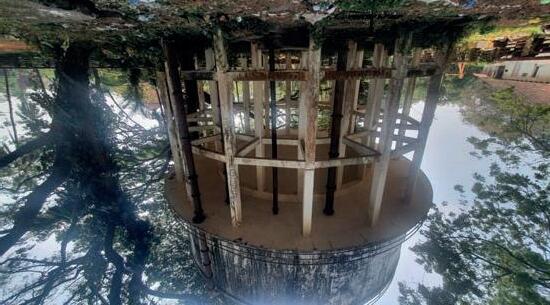
Fig.3.21. Meeting with Nanma Gireesh at amphibious pavilliion in Kotoyam.
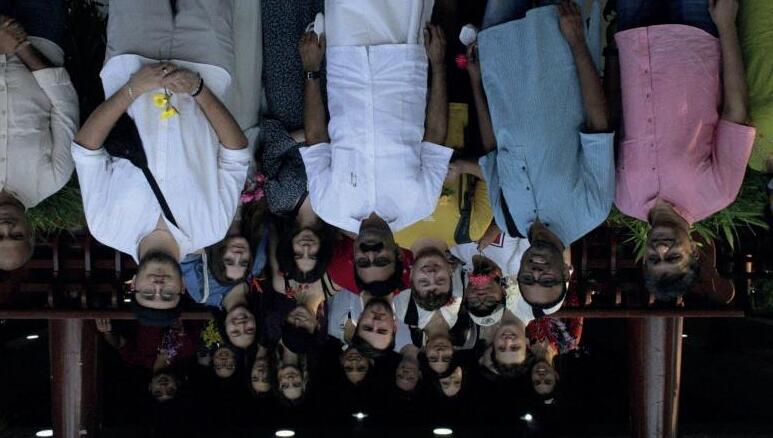
Fig.3.26. Liveable Urbanism unit meeting with the Mayor.
Fig.3.28. Mayor Anil Kumar welcoming us with local flowers. Fig.3.29. Discussion with Mayor.
Fig.3.27. Walk in Subhash Park with Mayor.
INTERVIEWEES PROFILES
Among the 28 of us, we interviewed a wide range of people, to better understand the issues facing liveability in Kochi. Professionals ranged from architects, former government figures, NGO founders etc.
The selection of the interviewees was dependant on our individual interests and the different issues we identified in Kochi such as infrastucture, equality, flooding, waste, and management.
Therefore, outlined on this page are some of they key people interviewed, for each profile a summary from the interview is presented by stating the main points addressed and a concise key message to help understand the outcomes of each interview.
Urban Planner at GIZ Transport India
Topics covered:
1. Stakeholder involvement in public projects; 2. Citizen involvement in the implementation process; 3. Implementing an institutional structure to support the projects further Funding and Stakeholders.
Key message:
The city has several mobility studies and masterplans which are not being implemented. Before supplying infrastructure such as rent-a-bike, there needs to be a large enough number of riders to support it, so the education and training part of the projects plays a particularly important role in its success.
Architect at Design Combine
Topics covered:
1. Women’s rights and employability in Kerala; 2. Spatial thinking for work within a home is not being tackled, especially within architectural design; 3. Gender in architectural practice and urban design.
Key message:
Kerala is a very complex place. It is a place where women are very highly educated, but also, within homes the roles are very strict. Most women are financially dependent on their spouses. Nobody gives thought about the need for comfortable spaces for women to perform any of these jobs at home, whether it is productive or reproductive work.
Amphibious Engineer and founder of NestAbide
Topics covered:
1. Amphi-Nest (Amphibious Design); 2. Flooding effects and adaptation strategies for the future with climate change; 3. Women in Engineering in India; 4. Funding and Stakeholders.
Key message:
Severe flood threat is eminent, need adaptation not mitigation strategies and amphibious technology yet to become widespread, people only just starting to believe in it through seeing prototypes working.
Noise Pollution Activist, founder of Awaaz Foundation
Topics covered:
1. Main causes of noise pollution; 2. Involvement in awareness projects like the National Initiative in Safe Sound (NISS); 3. Areas in which noise pollution can be tackled Funding and Stakeholders.
Key message:
You can’t tackle road safety without tackling sound safety. There have been campaigns in Kochi to raise awareness, but noise has not been controlled at all.
BRANSDON CORRIE
Former Head of Forests, Kerala
Topics covered:
1. Legal aspects related to forest and paddy field conservation in Kerala; 2. Actionable ways to improve canals in Kochi; 3. Ways to make the built environment friendlier to the local biodiverstiy.
Key message:
The natural environment is a recurring point in the discourse of politicians. However, no progress can be made to improve its protection without a “marriage of ecology and economics”. Ecosystem services bring immense value to the city and some economic incentive will help small land owners maintain them. Thus, a public-private partnership might work.
Architect/Urban Designer and partner at VSC
Topics covered:
1. Traditional market stakeholder relationships; 2. Urban form and social interaction relationship; 3. Human-scale in streets; 4. Slum land speculation; 5. Decentralised utility systems; 6. Providing enjoyable ecological spaces encourages personal responsibility; 7. Small-scale design for maximum impact.
Key message:
The city is formed from the people and their connections as much as its built form. India’s alternative chaotic set of rules, should be understood to propose an efficient intervention. The planning system should prioritise people and be effective. Change happens through education, so aim to provide proper education to children.
Architect/Urban Designer at Kochi Smart City Project
Topics covered:
1. Cochin Smart City Limited projects: planning, implementation, maintenance, and other challenges; 2. Stakeholder communication management; 3. Community involvement.
Key message:
The most difficult challenge is people’s attitudes, which can be changed through setting an example, so that they can experience better quality design and start desiring it on a larger scale. Therefore, it is necessary to start implementing projects as soon as possible, rather than keeping talking about them.
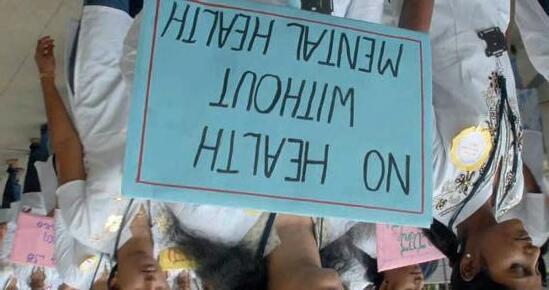
Counselling psychologist
Topics covered:
1. Mental Health in Kochi and the effect the city has on wellbeing; 2. Stigma on mental health loneliness and isolation; 3. Counselling support in Kochi; 4. The importance of social interaction and the effect of Covid-19 on isolation and mental health.
Key message:
Lots of work to be done to make mental health resources accessible to the public and reduce the stigma associated with the issue. Raising awareness through education and government initiatives is important, as well as having public open spaces that are maintained regularly and accessible counselling facilities that are welcoming.
Society (NGO)
Topics covered:
1. Programs that work with underprivileged children and marginalised women for innovative thinking/ emotional healing, through art; 2. Community building and possible funding avenues; 3. Cultural identity
Key message:
Minority groups do not have equal opportunities in Kochi. It is important that we bridge the gap between the privileged and less privileged. A sense of unity can be achieved through programs that promote inclusivity as well as Kochi’s cultural identity, such as through art education and food related activities.
Topics covered:
1. Kochi’s canals: tackling waste, flooding and their fragile ecosystem; 2. Future development of the harbour; 3. Importance of education to raise awareness of environmental, socio-economic issues; 4. His house as an example of cross ventilation design.
Key message:
The urban fabric is under threat as poor solutions being implemented lack cohesiveness. The optimal strategy is to link proposals together to boost liveability. This should stem from education and use of resources available, such as the waterways, which should work in harmony with the urban fabric.
SWAPNA WILSON
MONOLITA CHATTERJEE
SUMAIRA ABDULALI
NANMA GIREESH
Architect and ex President of IIA-Cochin Center.
Author and founder of The Art Outreach
RAJEEV KATHPALIA
ABISHEK XAVIER
MERLIN JOSEPH
KURIEN ABRAHAM
TANYA ABRAHAM
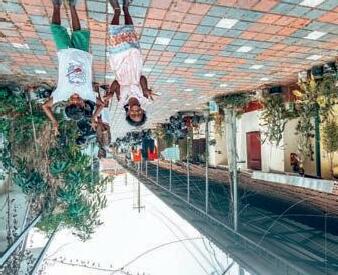
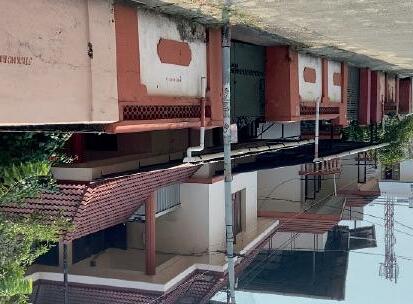
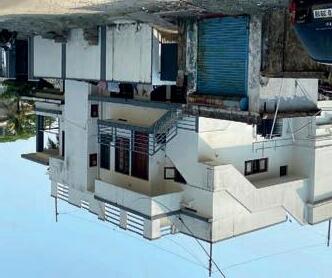
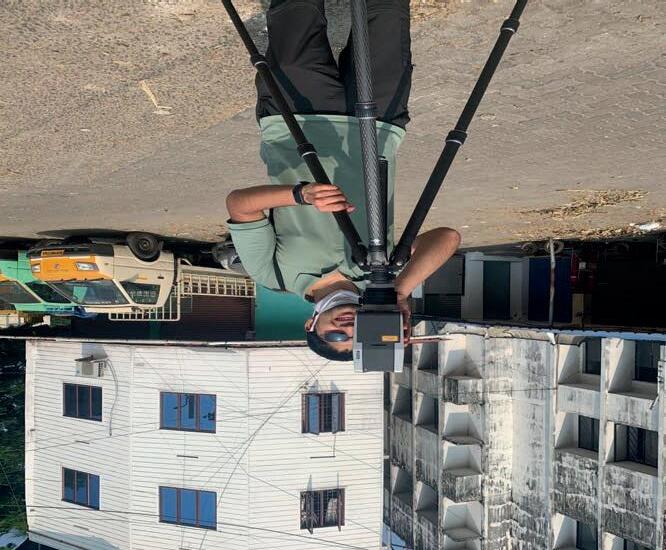
PHOTOGRAMMETRY
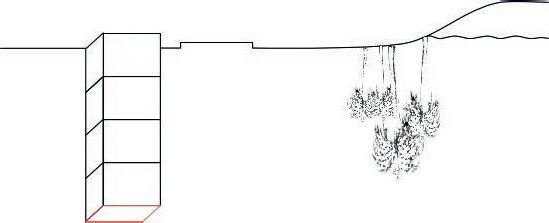
Drone surveys and 3D scanning have allowed us to collect immediate site context in detail within a shorter period of time compared to taking pictures of an area. This was vital as it allowed us to maximise our time in Kochi.
DRONE SURVEY
With a drone, it was possible for us to carry out topographic surveys of the same quality as the highly accurate measurements collected by traditional methods, but in a fraction of the time.
The drone survey sites were determined through individual project locations being marked up by polygons within a Google Earth file, these were then translated to a drone mapping software called Drone Deploy. The software allows for the drone pilot to see the area to be surveyed, flight time, batteries needed for the flight as well as a place to start the flight.
With granted permissions, we were able to fly a drone above key areas of the city. This provides us with high resolution images. Flying the drone at a 45degree angle along a grid also allowed us to develop 3D models of parts of the city which helped captured the built environment and its morphology. The drone was helpful in collecting data for a wider area.
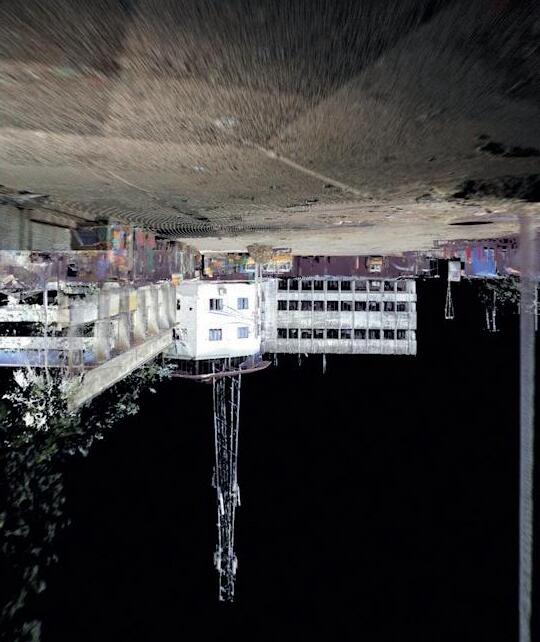
3D SCANNING
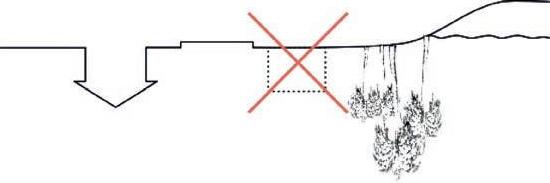
3D Laser scanning is a non-destructive technology that is used to capture the spatial geometry of the structure in the form of a point cloud in order to develop accurate multi-dimensional digital representations of the built asset. This process can be carried out indoors, outdoors and at any time of the day.
This process is carried out by placing the 3D scanner at multiple points on a site, the distance between scans can range between 15m to 50m depending on the spatial configuration of an area. This process allows us to quickly and accurately capture all physical measurements and detailed documentation of an area.
PROCESSING 3D SCANS
The photos taken by the drone and scanner were stitched together within Agisoft Metashape or Autodesk Recap to form a point cloud, this then forms a mesh which can then be used to create a 3D model, this process is known as Photogrammetry.
Modelling the physical forms of a location helps us better understand the spatial system and get a better “feel” of the space.
We recognize the 3D Scans capture a moment in time, thus they are not indicative of the true life of a site. However, this method helped us accurately record areas of interest for further development of our strategies. They also contribute to a visual data base of Kochi.
Fig.3.31. Merging 3D scans in Autodesk Recap.
Fig.3.32. 3D model on Cloud Compare.
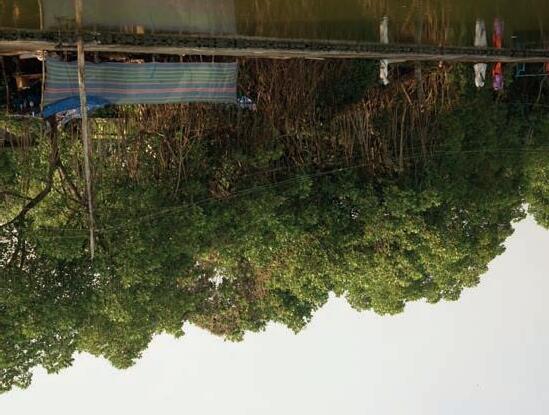
Fig.3.30. 3D scanning whilst in Kochi.
Fig 3.X. Map of drone survey area
KOCHI ANALYSIS 04
Using the methods previously presented, this chapter aims to act as a collective background research resource which can be utilised as a springboard for further detailed analysis, as well as the base for complex, critical design thinking. This chapter has been divided into 3 categories for analysis: socio-economic, infrastructure and environment.
POPULATION DENSITY
GROWTH RATE
The population growth rate in Kerala’s districts from 1991 to 2001 shows a significant increase in population in comparison to previous decades. In comparison, Ernakulam districts decadal growth (10.24%) is higher than average for Kerala (9.42%) as per the 2001 census. Kochi is expected to have an annual population growth rate of 3.15% with a population of 3.18 million by 2030 (Indiaonlinepages 2020)
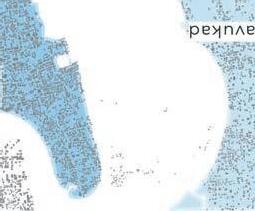
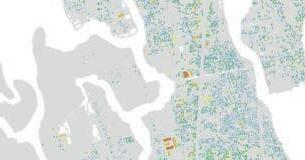
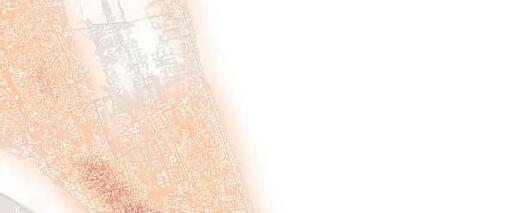
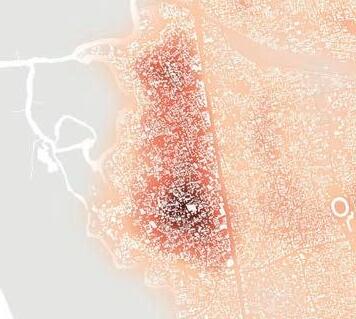
POPULATION DENSITY IN KOCHI
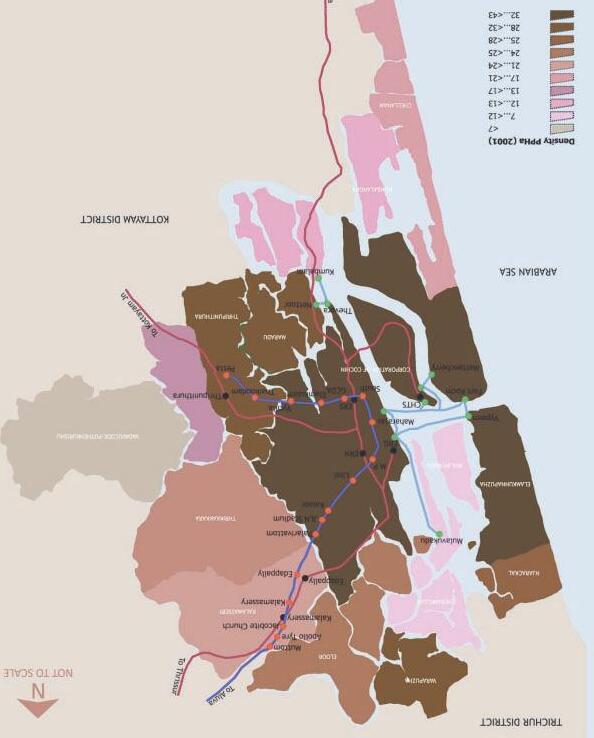
The net population density of Kochi Corporation in comparison to other districts in Kerala, is one of the highest, with 8442 persons/sq.km. Kochi’s population has grown significantly; a growth rate of 2.3% in 1990 to 3.77% in 2020. This is largely due to its status as the ‘Commercial Hub’ of Kerala, its transport connections and prime geographical situation within the state. Although this increase in population has boosted aspects of quality of life, the infrastructure has been strained and stressed. The most populated area of Kochi is Fort Cochin, and other areas in West Kochi, which is historically where many migrants settled and have been increasing the population ever since. On the east side of Kochi, the population is high mainly in Ernakulam where employment opportunities are offered, attracting migrants from across the state and beyond. The concern is towards the spread of population where the densely populated area encounters social problems such as traffic congestion and pollution among others, while the current areas along the water’s edge remains underutilised and with low population density (George 2016).
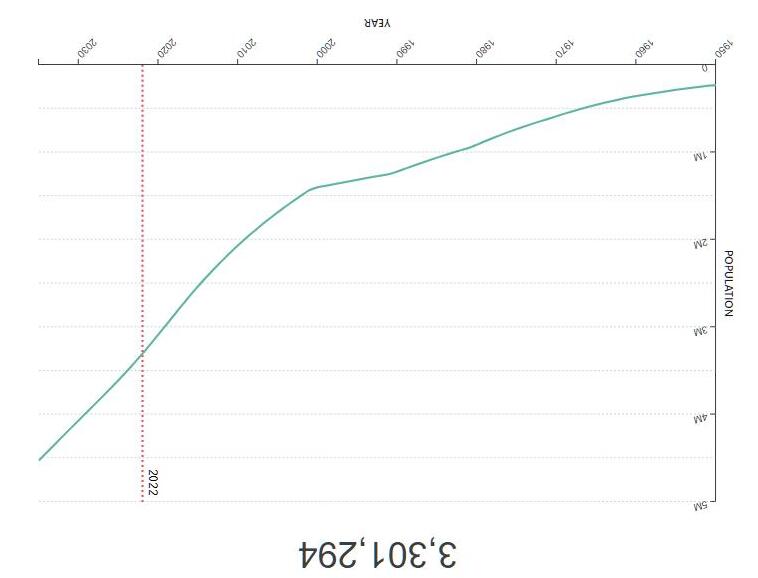
Kochi Population 2022
Kochi’s population is expected to rise drastically during the coming decade, mainly based on the migration from other parts of India (World Population Review 2022).
ISSUES RELATED TO POPULATION GROWTH
As a result of rising population needs, Kochi has witnessed both big and small scale development throughout the last two decades. These projects have benefited the population in terms of offering employment opportunities and generally improving the economic prosperity of the city. However, these often unplanned city developments and the overall urban growth has also resulted in slum creation and a number of issues associated with population explosion (Joseph 2012).
Fig.4a.3. Kochi population 2022 (World Population Review, 2022).
Fig.4a.2. Urban population growth 1991-2001 (Liveable Urbanism Unit 20202021 2021).
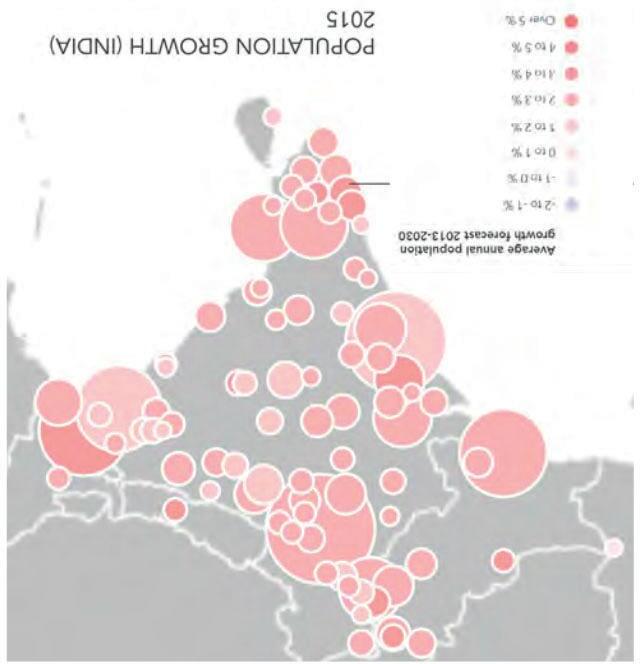
Fig.4a.1. Population growth in India, 2015 (Liveable Urbanism Unit 20202021 2021).
EMPLOYMENT
There is a state wide occupational decline within Kerala, as the unemployment rate drops to 12.2% in urban areas and 11.6% in more rural areas, whereas the rest of India boasts a far better employment rate. This could be a result of having nearly half of the population earning their income through salary and thus experiencing instability. Furthermore, the city is seeing a monumental shift from its inherent agricultural occupations to the more contemporary IT based jobs as well as factory and refinery based jobs, as a result of demand; a recent petrol refinery has been commissioned in Kochi. A map-based study into the employment rates and occupation types within Ward Boundaries would prove beneficial to understanding the progression of the city of Kochi better (Department of Economics and Statistics 2018).
Unemployment in Rural and Urban Areas
POPULATION WORKING RATE
The working population rate map for different wards of Kochi in 2001, revealed a low average of 35-40%. A short analysis on some key wards was done in an attempt to understand the different employment percentages of the areas. Due to severe unemployment, young and educated labour forces are driven to migrate to other parts of India and abroad for employment. Therefore, Kerala’s economy is relatively dependent on other states and courtiers both for employment and for remittances (Department of Economics and Statistics, 2018).
LOCAL AND MIGRANT LABOUR
Urban areas
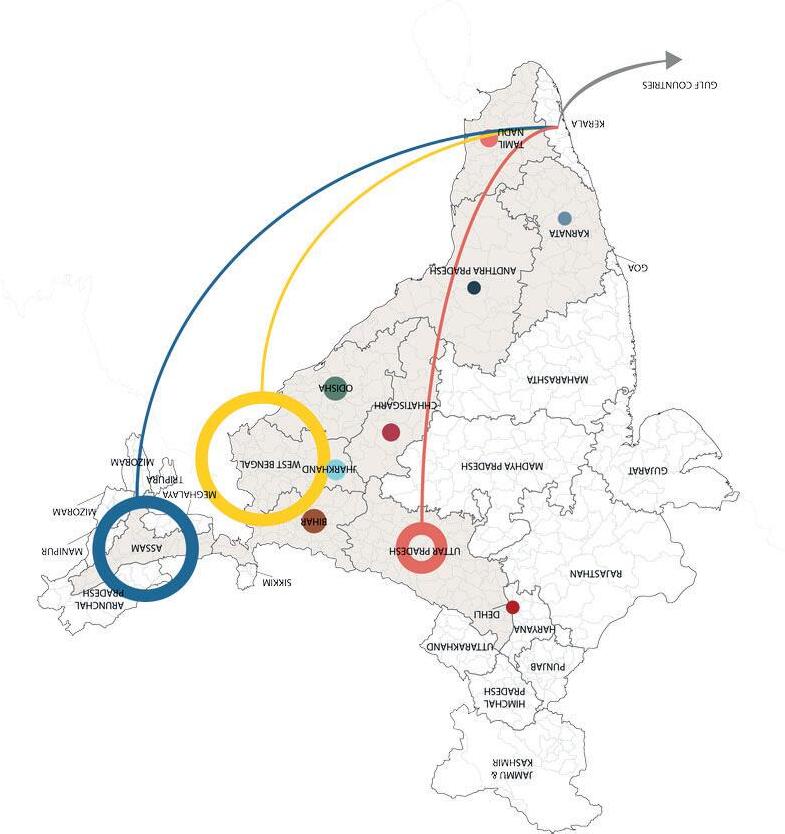
The high education level of Keralites has led not only to a high levels of educated unemployed, but also to a disdain for manual work in preference for white collar work. It is perhaps this that has led to the influx of workers from other Indian states to fill manual jobs that Keralites prefer not to occupy. Around 3,000,000 Keralites are working abroad, mainly in the Persian Gulf; the NRM remittances from these migrants are equivalent to nearly one fifth of the state income. However, Kerala’s per capita income is 60% higher than India’s average. Over the past 15-20 years there has been increases of interstate migrants from states such as Tamil nadu, West Bengal and Pradesh, going into low and unskilled labour sectors. This global trend takes place in rapidly developing cities such as Kochi. Variations in wages and labour demand mean Kerala as a whole is popular for migrants from other regions. Interestingly, keralites are emigrated to gulf countries or seeking blue collar jobs in India, this adding to the demand for day labourers in Kochi particularly in the construction and manufacturing sectors (Parida and Raman 2021).
WOMEN IN THE LABOUR FORCE
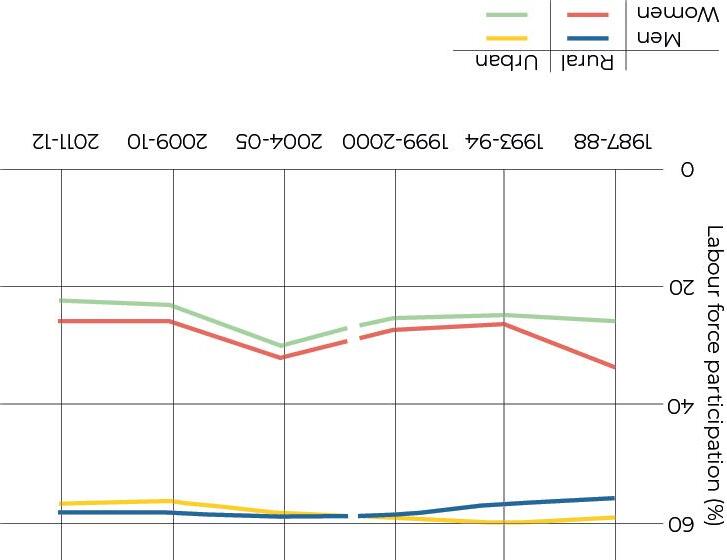
Kerala is seeing a paradox in its workforce. It has the highest literacy rates in India and top for development, but the particpiatation of females is half of that in males. Studies show the government and state needs to do more to encourage women to start their own businesses by facilitating women’s entreneuship and financial independance (Prakash 2001). This issue is further analysed later.
Vi Vittttil i a / Ch C al alikikkakava v ttom o Go Good t traransnspoport rt lin i innks a and d is f a we weal a th thy y ar area ea c con o siist s ing o of pr profofesssision o al a s an and d bl b ue e colla laar r wo w rk r er ers. s
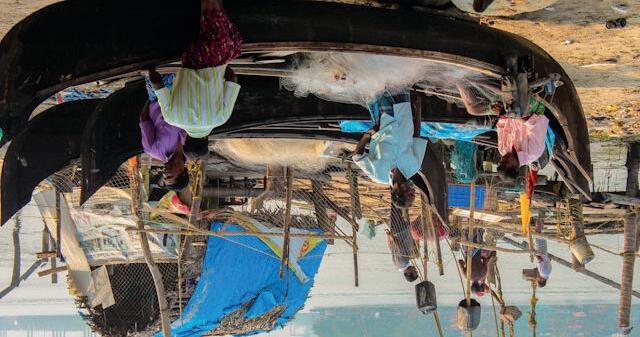
Ne Netotoor or / K Kannnananknkul u an angara r Sp Spararesselely y po popupulaateted d re residedential ar area ea w witth h en e ga gagegemement nt i in n fi fishshing an and ag agri r cu cultlturure e as w welell as s smaall bu buss s innesess. s
es
Will l lllinngtgton on I Islslannd
A bu busy sy c comommeri r ca c hu hub ne near a the he centre r re e o of f Co Cochchin n por o t. t W Wel l us u ed d for fe ferrrry y tripps s be betwweeeen n in inlaland n and Fo F Fort rt k kocochi hi It h has as tououririststic nodes wi with th hererittagage e siitetes s an a d upmark rkket h hot o els. s T The h i islslan a d’s section no nortth h of t the m mot o or orwaway is scenic and nd n a popopulular a dessti t naati t on thanks to o sc scen e ic c w walalkwkwayays s al alon o g the mout utth h of t the h r rivver er Re R si s dent n s typically y ow own n bu busi s ne n ss s o on n th the e island or wo work i inlnlanand. d
Mattench c er erry ry
Diverse neig i hborhohoodods s in n culture and socio economic backgr g ound n s. Promina naant nt touristic area and n with bu busy sy mark r et roads and n businesse se ses. s
Employment rate in different wards(%)
Fig.4a.7. Kochi’s female and male population in the labour force (Based on Department of Economics and Statistics 2018).
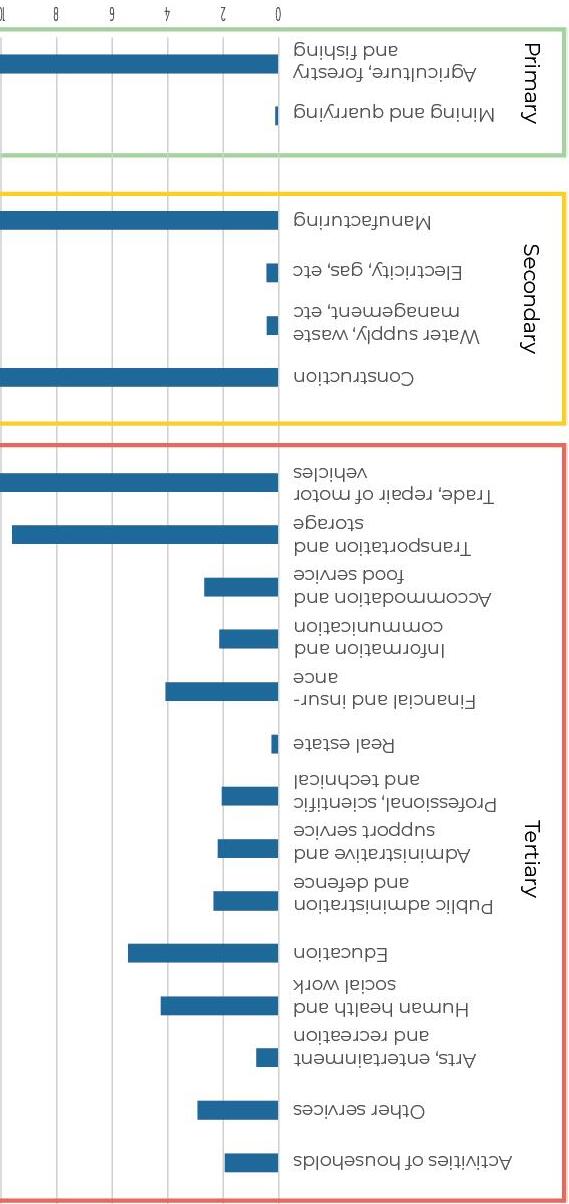
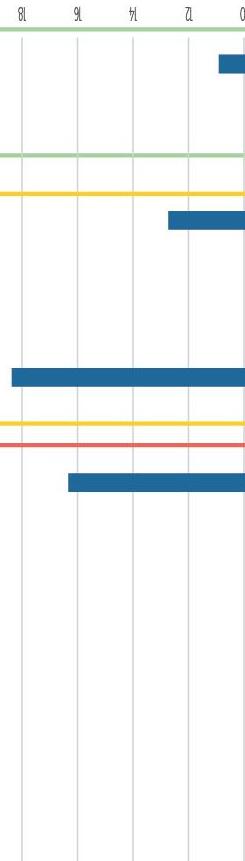
Fig.4a.6. Distribution of employment workers in Kerala in urban areas, 20172018 (Based on Department of Economics and Statistics 2018).
Fig.4a.5. Unemployment in rural and urban areas in India and Kerala (Based on Department of Economics and Statistics 2018).
Kochi’s population in the labour force by gender
Fig.4a.8. Employment
in wards of Kochi (Based on Liveable
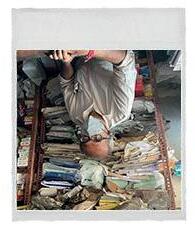
INFORMAL ECONOMY
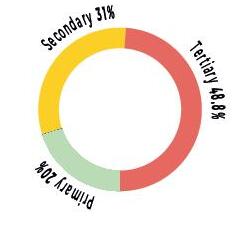
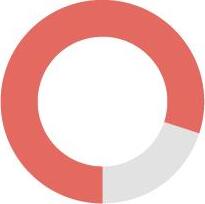
The urbanisation in Kochi has accelerated a process of casualisation of labour within secondary and tertiary sectors and failed to generate rapid growth of regular employment in modern, organised sectors. Kochi’s population is classified into labour force, migrants and not in labour force. The structure of the labour market in the city is characterised by the informal sector and casual labour, and this accounts for 80% of the total employment sector. More than one fifth of the unemployed population live in slums, where the rate of informal work is higher than in other urban areas. On a city level, 15% of poor and about 9% of non-poor households are not employed, where 45% of the population earns their livelihood as daily wage earners (Ramamoorthy 2021).The informal sector, despite being a huge contributor to India’s GDP, is often neglected when it comes to supportive policies especially in times of crisis (Waite 2001).
IMPACT OF COVID-19 PANDEMIC
The COVID-19 pandemic has inflicted a shock to the economy and severe stress on state finances, with Kerala’s economy suffering a Gross State Domestic Product (GSDP) loss of ₹1,56,041 crore between 2020-21. This has resulted in an increasing incidence of poverty among the most vulnerable communities, particularly the ones dependent on informal employment. During the COVID-19 pandemic, the opportunities for informal workers has been severely affected due to the ‘social distancing’ policy and the several local and national lockdowns imposed. These measures implied minimising contact with the outside world, making it impossible for some population groups to earn their wages and survive (Ramamoorthy 2021).
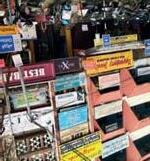
Several sectors have been greatly impacted by the new measures - namely the street vendors. Markets being shut down meant no income, so they became ‘mobile vendors’; moving around constantly to try and evade the police in order to find a market or clients despite increasing their exposure to the pandemic. Auto-rickshaw drivers have also seen a massive drop in demand. Daily wage labourers could not find work. Those in the hospitality business have seen a drastic drop in demand, as well as catering services. Wholesale markets have shut down across states affecting multiple trades and vendors throughout the supply chain. Agriculture workers were forced to sell their wares at low prices to the limited local market. Day labourers have been forced to return to their places of origin (Ramamoorthy 2021).
Fig.4a.12. Geographical distribution of economic sectors in Kochi.
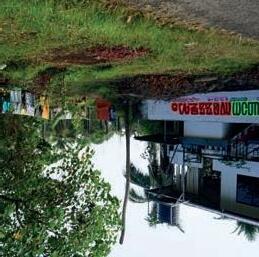
Fig.4a.10. Trade in Ernakulam Market.
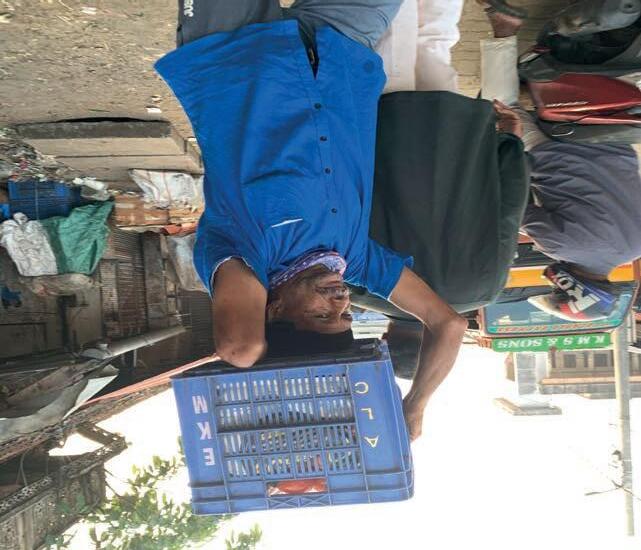
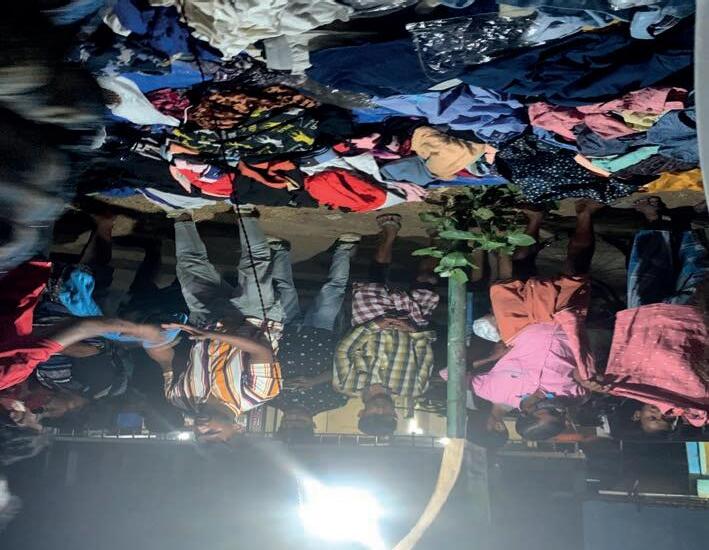
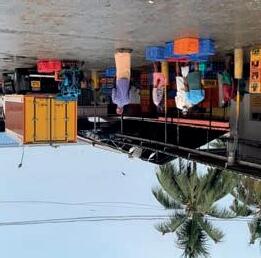
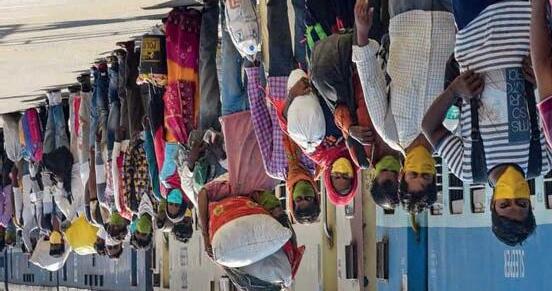
Fig.4a.11. Migrant workers at the evening pop-up market, Perumbavoor.
80% Informal Sector
Fig.4a.9. Economic sectors in percentages (Based on Ramamoorthy 2021).
Formal and Informal Economy in Kochi
1
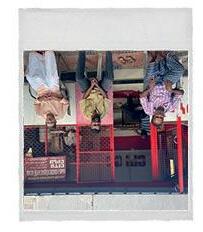
DIASPORA MIGRATION
Kerala has become a top destination for domestric migrant workers in India thanks to the higher wages and booming construction and manufacturing industries among others. This along with the state’s falling birth rate, and a trend of emigration to the gulf countries has made migrants indespensible to the economy (Parida and Raman 2021).
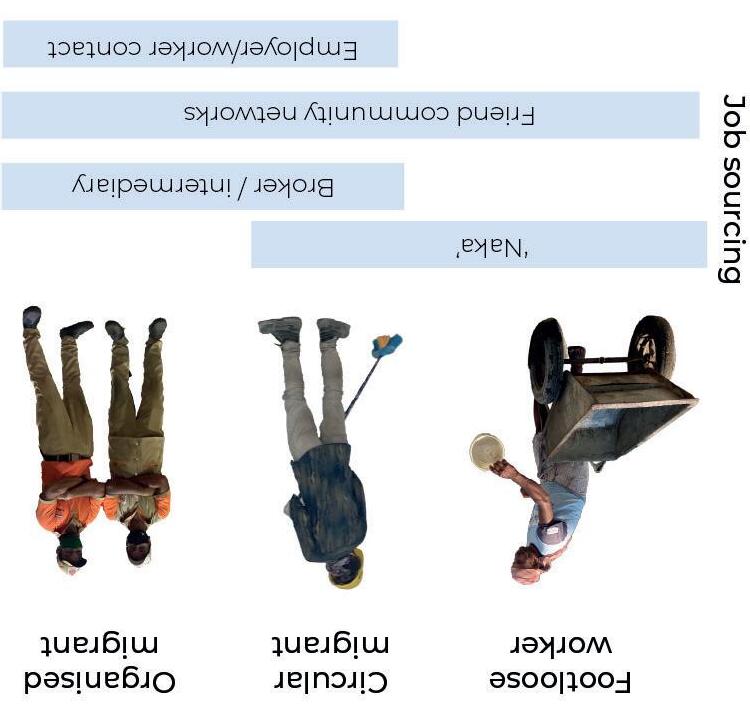
Migrant labourer job sectors
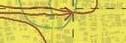
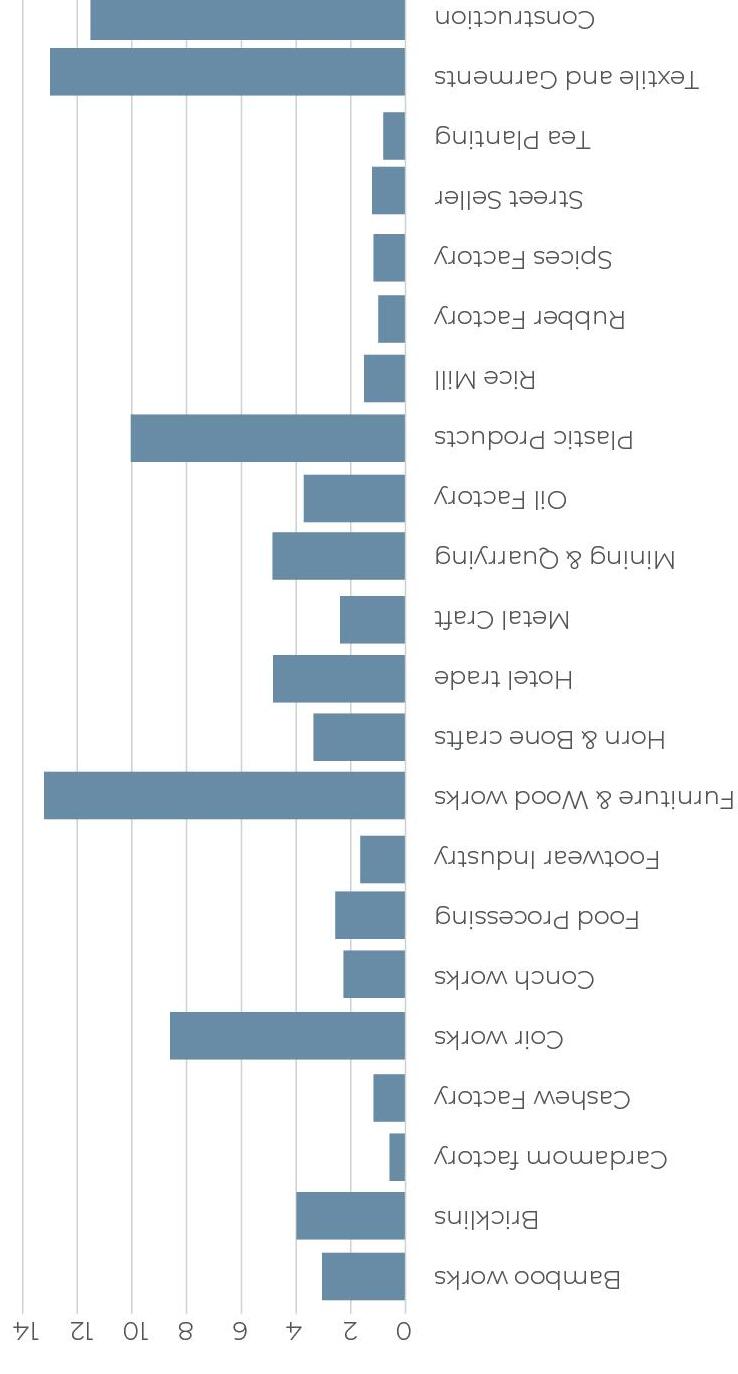
Informal labour markets known as ‘nakas’ are typically road junctions where migrants cluster in search of jobs typically in construction, manufacturing and agriculture. This informal practice places migrant labourers with some vulnerabilities such as job insecurity, wage disputes and unsafe, unregulated work place practices (Benoy and others 2020). It must be noted that locals also participate in informal work in these sectors but are less vulnerable due to established networks.
Age Distribution of Migrants in Kerala
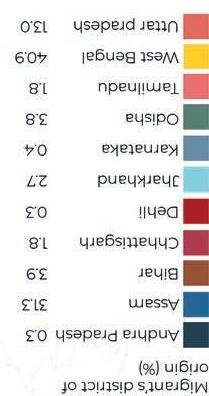
An estimated 3.5 million interstate migrants live and work at any given time (pre-pandemic numbers) in the state of Kerala. Major home states include northern regions Bihar, Pradesh, Tamil Nadu and West Bengal. The wages in Kerala are some of the highest across India, and that fact in addition to the demand for low and unskilled labour has made Kerala a top choice for economic interstate migrants. Interestingly, Keralites have been migrating out of India to Gulf countries, often working in the same low and unskilled roles (Benoy and others 2020). This is for the same reasons, as the wages are higher and the population feels that they have out-skilled themselves from the labourers’ jobs.
Employment patterns in Kerala Duration of Interstate Migration
Fig.4.a.x. 1 in 9 people in Kerala is a migrant (Based on Parida and Raman 2021).
Fig.4a.13. Types of migrant labourers in Kerala (Based on Parida and Raman 2021).
Fig.4a.15. Distribution of migrant workers of Kerala by their industry of employment(%) (Based on Parida and Raman 2021).
Fig.4a.14. Age of distribution of migrants in Kerala, 2017-2018 (Based on Parida and Raman 2021).
Fig.4a.16. Employment patterns in Kerala, 2017-2018 (Based on Parida and Raman 2021).
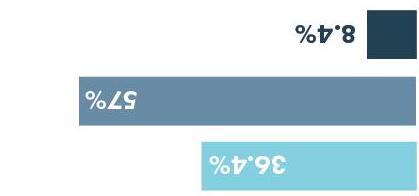
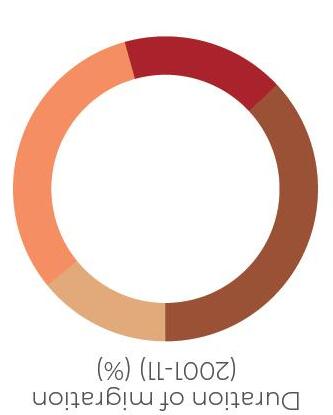
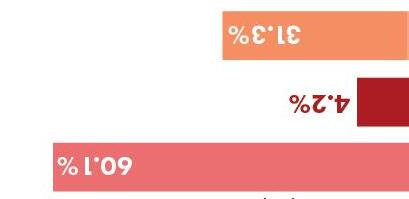
Fig.4a.18. Duration of interstate migration in Kerala, 2001-2011 (Based on Parida and 2021).
in 9 people in Kerala are a migrant worker in the labour sector. Forming an essential part of the economy and the development of the city, their welfare needs to be prioritised (Benoy and others 2020).
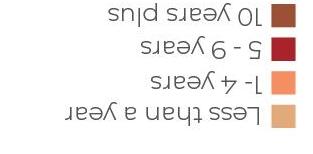
Fig.4a.17. Origin of migrants (Based on Parida and Raman 2021).
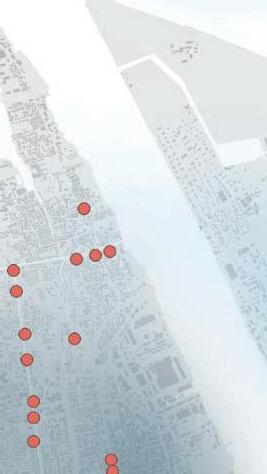
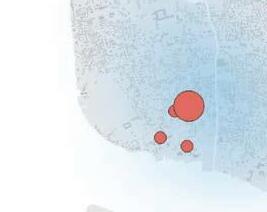
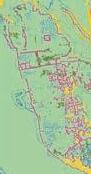
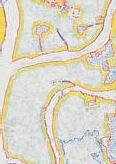
PERCIEVED SAFETY FOR WOMEN BASED ON GENDER DIVERSITY
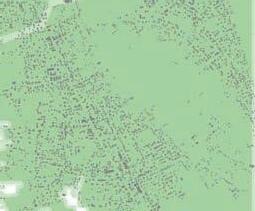
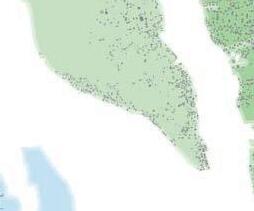
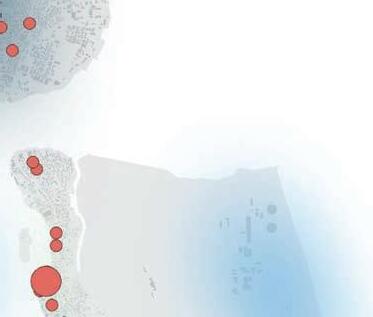
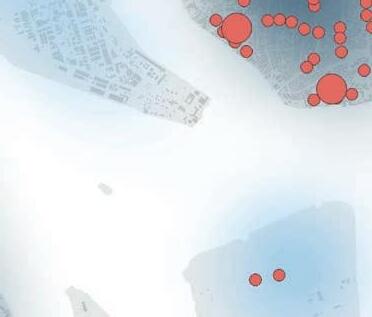
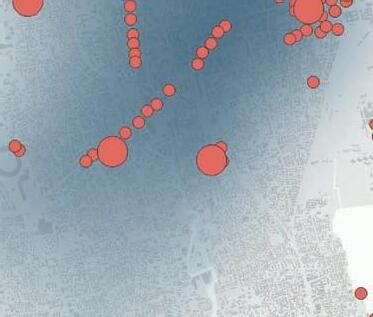
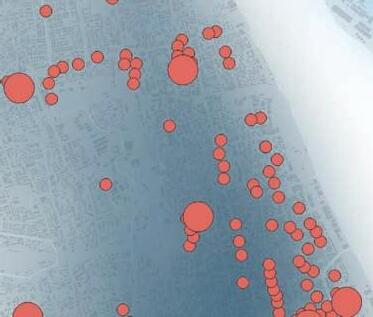
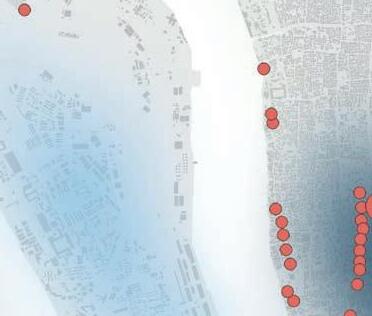
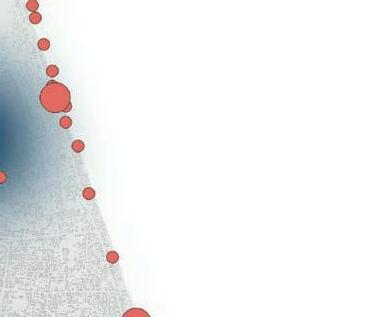
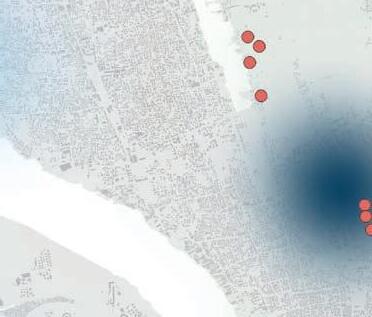
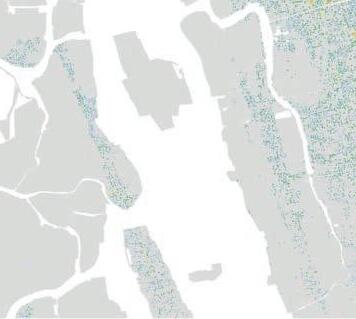
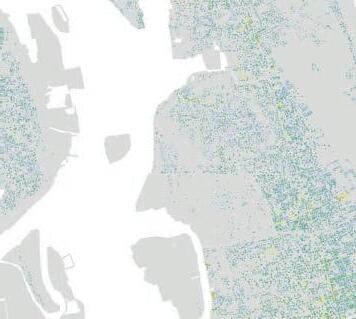
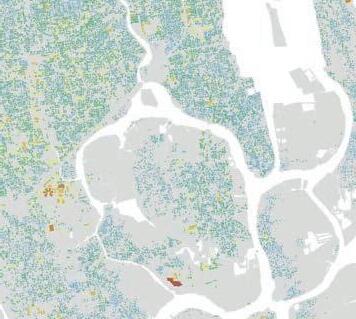
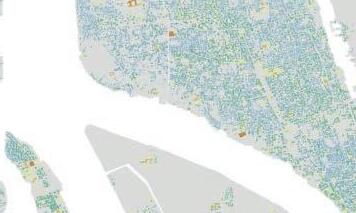
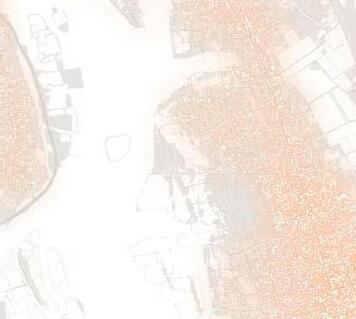
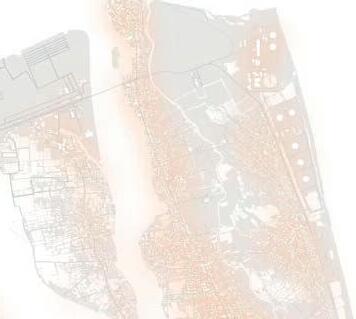
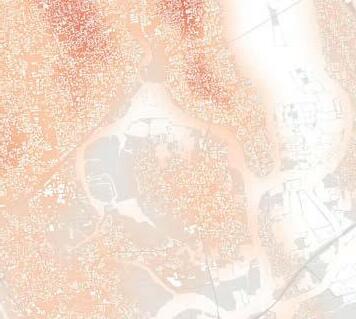
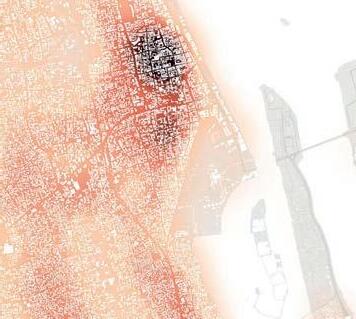
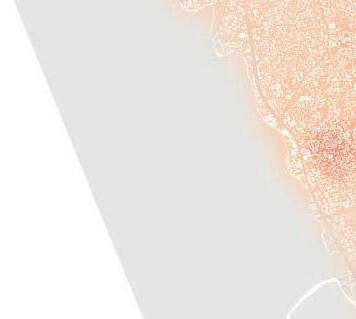
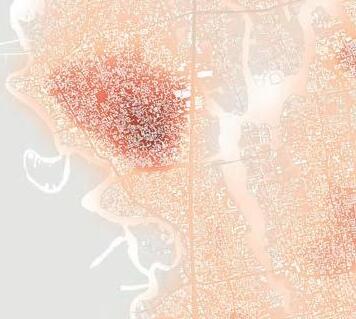
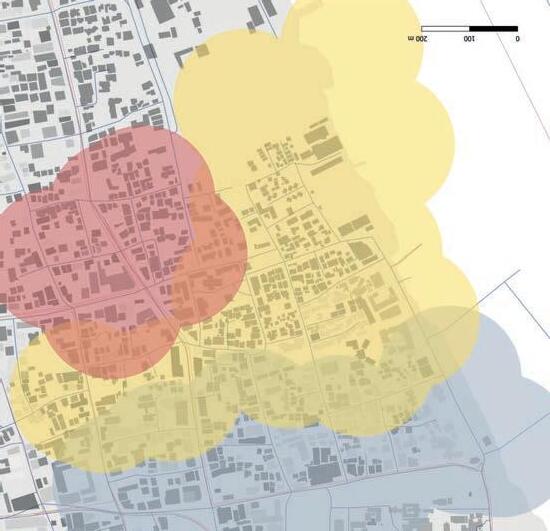
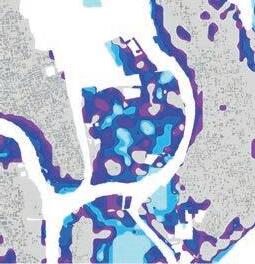
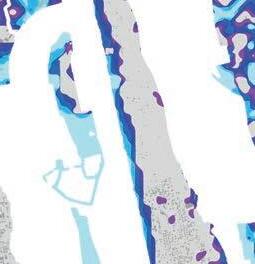
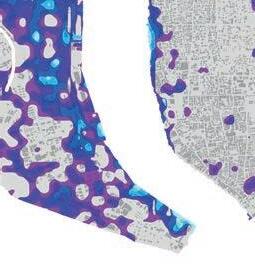
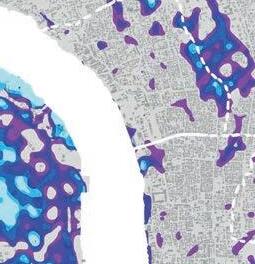
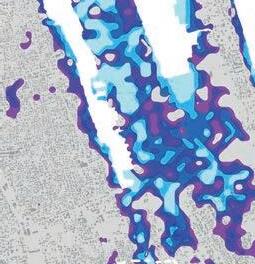
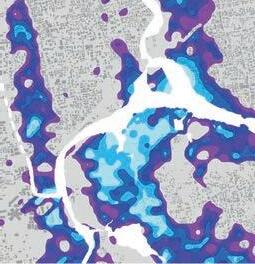
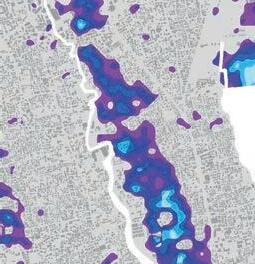
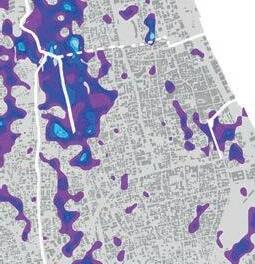
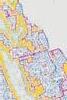
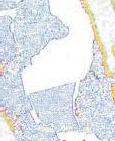
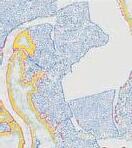
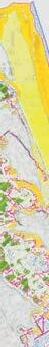
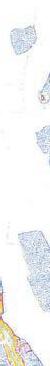
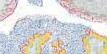
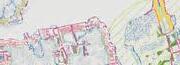
Women and other vulnerable groups typically feel less safe in public spaces where they are underrepresented (Sanghamitra and Ajay 2021). To understand women’s presence in public spaces in Kochi it is critical to understand the gender disparity they experience. By overlaying the population density, and female population density maps (Fig.4a.29.), a direct correlation between the two studies is revealed, indicating that the ratio men:women is constant across Kochi. However, when compared to the presence of women in public space, a sharp difference is noticeable. This indicates that something is causing the reduction of women in public, compared to private space. From Safti-pins data, it is evident that within Ernakulam the greatest inequality in public space was identified at the top of Marine Drive and within the market (DIVAW n.d). However, it should be noted that there are significant gaps in their data.
By taking a sample of photos across Ernakulum market and Marine drive, a pedestrian count was conducted and split by perceived gender in each photo, mapping the ratio spatially across the photos. During fieldwork, women around Kochi market were asked to identify where on the map they did not feel safe (no reference was made to women’s safety within the question to avoid bias). Their answers predominantly identified the market and marine drive areas, and retail lots appeared to reduce gender diversity in public space.
Crowdsourced perceptions of Gender Usage Source: Safetipin
“Kadavanthra Junction”
“Busy so everyone touching, normal, but nothing worse ” “This Place is not safe sometimes, For Girls”
“This Place is not safe”
“Marine Drive”
Fig.4a.31. Crowdsourced perceptions of Gender Usage Ermakulam.
Fig.4a.30. Crowdsourced perceptions of Gender Usage Kochi (Based on Safetipin n.d).
Fig.4a.29. Female Population Density vs Population Density (Based on Safetipin n.d).
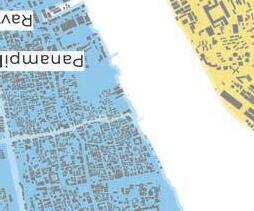
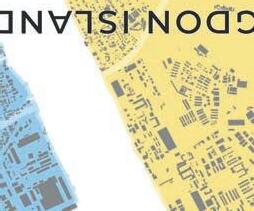
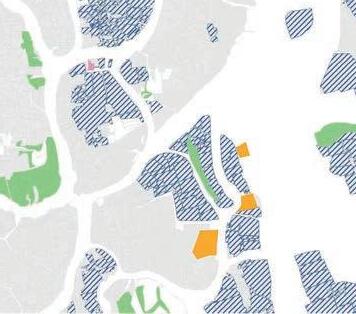
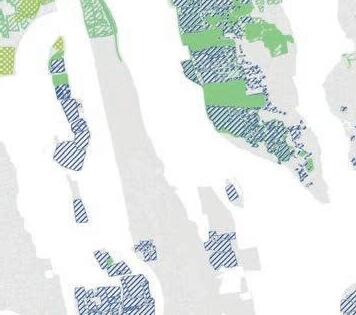
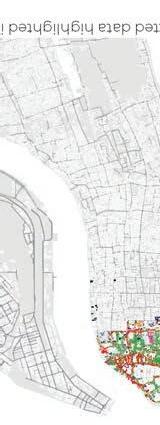
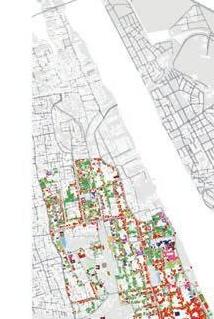
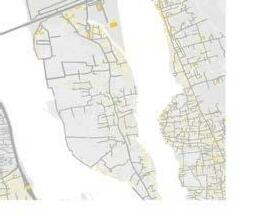
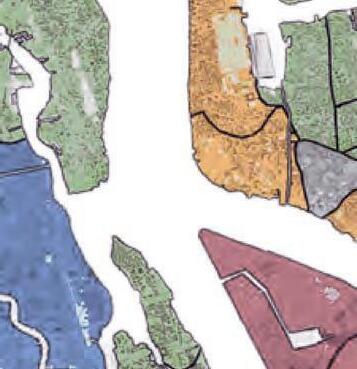
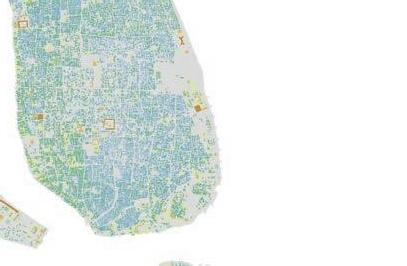
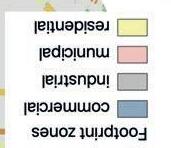
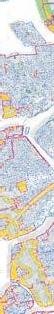
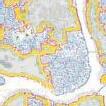
ENCLOSURE AND SOCIAL RELATIONSHIPS - ERNAKULAM
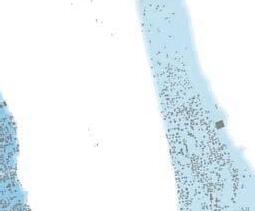
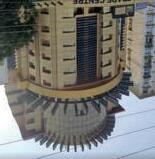
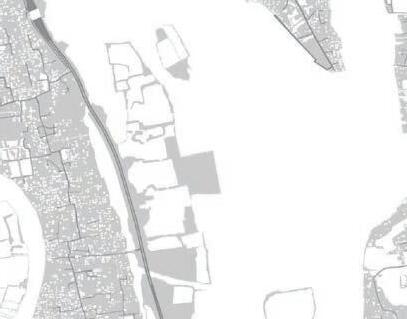
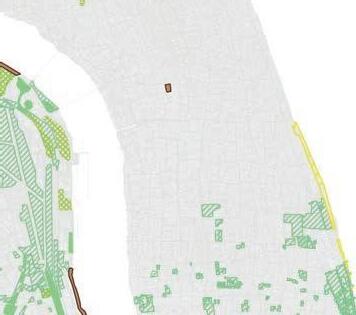
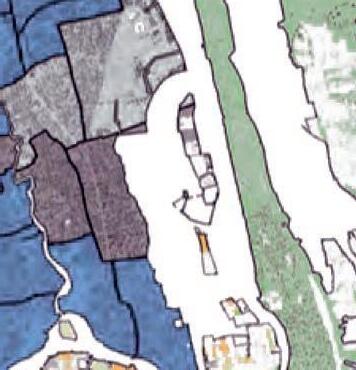
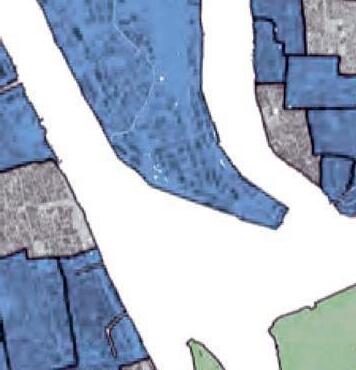
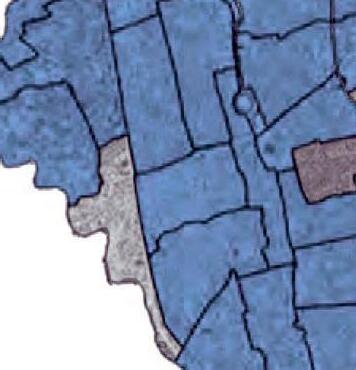
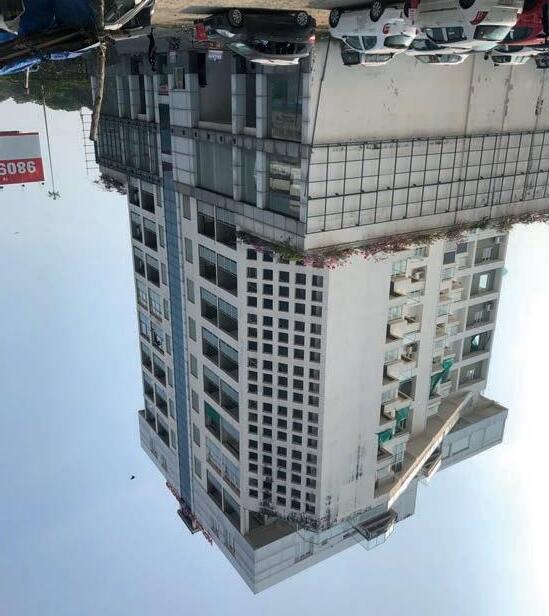
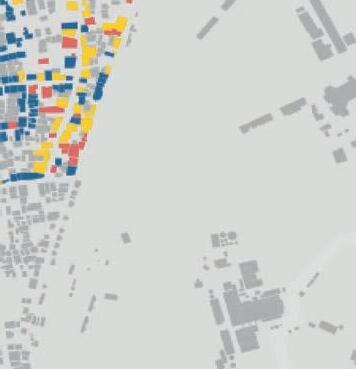
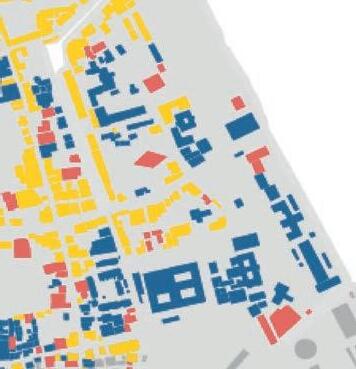
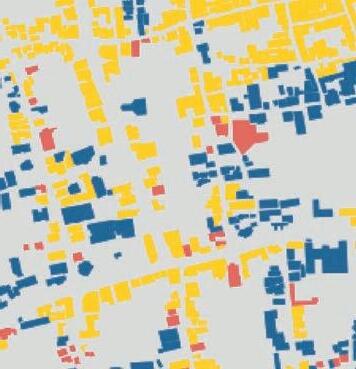
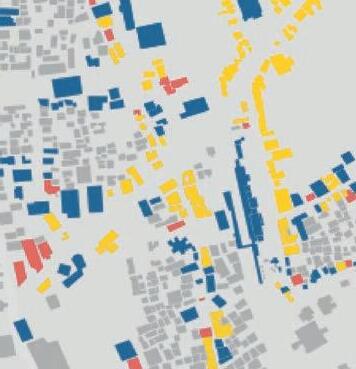
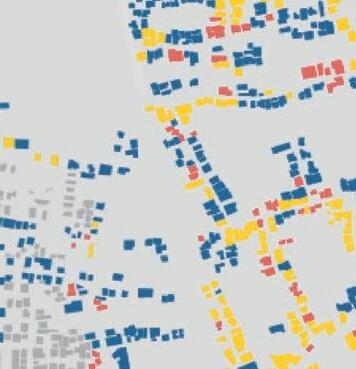
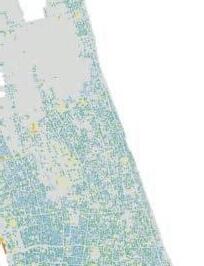
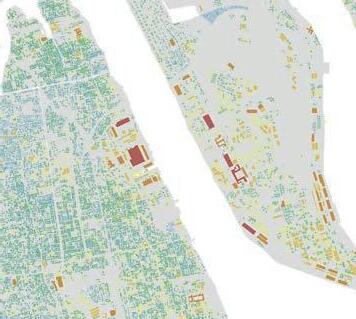
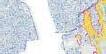
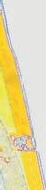
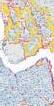
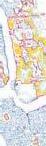
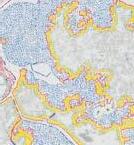
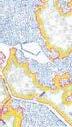
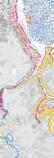
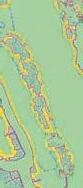
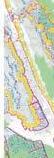
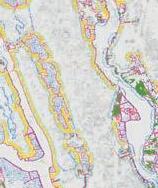
Since the 1990s, India has embraced a form of neoliberal capitalism practiced in much of the developed world. However, combined with the nation’s rapid urban and economic growth, this has led to several less than desirable abstractions of “Westernised“ development (Ghosh 2017). These include abstractions of the American ideal of private property, with gated communities segregated by fences and walls from those beyond. As has been proven in research, these structures are neither safer, nor more liveable – and act only to segregate and stratify social classes between those within and outside. These tower blocks have broken up clear pedestrian pathways, ebbed away at traditional typologies, and diminished street vitality and civic participation in growing measure.
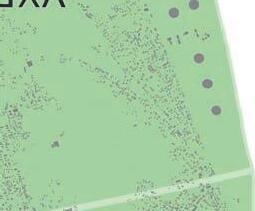
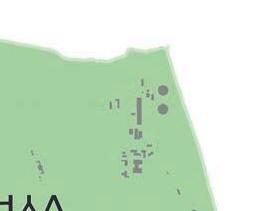
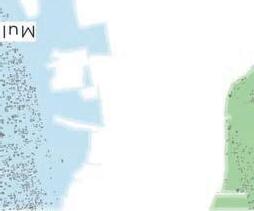
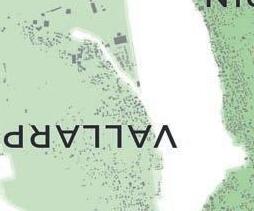
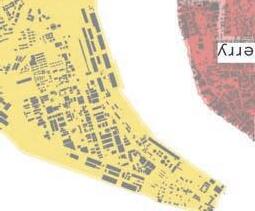
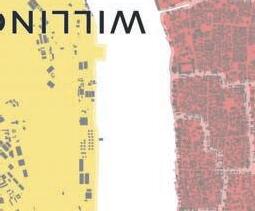
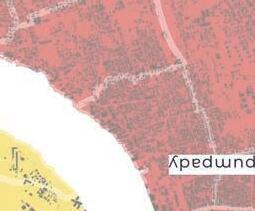
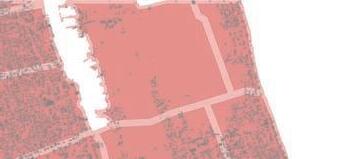
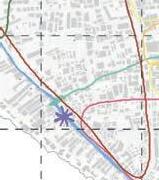
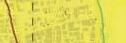
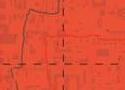
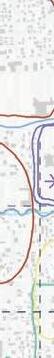
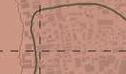
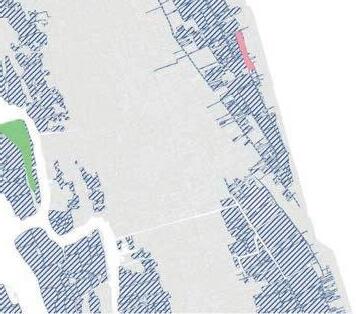
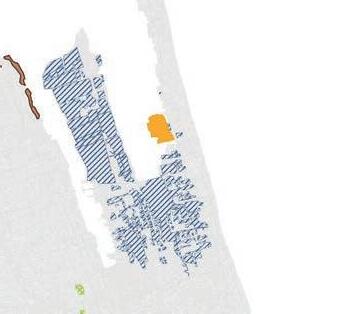
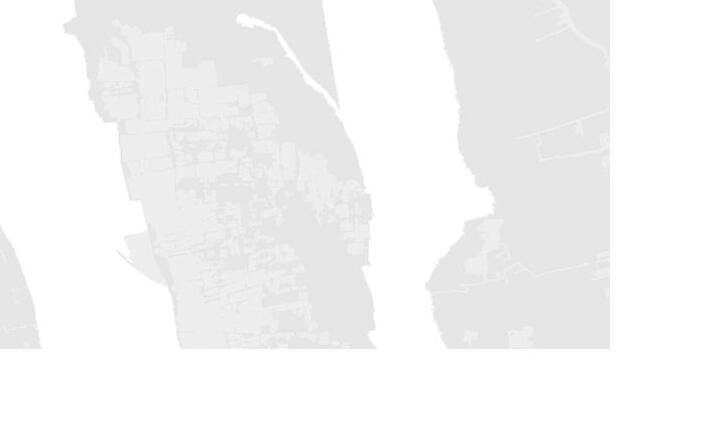
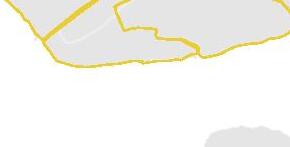
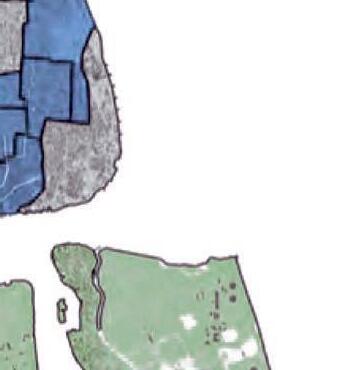
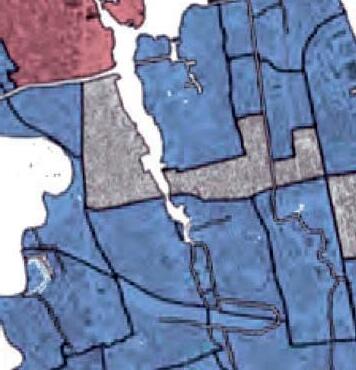
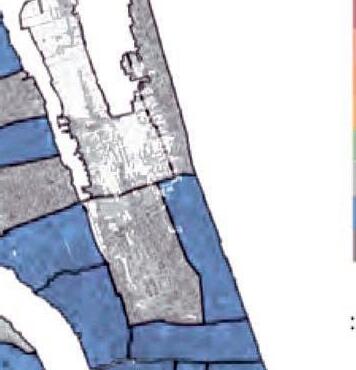
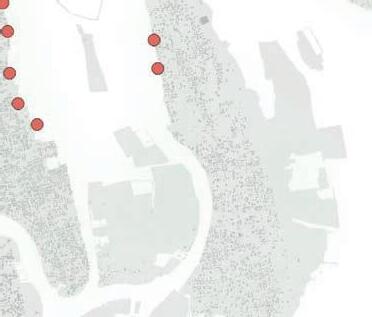
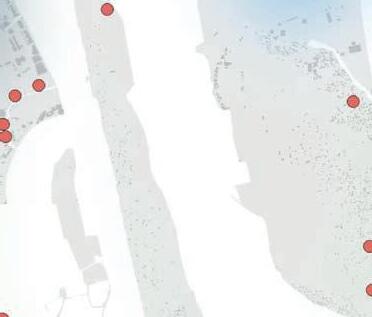
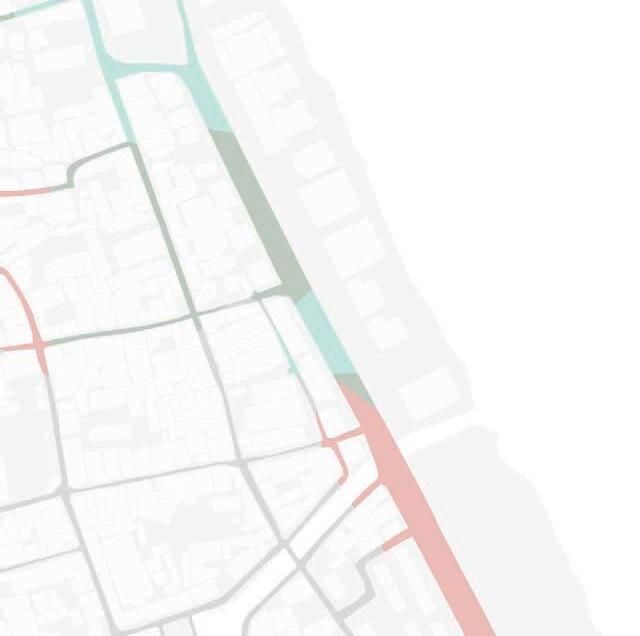
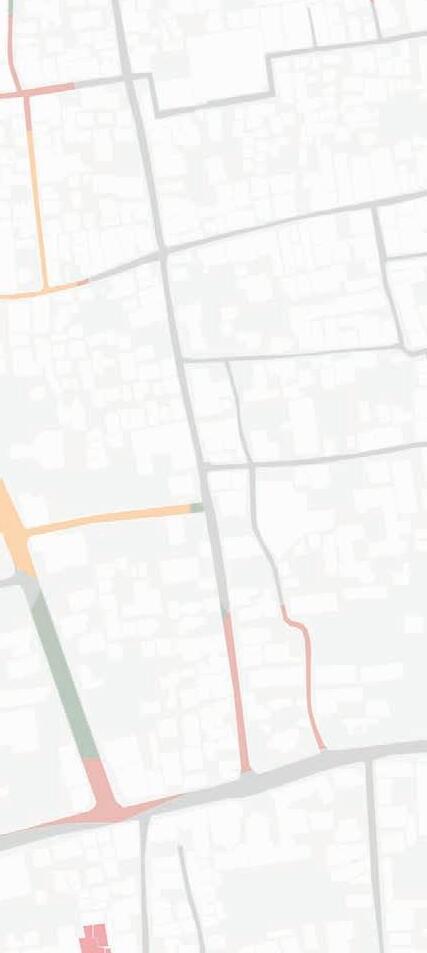
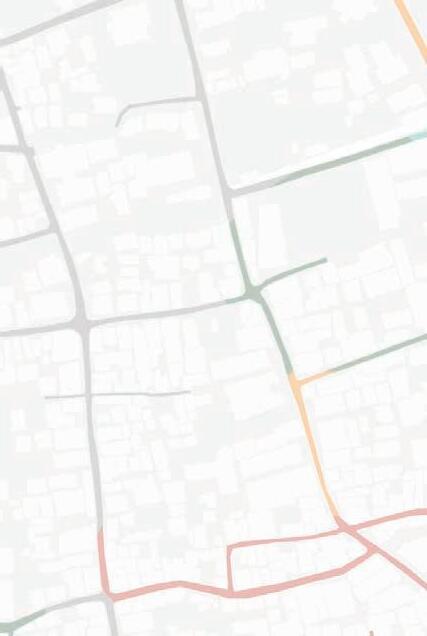
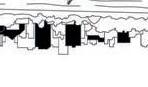
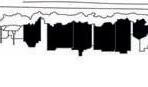
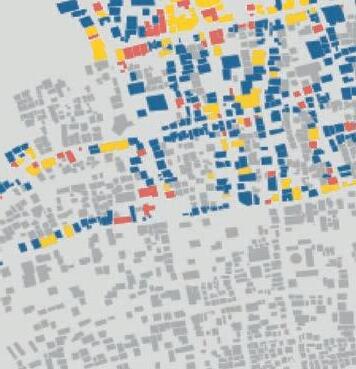
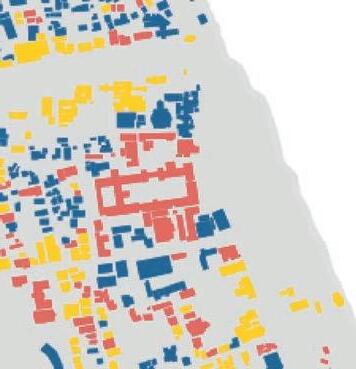
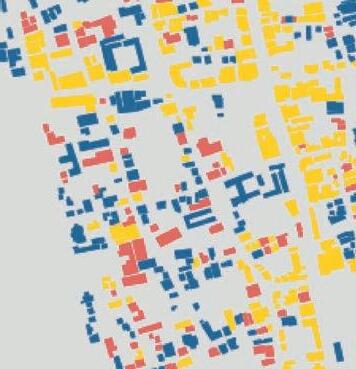
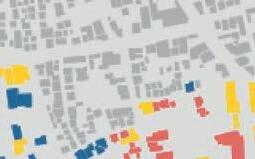
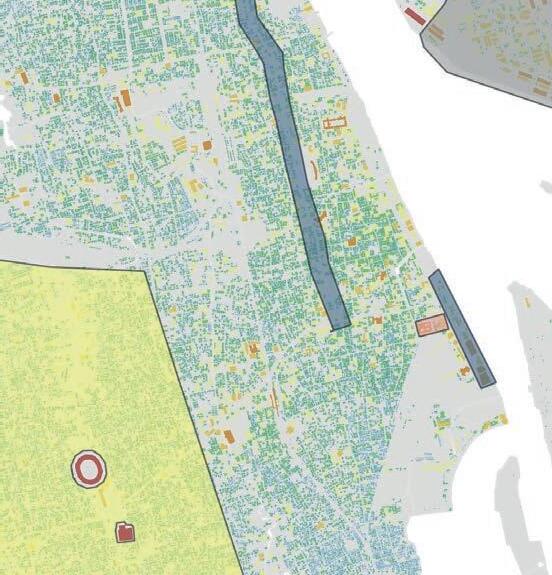
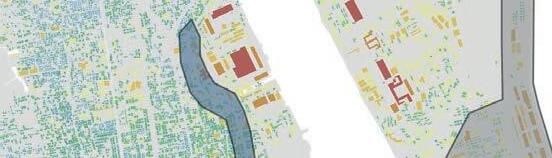
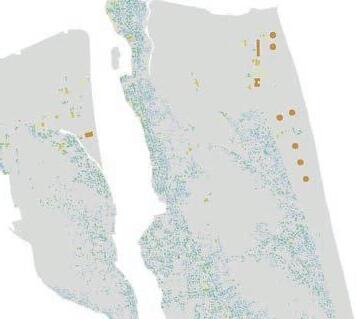
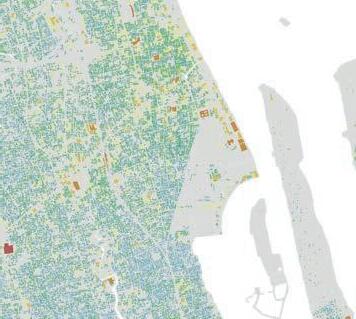
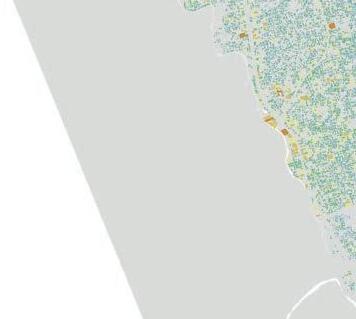
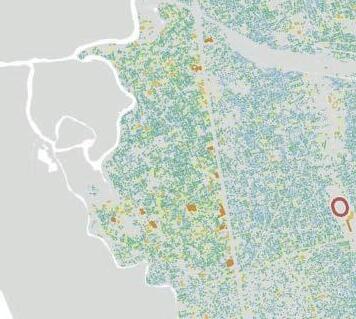
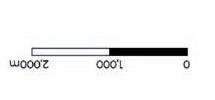
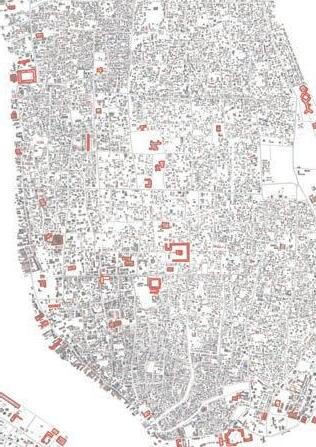
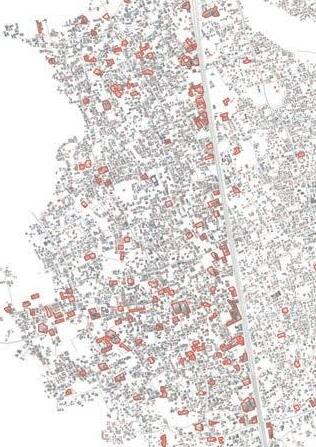
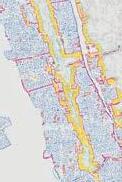
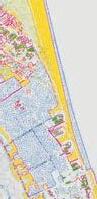
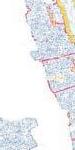
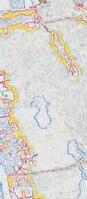
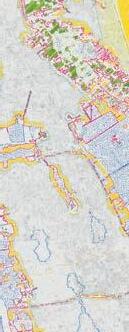
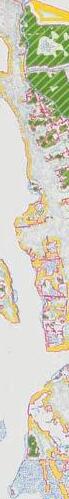
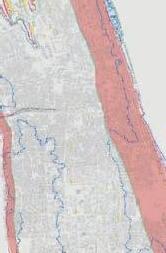
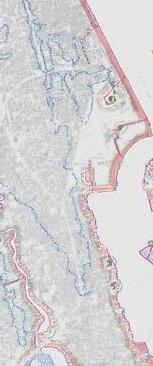
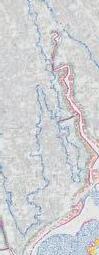
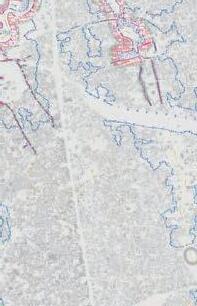
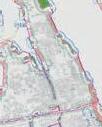
Ernakulam can be identified through the lens of “gatedness”; the scale of enclosure and boundary from the active urban streetscape. This was developed using a qualitative taxonomy of “gatedness”, or the level of physical and visual enclosure. Within this, level 1 (yellow) represents buildings which are fully open and permeable to the street, with open physical and visual access through. Level 2 (red) shows those buildings which are semipermeable, and generally physically separated from the public realm by low height walls or fences, albeit with a continuous visual link through. Finally level 3 (blue) identifies buildings which are entirely gated from the street, typified by controlled access and a total lack of visual link into the plots inner quarters.
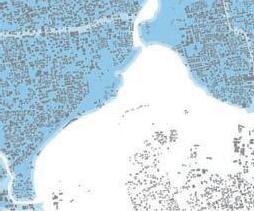
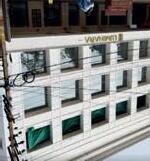
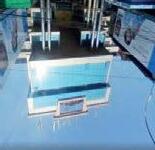
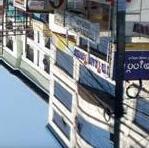
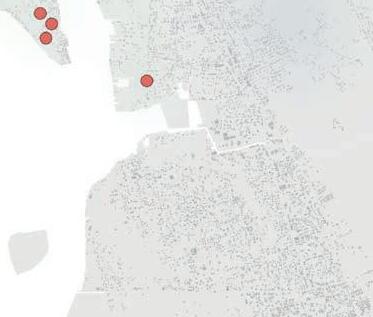
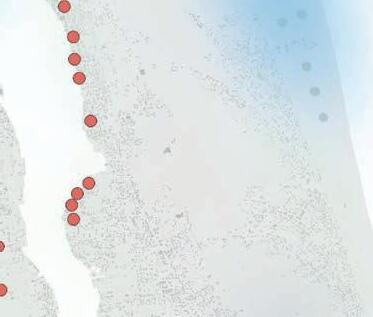
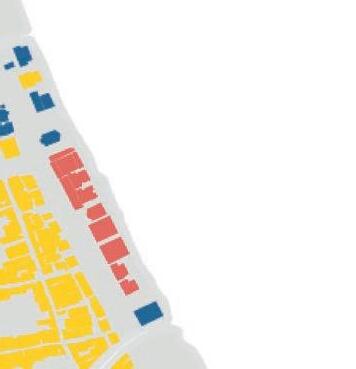
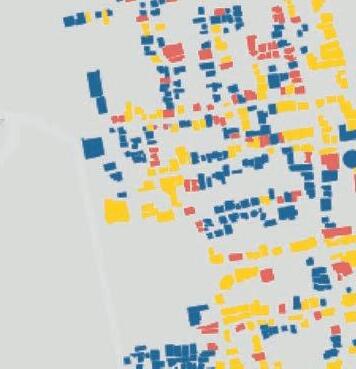
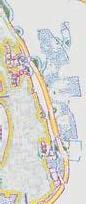
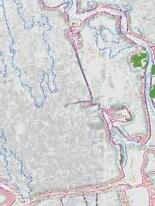
Ernakulam Market, and the long line of properties along MG Road are unsurprisingly the least gated areas of the city. This is a result of these areas retail focus - where shops are naturally open to the street and the opportunity of potential customers passing by. Alternatively the areas to the south of Ernakulam, near the so-called “institutional quarter” are characterised primarily by level 2 or 3 enclosed properties. These are mostly low rise private residential addresses, and their enclosure is therefore again unsurprising. n terms of gated tower blocks however, there is a significant outlying cluster. This is located along the reclaimed land of Marine Drive, adjacent to the sea. These are a mix of level 2 and level 3 10-15 storey concrete high rises built mostly in the 1990s, which house apartments and commercial retail. Many of these are abandoned however, or in a state of very low occupation.
Of the 3,222 buildings analysed in this map, 1,593 or 50% are level 1 and fully open to the street, 518 or 16% are level 2 and semipermeable, and 1,111 or 34% are fully enclosed (Mapillary 2019). However from historical analysis, it seems likely this latter figure has and will continue to grow as gated and enclosed properties become a more sought after norm.
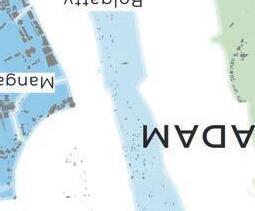
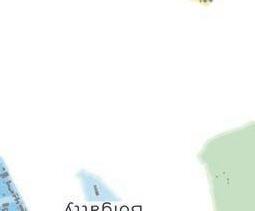
CENTRAL ERNAKULAM AND MARINE DRIVE
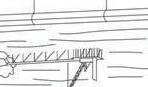
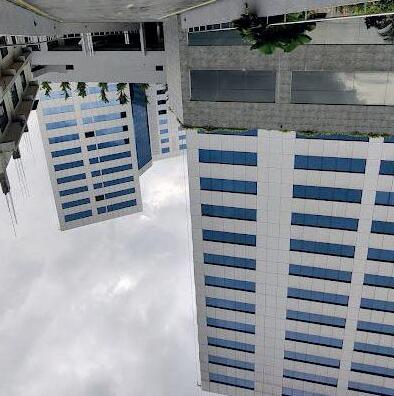
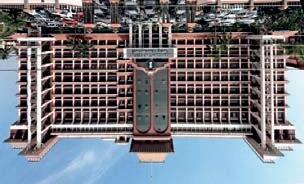
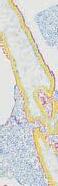
The row of gated tower blocks along Marine Drive’s waterfront can be characterised as “islands“ in both senses of the word. Literally - sitting atop a long stretch of reclaimed land raised from the seabed, but also metaphorically - each a gated stratified unit, enclosed from the street by security and walls, and segregated from the liveable cityscape by lines of traffic and vast stretches of tarmac. These buildings are predominantly used for commercial and residential purposes - high end flats, a shopping mall, and corporate offices - very much Westernised spaces, which have supplanted the traditional fishing seafront that once occupied their sites. Indeed thus “islands“ both physically, metaphorically, and culturally, isolated from the interactions and rich history of Ernakulam. Closing in the evenings, and left poorly lit at night, they are yet further segregated from the cityscape temporally, and in terms of accessibility.
Gatedness analysis in
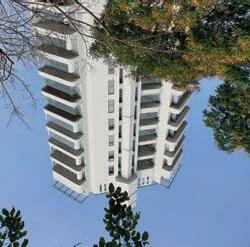
Fig.4a.52. High-rise typology seen across Marine Drive.
Fig.4a.53. Visually oppressive tower blocks in Ernakulam.
Fig.4a.54. Percentage and levels of gatedness in Ernakulam.
Ernakulam
Fig.4a.55. Gated buildings in Ernakulam.
Fig.4a.55
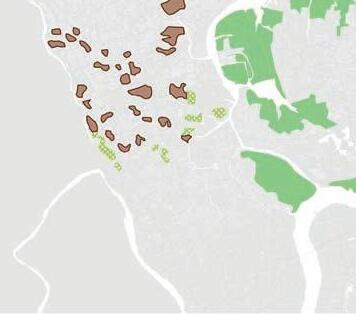
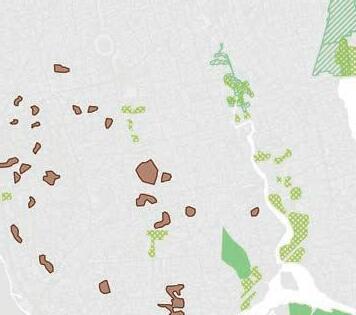
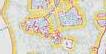
SPATIAL STRATIFICATION BETWEEN COMMUNITIES
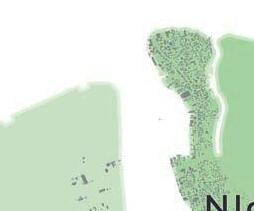
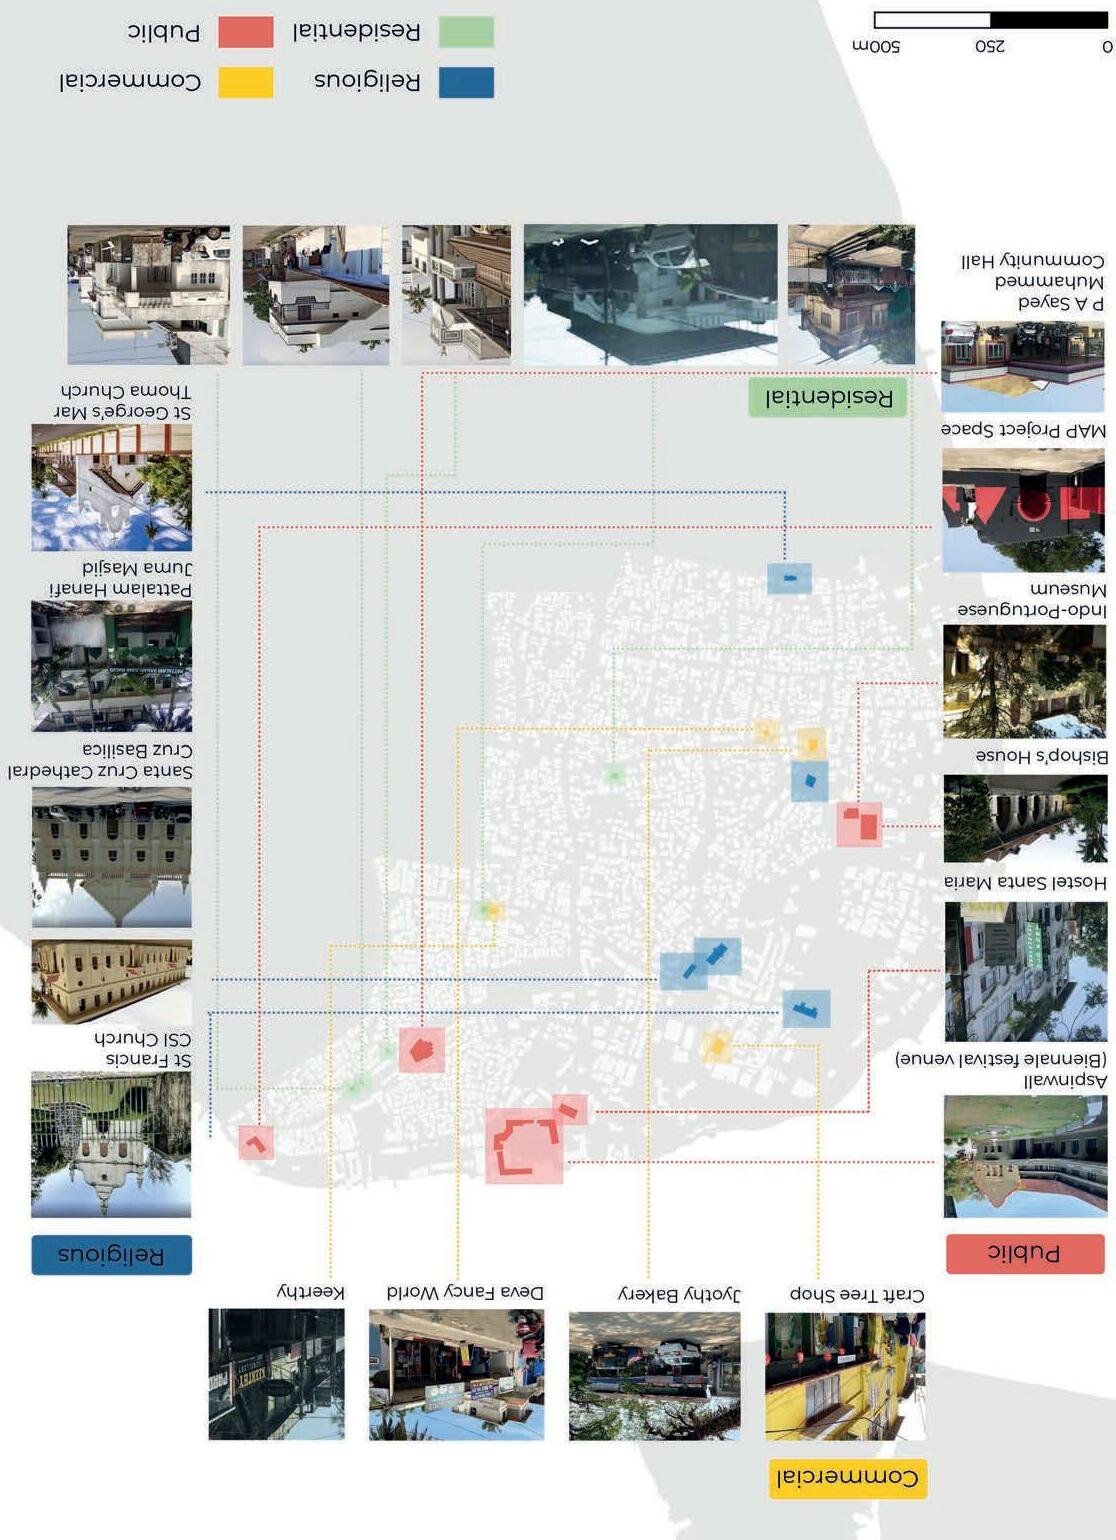
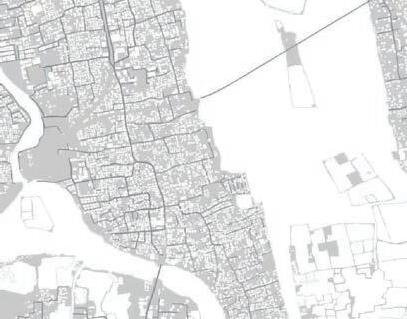
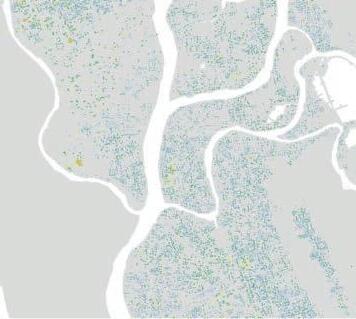
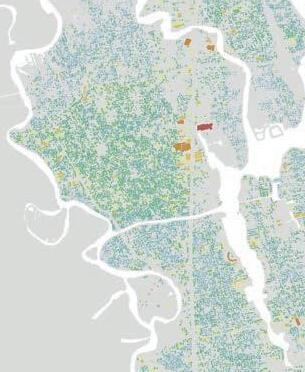
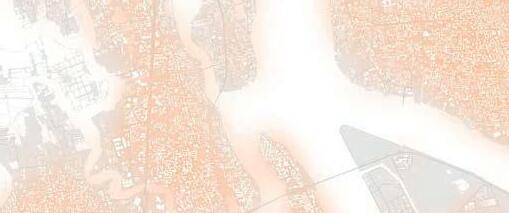
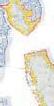
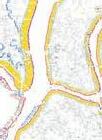
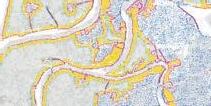
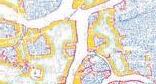
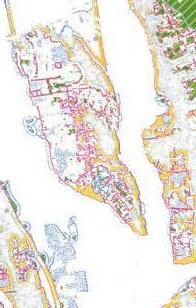
Five hundred years of migration have left Kochi with a deep sense of multiculturalism, with at least thirty two communities, speaking at least sixteen languages. Each one of these communities have different cultural and social backgrounds and are spatially congregated within Kochi. This has resulted in each neighbourhood having their own unique identity, based on their different lifestyles and beliefs. Sociologist Ashis Nandy undertook a study on Kochi’s unique identity by studying its residents in 2014. He ‘found that communal harmonymwas based not on any principle of secularism, but on mutual dislike between communities. Further, he stated that;
“Every community thinks that they are the best and have negative comments about the other community. They also know that the other community also thinks the same about themselves. But people are accustomed to living with differences.” -Ashis Nandy
This report reinforces that there are clear differences between cultural groups (The Hindu 2014). As shown on the next pages, further research was conducted while in Kochi through surveys, mapping exercises and stakeholder interviews to understand how these cultural differences are translated within the spatial form of Kochi.
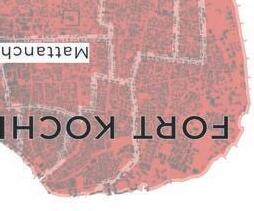
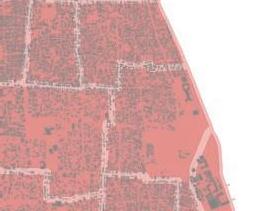
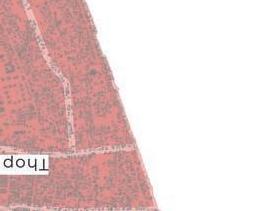
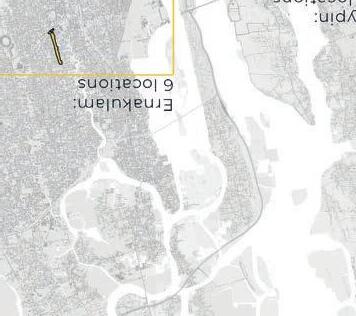
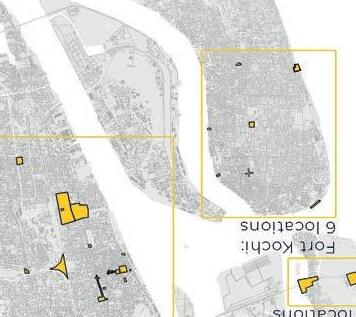
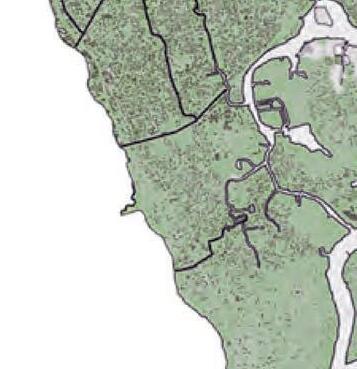
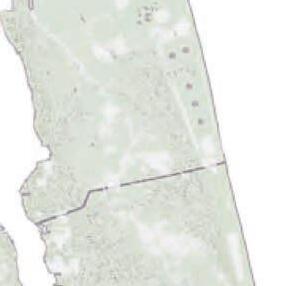
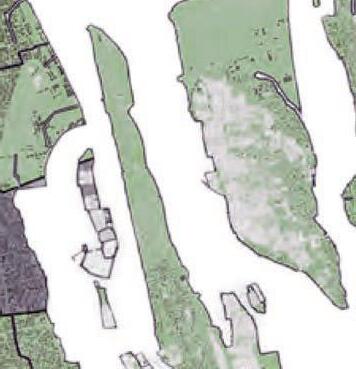
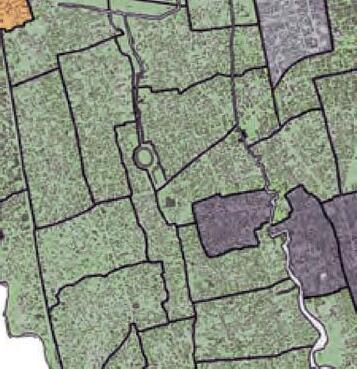
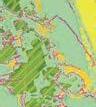
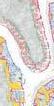
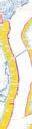
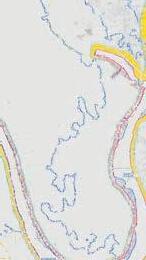
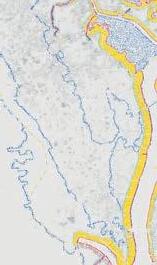
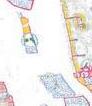
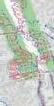
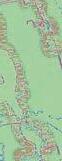
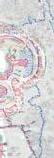
Fig.4a.58. Cultural Map of Fort Cochin.
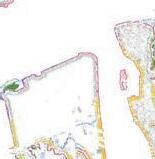
Cultural Map of Ernakulam.
Fig.4a.56. Stakeholde interviews with Kochi residents.
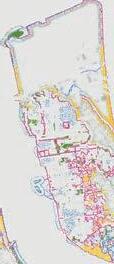
Fig.4a.59 Cultural Map of Kochi.
Fig.4a.57. Cultural
SUMMARY OF FINDINGS
In sub-chapter 4a the socio-economical issues of Kochi were analyzed and the main areas of action were revealed.
Kochi’s population is increasing rapidly and even though this event has improved the economic prosperity of the city, it has also strained its infrastructure. In efforts to cover the needs of the rising population, the often unplanned city developments has resulted in slum creation and have caused problems like traffic congestion and pollution for the densely populated areas of the city.
The urbanisation in Kochi has also accelerated a process of casualisation of labour within secondary and tertiary sectors and failed to generate rapid growth of regular employment in modern, organised sectors. The informal economy accounts for 80% of the total employment sector and despite being a huge contributor to India’s GDP, is often neglected when it comes to supportive policies especially in times of crisis.
Kerala is the most literate state in India, with Kochi having an average literacy rate of 85-95%. However, despite the economic growth, regional development and high literacy rate, there is a decline in employment rate (average working population is between 35-40%). It is also important to highlight that of the total job seekers in Kerala up to July 2020, 63.6% are women, with the rate of female unemployment being much higher than the national average.
The high education level of Keralites has led not only to a high levels of educated unemployed, but also to a disdain for manual work in preference for white collar work. With many educated labour forces driven to migrate to other parts of India and abroad for employment, there has been an influx of workers from other Indian states to fill manual jobs that Keralites prefer not to occupy. 1 in 9 people in Kerala are a migrant worker in the labour sector, making migrants indispensable to the economy.
As people in Kochi become more educated, public health and sanitation have become more widely understood by more people with broader access to education. A more equitably distributed healthcare system has contributed to Kochi having low mortality and high life expectancy rates amongst other Indian cities. These conclusions favour education in terms of building a more inclusive and equitable society despite the economic transitions it requires.
Generally, the greater the literacy rate of a state, the lower the crime rate. The theory that literacy and crime rates are inversely correlated has not held true in the case of Kerala which has a high rate of 31.4% in criminal rioting against the national average of 6.2%. Fieldwork research was conducted to identify areas in Kochi of perceived safety for women based on gender diversity, revealing the areas of Ernakulum market Marine drive, and retail lots as areas of underrepresentation and thus offering a feeling of unsafety
Kochi is abundant with hospitals, medical centres, and pharmacies. However, it is important to reduce the burden on these services by promoting healthier lifestyles and reduce the impact of pollution on health In terms of mental health, Kerala’s suicide rate is more than double India’s and people living in Kochi, a metropolitan city, have a higher prevalence of developing mental disorders and high suicidal risk. Even though the issue is still deeply stigmatized, it needs to be addressed.
As arable land of Kerala continues to decline due to rapid urbanisation, essential ingredients for Kochi’s traditional cuisine become inaccessible and threatens Kochi’s cultural heritage and increases the reliance on sourcing food from further afield.
Kochi is a multicultural city with many communities of different cultural and social backgrounds which are spatially congregated. This has resulted in each neighbourhood having their own unique identity, based on their different lifestyles and beliefs of the communities that occupy them. However, spatial stratification is evident through morphological analysis of said neighbourhoods which divides the communities further. This event along with the creation of gated blocks and buildings segregates the city in a multitude of negative ways, and reduces the opportunities for social interaction overall.
INFRASTRUC- TURE 04b
This sub-chapter analyses Kochi’s infrastructural assets. The starting point of the analysis is the premise that the city is sprawling Eastwards, which is visible in the urban expansion time-line (Fig.4b.1.). The rest of the points of analysis follow the causes and effects of the sprawl from the point of view of the different infrastructural elements which compose the city: built form, land use, mobility, transport infrastructure and sanitation. All analysis is placed in context through connections with other chapters of the booklet; in this way the most pressing issues and the connections between them are highlighted.
SPACE SYNTAX - KOCHI ___________________________________172
SPACE SYNTAX - ERNAKULAM ___________________________174
DRINKING WATER SCARCITY______________________________176
LACK OF PUBLIC TOILETS________________________________178
SURVEY RESULTS AND CONCLUSIONS ___________________180
SUMMARY OF FINDINGS ________________________________182
URBAN FABRIC DENSITY
The densest parts of Kochi are situated in 3 main areas, highlighting the different stages of development the city has gone through:
- The first stage is visible in the densest parts of Fort Cochin and Mattancherry (shown in samples B and C).
- The expansion on mainland is visible through the new city centre, especially Ernakulam Market (sample E).
- The expansion following 1990 is visible in the dense eastern extremities.
While a high density in the city centre is desirable in most cases, the expansion towards the East is especially problematic; the effects of this are further explored on page…
B. Fort Kochi
C. Mattancherry
D. Vallarpadam
E. Ernakulam market
F. Kadavanthra Papampilly nagar
G. Kaloor
H. Netoor
I. Veli
Fig.4b.7. Vypin
Fig.4b.6. Netoor
Fig.4b.3. Fort Kochi
Fig.4b.8. Mattancherry
Fig.4b.11. Veli - Wellington Island
Fig.4b.10. Kaloor
Fig.4b.5. Kadavanthra / Papampilly Nagar
Fig.4b.9. Ernakulam Market
Fig.4b.4. Vallarpadam
Fig.4b.12. Building Density Map
A. Vypin
BUILDING FOOTPRINT
Building footprint identifies the square meter area of 246,349 buildings within Kochi. Most generally the relationship between larger footprint and major roads coincides with economic activity and caters for the public consumer. Outer edges and block peripheries fronted to the street on average contain larger footprint buildings of three or more floors. Due to the methodology utilised, the heights of buildings within the blocks is difficult to establish. Street facing typologies include commercial, industrial, healthcare, and municipal buildings which have access to higher footfall and higher occupancy rate. The more residential and private buildings have reduced footprints and are nestled within an area. There are several conclusions which can be drawn from this mapping exercise. Immediately obvious is the prevalence of larger footprint
structures along major roads, for instance, the long NorthSouth line along MG Road. This is a distinguishable observation because MG Road is not only the main artery but commercial high street within Ernakulam. The prevalence of larger buildings reflects greater economic activity and the need for increased density. Footprints in the range of 115 to 1400 m2 along Bazaar Road and Jew Town in Fort Kochi correlates closely to building height and building material – reflecting the need and opportunity to maximise land use as commercial and tourism districts.
Fig.4b.19. Fort Cochin
Fig.4b.13. Kerala High Court
Fig.4b.17. Jew Town
Fig.4b.16. Residential
Fig.4b.15. Ernakulam Market
Fig.4b.14. Jawaharlal Nehru Stadium
Fig.4b.18. Ernakulam
Fig.4b.20. Building Footprint Map
CENTRES OF DEVELOPMENT
The map on the right side shows the building density of Kochi weighted by the building’s footprint. This method allows for a more nuanced analysis of the maps on the previous two pages, adding a layer of temporality, as due to technological advancements over time larger buildings footprints became possible. Therefore, this map highlights the most recent developments, especially towards East, where the city is sprawling.
The areas analysed separately show the building with a footprint over 1000 sqm (red outline). This allows to create a differentiation between areas which appear dense due to their fine grids, and areas which appear dense due to their large building footprints. Finer grids such as the ones found in Ernakulam Market, Mattancherry or Maradu are more desirable, as they tend to offer more permeability and a more human scale, having great potential for becoming walkable areas.
Ernakulam is particularly dense, showing a combination of fine grid and large institutional buildings. This is showing of the continuous development of Kochi’s city centre. While a high density is desireable, according to the compact city theory, such a combination can lead to congestion, in a similar way as Mattancherry, with the notable difference that Ernakulam has a good global integration value (Fig.4b.68.)
Mattancherry has a high concentration of large warehouses and deposits, which coexist with a fine grid determined by the period of its development. This juxtaposition, combined with the area’s poor global and local integration (Fig.4b.68.) causes traffic congestion, only worsened by the rich economic activity concentrated here (seen in Fig.4b.29).
The Arakkakadavu area is another example of a considerable number of large footprint being present alongside smaller, denser areas. It is different from Ernakulam and Mattancherry through its residential character, being mainly composed of apartment blocks and residential developments. The contrast between the number of large building East and West NH66 is striking, and it strengthens the hypothesis that the city is sprawling towards East.
Despite Willingdon Island being where most of Kochi’s large buildings are located, the distance between them leads to a lower density. The character of the area is an industrial one.
Maradu presents a high density without having an important number of large footprints. This shows the area’s very fine grid, which combined with the local integration (page 174), highlights a great potential for walkability. However, this is a CRZ II protected area (page 214 coastal regulation zone), causing ecological issues which affect the city as a whole.
Fig.4b.X. Ernakulam
Fig.4b.23. Arakkakadavu
Fig.4b.24. Maradu
Fig.4b.22. Willingdon Island
Fig.4b.21. Mattancherry
Fig.4b.25. Building Density Weighted by Footprint Heatmap
with small footprints
C. Ernakulam
footprint A. Mattancherry B. Willingdon Island
D. Arakkakadavu
Maradu
CONGESTION
The distribution of the road network in Kochi follows closely the Street Hierarchy concept, with each street being primarily defined by, and therefore designed for the flow of traffic. The majority of streets (392 km – 63.96%) are local, and they serve residential areas (373 km – 60.8%)(National Transportation Planning and Research Centre 2006, as cited in Department of Town and Country Planning 2010c). Ernakulam’s streets are local and collector streets which do not have the capacity to accommodate the large intake of traffic made possible by SH15 and NH544.
Stress on the transport infrastructure is especially critical as Kochi continues to show a trend in growth of vehicular population (fig. 4b.55.). The largest proportion of traffic participants are twowheelers. This highlights the need for the development of a strategy which clearly takes into account the specific context of Kochi, such as the large mix of traffic participants, aiming for a safe interaction between them, rather than solely the efficiency of the traffic flow.
The distribution of the vehicular density in Ernakulam (right) highlight zones in which one mode is preferred over the other. Cars are concentrated on the main arteries surrounding the core of Ernakulam, highlighting the large number of vehicles generating traffic through the act of transiting through the area - due to it’s high connectivity (Fig.4b.74.). In the case of heavy goods vehicles, it is clear that they are concentrated around the market area and its main arterial links. Twowheelers and rickshaws are more evenly distributed across the study area, being able to access narrower streets than the cars. They also reach residential areas in the East and South-East of Ernakulam, highlighting potential trip generators - the first/last mile connectivity of which should be addressed.
Growth of Vehicle Population in Ernakulam District
Distribution Of Transport Modes Based On Vehicular Traffic
Fig.4b.57. Cars Density
Fig.4b.58. Heavy Goods Vehicles Density
Fig.4b.59. Rickshaw And Motorbike Density
Fig.4b.56. Distribution of transport modes based on vehicular traffic (Department of Town and Country Planning 2010a)
Rickshaw
Fig.4b.55. Growth Of Vehicle Population In Ernakulam District (Department of Town and Country Planning, 2010c)
Fig.4b.60.(Opposite) Congestion and Street Hierarchy Map (based on Department of Town and Country Planning, 2010a)
CONTENTS
LAND TYPOLOGIES ______________________________________186
ENERGY CONSUMPTION_________________________________190
K Kochchi’ i s en e vironmental sy sysstems and ne nettwworks are re expploorreed th thrroughoout this sub-chhaapter. The e undnder e pi p nnninng conncceep
Kochi’s environmental systems and networks are explored throughout this sub-chapter. The underpinning concept ning this chapter questions what affects urban sprawl and growth, coupled with industrial and economic prosperity, has on the ecological sustainable and security of the city. Varying types of pollution will be studied regarding its effects on the stakeholders of the city; human and natural. All aspects of the environmental systems studied will be analysed with reference
AIR POLLUTION __________________________________________192
SEDIMENT SOIL STUDY __________________________________210
SEEDIDIMEMENT NT ST STUDUDY 2110
COASTAL REGULATION ZONES & MANGROVES____________212
COAS A TA TAL L R REEGUULA L TION N ZOONNES MANNGGRROVVEES 212
UR URBA B N AVVES S UNNDER ER THRREAEAT 214
URBAN AVES UNDER THREAT ___________________________214
SURVEY RESULTS AND CONCLUSIONS ____________________216
SUURVVEY RES E ULLTS S D CON O CL CLUUSIONNS S 2 216
SUMMARY OF FINDINGS ________________________________218
SUUMM M AR ARY Y O FINNDIDINGNGS 2118
LUCAS
LAND TYPOLOGIES
One of the most significant aspects in developing knowledge and links between people and the environment is land use classification. It is a dynamic phenomenon that requires ongoing monitoring and mapping. Satellite imaging is an effective technique for detecting these phenomena. Satellite imagery is used to gather data for the strategic planning of land-based resources. Multiple classification techniques were used to perform the study, resulting in more accurate findings (Avashia Parihar and Garg, 2020). Hybrid, unsupervised, decision tree classification (DTC) coupled with object-based image analysis (OBIA) both done in QGIS. A limitation of the study was the resolution of satellite images available online.
Kochi is Kerala’s fastest expanding commercial, industrial, and trading centre. The city’s population density is expanding year after year because of great expansion and urbanisation. These causes have caused changes in land use, resulting in a reduction in open spaces with wetlands being significantly affected (Deepak 2016). Rapid urbanisation in the region has also resulted in the demise of traditional economic activities including fishing, agriculture, aquaculture, coir production, clam fishing, lime shell gathering, and traditional ferry and transport services. Over the years, poor planning and management have resulted in the neglect and extensive exploitation of these resources, diminishing their potential to maintain ecosystem, connectedness, and improve the quality of life of people in Kochi (Aziz, Ray and Paul 2018).
REDUCTION OF GREEN SPACE IN KOCHI
Fig.4c.87. Satellite map of Kochi.
Fig.4c.88 Kochi in 1990.
Fig.4c.89 Kochi in 1999.
Urban Urban open Urban green Mangroves Aquaculture
Fig.4c.90 Land typologies in Kochi.
Urban
Open green space
Aquaculture
Shallow Marsh Fallow Beach
NOISE POLLUTION
According to the World Health Organisation, noise is the pollutant which disturbs more people in their daily lives than any other. Anthropogenic noise must be considered as a serious form of environmental change and pollution (European Environment Agency 2020). There have been campaigns in Kochi to raise awareness, but noise has not been tackled in any meaningful manner.
At around 50 decibels people begin to get annoyed with daytime noise (at night, it is 30 decibels). At around 55 decibels (a 10-decibel increase represents a doubling of sound levels) people become extremely annoyed. Above 130dbs is the human threshold of pain, although the gradual loss of hearing from continuous noise is a greater worldwide problem (Indian Medical Association n.d.). Similarly, most of the native bird species in Kochi have an average hearing threshold of 20dbs (Encyclopedia of Life n.d.).
- The IMA (Indian Medical Association) Kochi branch indicated that 60% of drivers suffer from hearing loss (The Times of India 2018).
- A study conducted on nine important roads in Kochi shows that sound intensity here is up to 105 decibels, nearly double the permissible levels (The New Indian Express 2019).
- The forest department indicated a 30% decline in migratory birds due to major reasons which include noise pollution (Deccan Chronicle 2014).
AMBIENT NOISE MEASUREMENTS dB(A)
The average noise levels in the commercial zone are 78.5 dB(A); 13.5 dB(A) above the permissible level. The silence zones recorded 76.55 dB(A); 26.55 dB(A) above the permissible level. The sole residential zone recorded 40.7 dB(A); 15 dB(A) below the limit. The silence zones and the commercial zones have recorded equal noise levels and well above the permissible limit.
Fig.4c.102. Measured ambient noise levels in the commercial and silence zones in Kochi and the permissible levels specified by the Ministry of Environment & Forests, Govt. of India (Based on Sampath et al. 2004)
NOISE MAP OF SENSITIVE
Pallimukku is considered as a sensitive zone because of the presence of a lot of hospitals, educational institutions, session court etc. The highest sound level is recorded at near and surrounding the Medical Trust Hospital (101.305 dB) during a working day.
Length of spike correlates with loudness of sound level
Buildings in yellow represent sensitive zones (hospitals, clinics, schools, universities, places of worship) Open Spaces
Commercial Spaces
SEA-LEVEL-RISE VULNERABILITY
Rising sea levels are affecting coastal cities across the globe, especially low lying areas such as Kochi. Using satellite data (Topographic Map 2021), it was possible to create a graphical representation of the areas inundated on a meter by meter increment of sea level rise basis.
Sea levels are generally expected to rise this century, but it is hard to predict by how much. This rise is also not even across the planet, but will be variable across different areas due to global tidal forces and water currents.
This elevation-based flood map on its own is not a comprehensive analysis of sea level rise flood risk. There are many other factors involved, such as surface runoff, flow diversion and soil type. It does however provide a good indication of which areas will be at risk and at what stage / time period in the future.
Fig.4c.127 Mapping mean sea level rise.
COASTAL REGULATION ZONES & MANGROVES
On the coast and in the brackish waters of Kochi, mangroves are keystone species that provide numerous benefits both for the urban and natural environment. Together with Vembanad lake they form a Ramsar site (wetland of international importance). Their intricate root system acts as a buffer against flooding, coastal erosion and strong storms. They are nurturing richly biodiverse ecosystems of crustaceans, fish and birds, and they filtrate pollutants from water (Rafeeque 2021).
In the period from 1986 - 2018 the state of Kerala overall lost 95% of its original mangrove population (Sreelekshmi 2021).
In order to protect them and ensure that urban expansion is done on safe territories, Coastal Regulation Zones are put in place. They restrict activities — like construction, setting up of industries, storage or disposal of hazardous material, mining, reclamation and bunding — within a certain distance from the coastline. This distance can range from 50m to 500m, depending on ecological and demographical factors (Verma 2019).
Under CRZ I fall areas like mangrove forests of more than 1000 sqm, pokkali fields, and some important historical sites like Kottayil Kovilakam and Pallipuram Fort. A 50m buffer is required between these sites, and any new construction development (Kerala Coastal Zone Management Authority 2011).
CRZ II refers to urban areas developed up to the shoreline. Here restrictions apply with regards to the number of storeys admissible. However this has increased from roughly 1 storey to 4 storeys in 2018. This leads to more pressure on the land and less resilience to floods (Verma 2019).
CRZ III and CRZ IV are mostly rural or undisturbed areas that almost only allow agricultural activities and ensure a correct distance is maintained from the tide lines (Kerala Coastal Zone Management Authority 2011).
Despite this legal framework, mangrove swamps around Kochi are still often threatened by exceptions to regulation which enable agricultural conversions, excessive industrial development (in Puthuvypin and Vallarpadam), high rise residential constructions in suburban areas, and many other large scale projects. (Sreelekshmi, 2021) Moreover, the mangrove areas identified in research papers and checked by us on the field significantly exceed the areas highlighted by the Coastal Regulation Zone maps.
Fig.4c.137 Floor Space Index changes.
In 2018 the Floor Space Index (FSI) that applies in CRZ II changed from 1.3 in urban areas to the maximum of 4. This means that a building permit is given to projects that have 4 times the area of the plot; this is particularly convenient to property developers.
“[in recent years] there have been many lorries sneaking in here in the dead of the night to dump all sorts of construction waste. All the chemicals, and other harmful matter present in such waste have probably gradually been mixing with the soil here. It was only after the trees here gradually started drying up, that we noticed this unusual phenomenon.”
- Madhu, fisherman living nearby the Cochin Port Trust area (Liveable Urbanism Booklet 2020-2021)
Residential building regulations.
From CRZ regulation:
“construction of buildings for residential purposes (...) public places, etc. shall be permitted only on the landward side of the existing road, or on the landward sife of existing authorised fied structures.“
“Necessary arrangements for the treatment of the effluents and solid wastes must be made and it must be ensured that the untreated effluents and solid wastes are not discharged into the water or on the beach.”
Hazard Line
High Tide Line
Mangroves identified in research papers
CRZ IA (mangroves + 50 m buffer zone)
CRZ IB (paddy fields, pokkali)
CRZ II
CRZ III no development zone
CRZ III 200 - 500 m from High Tide Line
CRZ IV
Fig.4c.140.
Fig.4c.138 Mangroves mixed with low-rise residential buildings.
Fig.4c.139 Dead mangroves on Puthuvypin with LNG tanks in the distance (The New Indian Express 2019).
Fig.4c.141.(Opposite) Mapping of measured sources of air quality integrated with potential sources (Corporation of Cochin 2019).
SOCIAL INTERVENTIONS
MENTAL AND SOCIAL WELLBEING
AN EQUAL CITY FOR ALL
THE
AND THE CITY
SOCIAL INTERVENTIONS FOR THE PEOPLE
Rapid urbanization in India is taking a heavy toll on the livability in Indian cities including Kochi. Besides environmental and infrastructural issues such as flooding and the lack of public transportation and walkability, social issues are also heavily impacted.
Poor planning due to the inability to meet increasing demands at a fast pace results in poor outcomes. People - who are the users of public facilities and infrastructures, and occupiers of the city’s land are often disregarded in the planning process. Long term practice of top down approaches in design had caused designers and planners to be unaware of the people’s needs especially when dealing with the diversity of its users.
There are three main key themes in exploring interventions to develop Kochi as a liveable city by focusing on the social aspect of liveability namely: investing in social and mental wellbeing, developing an equal city for all, and supporting the fishermen communities in the city. These will all be further illustrated in the following pages of this chapter.
Empowering the communities, consultation and engagement, designing for the demographic needs and priorities, creating vibrant, walkable and inclusive developments are amongst the elements that constitute the social aspect of developing Kochi as a liveable city.
Fig. 5. 4. Photographs representing key social issues in Kochi
FISHERMEN
INFRASTRUCTURAL INTERVENTIONS
PEDESTRIAN MAKEOVER
COMPACT CITY AND SOCIAL CAPITAL
BROWNFIELD NEIGHBOURHOOD REGENERATION
NEW AND IMPROVED CITY WIDE INFRASTRUCTURE
Infrastructure refers to the basic physical and organizational structures and facilities (e.g. buildings, roads, power supplies) needed for the operation of a society or enterprise. Infrastructure is also closely related to the efficient functionality of environmental, social and economic processes within an urban setting. Without efficient infrastructure that responds to the needs of the surroundings, people, habitats, and monetary value will degrade exponentially.
The following interventions have been developed over some weeks, and propose a stringent plan for the city of Kochi’s scope on its transition to becoming a smart, resilliant and liveable city.
As seen in Chapter 4’s analysis of Kochi, there are a variety of issues of urbanity that are at present inhibiting the city from becoming liveable.
Issues such as travel distances, car dependency, congestion, projected population and urban sprawl, social segregation, habitat and green infrastructure scarcity have been propositionally tackled through infrastructural intervention in the following section.
Fig.5.29. Photographs representing key infrastructural issues in Kochi
ENVIRONMENTAL INTERVENTIONS
SAVING MANGROVES AND POKKALI
A WATER SOLUTION
SOLUTIONS FOR THE ENVIRONMENT
India was ranked the sixth most vulnerable country to climate change in Global Climate Risk Index 2018 and Kochi is one of the most vulnerable cities in India. Occupying a lowland coastal setting sea level rise is a major concern (within the IPCC projecting sea levels may rise by 0.11m by 2030, 0.71m by 2100 and 1.24m by 2150 in the absence of significant reduction in global GHG emissions) as well as changes in the already severe monsoons, becoming more erratic with prolonged wet and dry seasons driving both floods and droughts.
A city-wide urban strategy has to consider these environmental factors and the relation the environment has with the city’s urban form and socio-economic dynamics.
One study looks at how the city development has constrained the canals, that once where the cultural and environmental heart of the city are now little more than open sewers. Low clearance bridges are unnavigable, reducing connectivity across the City. Both are subject to frequent blockage by debris, preventing the flow of water. The stagnated water soon becomes heavily polluted and a breeding ground for mosquitoes. During the monsoon season blocked canal are unable to convey flood waters which drives hazardous contaminated water to flood locally.
Flooding is a growing concern in Kochi, with a exponential increase in flooding in recent years, notably the mass floods of 2018. A second study looks to how an urban strategy can be adapted to a city that lives with floods given the predicted sea level rise and ever-increasing risks of flooding.
Kochi’s environment is also central to its economy specifically through its fishing and Pokkali industry both of which are coming under a growing treat as the ecosystems are polluted through the city’s rapid urbanisation. A study into protecting these areas highlights the steps required to not only protect these key ecosystems but to maximise the utilisation of them for the city. One of the key ecosystems this include is the mangrove swamps. These spaces lack the legal support in the city and are continuously exploited by industries seeking additional land in prime waterfront locations.
Fig.5.49. Photographs representing key environmental issues in Kochi