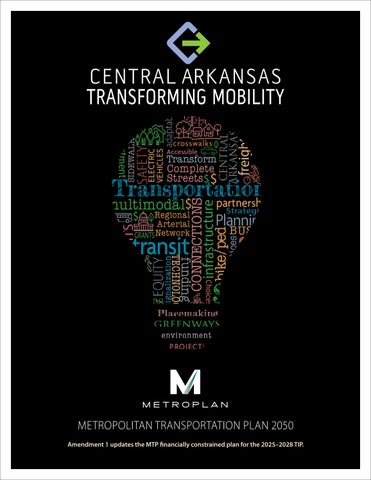
CENTRAL ARKANSAS TRANSFORMING MOBILITY
Chapter 1 of Transforming Mobility briefly describes who Metroplan is, our process in developing the Long-Range Metropolitan Transportation Plan (MTP), and offers a succinct chapter guide to preview the documents’ content.
Central Arkansas Transforming Mobility defines how our region will move its residents safely and efficiently, giving them more transportation choices, and greater access to the places they cherish. The plan aims to preserve our region’s culture and history, while providing transportation choices that contribute to quality growth and a vibrant economy.
This plan builds on extensive outreach and engagement with residents, businesses, community leaders, and government.
The Regional Advisory Committees (RAC), a citizen-led advisory body appointed by Metroplan’s Board of Directors, helped establish six “Regional Themes” during a public visioning process. These themes are the foundation for nine “Core Policies” within the Central Arkansas Transforming Mobility Plan that will guide Metroplan’s transportation initiatives.
Metroplan is the federally designated Metropolitan Planning Organization (MPO) for Central Arkansas. Metroplan conducts long-range transportation planning for the Central Arkansas Regional Transportation Study (CARTS), which covers Faulkner, Pulaski, and Saline counties, and northwest Lonoke County. A Long-Range Metropolitan Transportation Plan (MTP) is federally required to make decisions on transportation issues and needs.
Central Arkansas Transforming Mobility is the latest MTP. The new plan represents a planning process that is regularly
updated, allowing the region to look toward the long-term future while adapting in real time. New problems, as well as new opportunities, will inevitably crop up over time, and future plans will make necessary adjustments. The Central Arkansas Transforming Mobility Plan sets the year 2050 as the benchmark for reaching its transportation goals. It identifies transportation projects, forecasts available revenue, and prioritizes projects. The plan is informed by several implementation-oriented companion documents, some of which have already been completed, while others will become available over the planning period.
Chapter 2. Central Arkansas Snapshot—A snapshot of where the region stands now and projections for the future, to form a basis for our policy decisions.
Chapter 3. Transforming Mobility—A synthesis of public visioning for an accessible, equitable, and sustainable region and policy, drawing from Metroplan’s recent implementation-oriented studies.
Chapter 4. Metropolitan Transportation Plan—A guide for project development and selection, a financially constrained list of projects, and an assessment of key performance measures of our infrastructure investments.
Appendices—Public comment, planning studies, and further reading, which form the basis of our regional vision and implementation.
Metroplan, established in 1955, is the Metropolitan Planning Organization (MPO) for the Central Arkansas urbanized area. Its members include four counties, 29 cities, the Arkansas Department of Transportation, Rock Region METRO, Little Rock Port Authority, and Clinton National Airport.
Metroplan is federally required to prepare and adopt the Long-Range Metropolitan Transportation Plan (MTP) and manage the 4 year Transportation Improvement Program (TIP). These are the documents for coordinating federal, state, and local transportation funding and project development.
Chapter 2 of Transforming Mobility provides a snapshot into Central Arkansas—its population, economy, transportation system, land use, and equity concerns. Understanding the current state of our region is essential for benchmarking progress, outlining needs, and identifying challenges and opportunities for growth. This MTP, and the planning documents appended herein, have been written with the data in mind. Chapter 2 sheds light on and informs policy decisions in Chapters 3 and 4.
Figure 2.1. Regional Population by Age Group 1980–2020 With Forecast to 2050
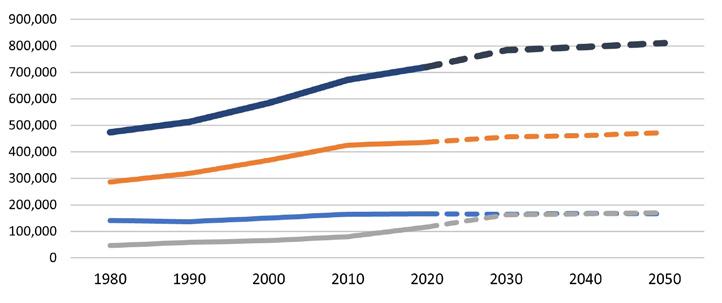


Historically, the growth in the adult and child populations have easily outpaced any growth in the senior population. However, Baby Boomers have flipped the script. By 2030, the number of seniors will match the number of children in the region. Meanwhile, the number of people in prime working age and the total population will stay largely flat.
The slowdown in forecasted regional growth past 2030 is based on declining fertility, slightly increasing death rates due to aging of the population, and a continuation of observed 2010–2015 migration patterns.
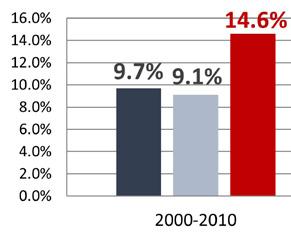
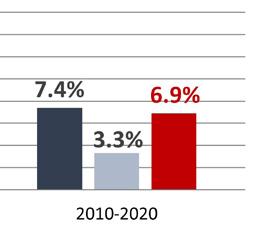
2.2. Population Growth by Decade 2000 to 2020
Source: Decennial census 1990-2020, Metroplan forecast to 2050.
CENTRAL ARKANSAS IS… DIVERSE.
2.4. Little Rock MSA Population Change by Ethnicity 2010–2020
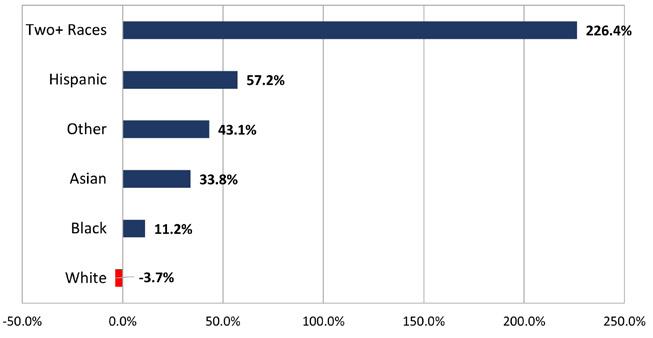
Note: categories White, Black, Asian and Other represent non-Hispanic only.
Central Arkansas is consistent with national trends showing growth among Hispanic residents and people of color. The most striking change between 2010 and 2020 was a more than tripling of the regional population identifying as “two or more races” on the Census. The large growth in the percent of people identifying as multiracial in the 2020 Census was consistent with a national trend.
Source: Decennial census 1990-2020.
Figure 2.5. Central Arkansas Race and Ethnicity 1990 and 2020
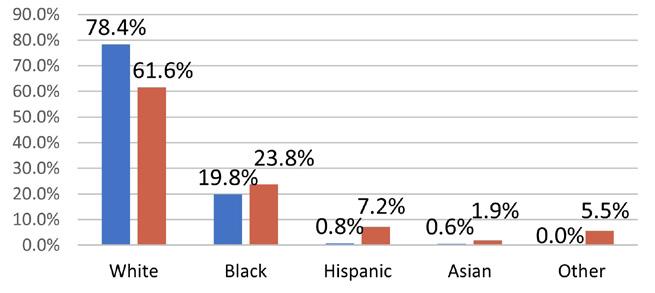


Pulaski County is home to much of the region’s diversity.
CENTRAL ARKANSAS IS… PRODUCTIVE.

2.7. Median Annual Earnings by Place of Work 2012–2016
Central Arkansas still leads the state’s metro areas in economic output. However, Northwest Arkansas has increased its share of GDP in recent decades.
Source: U.S. Bureau of Economic Analysis, 2021.
CENTRAL ARKANSAS IS… A HUB FOR 21ST CENTURY INDUSTRIES.
Within the region, Pulaski County jobs pay more, luring commuters into the Little Rock area for work despite perhaps living farther out from the region’s center. Source: CTPP 2012-2016. Note: earnings data represent 2016 dollars, not adjusted for inflation.
Figure 2.8. Little Rock MSA Job Change by Industry
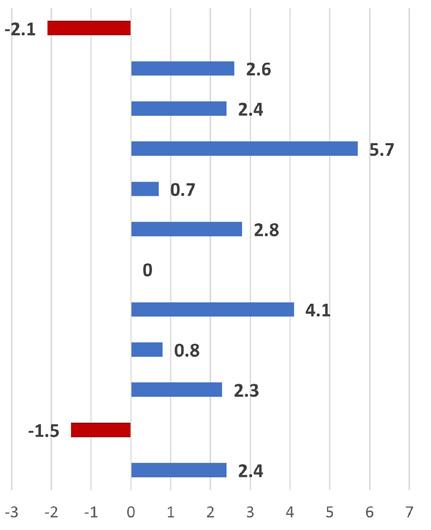
The chart at left depicts regional economic changes from May 2019 to May 2023. Note that the biggest job loss was in the government sector. Based on national trends, this is probably a byproduct of changing economic conditions. Government jobs offer less competitive wages, and in the postCovid labor shortage workers have flocked to better-paying sectors.
Central Arkansas’ growing status as a logistics hub has brought with it a large increase in transportation/ warehousing & utility workers, increasing by 5,700 in four years.
The fast growth in the region’s education / health sector outpaced U.S. growth in the same period. The bulk of these jobs are in the health sector.
In May 2023, the industry publication Business Facilities featured the Little Rock area on its list of Top Logistics Hubs. Central Arkansas’ strategic location in national freight movement and market reach, availability of facilities, and infrastructure improvements factored into its inclusion on the list.
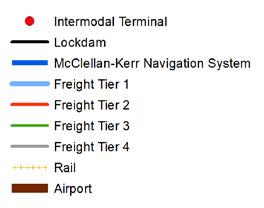
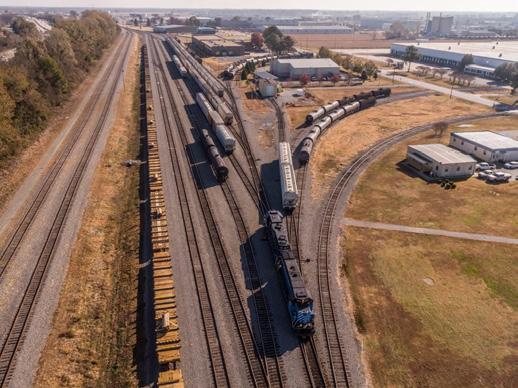
The convergence of interstates, rail lines, pipelines, and the McClellan-Kerr navigation system along the Arkansas River make the region an ideal location for intermodal terminals, which facilitate the transfer of freight between different transportation modes for maximum efficiency. In Central Arkansas, these facilities allow highway-rail freight transfer and transfer at several facilities along the Arkansas River of goods between rail, highway, pipeline, and barge.
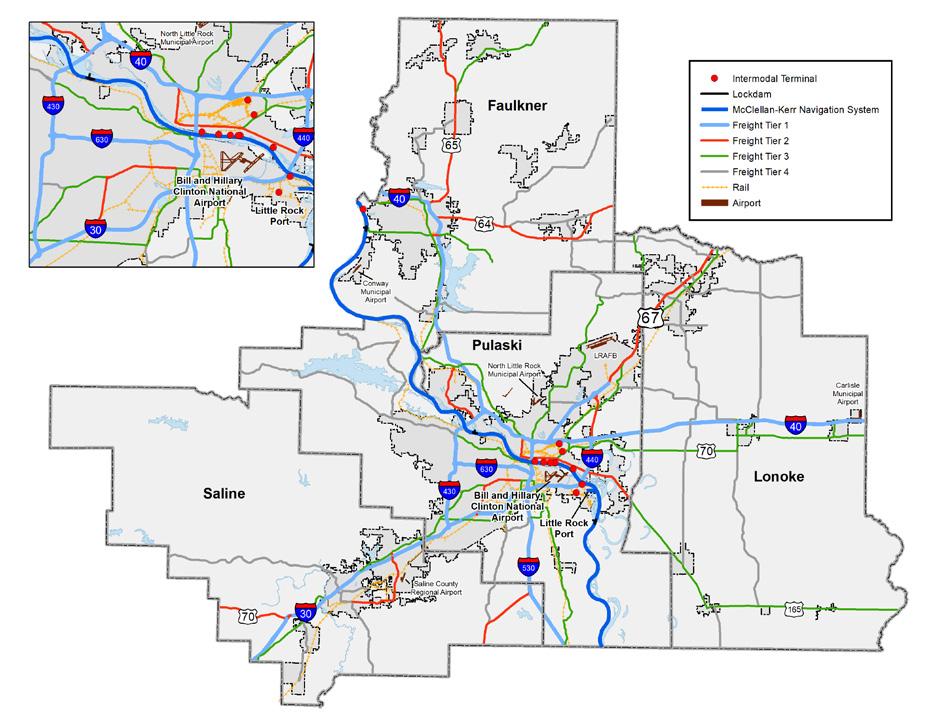
The National Highway Freight Network (NHFN) classifies highways into a 4-tier hierarchy of importance:
Tier 1: Interstate highways and other significant Intermodal connectors. Eligible for federal freight funding.
Tier 2: Highways on the Four-Lane Grid System, other roadways
meeting specific truck volume thresholds, and rural principal arterials with at least 25% truck traffic.
Tier 3: Additional roadways that provide important redundancy to the Interstate and freeway network.
Tier 4: Remaining facilities on the Arkansas Primary Highway Network which do not serve a high-volume of freight traffic.
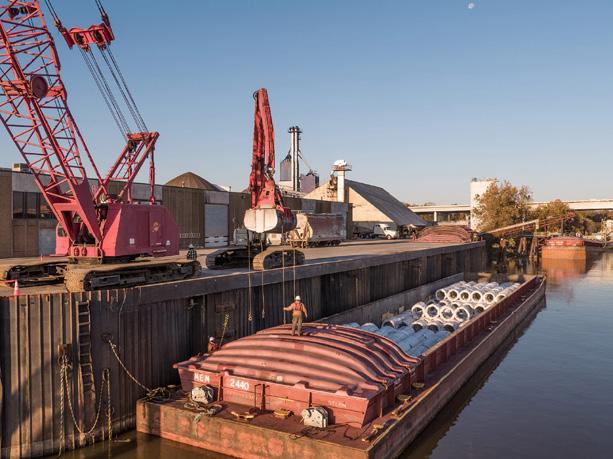
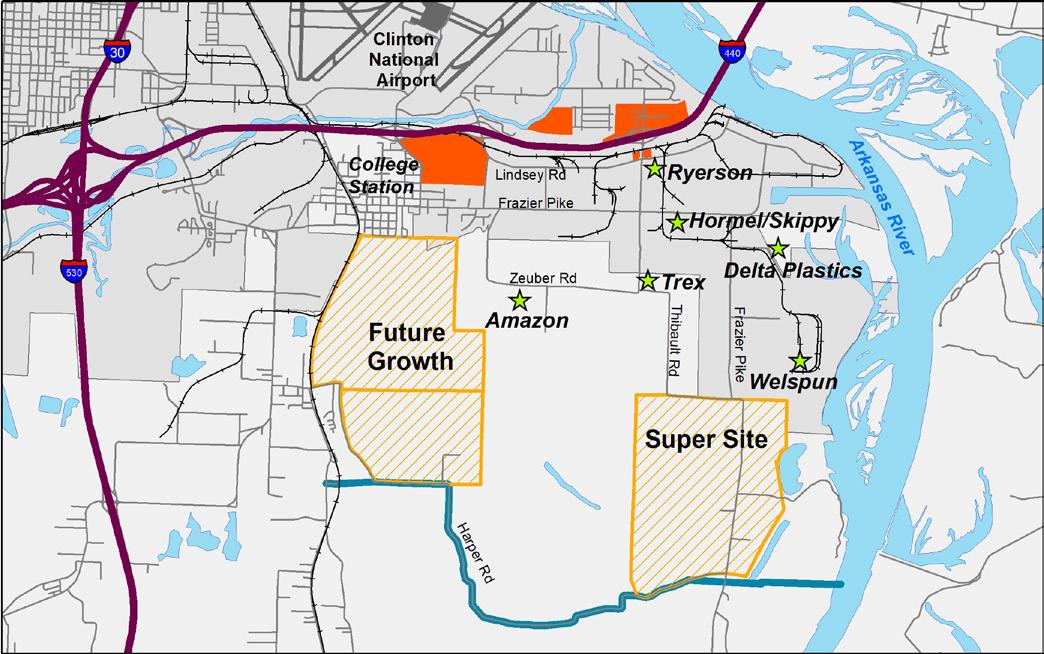
Little Rock is an inland city, but has a sizeable port located on the nation’s domestic waterway system. The Little Rock Port is notable for highquality freight access, with rail, freeway and barge access plus a major urban airport nearby. The Little Rock Port hosts a variety of businesses, mainly manufacturing and warehousing/ logistics operations. Some 3,000 people work at the Port’s largest employer, an Amazon warehouse. Other major firms include Welspun (steel pipe-making) with nearly 1,000 jobs, Delta Plastics (plastic recycling), and numerous other food processing, steel, and assorted other activities. The Port has grown in recent years and has a total workforce of around 8,000. It includes two potential super-sites with over 1,000 acres of land available for future development.

INTERSTATES ROADS
RAIL
PORT-SERVING RETAIL FUTURE SITES
SO. BOUNDARY OF PORT AREA
CITY OF LITTLE ROCK
CLINTON NATIONAL AIRPORT

Source: ACS 2021, one-year.
5 Interstates
6 U.S. Highways I-40 serves 5 million trucks per year.
North Little Rock to Memphis is the most heavily-traveled segment in Arkansas.
Port of Little Rock: Handles 12 million tons of freight per year.

20 State Highways
100–150 Trains per day
Arkansas River/McClellan-Kerr: Barge access to 19 states.
Clinton National Airport: Transports 90% of air cargo in Arkansas.


Source: State Freight Plan.
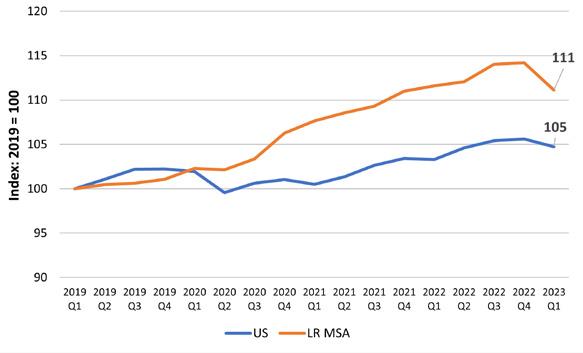
Central Arkansas has an outsize role in finance and investment. The region’s financial sector has shown solid growth over the past decade, suggesting it is a specialty in which the region holds competitive advantages. During the years 2019-2023, the region’s financial sector showed a net job gain of 12.8 percent, nearly three times faster than the average U.S. gain of 4.4 percent in finance. Little Rock played a key role in early electronic banking, and still plays a significant role in finance research and development. The Little Rock-based Venture Center is a fintech innovation hub of national significance.
The Bill and Hillary Clinton National Airport saw over one million passenger enplanements in 2022. It is the largest airport in the state of Arkansas, with a total of nearly 7,000 jobs in the airport and nearby. The airport is also the location of Dassault Falcon Jet, a manufacturing firm which does interior finishing on business jets. At last count the firm employed 1,395 workers.1 It is supplemented by other firms in the aircraft modification business, including CAC (Custom Aircraft Cabinets) located in North Little Rock. 1
There is a critical need for truck parking along Central Arkansas’ major freight corridors. Lack of parking causes safety issues through undesirable truck parking activities or drivers operating beyond their maximum hours of service. Truck parking facilities in the 4-county MSA are regularly over capacity.


Source: U.S. Bureau of Labor Statistics, index by Metroplan.
CENTRAL ARKANSAS IS… A COMMUTER REGION
Figure 2.12. Central Arkansas Commuting
of Central Arkansas jobs are in Pulaski County.
Source: CTPP 2012-2016.
CENTRAL ARKANSAS IS… COMMUTING DIFFERENTLY.
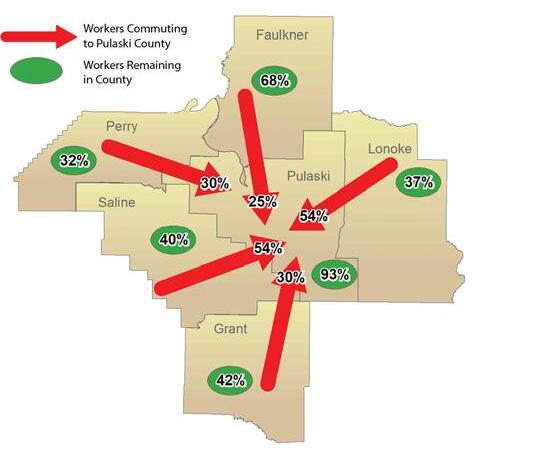
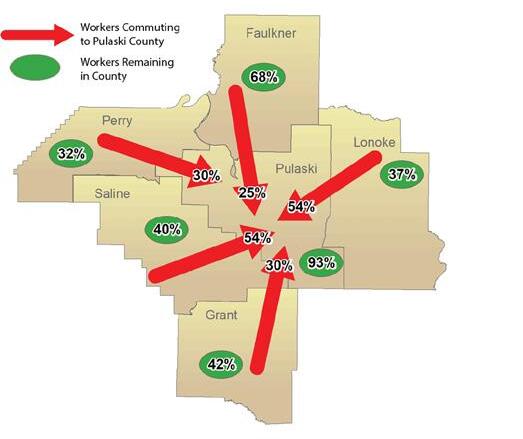
Pulaski County remains the region’s employment hub, attracting commuters from all over the MSA. However, only Saline and Lonoke Counties see the majority of their residents commuting into Pulaski County. Faulkner County has become its own job hub, employing 68% of residents within its own boundaries.
CENTRAL ARKANSAS IS… SPREAD OUT.
Central Arkansas’ population is becoming more decentralized. Over the last 30 years, the population within 5 miles of downtown Little Rock has decreased while the population more than 10 miles from downtown Little Rock has grown significantly. This has led to a greater dependence on the region’s Interstates and freeways.
Figure 2.14. Population Change 1990–2020 Distance from Old State House

Figure 2.13. Central Arkansans Working from Home
2019: 3.9%
2021: 11.3%
Working from home rates tripled in response to the Covid-19 pandemic. While many employees have returned to the workplace, some continue working hybrid schedules while others have relocated to Central Arkansas to enjoy the region’s lower cost of living while keeping their remote job salaries.
Source: ACS 2019 and 2021, one-year.
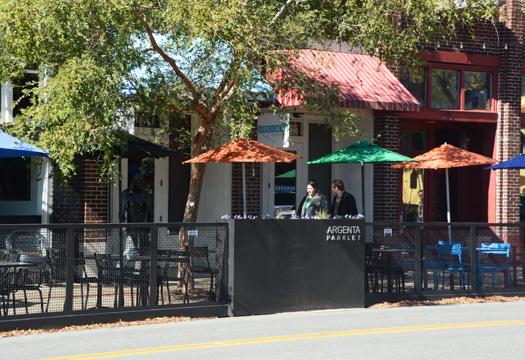
However, walkable urban areas are seeing growth. The area within 1 mile of downtown grew by 331 residents in 30 years, bucking the overall trend of declining density. Residential growth in the River Market, North Little Rock’s Argenta District, Quapaw Quarter, and MacArthur Park neighborhood shows denser, historic neighborhoods do attract new residents and investment.
Figure 2.15. 2020 Population

1 Dot = 100
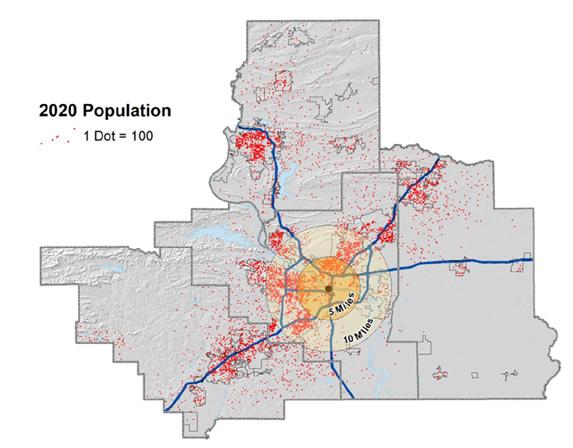
Source: Decennial census 1990 and 2020. Note: The Old State House Museum was used as the central point of downtown Little Rock.
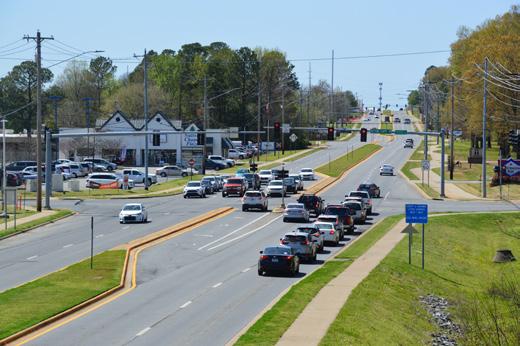
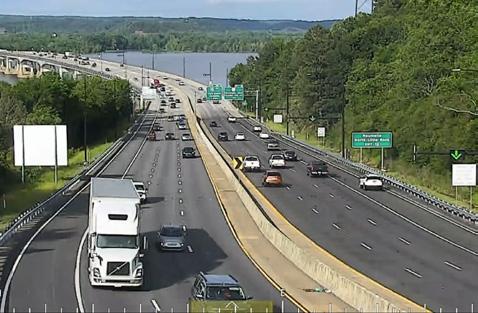
CENTRAL ARKANSAS IS… CONGESTED.
At an average of 37.4 miles traveled per person daily, the Little Rock Urbanized Area (UA) ranked second highest for daily vehicle-miles of travel (DVMT) among the 100 largest urbanized areas in the United States.1
CARTS travel demand model forecasts show total daily hours of vehicle delay will nearly triple between 2015 and 2050. Forecasts are based on projections of a growing regional population with relatively unchanged travel behavior. Most
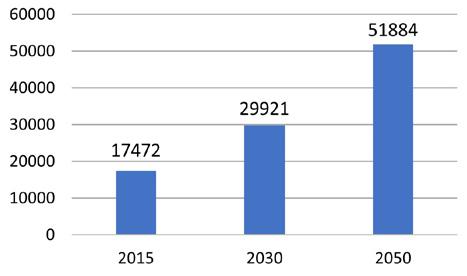
delays currently occur on interstates, but the percentage of delays on non-interstate roadways is expected to increase.
One recent development that will likely impact future forecasts is the dramatic rise of remote working since 2020. The number of workers working from home on one or more days a week has decreased from the 2020 peak but has remained at far more elevated levels than ever seen prior to the COVID-19 pandemic. Any reduction of trips in the AM and PM peak travel periods can have an outsized impact on reducing congestion and delay.
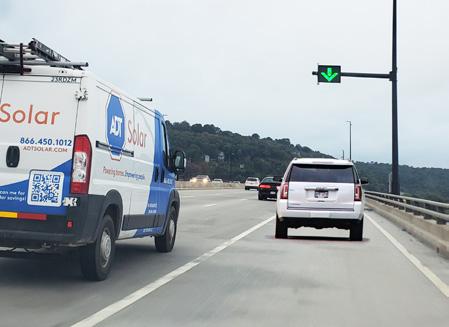
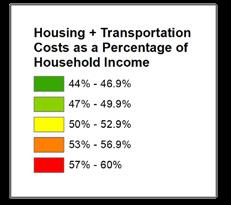
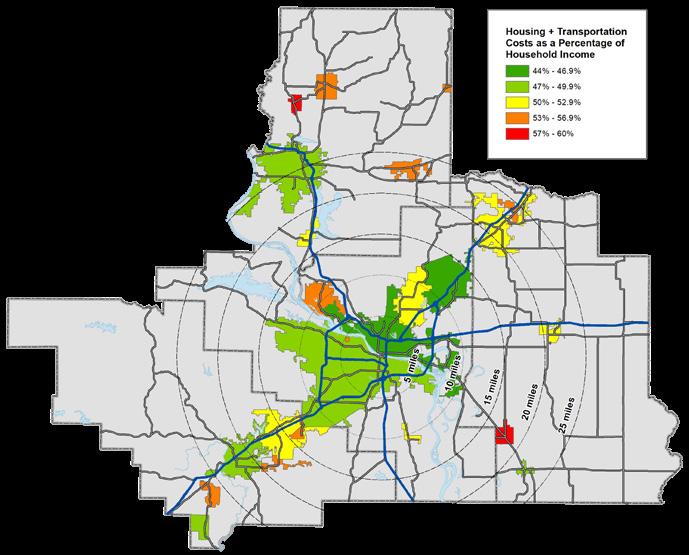
Central Arkansas is quite affordable when considering housing costs alone. All the cities in the MSA meet the affordability benchmark of 30% or less of median household income spent on housing.
However, when transportation costs are factored in, most places in central Arkansas are considered unaffordable, meaning households spend more than 45% of median income on housing + transportation. Affordability tends to worsen the farther away people live from regional employment centers like Little Rock/ North Little Rock and Conway. If left unchecked, an increased lack of H+T affordability could negatively impact the region’s quality of life and economic competitiveness.
Source: The Housing and Transportation (H+T®) Affordability Index by the Center for Neighborhood Technology (CNT). H+T is considered “affordable” at 45% or less of median household income.
1 Federal Highway Statistics 2021, Federal Highway Administration (FHWA), Table HM-72.
in “Poor” Condition in “Fair” Condition in “Good” Condition in “Poor” Condition in “Fair” Condition in “Good” Condition
The Arkansas Department of Transportation is consistently addressing pavement conditions. Approximately 90% of all interstate and non-interstate National Highway System (NHS) lane miles are in the “good or fair” category. However, as our infrastructure ages, fewer lane miles are considered in “good” condition.
It is less expensive to elevate roadways from “fair” to “good” than it is to repair lanes once they have fallen into the “poor” category. Maintaining current infrastructure in at least “fair” condition will be a major focus for ARDOT as roadways continue to age.
Source: ARDOT Highway Performance Monitoring System (HPMS) 2017–2020.
Burden of Road Maintenance in Central AR Cities
Figure 2.19. Burden of Road Maintenance in Central Arkansas Cities
Burden of Road Maintenance in Central AR Cities

Local Non-State Federal Aid State
Much of the burden of future roadway maintenance will fall on cities, which have almost 4,000 miles of aging roadways to maintain. The funding to maintain 67% of this road mileage will have to come from municipal revenue sources.
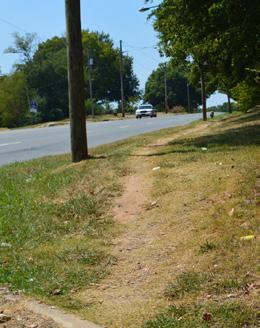
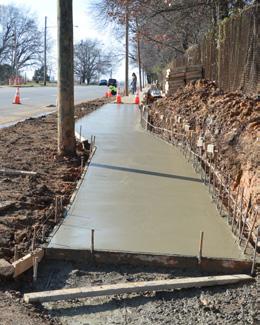
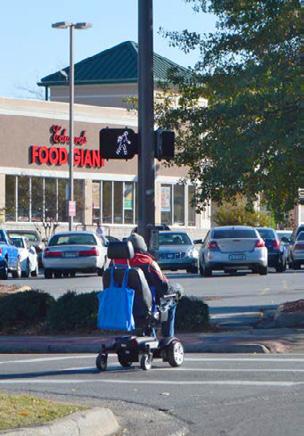
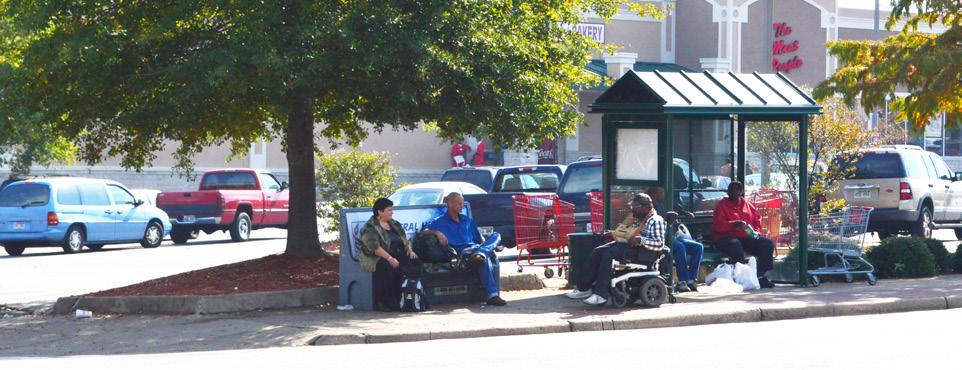
Non-motorized transportation users like pedestrians and bicyclists are at highest risk of serious injury and death when traveling at dark. Streets should be built for all modes of transportation, the appropriate, human-scale lighting. Metroplan’s Multimodal Infrastructure Guidelines can assist cities and counties with safer, more accessible designs. ARDOT’s Complete Streets policy, currently under development, will address similar goals on state highways.
Source: Arkansas State Police Crash Database.
For any mode of transportation to be a practical choice for most Central Arkansans, it must be: 1) easy to access, 2) safe, 3) convenient, and 4) affordable. Currently, the personal vehicle is by far the most heavily-used mode of transportation. However, just because people are not using other modes does not mean they do not want to use other modes. It means our region must do better to make other modes as accessible as the personal vehicle.
Central Arkansas Infrastructure
Source: ACS 2021, one-year.
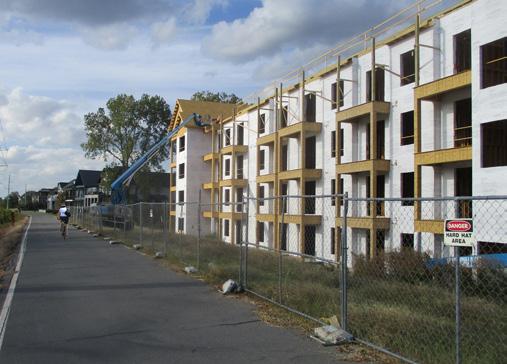
Adding residents where bus stops already exist makes transit a viable option for more people. Multi-family developments have increased in larger communities like Little Rock in recent years, but less than half (49%) of all multi-family units built in Little Rock between 2010 and 2020 are located within Rock Region METRO’s current service area.
Central Arkansas Commutes by Mode
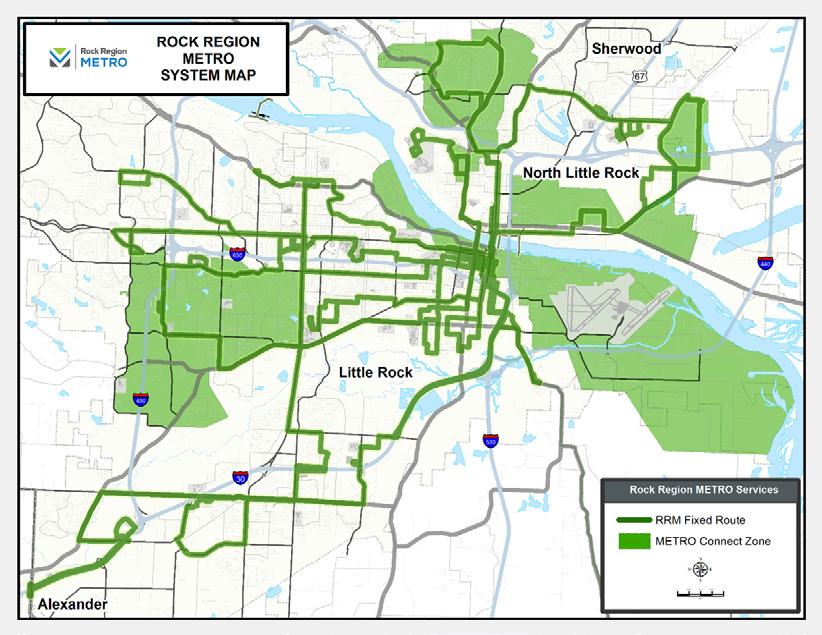
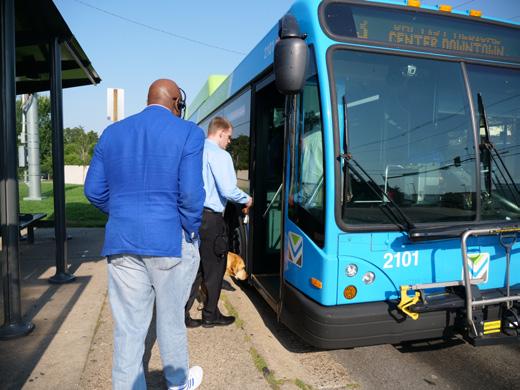
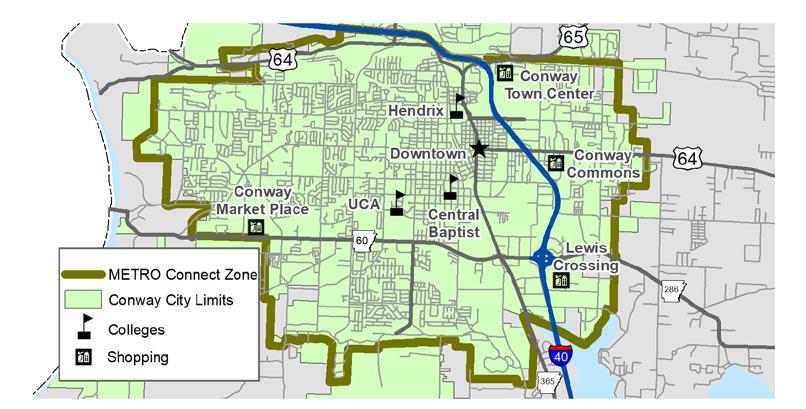
Rock Region METRO, currently Central Arkansas’ only urban transit agency, operates both fixed routes and METRO Connect Zones with point-to-point service in Little Rock, and North Little Rock, and a METRO Connect Zone in Conway. Other counties offer rural transit. Strengthening region-wide transit would require close schedule and route coordination between providers to facilitate transfers between systems
• Saline County: South Central Arkansas Transit (SCAT)
• Grant County: Southeast Arkansas Transportation (SEAT)
• Perry County: Western Transit System (WTS)
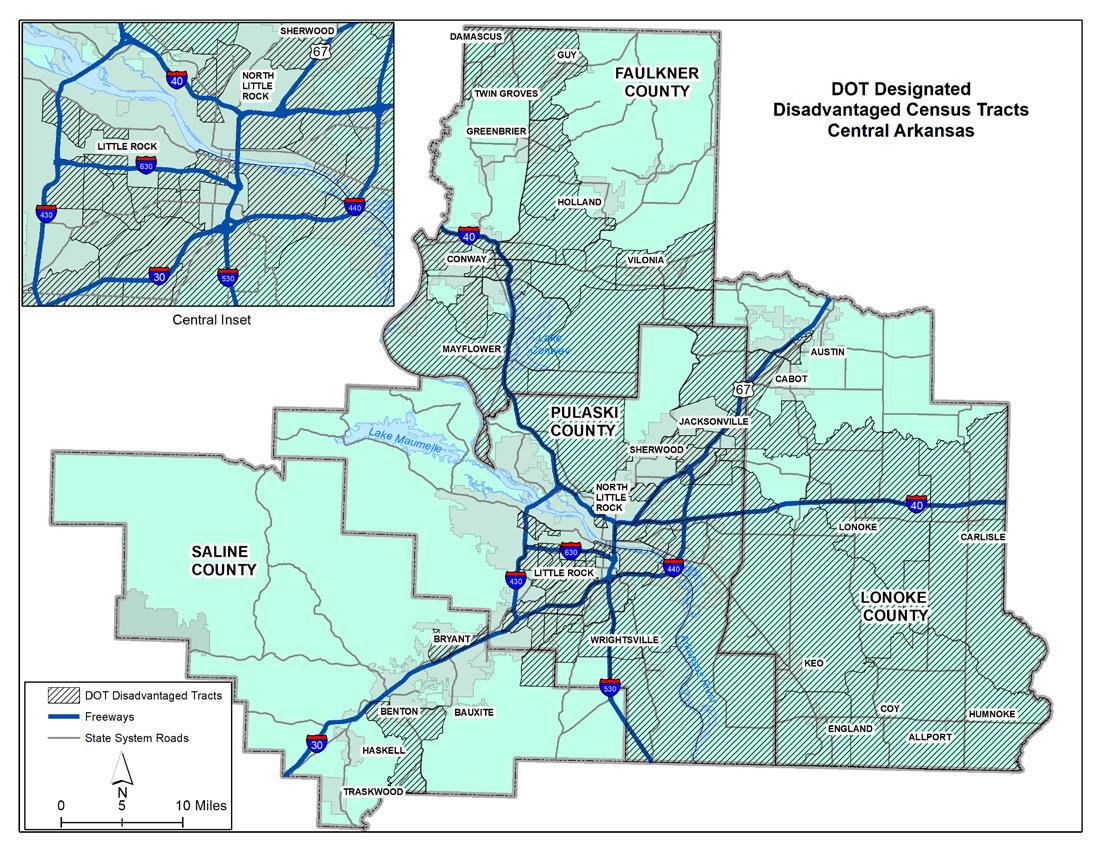
42.6% of Central Arkansans reside in disadvantaged census tracts, as defined by the Climate and Environmental Justice Screening Tool (CEJST), an interactive web application that uses census data to identify communities that are economically disadvantaged and overburdened by pollution and underinvestment in housing, transportation, water and wastewater infrastructure, and health care. A community qualifies as “disadvantaged” if the
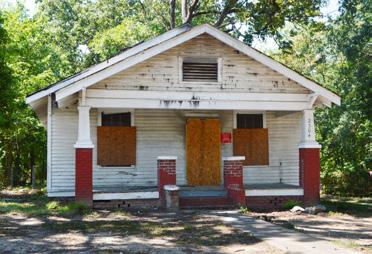
census tract is above the threshold for one or more environmental or climate indicators and the tract is above the threshold for the socioeconomic indicators.
Inequities impact Central Arkansans’ ability to access jobs and essential services reliably and safely. 55% of roadway fatalities 2016–2020 (including bicycle and pedestrian crashes) occurred in these disadvantaged areas.
Source: https://www.transportation.gov/priorities/equity/justice40/etc-explorer
Figure 2.22. Central Arkansas DOT Designated Disadvantaged Census Tracts
https://www.transportation.gov/priorities/equity/justice40/transportation-disadvantaged-census-tracts-historically-disadvantaged
Chapter 3 of Transforming Mobility provides a policy framework and identifies planning study needs for the future of Central Arkansas’ transportation system and complementary land development. This chapter relies on federal regulations, public input, and cooperation with our regional partners and their planning efforts to inform our region’s goals and guiding policies.
Metroplan is empowered by 10 Federal Planning Factors, found in regulations 23 CFR 450.306(b), but driven by the desire to see the region reach its potential as an accessible, equitable, and sustainable home for its 700,000 residents. With the frame of previous plans, we engaged our Advisory Committees to develop five “Regional Goals” for a Central Arkansas transformed through greater mobility for multiple modes.
Metroplan continued this work as it standardized best practice policies for both land development and transportation through several documents. Chapter 3 introduces previous MTPs, the Unified Development Code, Multimodal Guidelines, Regional Greenways Plan, Safety Action Plan, and other influencing plans and recognizes where more guidance is needed in future Metroplan studies. Core Policies are supported by these documents that serve as a foundation for implementation and achieving our Regional Goals.
Metro2020 started Central Arkansas’ journey towards a better transportation system. Metroplan’s foundational MTP has filtered down through the last three decades of planning. The plan first established a regional approach to investing in transportation while considering land development impacts on the system. This idea carries on currently.
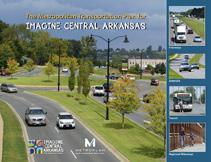
Imagine Central Arkansas, 2013, broadened Metroplan’s planning focus beyond transportation and land use, adding more livability elements like housing, health, and the economy. Maintaining existing transportation infrastructure has become crucial policy today, as investment becomes more prudent with an aging, expensive system.
Recent Metroplan studies are the foundation of the Core Policies that manifest our Regional Goals. These are organized into two categories: “Plan Influences” shape where we want to be as a region, and “Policy Formers” show us how to get there.
The “Plan Influences” are not actionable policy for implementation but build on our regional aspirations. The “Policy Formers” are studies that implement our Core Polices with specificity, be it through design guidance, land development regulations, or corridor identification.
These documents, essentially, form the backbone to transform mobility in Central Arkansas. Each major contributing document is described below as it fits into the plan.
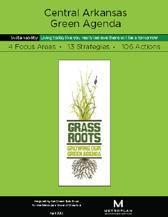
The Central Arkansas Green Agenda
Adopted in 2011, the Green Agenda’s four focuses: movement, power, nature and knowledge, resulted in 13 strategies and 106 actions to guide sustainable practices in transportation and development that would preserve air and water quality. These ideas have since woven into Metroplan’s MTPs and continue their influence in this plan.
Plan Influences, From Our Partners (Appendix ** List of Related Studies)
In addition to Metroplan’s documents, Transforming Mobility is informed and advised by plans from transportation partners.
• Arkansas Strategic Highway Safety Plan (ARDOT, 2022)—A comprehensive framework to reduce fatalities and serious Injuries on public roads.
• Arkansas State Freight Plan (ARDOT, 2017)—Identifies trends, issues, and needs; outlines policies, strategies and performance measures; and identifies high priority projects to guide investments in freight.
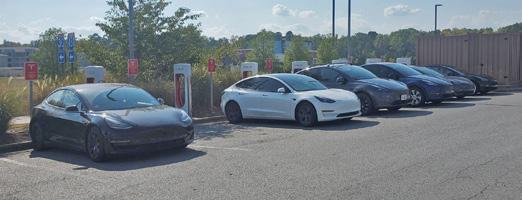
• Arkansas Electric Vehicle Infrastructure Deployment Plan (ARDOT, 2022) - Guides investments for new strategically placed Electric


Vehicle Supply Equipment charging stations to increase access for travelers nationwide.
• R.I.D.E 2020 (Rock Region METRO, 2020)—A comprehensive budget-neutral operational analysis to improve transit service in Central Arkansas that updates service area, improves directness and frequency, and expands microtransit while readjusting funding to meet current needs.


• We Move Arkansas—Transportation 2040 (ARDOT, 2017)—Arkansas’s Long Range Intermodal Transportation Plan is a policy context that addresses transportation issues in Arkansas for the next 25 years. The long-range plan takes a big picture look at the goals of the transportation system over a long term horizon.

• Arkansas Bicycle and Pedestrian Transportation Plan (ARDOT 2017)—This plan recognized the need and benefits of embracing walking and biking. These are integral to transportation and recreation and can strengthen economic and social vitality in the state’s communities. The plan identifies three goals and eight objectives to guide state initiatives.
• Full Steam Ahead (ARDOT 2023)—ARDOT’s 2023-2028 Strategic plan to deliver a modern transportation system to enhance safety and quality of life. To reach this vision, it establishes ARDOT’s core values, goals and objective for the transportation system, its employees, customer service and partnerships.
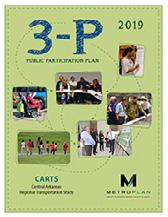
The Public Participation Plan (3-P)
The 3-P is a federally mandated document intended to (1) provide a guide to the planning process adopted by Metroplan; (2) increase public awareness and engagement; and (3) broaden the range of voices and views in the planning process. Critical to public engagement are transparency of process and ensuring early and continuing involvement in regional planning and implementation.
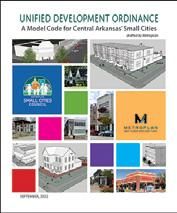
The Unified Development Ordinance (UDO), 2022, is a model zoning and subdivision regulation written for small cities but also applicable in neighborhoods of larger cities. It includes regulations for zoning, subdivision, utilities, and urban
design. Led by its guiding principles – clarity, ease of use, flexibility, safety, connectivity, sustainability/resilience, and equity/choice – the UDO serves as a local implementation tool for many of this MTP’s core policies. (Appendix 2)
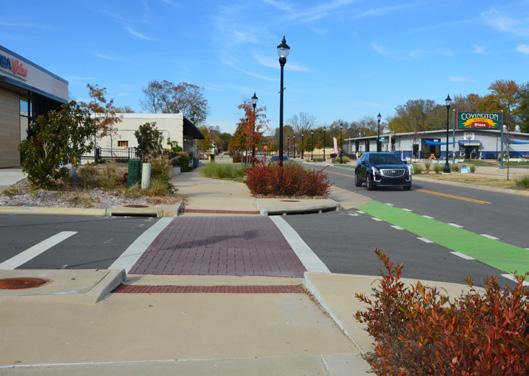
These guidelines recognize that our streets should be shaped by the context of their location and accessibility for multiple types of users. Streets not only connect us to homes, jobs, education, services, and recreation, but they are also our most active and visible public spaces. They have a tangible impact on our residents’ quality of life, economic competitiveness, local business’s success, and visitors’ perceptions of the region. The guide establishes an approach to street design that prioritizes all modes and offers the opportunity to implement design decisions with consistency, providing predictability in costs and regional uniformity in function and style. (Appendix 3)
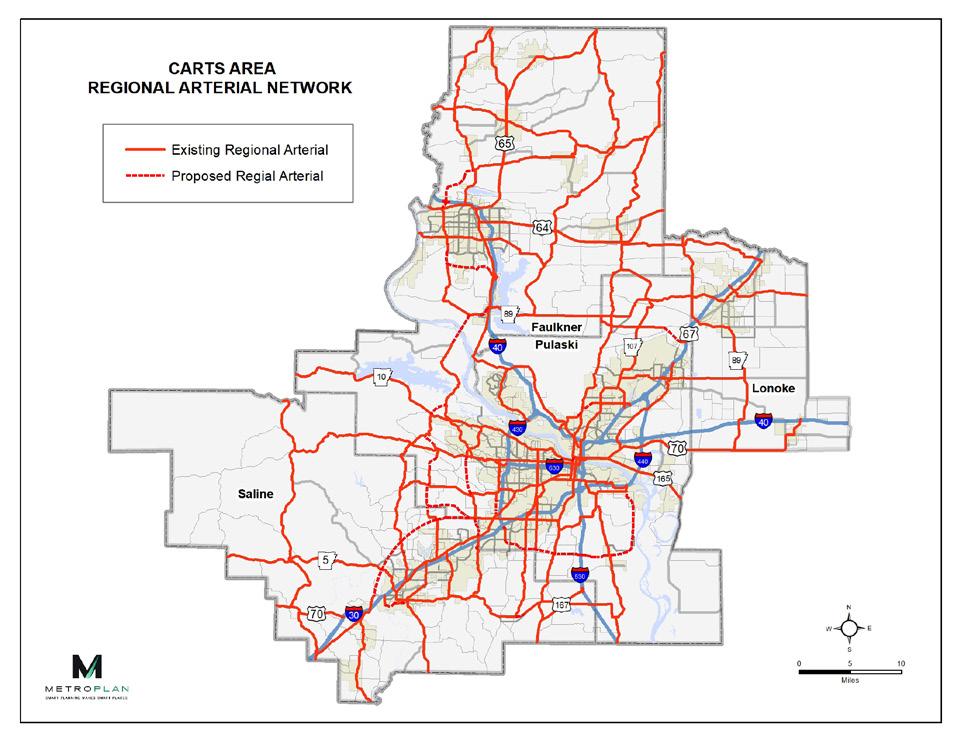
The RAN was created in 2002 to provide a highly connected system of roads that provided a regional alternative to the freeway system. The plan Identified 29 corridors and deemed 16 of them priority for Investment. This document has guided Metroplan’s Transportation Improvement Program development since the turn of the century. Projects such as intersection improvements, access management, technology upgrades, bridge replacement, and roadway widening were recommended for the subsequent 20-year period from adoption, and projects on these critical corridors continue today.
The study details six regionally significant active transportation corridors connecting the Little Rock-North Little Rock core to West Little Rock, northwest to Conway, northeast to Ward, east to Lonoke, southeast to Wrightsville and southwest through Saline County. The Metroplan Board set a strategic target of $55 million, over a ten-year period, in investments towards the construction of the 222-mile system of separated pathways to increase mobility for non-motorized travelers. The plan also


recognizes critical trail segments and imparts design and wayfinding guidance for system buildout. (Appendix 4)
(To Be Completed 2024)
The plan will set goals, recommend policies, and identify demonstration projects to significantly reduce roadway fatalities and serious injuries to increase safety for all road users in Central Arkansas. The study will analyze current conditions system wide and consider equitable solutions for pedestrians, bicyclists, transit riders, motorists, personal conveyance and micro-mobility users, and commercial vehicle operators. (Appendix 6)
Metroplan’s original 20-year MTP planning horizon sunset in 2020. Work towards the region’s new transportation vision began in 2019, as Metroplan formed the citizen-based Regional Advisory Committees and engaged the public
Metroplan, ARDOT, and local sponsors often develop corridor plans that define needs and opportunities to improve our transportation network. These studies may examine new major connections, reassess capacity and traffic signal operations, or determine multimodal infrastructure needs along certain segments. Recent examples like the South Loop Study, East-West Connector, Highway 89, Highway 107 will inform project development in the MTP.
through the Connecting Central Arkansas Public Outreach Initiative. After synthesizing the public’s contribution, the RAC recognized five recurring themes for the region’s future.
Table 3.1. The five goals identified during the outreach initiative
1: Active Neighborhoods and Placemaking
Transportation investments and land development practices should achieve active walkable and bikeable communities, transit readiness, and quality public places, while supporting economic vitality and livable communities.
Transportation infrastructure should link the region’s jurisdictions, neighborhoods, and activity centers by defining a robust, seamlessly connected multi-modal system. All users should have access to affordable transportation options that link homes, employment and essential services.
The transportation system should be designed and maintained to address infrastructure condition, congestion, safety, and environmental impacts. The transportation system should support the needs of a region with varying urban, suburban, and rural populations and landscapes.
From policy to infrastructure construction and maintenance, innovative ideas and technologies should be deployed to benefit pedestrians, motorists, transit riders, cyclists, and telecommuters. Freight movements should be optimized using intermodal connectivity.
Regional partnerships, policies, and programs should encourage local policy decisions and investments that foster a connected and equitable transportation system that elevates Central Arkansas nationally.
Appendix 5 documents the comments received during outreach.
Through a synthesis of public outreach, review of existing plans from Metroplan and partners, and the development of new planning documents, Central Arkansas: Transforming Mobility identifies nine core policies to guide Metroplan’s transportation decision making and land development in the region. These policies move us closer to our regional goals.
Maintain current roadway network and prioritize projects that optimize existing infrastructure before expanding capacity.
3
Support regionwide transit development that adapts to a dynamic transportation environment.
6
Design and implement multimodal corridors based on 7 corridor types from the Multimodal Guidelines: Connectivity, Accessibility, Safety, Placemaking, & Active Transportation
2
Embrace new technologies and best practices to optimize mobility and protect the environment. (ITS Plans and State EV plan, Smart Streets Plan)
7
Make equity and accessibility integral to all Metroplan’s planning efforts through consistent and systematic, fair, just, and impartial treatment of all individuals.
1

Metroplan’s Core Policies reflect our commitment to strengthening communities and transforming mobility for all users in the region. These are strategies that help guide investments, reevaluate land development decisions, identify innovation, and collaboratively plan to align with our Regional Goals.
Strengthen coordination between land development and the transportation network by encouraging mixeduse and flexibility in housing.

Develop the Regional Greenways to create a more complete transportation network.
4 5
Build upon state freight planning to identify critical local freight corridors and increase intermodal options.
8
Collaborate with local, regional, and state partners to advance Central Arkansas.
9
Make equity and accessibility integral to all Metroplan’s planning efforts through consistent and systematic, fair, just, and impartial treatment of all individuals.
Mobility is defined as speed or ease of travel and has been the key measure of a strong transportation system. However, accessibility is more important for an equitable system.1 The difference between the two concepts is simple:
Mobility is how far you can go in a given amount of time. Accessibility is how much you can get to in that time.
Executive Order 13985, Advancing Racial Equity and Support for Underserved Communities through the Federal Government (2021) defines equity as the “… consistent and systematic fair, just, and impartial treatment of all individuals, including individuals who belong to underserved communities.…” 3
Accessibility has long been equated with the Americans with Disabilities Act (ADA), first passed by Congress in 1990. This was pivotal in mandating minimum accessibility standards for the built environment and transportation systems. Access for people of all physical or mental capabilities is fundamental to ensuring a just and equitable transportation system and thus a key component of this core policy. Now, planning professionals realize the importance of creating accessibility for everyone to easily reach local amenities, be it the transportation system, parks, civic facilities, or essential services.
and
Accessibility in this broader sense requires an integrated view of transportation and land use since decisions made in one field will intrinsically affect the other. Planners and decision-makers must consider who takes trips, to where, and how they choose to travel. The underlying goal of any regional transportation system is to connect people to economic opportunity and quality of life, and accessibility is the way to measure the ease of reaching a destination, no matter how one chooses to travel.2
Equity in transportation planning means fairness in accessibility, safety, and modal options to meet the needs of all community members based on their unique needs and challenges. Metroplan’s Public Participation Plan (3-P) guides equity in our transportation planning process by considering equity early and often through public participation, data collection and analysis. This improves the planning process’s ability to adequately respond to the needs of the community it serves.
A central goal of transportation is to facilitate social and economic opportunities by providing equitable levels of access to affordable and reliable transportation options based on the needs of the populations being served, particularly populations that are traditionally underserved.
An equitable transportation plan considers the circumstances impacting a community’s mobility and connectivity needs, and this information is used to determine the measures needed to develop an equitable transportation network. To attain an equitable transportation network, all components of Title VI, environmental justice (EJ), and Nondiscrimination must be considered.
—USDOT, Coming Together for Equity4
1 & 2 strongtowns.org/journal/2018/10/17/the-difference-between-mobility-and-accessibility
3 & 4 [1][3] whitehouse.gov/briefing-room/presidential-actions/2021/01/20/executive-order-advancing-racial-equity-and-support-for-underserved-communities-through-the-federalgovernment/
The Bipartisan Infrastructure Law (BIL), includes provisions for housing considerations in the metropolitan transportation planning process. Added language includes integration of equity/accessibility considerations; specifically:
• encouraging and promoting the safe and efficient management, operation, and development of surface transportation systems that will better connect housing and employment;
• adding officials responsible for housing as officials with whom the Secretary shall encourage each MPO to consult;
“Great Recession”) has dramatically changed the lives of the elderly. In some parts of the metropolitan area, as many as one in four elderly are dependent upon social services and charitable organizations for the day to day existence and rank among the poorest households in the area. elders are inextricably linked to affordable housing and public transportation. Unable to make large modifications to their budgets, poor elders rely on low cost housing. Occupancy levels at public housing exclusively for the elderly attest to this dependence by maintaining record levels of tenants. Their dependency is exacerbated by the proliferation of health concerns, particularly among poor elders. These elders are tethered to low cost housing designed to address medical concerns (housing built with universal design standards that incorporate a step-free entry, single-floor living, reachable controls and switches). Seniors in increasing numbers require public transportation that will drop them off and pick them up at medical facilities. This specialized transportation also provides the elders with vital links to goods and services and allows them to retain contact with their communities despite their declining mobility.
Two RCAPs have particularly high levels of elderly households living below the poverty level, census tracts 12 and 30.01. In both tracts, the number of poor
• requiring the metropolitan transportation planning process for a metropolitan planning area to provide for consideration of projects and strategies that will promote consistency between transportation improvements and State and local housing patterns (in addition to planned growth and economic development patterns);
• adding assumed distribution of population and housing to a list of recommended components to be included in optional scenarios developed for consideration as part of development of the metropolitan transportation plan;
The disabled population is not concentrated in any one city, census tract, or area in the region. In contrast, this population is diffused in such a manner, that in most (if not all) municipalities they are represented. The disabled, while well-represented in the workforce, are more likely than those without a disability to live at or below the poverty threshold. There is also concern, due to their low wages in comparison to those without disabilities, that there are many opportunities in which the disabled might be excluded from in large part. These “missed opportunities” may be in: 1) pursuing post-secondary education, 2) being over-looked for raises and promotions, or 3) discrimination when they are considered for employment. Although a network of programs, agencies, and organizations exists to address these disparities, it is possible that many of the disabled are unaware of or are not connecting to these resources. A critical concern must be those with disabilities who are living in poverty, particularly those living in areas of limited access. For this segment of the disabled population, being connected is essential to creating independent, healthy, sustainable lifestyles. Integral components to their social and economic elevation and connectedness will be transportation, housing, and employment opportunity.
Chapter 5 Sources

• adding affordable housing organizations to a list of stakeholders MPOs are required to provide a reasonable opportunity to comment on the metropolitan transportation plan; and
• Encouraging the transportation planning process to address the integration of housing, transportation, and economic development strategies by developing a housing coordination plan.5
2005–2007 American Community Survey PUMS; http://www.apa.org/pi/ses/resources/publications/factsheet-disability.aspx (Accessed on October 31, 2013).
and
5fhwa.dot.gov/bipartisan-infrastructure-law/metro_planning.cfm
Core Policy 2. Design and implement multimodal corridors based on seven corridor types
Design and implement multimodal corridors based on seven corridor types from the Multimodal Infrastructure Guidelines, for: Connectivity, Accessibility, Safety, Placemaking, and Active Transportation.
Metroplan’s key function is guiding investments in transportation infrastructure. Core Policy 2 recognizes that navigating the region should be easy for all modes. Whether on foot, bike, behind the wheel, or riding transit, residents should expect connected, accessible, and safe transportation corridors that support a healthy, active lifestyle.
How we build infrastructure must complement each neighborhood’s individual character. A “one-size fits all” approach based on a set “Functional Classification System” does not account for similar type streets, like a major collector, that trace suburban residences versus one that crosses a town center. These two environments look and act very differently. Whereas the suburban collector may attract some pedestrian and bike activity, a town center will be teeming with these users alongside transit and private vehicles. This means the infrastructure adjusts to find the right balance to make it safe and accessible for everyone.
Metroplan developed the Multimodal Infrastructure Guidelines to solve the challenge of building in different environments for different travelers. The guide identifies corridor types and establishes design principles for each. The study visualizes corridors that describe the safety and accessibility features, the connections and interactions between modes, and elements that make a street vibrant and healthy. The guide also suggests specific treatments for interacting with transit, needed street amenities, accommodating curbside freight delivery, intersection safety, and traffic signalization techniques. To see the full report, see Appendix 3 for more details.
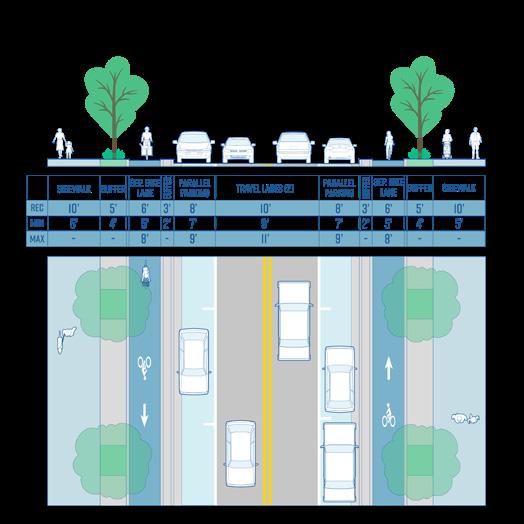
Source: Multimodal Infrastructure Guidelines

SAFETY + ACCESSIBILITY
Streets should be safe for everyone. All design features should reinforce local access, appropriate speeds, driver awareness, and ease of use.

VIBRANT + HEALTHY
Streets are equipped with elements that support their role both as paths and as public spaces for interaction and exchange.

CONNECTIONS MATTER
Streets should be designed for users of all ages and abilities, transit users, bicycle riders, micomobility users, and people who drive.
The Multimodal Infrastructure Guidelines establish character corridors that frame how to apply best specific designs for multiple transportation modes regardless of the street classification. See Appendix 3 for more information.
Corridor
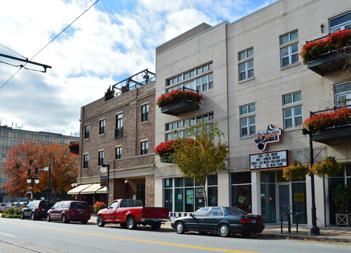
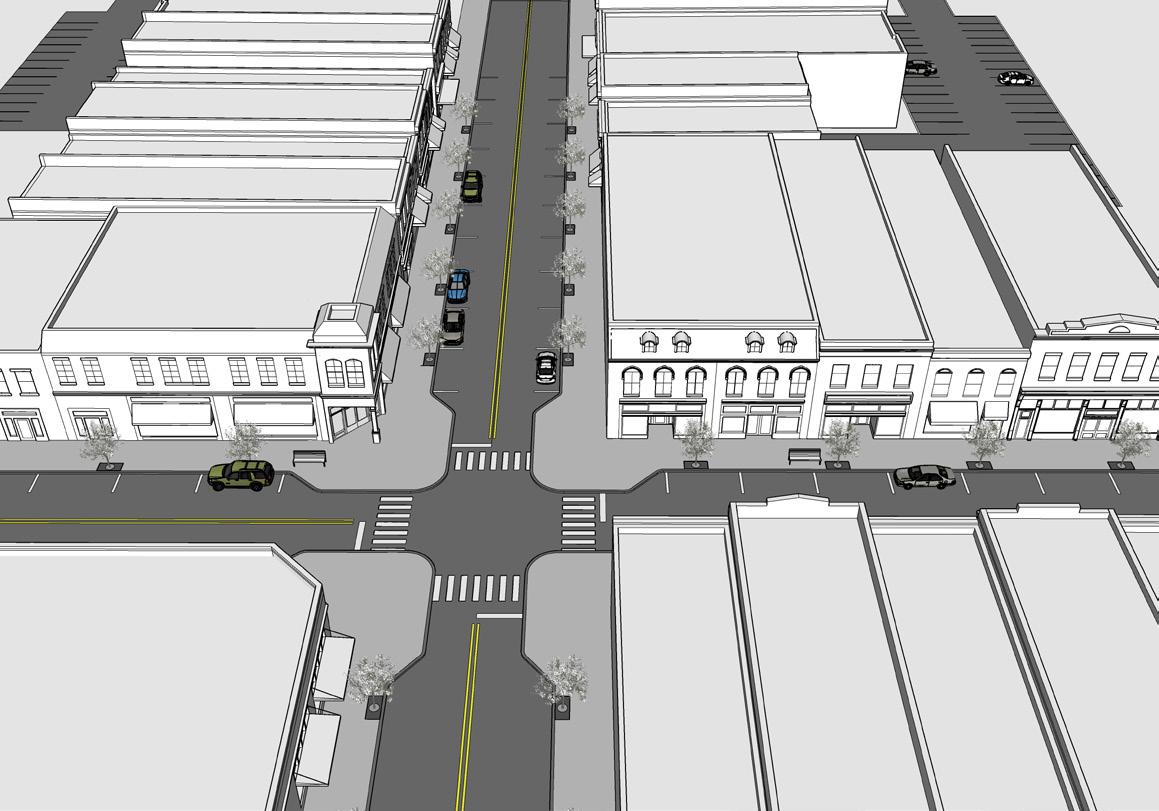
Downtown Mixed Use
Most Urban with heavy pedestrian traffic, street parking and diverse business and residential types.
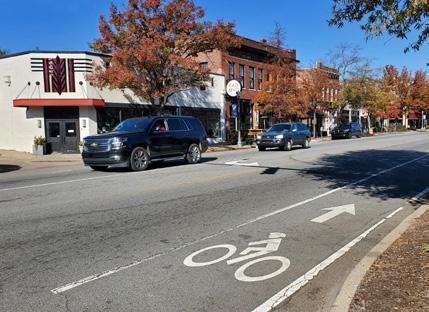
Town Main Street
Denser commercial heart of a small town over a few blocks.
Suburban Residential Connector Connect multiple neighborhoods, employment and commercial areas and accommodate cars, walkers, bike riders, and transit.
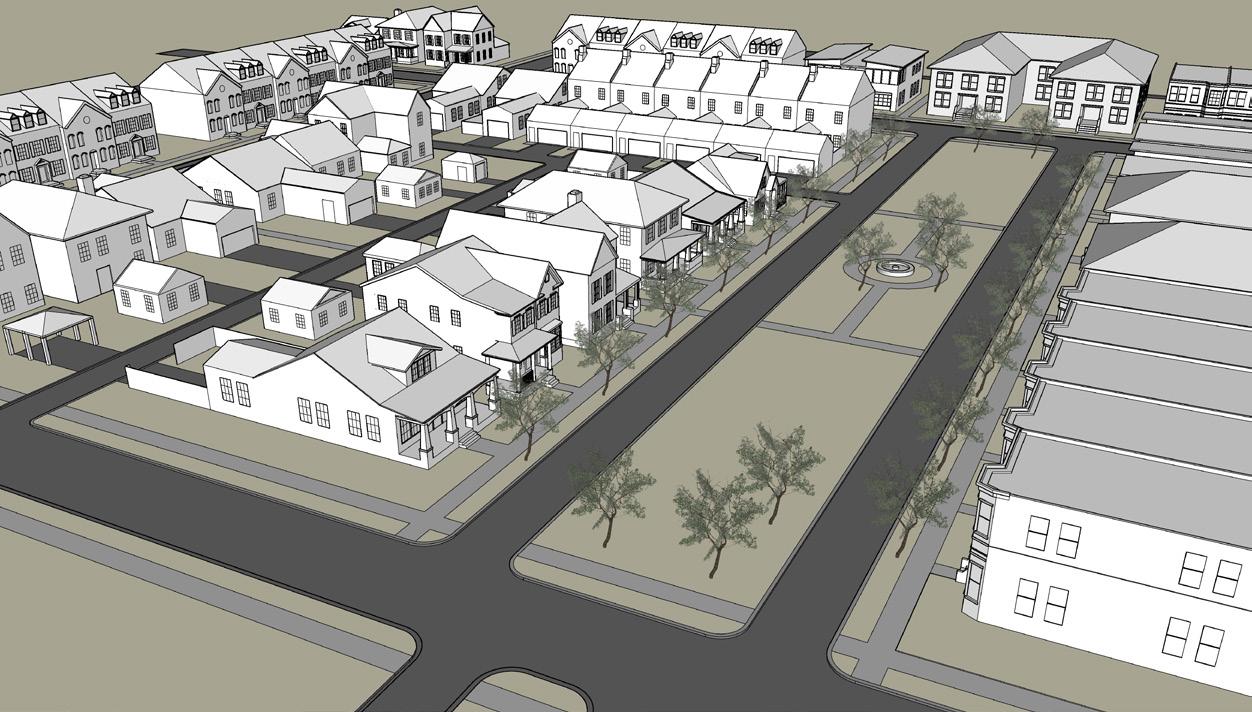
Urban Residential Neighborhood streets that support low intensity localized travel and enhance residents’ quality of life.
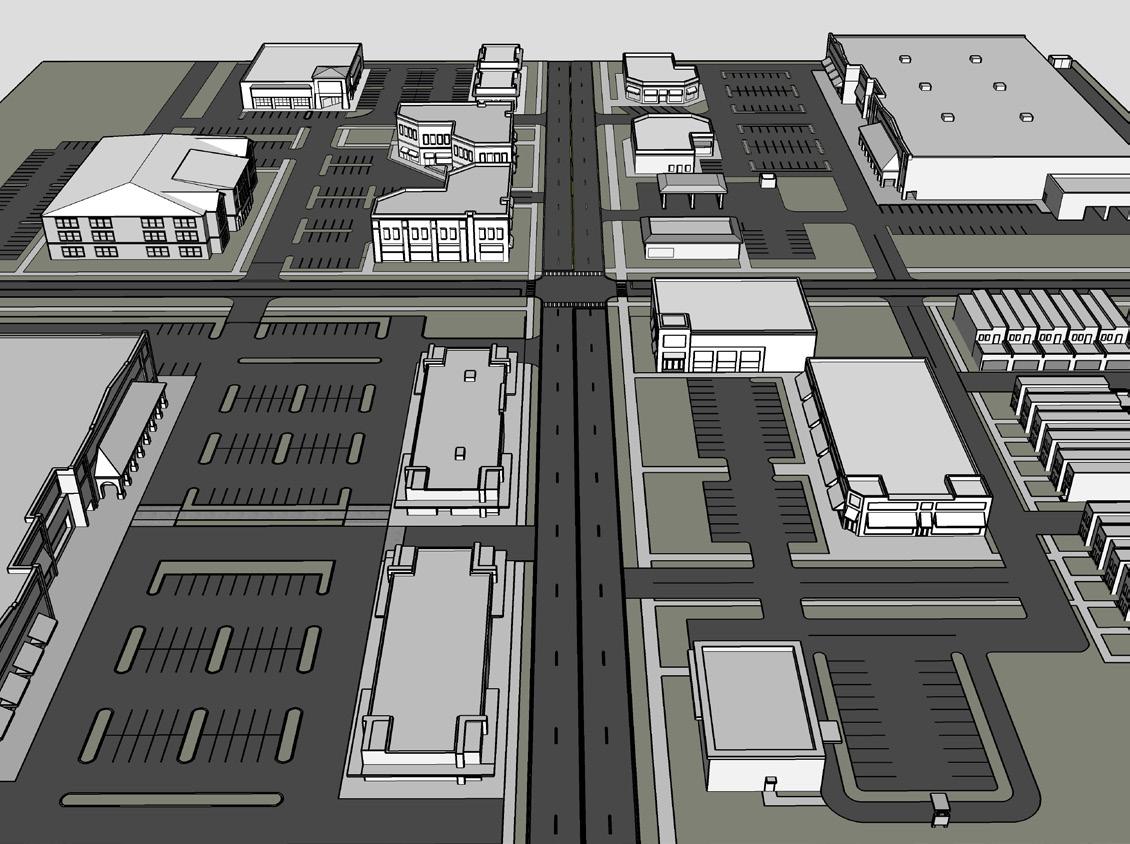
Suburban Commercial
Wide, high speed roads with commercial development, distance between intersections, and driveway access. Sidewalks often line the street with crossings at intersections.
Industrial Accommodate large truck traffic, loading, and distribution needs of industrial businesses. Usually found away from downtowns and residential areas.
Rural Street
Connect small communities over longer distances. Wide paved shoulders can accommodate bike riders and pedestrians.
• Principal Arterial
• Minor Arterial
• Collector
• Local Street
• Principal Arterial
• Minor Arterial
• Local Street
• Minor Arterial
• Collector
• Local Street
• Principal Arterial
• Minor Arterial
• Varies
• Principal Arterial
• Minor Arterial
• Major Collector
Core Policy 3. Maintain current roadway network abefore expanding capacity
Maintain current roadway network and prioritize projects that optimize existing infrastructure before expanding capacity.
With an ever-increasing cost to maintain our transportation system and finite funding, funding is focused on projects that maintain existing facilities in a good state of repair and look for opportunities to improve transportation efficiency. Like previous MTPs, Transforming Mobility establishes a priority toward maintaining our aging infrastructure and finding ways to optimize its utility.
Central Arkansas has 6,700 lane miles of functionally classified roads, 1,250 bridges, and countless miles of sidewalks and bike facilities. Roadway rehabilitation is critical to extending the life of these corridors. Approximately $75 million in federal funds annually are designated towards network maintenance. This amount is still far less than required to keep these facilities in a good state of repair. It must be supplemented with additional funds to maintain the network in an affordable manner.
Since new roadway construction and major widening are expensive endeavors, the remaining federal funds are focused on system efficiency projects. These are cost efficient methods to improve and maintain traffic flow and keep the transportation networks in a good state of repair. System
The 2023 to 2026 Transportation Improvement Program includes intersection and interchange improvements, bridge replacements, and Intelligent Transportation System (ITS) improvemments. An interactive map is available at metroplan.org/maps
efficiency projects include intersection projects, Intelligent Transportation System implementation, and interchange improvements. Surface Transportation Program funding may be added to funding available for the maintenance and reconstruction of critical infrastructure (bridges). Where roadway widening is crucial, it should be coordinated with rehabilitation projects to minimize overall cost.
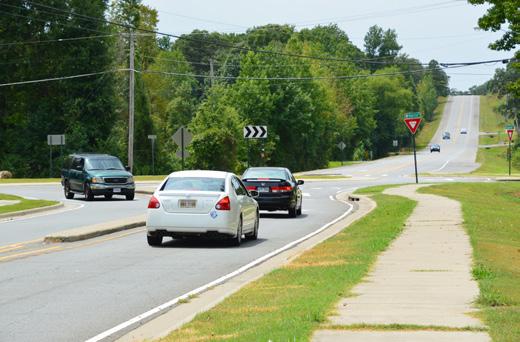
Roundabout often improve traffic throughput while enhancing safety for vehicles, pedestrians, and bicycles.
Freeways are vital to commuters and are major freight movers. Keeping them well-maintained is important to our economic competitiveness. Partnership with ARDOT has led to substantial investments for our region’s freeways. Major reconstruction on Interstates 30, 40, 430, and 630, along with improvements to interchanges, have improved operations and revitalized deteriorating roadways.
Sections of our freeways are still due for a major rehabilitation, particularly segments in the urban core. Freeways, such as I-630 in downtown Little Rock, present an opportunity for multimodal connections when they are rebuilt. Metroplan will work with ARDOT to ensure that overpasses, underpasses, pedestrian bridges and more innovative solutions, like deck parks, are considered in project development. These connections can bridge the divide between neighborhoods and commercial core.
The RAN provides an alternative to the freeway system. Metroplan must now determine how it will maintain the corridors it has invested in and where additional investments are needed. Moreso, how do Metroplan RAN projects improve safety, travel time reliability for commuters, and target multimodal mobility accommodations strategically? Innovations to intersections and traffic signal technology can optimize our current roadway performance. The Multimodal Guidelines can help identify the character of a street and appropriate treatments that would fit into roadway rehabilitation. These techniques should be considered as we reevaluate the RAN.
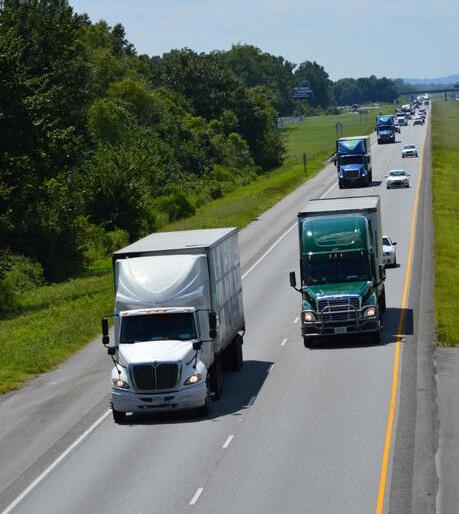
Table 3.3. Excerpt from ARDOT’s Estimated Costs Per Mile
NEW BRIDGES AND BOX CULVERTS
(Does not include approach)
New bridge (on-nhs)
per sq. ft (deck area) WIDEN EXISTING ROADWAY
per lane mile (Full depth reconstruction) OVERLAYS
Source: https://www.ardot.gov/wp-content/uploads/2021/11/2020-CPM.pdf
Core Policy 4. Develop the Regional Greenways to create a more complete transportation network
Develop the Regional Greenways to create a more complete transportation network.
Metroplan is serious about connecting active transportation modes region-wide. In 2023, it adopted a system of Regional Greenways that are:
• Transportation-Focused—A viable transportation option.
• Physically Separated—Separated from traffic.
• Inclusive—All ages and abilities can use it.
• Consistent—Easily recognized systemwide.
• Safe—Accounts for user visibility and access to emergency service.
• Context Sensitive—Adjusted to challenges of the landscape.
• High Quality—Designed to the highest standards.
• Well-Connected—Population centers and major destinations linked.
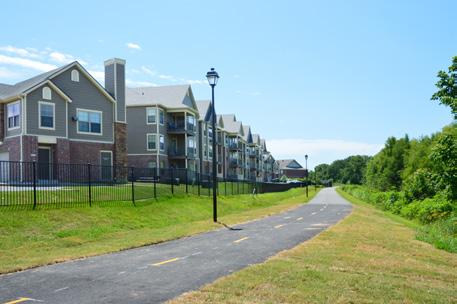
The Greenways will play an enormous role in addressing transportation equity. The complete plan is a wellconnected, safe alternative for vulnerable populations. Those without consistent access to a car, non-driving age youth, elderly, and disabled populations will be able to navigate a system separated from busy streets with comfortable conditions.
All users will enjoy the connections between neighborhoods to essential and desired destinations. The greenways link commercial zones, schools, parks, and other activities to maximize the greenway’s transportation utility. For local jurisdictions, trails can be installed for significantly less cost than roadways while providing connections that their residents expect.
In addition to equity, the Greenways will enhance economic development, health, and the environment. The Greenways plan highlights four case studies from trail systems across the nation. Home values and business revenues near trails are consistently higher, communities feel more engaged, users are healthier and happier, and more time is spent walking or riding a bike instead of behind the wheel.
The Regional Greenways map on (the next page) proposes six corridors to connect our region. Chapter 4 will discuss the routes and implementation of the plan in more detail. The Central Arkansas Regional Greenways plan can be found as Appendix 4.
Metroplan will invest $55 million over 10 years toward planning and developing the Central Arkansas Regional Greenways.
Figure 3.2. Central Arkansas Regional Greenways Plan
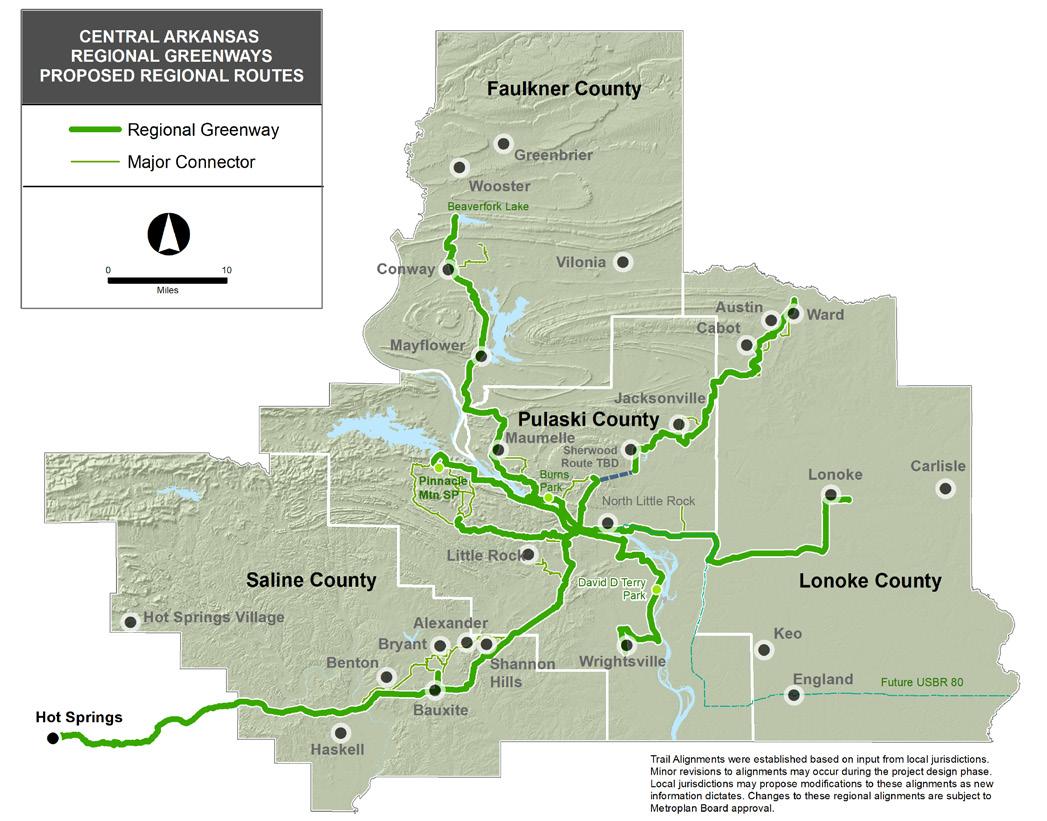
NOTE:
Trail Alignments were established based on input from local jurisdictions. Minor revisions to alignments may occur during the project design phase. Local jurisdictions may propose modifications to these alignments as new information dictates. Changes to these regional alignments are subject to Metroplan Board approval.
Strengthen coordination between land development and the transportation network by encouraging mixed-use and flexibility in housing.
Metroplan has recently completed or initiated several planning efforts to address the transportation-land development connection. As discussed previously, the Multimodal Guidelines addresses specific infrastructure for pedestrians, bike riders, transit users, and cars that can be developed around existing and future corridors of every type. These recommendations complement the development that already exists on a corridor.
For the greatest impact on mobility, cities must rethink their development ordinances. Traditional style development, with town centers and neighborhoods mixing residential and commercial, have been hampered or disallowed in zoning and subdivision ordinances for decades. Code amendments have adapted to new attitudes in development but are limited by the complexity of
Access management is encouraged by the US Department of Transportation as a tool to better manage roadways, improve safety, and maximize operations and efficiency. Access management is best accomplished when local governments and states manage access to facilities that preserve its investment while still providing development opportunities. Additional information on access management can be found at Access Management - FHWA Operations (dot.gov).
mounting changes. Cities need techniques to guide new land development or redevelopment that provide the best mobility for all modes.
It is unreasonable to completely dismiss old zoning practices. The best tool in Metroplan’s box for strengthening our land development and transportation system’s connection is the Unified Development Ordinance (UDO). The code is a bridge between old and new zoning that is simplified, flexible, and can be applied throughout a small city, or direct neighborhood specific plans in bigger cities.
The following pages show development examples endorsed by the UDO to plan accessible, multi-mode mobility neighborhoods.
Metroplan’s Unified Development Ordinance (UDO) aims to help member cities design rules that encourage high-quality land development that is affordable and livable.
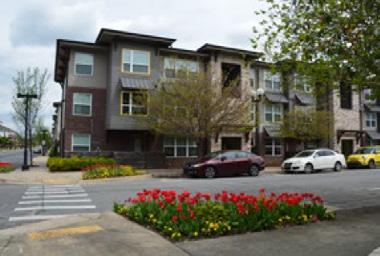
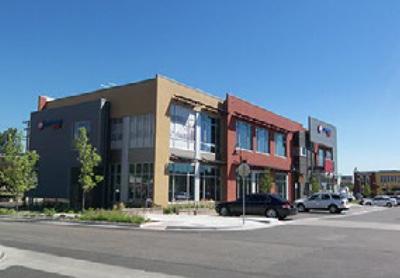
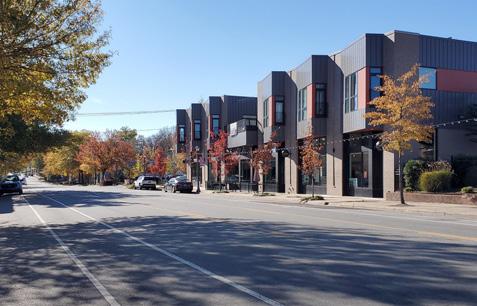
Commercial corridors are ideal infill development locations for a variety of multi-family types. Providing needed housing in close proximithy to jobs and daily destinations.
Mixed-use infill can increase corridor vibrancy while minimizing new auto trips and congestion.
Encourage site design that minimizes the impact of auto-oriented businesses by framing streets with occupied buildings and moving building entrances closer to the street.
Provide pedestrian connections from street to building entrances and to adjacent properties.
Liner buildings are pedestrianfriendly infill opportunities on under-utilized parking lots which help frame the street and creat a more pedestrian-friendly corricor while also calming traffic.
Orient parking lots behind or to the side of buildings and reduce the width of parking lots that pedestrians must cross.
Encourage drive-thru designs that reduce driveways and orient buildings closer to the street.
Provide cross access between businesses to minimize driveways and the need for trips onto major corridors.
Allow mixeduse buildings.
Encourage active ground floor uses.
Locate surface parking behind buildings and utilize on-street parking. In smaller neighborhood commercial nodes locate parking behind or to the side of buildings. Encourage shared parking. Consider reducing or removing parking minimums.
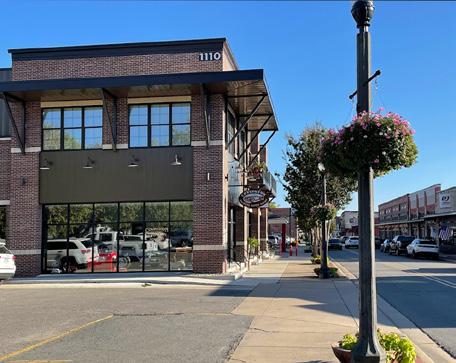
Context-sensitive street design should be used in walkable town centers. Smaller curb radii reduces vehicle turning speed and increases pedestrian safety. Sidewalk bulb-outs and high visibility crosswalks can further increase pedestrian safety.
Buildings should abut the sidewalk with no side setback. A required build-to-line can ensure buildings create a continuous streetwall that enhances both walkability and neighborhood vibrancy.
Focus on building form over building use. A form-based code or formbased overlay for the town center can ensure building types that help create a vibrant, walkable town center.
3.4.
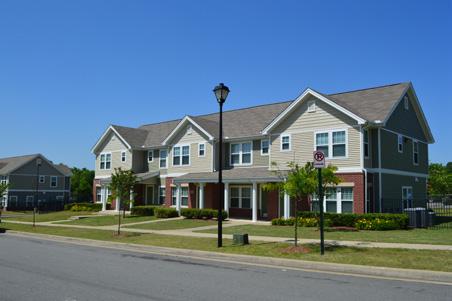
Gridded streets and stub connections to future neighborhoods increase accessibility and reduce traffic on major roadways. Stubbed out connections can ensure connectivity with future developments.
Smaller lot sizes and reduced setbacks can enhance walkability and increase sustainability by reducint the costs of infrastructure and city services.
Allow flexibility and mixing of housing types, such as single, family, townhouse, duplexes, quadraplexes and small multi-fammily buildings. These provide needed medium density housing options for a variety of household types.
Accessory dwelling units provide housing options for a variety of household ty[es, income levels, and stages of life.
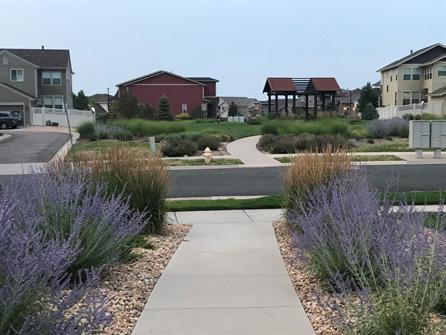
Clustered open space in public green space creates more usable open space for active and passive recreation while reducing the burden of lawn maintenance for the elderly.
Mid-block walkways and sidewalks enhance walkability.
Reduced block sizes and block lengths increase walkability.
Support regionwide transit development that adapts to a dynamic transportation environment.
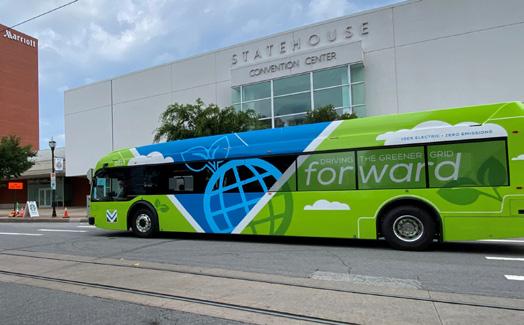
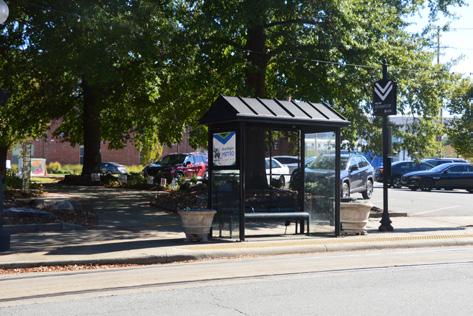
Transit should be leveraged to increase mobility for nonprivate vehicle travelers. An expanded, fixed route bus service, both regionally and locally, will be the spine of a system that includes on-demand, paratransit, streetcar, and van pool service, as well as new technologies to improve the transit experience and reduce carbon emissions. Investing in transit within the region provides residents and visitors with access to transportation mode choice, connects people to important destinations and helps mitigate congestion and negative impacts on air quality.
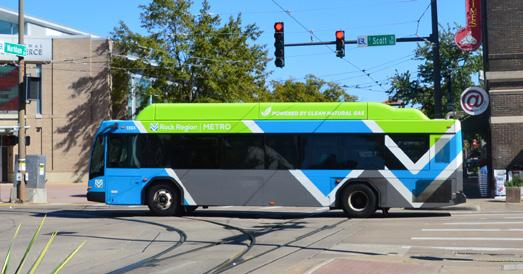
The CARTS area has multiple modes of transit service operated by one small urban public transit agency, one rural agency and several mainly nonprofit organizations. Rock Region METRO provides fixed route and on-demand service in Little Rock and North Little Rock, and recently launched a new on-demand service in Conway. South Central Arkansas Transit System provides limited service in Saline County. Multiple providers across the region provide service to specific populations through the Federal Transit Administration’s Section 5310 program.
The largest transit provider in the region, Rock Region METRO, relies heavily on funds from local jurisdictions, particularly Little Rock and North Little Rock. Federal funding and revenue from fares makes up much of the rest of its funding. Funding challenges hinder METRO (and other transit providers) from providing longer transit hours and more frequent route service, like 10-to-15-minute bus arrivals. Transit must be supported by a guaranteed long-term investment to increase ridership.
Recent trends suggest that flexible microtransit, in zones of greater ridership, could accommodate users with ondemand style service from smaller fleet vehicles. Customers can schedule a pick-up and drop off location via their smart phone. METRO has begun using this technology and will monitor its effects on the transit system. Although microtransit from public transit organizations is relatively new, it is already showing where transit demand is rising. Microtransit service shows promise, but yearly performance evaluations will be necessary to determine its utility.
Local services must creatively adapt to increasing transportation costs, nevertheless, traditional fixed route service will provide the consistency that transit riders expect. However, with current funding constraints, expanding these routes, increasing their frequency, or extending service hours is a challenge. Transit maintenance will be the responsibility of the provider as well. A dedicated funding source should be considered to maintain efficient operations and make these improvements.
Ridesharing and micro-mobility vehicles are increasingly used to support personal mobility. These can be competitors to transit but also enhance its reach. Transit riders may hop on a scooter to get from the bus stop to their final destination. Conversely, ridesharing can be more direct to a rider’s destination, and steer them away from public transit. As these options increase, transportation planning must account for their impacts on our roads and our budgets.
A comprehensive regional transit service would increase the mobility of our residents. Metroplan will pursue a regional transit plan to explore potential demand, identify crucial corridors, and funding for transit between communities. Regional transit would be most useful for commuters during peak travel hours. In turn, fewer private vehicles will be utilizing tour roads at peak periods, increasing safety and efficiency.
One regional desire is to pursue a high-quality Bus Rapid Transit (BRT) system that delivers fast and efficient service. BRTs include many service enhancements over traditional bus service that aim to increase service quality and efficiency. These enhancements include dedicated bus lanes, busways, traffic signal priority, off-board fare collection, elevated platforms, and enhanced stations. Because BRT contains features similar to a light rail or subway system, it is often considered more reliable, convenient, and faster than regular bus services, without the large upfront capital investment that a light rail or subway system would require.
Shared parking opportunities must also be considered along regional routes to provide access for individuals that prefer to park and ride. Metroplan and transit providers must collaborate with ARDOT to implement transit infrastructure along freeway corridors and state arterials.
Successful regional transit cannot be achieved without additional investments and integration with local transit networks. Local service drives regional demand because it provides a foundation of ridership on which to build, and the assurance that a rider can reach their final destination after their regional route ends. A regional plan must identify communities that can fund local service that could feed a regional system. Local transit expansion is first priority to serve Central Arkansans before regional transit can succeed.
Embrace new technologies and best practices to optimize mobility and protect the environment.
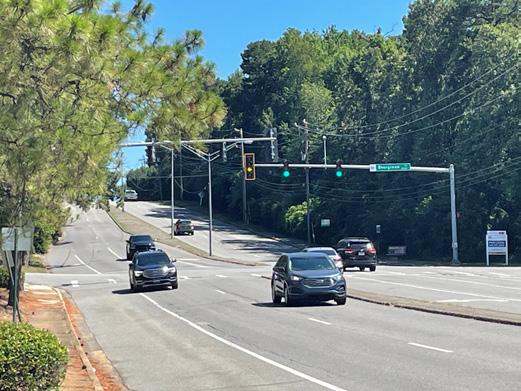
The number of new technologies in the transportation sector is rapidly growing. At the same time, innovative intersection designs provide opportunities to improve traffic flow while protecting and enhancing accessibility for pedestrians, bikers and transit users.
Most new cars now detect pedestrians, correct steering when one drifts out of its lane, automatically brake, and can alert drivers of a potential collision and to take a different route. Traffic signals are coordinated and adjust timing to traffic and will soon communicate with vehicles (N2X technology). These are just some of the developing innovations that will lead to a safer, greener, and smarter transportation system during the plan’s time horizon.
Metroplan is partnering with ARDOT to develop an ITS / Smart Streets Plan. ARDOT has already provided congestion relief with a managed lanes improvement on I-430 across the Arkansas River. Metroplan is cooperating with these efforts, and also playing a localized role by encouraging member city and county governments to improve street connectivity, intersection design, and pedestrian/ bike/transit accessibility. Metroplan’s Best Practices newsletter advances these critical planning goals.
Some of the newest opportunities may lie in sustainability efforts to reduce emissions and improve livability. Carbon forestry and landscaping can be developed on public rights-of-way and other public lands to absorb carbon and reduce the urban “heat island” effect in future years, while improving the physical attractiveness. The City of Phoenix’s “Cool Pavement” program has successfully reduced local temperatures by several degrees simply by using an environment-friendly pavement coating. Future ideas not yet anticipated here will undoubtedly abound and a key plan goal is to embrace them. Metroplan is developing an energy and environment innovation plan to identify these strategies for Central Arkansas.


Technology is not just impacting driver behavior; it seems that every new commercial is for an electric or alternative fuel vehicle. As additional charging infrastructure is built, the percentage of vehicles that use traditional fuels (gasoline and diesel) will decrease. This will have impacts on funding, maintenance requirements, and emergency response.
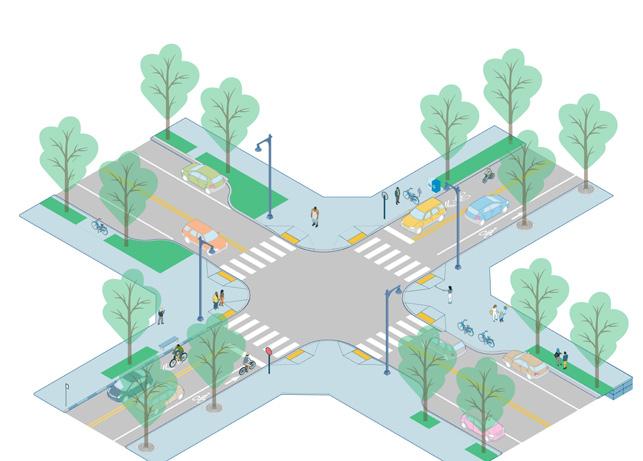
Landscaping can improve the appearance of streets and provide functional benefits such as shade, stormwater management, and better air quality.
Source: Multimodal Infrastructure Guidelines.
ITS technology keeps traffic moving safely and efficiently through monitoring (e.g., congestion, weather) and traveler communication (e.g., real-time electronic message boards, adaptive traffic signals, bus arrival times). ITS also has a role to play in reducing carbon emissions from cars and trucks. Our air quality improves when we spend less time idling in traffic and more time travelling at consistent speeds.
ITS technology keeps traffic moving safely and efficiently through monitoring (e.g., congestion, weather) and traveler communication (e.g., real-time electronic message boards, adaptive traffic signals, bus arrival times). ITS also has a role to play in reducing carbon emissions from cars and trucks. Our air quality improves when we spend less time idling in traffic and more time travelling at consistent speeds.
The Arkansas Department of Transportation operates a Traffic Management Center 24 hours a day and 7 days a week whose responsibility is to monitor, detect, respond and report on incidents that effect the state system. This helps clear incidents quicker, alert drivers, and improve safety. The state first managed lanes, across the I-430 Arkansas River Bridge, are also controlled by this center.
“Our nation is on the cusp of great opportunity in how we define our 21st century transportation system, one that can ensure greener communities, increased opportunity and equity, and safer streets for all Americans. The integration of technology is key as we build for the future.”
—ITS America Blueprint 2021 (The Intelligent Transportation Society of Amercia)
Build upon state freight planning to identify critical local freight corridors and increase intermodal options.
Imagine a region that is located close to the geographic and population center of the United States. Now, picture that area crossed by two major interstates, containing a key railroad logistical hub, and traversed by one of the longest navigable rivers in the country. For good measure, this region also offers a national airport. This is Central Arkansas. For any organization looking for a freightmoving mecca, the possibilities are endless.
Arkansas’ State Freight Plan, adopted in 2017, anticipates that statewide freight movement will grow substantially by land,
water, and air by 2040. In fact, trucking freight will grow by 44 percent, rail by 35 percent, water by 14 percent, and air by 190 percent. Our region is strategically located to play a major role in that growth, but we must bolster our freight planning first. A regional freight plan should capitalize on our advantages and overcome obstacles.
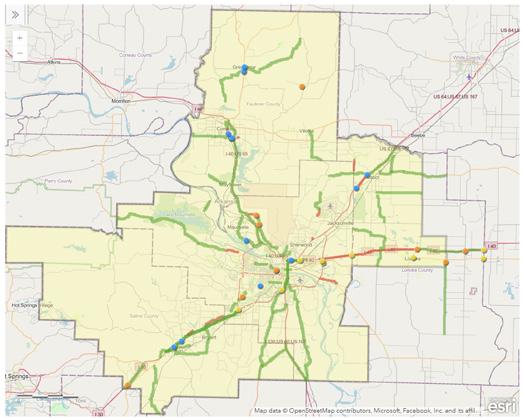
The map below shows the region’s major freight flows by roadway. As you can see, the east-west axis along I-40 and the southwest-to-east axis along I-30 dominate regional freight flows, with secondary flows along I-530, U.S. 67-167, and U.S. 64.
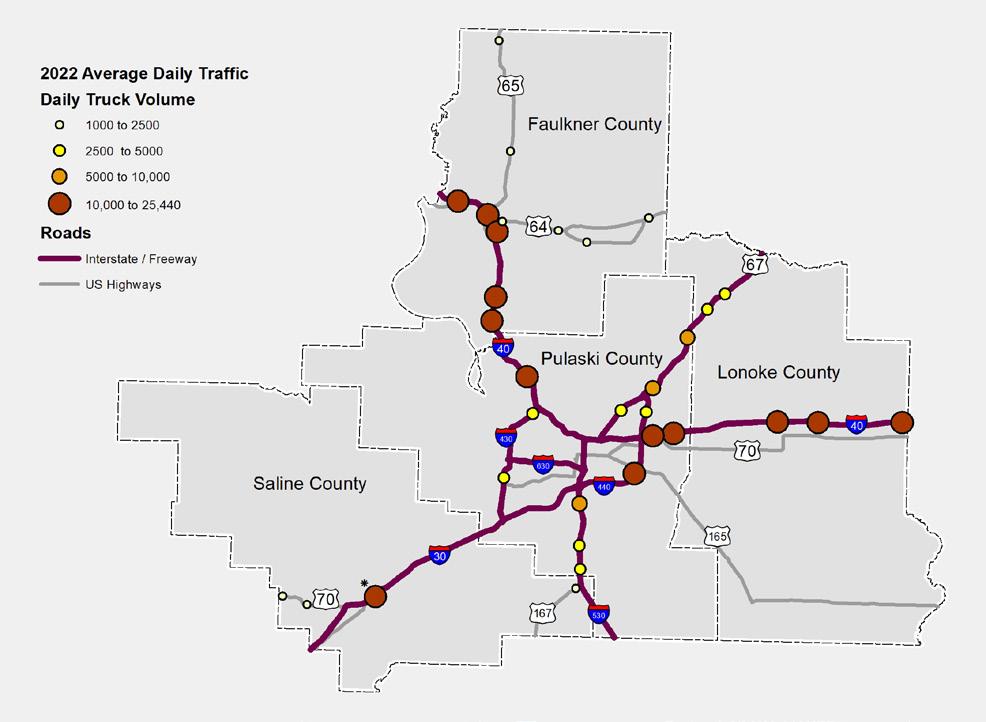
Source: ARDOT 2022
Metroplan will study trends, identify critical corridors, and look for opportunities to coordinate freight movement between modes. Here are a few topics for consideration:
• Roadway congestion. The Little Rock Region’s comparative advantage in freight movement stems in part from its comparative lack of traffic congestion compared with competing metro areas like Memphis, Dallas, St. Louis and New Orleans. A logical regional transportation strategy must include a goal of maintaining freight-moving capacity.
• Competition between freight and passenger vehicle needs. This includes recognition of how differing roadway designs affect freight and passenger flows.
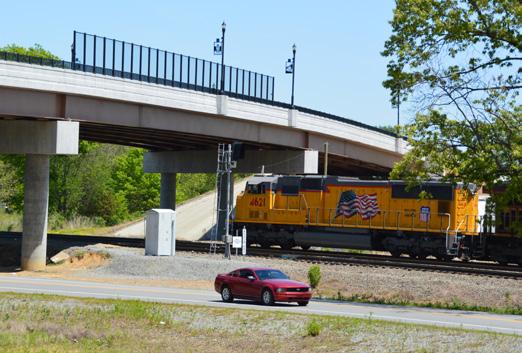
• Metroplan has made major progress since the late 1990s in replacing at-grade rail-road intersections with bridges. More needs to be done to reduce conflicts between rail and road traffic.
It is clear that freight flows are changing both nationally and locally. Local freight flows have grown especially fast because online shopping and delivery are becoming more popular. Take-out delivery and e-mail commerce have given a big boost to local delivery services. Long-distance trucking continues growing as well.
The map below depicts freight-generating facilities—mostly factories, warehouses, and distribution centers, of 250,000 square feet and greater. It is only a partial depiction of freight generation in our region, but demonstrates major freight centers in southern Conway, along the southwest axis on I-30, in Maumelle, in and near the Little Rock Port, and eastward along I-40.
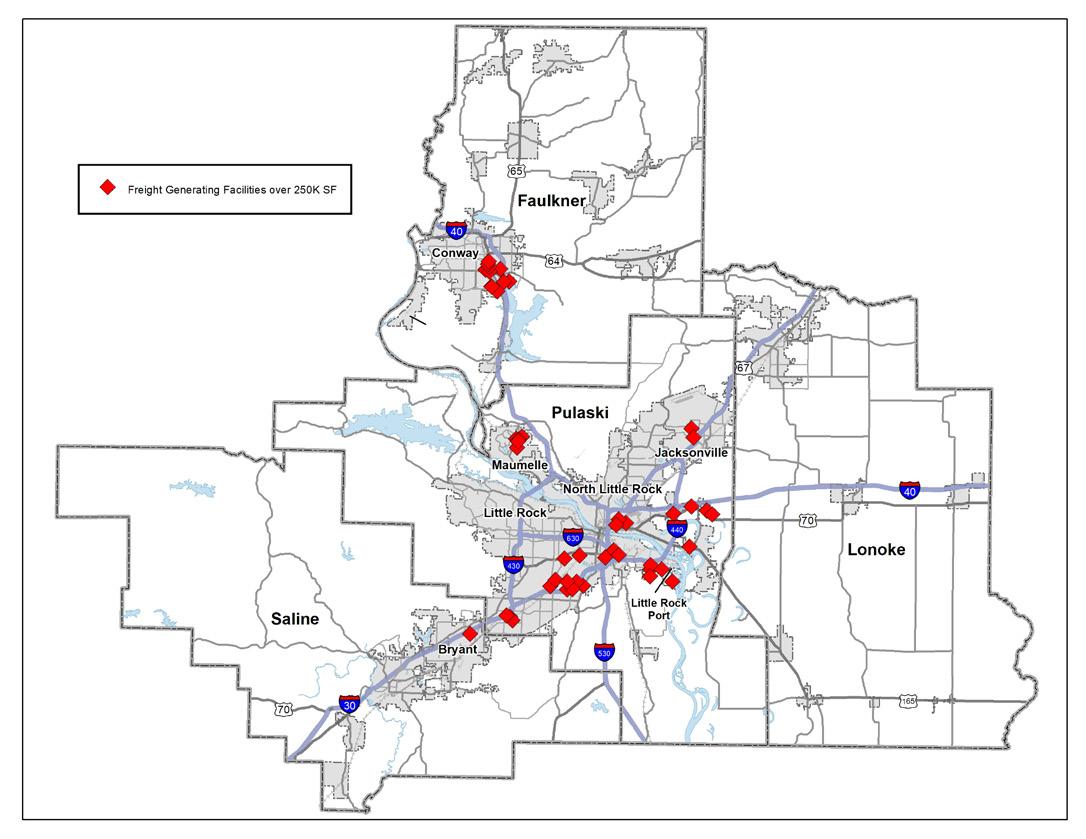
FREIGHT GENERATING FACILITIES OVER 250K SF
Collaborate with local, regional, and state partners to advance Central Arkansas.
A collaborative spirit has helped other regions become nationally competitive, leading to more opportunities for residents and attracting newcomers. Central Arkansas benefits when we coordinate efforts to enact improvements regionally. Metroplan will continue to strengthen bonds between its jurisdictions, residents, and organizations both public and private, to aid in policy development and infrastructure investments.
Metroplan plays a crucial role speaking for the Central Arkansas region, and acting for its overall interest. Metroplan has convened bodies for local planning issues in the past. Some have become separate entities. Rock Region METRO, Central Arkansas Risk Management Association (CARMA), and Mid-Arkansas Water Alliance (MAWA) are three examples of these efforts. Another potential collaboration is a regional mobility authority (RMA) that can finance, acquire, design, construct, operate, maintain, expand or extend transportation projects. Metroplan should remain at the forefront of regional planning issues.
Metroplan should reach further into the community to drive engagement in planning. Organizations that work with area jurisdictions, like the Central Arkansas Planning and Development District, Municipal League, and local chambers of commerce can help promote a shared vision and advocate for implementation of regional plans. Organizations that serve
a freight function, such as the Arkansas Trucking Association, The Port of Little Rock, and Clinton National Airport, can help Metroplan plan for moving people and goods more efficiently through our region.
With its unique advantage as a consortium of community leaders, Metroplan initiatives can spur extensive collaboration. Partnerships may come in many forms as we take action to advance Central Arkansas.
Metroplan is uniquely positioned to spearhead efforts to advance regional planning. The list below suggests partnerships that may help us deliver our Regional Themes.
Table 3.4. Suggested Partnerships
Project/ Initiative Action
Potential Partners
Regional Grants Review and develop applications for federal grants. City and county governments, the State of Arkansas, and nonprofit organizations.
Regional Greenways Memorandum of Understanding for maintenance of greenway sections. Education and advocacy for trail development.
Unified Development Ordinance
Better Communities Lecture Series
Develop a forum for UDO participants to discuss successes and issues.
Continue the Better Communities Lecture Series to highlight planning trends.
New Initiative Regional freight planning.
Transportation Improvement Program
Continue coordination on the TIP to identify the best projects for the region.
Legislation Coordination Work to understand and have a voice in law creation that affects our jurisdiction and MPO.
New Initiative Planning for technology and innovation in transportation.
New Initiative
Ozone Action Days
Develop educational materials and presentations to present during public outreach.
Continue expanding awareness of air quality issues in Central Arkansas by partnering with cities, schools, and other institutions.
Metroplan Board members and sustainability professionals set priorities for Central
Metroplan members, Local economic development offices
UDO participants
The Public, Developers, City staffs
ARDOT; Port of Little Rock, Clinton National Airport, Trucking Association
ARDOT; Rock Region METRO
Municipal League, Legislator Representatives, Metroplan Members
ARDOT, Rock Region METRO
The Public, private business
The Public, Metroplan members

As Metroplan updates our plans, multimodality will take precedent. The connection between modes, intermodality, will also be recognized more thoroughly in future efforts. Balancing our transportation system for all modes means addressing gaps in our planning study guidelines. This discussion focuses on studies that Metroplan will update or pursue in the near future.
Congestion Management Process (Federal Requirement, To be Completed 2024)
A Congestion Management Process (CMP) is required for transportation management areas that address congestion management through a process for safe and effective integrated management and operations of the multimodal system (23 CFR § 450.322). Metroplan’s CMP will consider frequently congested locations, safety concerns, scheduled projects, CARTS Travel Demand Model results, and technology to provide a more reliable transportation network.
The RAN was last updated in 2003 and will be reevaluated to determine its utility. Financial realities and priorities have changed after 20 years of development. Arterial roads will continue to be important to regional mobility. However, projects today must reinforce our commitment to multimodal mobility and ensure that our investments provide the most benefits to our users. Projects that optimize our current infrastructure, or upgrades for other modes of transportation may mitigate the need for new capacity on our critical
arterials. Metroplan will reassess its RAN during this planning horizon.
Metro2020 set the stage for freight planning in Central Arkansas, and that vision has carried throughout successive plans. Despite the sentiment, regional freight planning has been limited. Freight continues its importance as more goods are purchased online and retailers ship from burgeoning warehouse operations. The region is uniquely positioned on nationally significant freight corridors including I-40, the Union Pacific Railroad, and the navigable Arkansas River. This convergence should be leveraged, and a freight plan can optimize our economic opportunities.
Freight movement has changed since 1998, when METRO 2020 was adopted. Then, freight was dominated by trucks on long national and regional routes stopping delivering to local stores and manufacturers and moving on to the next region. Now, more locally generated freight trips are occurring because online shopping and delivery are becoming a popular way to obtain goods and services. Grocery stores, take-out delivery, and retail distribution centers have flooded Central Arkansas. The region boasts several new and announced distribution centers as a result, including Lowe’s, Dollar General, and three from Amazon.
The Port of Little Rock, along the Arkansas River, is a major contributor to the regional economy, employing over 8,000 people. As a major generator of and destination for freight,
its influence, and the need for planning, is expected to increase as more developable sites are added when the FAA’s navigational VOR cone is moved.
Transit has served the core of Central Arkansas for decades and is now finding its footing in Conway. In recent years, it has transformed with new trends like ridesharing, advances in smartphone technology, vehicle upgrades, unwavering need for dedicated funding, and even a global pandemic. Nevertheless, transit remains a crucial service for regional mobility, particularly for residents that rely on transit as their primary transportation.
A regional transit plan could identify service needs, connections between local systems, and survey new technologies to implement a cohesive, effective, and efficient system. Crucially, a new plan could inform the funding discussion as it has been the biggest barrier to expanding service.
Technology is ever-changing. Will transportation projects look different in the future? Will new tools and techniques be available for quicker projects? How can technology make for safer streets and interactions between modes while improving mobility and preserving the environment? Metroplan must continue to identify and explore emerging trends that will impact Central Arkansas’s transportation future.
Metroplan and ARDOT are jointly sponsoring a regional Smart Streets Plan that will investigate ways to modernize our transportation system. A key consideration will be how to integrate new technology intended to enhance safety, reliability, and efficiency of our transportation network.
Chapter 4 of Transforming Mobility explains where our money comes from, what trends may impact our budget, how we identify and develop transportation projects, and how we track the performance of our infrastructure.
With these factors in mind, the chapter also contains a project list of planned investments that fit within the confines of our currently identified funding for the next 20 years.
The Financially Constrained Plan on page 56, Table 4.8, has been revised for the 2025-2028 TIP. MTP Amendment 1.
MPOs’ investments in planning are guided by the
As a result of § 11201; 23 U.S.C. 134 the Bipartisan Infrastructure Law (BIL), the Metropolitan Planning Program continues to guide MPOs’ investments through a cooperative continuous and comprehensive framework. Chapter 4 of Central Arkansas Transforming Mobility is the region’s mandated Long-Range Metropolitan Transportation Plan (MTP) to the year 2050.
Cooperative Continuous Comprehensive
This MTP launches the region’s policy implementation with specific projects, actions, and other recommendations. The Plan’s biggest priority is maintaining the current transportation system (also a listed priority of Metroplan Transportaion Partners ARDOT and Rock Region METRO). As financial needs far exceed projected revenues, the plan assigns 70% of Federal funding towards maintenance activities.
The plan favors mitigating roadway capacity needs by increasing investment in efficient multimodal options and rethinking land development practices.
The core policies described in Chapter 3 aim to meet future transportation demand with balance that includes an efficient freeway system, a strategic regional arterial network, a complete Regional Greenways system, expanded regional and local transit, and more walkable and bikeable communities, all maintained in a good state of repair.
An incremental approach over the plan’s horizon will include impactful standalone projects that are programed into Metroplan’s Transportation Improvement Program, a document that develops from infrastructure needs of our partners.
Vehicles, for personal use, freight, and transit, are the primary transportation mode in Central Arkansas. The MTP aims for freeways and a Regional Arterial Network that are in good
repair, safe, and efficient. Projects for roads are categorized as maintenance, operational improvements, widening, and new facilities.
Maintenance will take priority in project development to prevent premature infrastructure decline and aid financial constraint. Maintenance is classified as either “Routine,” “Major Rehabilitation and Repair,” or “Bridge Replacement.”
Routine tasks include maintaining joints, minor roadway repairs, traffic signal repair, lane striping, signs, and mowing, and will be short term in nature. Routine maintenance is covered under the agency’s general budget and often performed by staff.
Rehabilitation is a more substantial project often performed every 10-20 years. This may consist of replacing or overlaying pavement or a complete reconstruction where additional degrading has occurred. Updates to pedestrian or bicycle infrastructure may be included in rehabilitation projects. ARDOT Rehabilitation projects are performed consistent with the Transportation Asset Management Plan and are usually listed in the TIP. See 2022-TAMP (ardot.gov).
Bridges are rated as in good, fair, or poor condition based upon their substructure and decking, with the lowest ranking reflecting the bridge conditions. Bridges that are in poor condition or do not meet current standards require major rehabilitation or should be replaced. Bridges in fair condition will require extensive maintenance or replacement during the plan period. Recent analysis shows that 3% (or 7% of the deck area) of the region’s more than 1,350 bridges are rated in poor condition and 44% (or 53% of the deck area) is rated in fair condition (see Appendix 6).
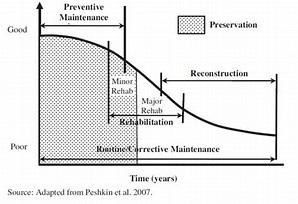
Operational improvements increase safety and efficiency on existing infrastructure. These improvements can be made to roadway corridors by adding turn lanes, improving signage, or with intelligent transportation systems that coordinate traffic lights or alert users to roadway conditions. In some cases, reallocating space with road diets may improve conditions for all users.
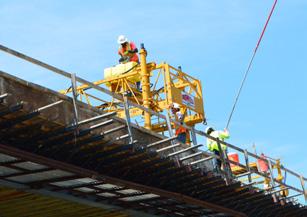
Rail grade separation projects minimize conflicts between railways and travelers by physically separating the crossing with an overpass or underpass. On key corridors, these separations minimize delays caused by passing trains and help reduce the potential for serious accidents with roadway users.
Intersections and interchanges can also be optimized to improve a corridor. Technology at traffic lights can sense when cars are queuing and change the light based on need. Emergency vehicles can also trigger sensors to traverse an intersection safely and quickly. Also, clear pavement markings and directional signage are low-tech fixes that enhance user awareness resulting in improved operations. Interchanges are similar and the addition of turn lanes, new ramps, or signal modifications can improve traffic operations.
Where additional travel lane capacity is needed, widening of freeways and arterials may be considered to address recurring congestion. Technology changes may also impact capacity needs in the long-term; therefore, widening projects are largely based on current needs. Widening projects are often conducted in association with major rehabilitation projects.
ARDOT has identified several widening projects as part of the Connecting Arkansas Program Phase II. This program is proposed to add travel lanes or address interchange congestion along several freeways and major arterials within Central Arkansas. These projects are shown in figure 4.2. with an estimated time for their completion.
New roads may relieve congestion on an existing facility, strengthen the road network or provide better connections between destinations. New facilities are constructed as partnering projects with substantial local contributions.
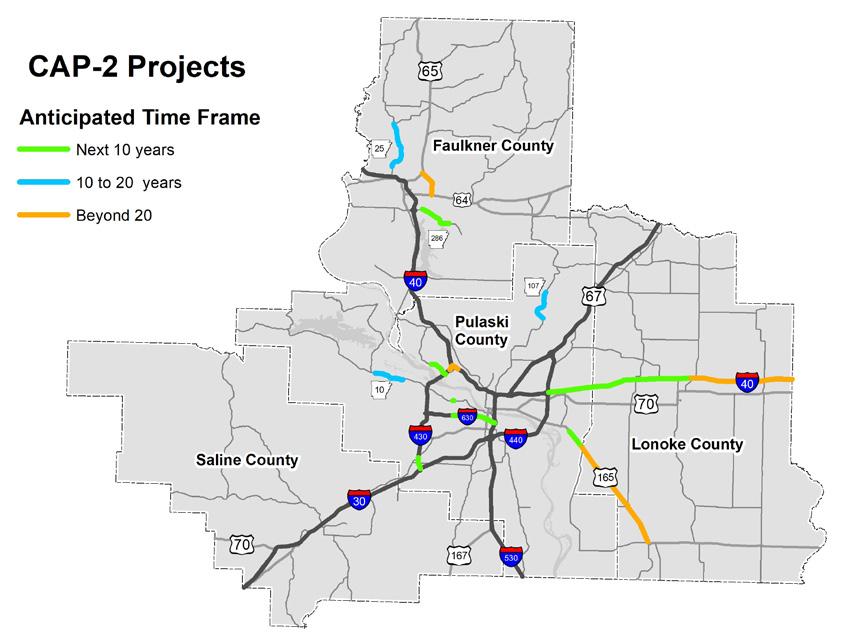
Source: ARDOT 2023
Transforming Mobility focuses on expanding Central Arkansas’ transportation options for all user types. In Chapters 2 and 3, the plan explains land development patterns and its influence on personal mobility. However, this is only half of the equation as infrastructure must be in place to accommodate active modes like pedestrians, bike riders, transit riders, and micromobility users.
Central Arkansas has gradually added miles of sidewalks, bike lanes, and multi-use trails to its transportation profile. These investments must continue as corridors are reconstructed and new roadways meet enhanced requirements.
Like many of the region’s city regulations, Metroplan prioritizes projects with multimodal accommodations with its funding, ensuring consistency between our partnerships. Investment in active transportation expands mobility to additional transportation modes, and is a cost effective way to accommodate travelers.
Metroplan’s Multimodal Infrastructure Guidelines (Appendix 3) recommends treatments to fit every corridor, including at intersections. The guidelines can help our cities invest in the best accommodations based on the environment they want to create for a given corridor. Beyond just arterial, collector, or local street classifications, the guidelines recognize that infrastructure looks different in a downtown area versus a neighborhood in the suburbs, regardless of similar street classification.
The guidelines can inform decisions for efficient investments by providing detailed specifications for everything from sidewalk width to bike lane location, and even curbside
management for delivery vehicles, scooters, and transit stops. Underbuilding or overbuilding for active modes can cost a city resources and goodwill from its public. Appropriately scaled projects fit the context of the environment and make better use of public funds.
The Transportation Alternatives Program is the primary federal fund source used to support local active transportation projects.
Metroplan adopted the Central Arkansas Regional Greenways Plan (Appendix 4) in May 2023 to guide a portion of its funding allocation to trail design and construction. A strategic target of $55 million over ten years will be spent on the system. The Arkansas River Trail and six planned corridors of largely off-road active transportation paths, supplemented by bike lanes on retrofitted streets, stretch over 222.3 miles across all four counties in the study area.
1. Central Beltway—Connects Downtown Little Rock to West Little Rock through the central city.
2. Northwest Corridor—Connects Little Rock, North Little Rock, Maumelle, Mayflower, and Conway.
3. Northeast Corridor—Connects Little Rock, North Little Rock, Sherwood, Jacksonville, Cabot, Austin, and Ward.
4. East Corridor—Connects North Little Rock to Lonoke.
5. Southeast Corridor—Connects Little Rock to Wrightsville.
6. Southwest Corridor—Connects Little Rock, Shannon Hills, Bryant, Benton, to Garland County.


SUFFICIENT INFRASTRUCTURE MUST BE IN PLACE TO SUPPORT AND PROMOTE ACTIVE TRANSPORTATION.
The Greenways Plan identifies the alignment, trail type, and amenities for each of these corridors. These alignments may be modified during the design process. To assist with implementation, each corridor is prioritized based on fiveto-seven-mile segments that are then grouped into three tiers. Scoring criteria highlight four categories: Destinations, Connectivity, Constructability and Maintenance, Trail Access. These criteria measure destination density, links between other trails and transit, how easy segments are to construct and maintain, population density around trails, and access for vulnerable populations.
Metroplan will use a combination of Carbon Reduction Program Funding (CRP) and Surface Transportation Block Grant (STBG) to fund the greenways. Off-system trails and local connections to the Regional Greenways will be funded primarily through the Transportation Alternatives Program (TAP) and in conjunction with street improvement projects where applicable.
With any new infrastructure, maintenance must be considered. Off-road facilities, such as sidewalks and local
trails, are the responsibility of the local agency. Similarly, onroad infrastructure will be planned into local budgets as part of roadway maintenance.
For the Regional Greenways, the local jurisdiction agrees to make the facility open and available for use by the general public, and to be maintained for the life of the project. TAP funds may be used to supplement maintenance activities on these projects.

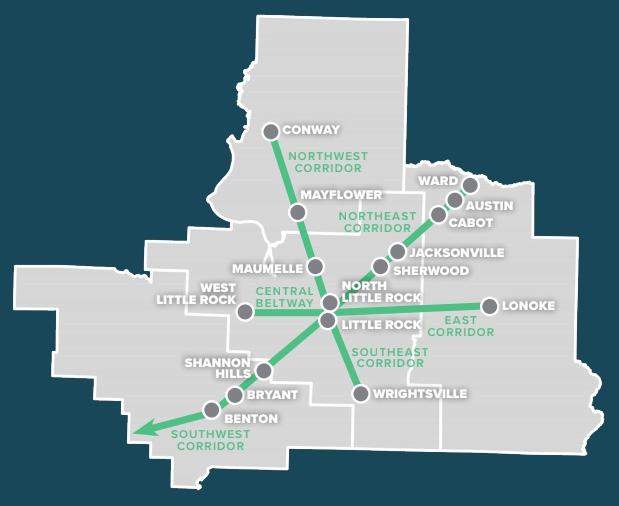
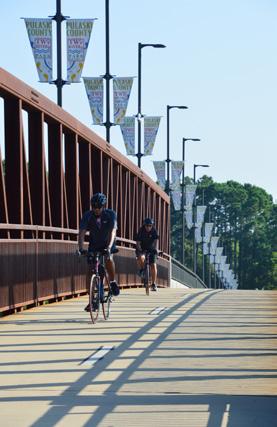
Central Arkansas is heavily car-dependent, with over 90 percent of commuters opting for personal vehicles and only around 0.3 percent utilizing public transit for their trip to work. However, more than 1.5 million rides are made with transit in Central Arkansas every year. Central Arkansas residents rely on transit every day to get to work, school, health care, and to a variety of daily needs. Investing in more public transit provides residents and visitors with greater access and choice of transportation, which connects people to homes, jobs, health care, education, and daily life activities. It also helps mitigate congestion and improve air quality.
Budgeting uncertainty makes long-range transit planning and service expansion difficult. Transit funding in Central Arkansas is accounted for in the MTP and the 4-year TIP to guide project development. The MTP highlights transit funding from Federal, State, and Metroplan funds but Rock Region METRO, the region’s primary transit provider, receives the largest share of its funding from the local jurisdictions where it operates. Little Rock, North Little Rock and Pulaski County supply funds through each jurisdiction’s annual operating budget. Federal funding is the second largest funding source for METRO, followed by direct funding, principally fare revenue, and roughly $610,000 annually from the State of Arkansas via the Public Transit Trust Fund. Rock Region’s total 2023 operating budget is $22.7 million. Local communities support transit through a funding contribution formula. Each jurisdiction must reauthorize this allocation in their budgets every year. The agency receives no dedicated tax funding, such as earmarked local sales tax revenue or property tax revenue.
As the designated recipient of federal public transit funds for the Little Rock Urbanized Area, METRO manages the bulk of transit financial transactions, revenues and expenditures in the CARTS region. The organization works with Metroplan to ensure its transit projects satisfy the total fiscal constraint for all projects in the MTP. Metroplan will continue to work with METRO, ARDOT, and local partners to coordinate transit project funding and reporting over the plan’s horizon.
Regional priorities for transit include:
• First: Maintaining the current system and optimizing services
• Second: Improving frequency, expanding service hours and other strategic expansion
• Third: Expanded service area for regional transit
METRO currently operates one streetcar line, 15 fixed routes, and five on-demand microtransit zones in Little Rock and North Little Rock, and one microtransit zone in Conway. The fixed routes traverse the Little Rock and North Little Rock neighborhoods closest to the downtown core and offer a predictable schedule using mainly arterial roads throughout the metro area. Most routes offer a four-block-or-less walk to a transit stop from areas served.
For riders who have disabilities that prevent them from using the fixed route service, METRO offers door-to-door paratransit service up to three-quarters of a mile from fixed route transit stops. In 2019, they introduced microtransit service. In Pulaski County, it has been deployed to provide public transit service in areas of low transit demand, freeing up 35-foot mass transit buses for areas of higher transit demand. This has initially created some cost savings to expand overall network service, but future demand may dictate its long-term success.
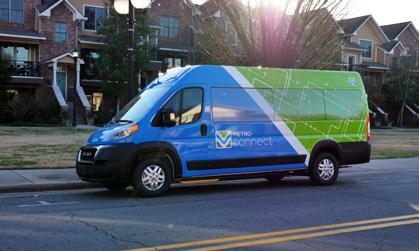
Regular maintenance and repair of vehicles, vehicle replacement and operation (drivers, fuel, etc.) must be accounted for.
A nationwide shortage of smaller public transit vehicles used for microtransit service has impacted METRO’s ability to meet demand for its microtransit service. Other factors, like a nationwide shortage of fixed route operators with commercial driver’s licenses, compounding amid the largest influx of federal funding for public transit in history through the Bipartisan Infrastructure Law, are causing U.S. public transit agencies to seek immediate solutions to this vehicle shortage as Americans return to work and post-pandemic economic activity moves forward.
Pursue dedicated funding with community support.
Dedicated long-term funding to accommodate annual inflation and broaden long-range planning efforts would allow METRO to provide longer service hours and better frequencies. This means that bus routes and microtransit zones could operate earlier in the day and later at night. However, service improvements require significantly more investment in labor, fuel and vehicles, as well as fixed expenses to support the overall operation, which necessitates new guaranteed, long-term financial investment. Securing funding is more possible with vocal, public support.
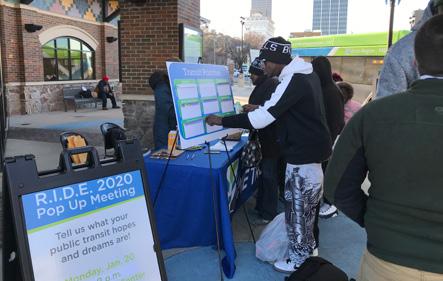
The ideal population density for high frequency transit service is around 10,000 people per square mile at a minimum. Population density in the areas currently served by METRO is 1,850 per square mile. Multi-family residential buildings at strategic locations around fixed routes and within microtranist zones can raise efficiency and improve sustainability of the system. Encouraging infill and denser land development in METRO’s core service areas would maximize the number of people benefitting from current transit service.
Transit-Oriented Development (TOD) could help increase ridership while providing increased access to jobs and housing. TODs are dense, walkable, mixed-use developments built close to, or as part of, transit hubs. This can increase access to and lower the burden of transportation and housing costs for residents and provide a sustainable user population for transit providers. Much of the responsibility for TOD lies with local jurisdictions, and their zoning codes, but public transportation can help guide design and foster partnerships.
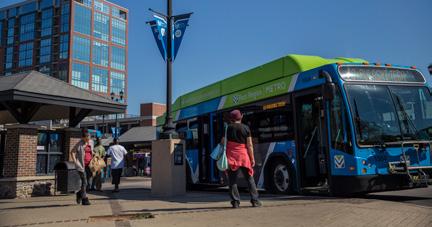
Investments in technology provide real time information to bus riders and schedule adjustments. Advanced systems can coordinate traffic signals with arriving buses to improve efficiency and route reliability.
Transit operations in Central Arkansas have managed to outperform despite budget constraints, even during the COVID-19 pandemic. Leadership will continue to make the decisions necessary to remain consistent within their existing service. However, expanding service will require additional resources that are not currently part of the Fiscally Constrained Plan.
Private partnerships and funds could be pursued to subsidize service. Major employment centers generate demand and benefit greatly from access to transit. Interested businesses need transit past their current hours of operation, such as hospitals, retailers, or restaurants. Cities, businesses, large clusters of employment, economic developers, and transit providers could enter into a partnership for feasibility studies to determine if there is potential to alter service to meet this demand.
Although private partnerships have long been desired, ultimately the ability of private companies to spend large amounts of capital on transit is limited. Communities must determine how to dedicate new funding so that transit can increase its frequency and operational hours. These improvements can enhance the system’s reliability and raise the confidence of potential riders, ensuring a more relevant, reliable, and appealing transportation system.
The MTP must consider available revenue expected over the course of its horizon. Federal regulations require that projects listed in the plan to be matched with existing revenue sources or those forecast. This means the plan is constrained by already defined fiscal resources. Projects that fall outside this fiscal constraint will need a new revenue source, or an increase of existing sources, to be completed during this planning window (illustrative projects).
Transportation funding for projects in the Central Arkansas Regional Transportation Study (CARTS) are a mix of federal, state, and local sources. Estimates in the MTP are based on federal fund marks provided by the Arkansas Department of Transportation, local infrastructure budgets, and local transit
(Base Year)
funds. Fundmarks represent the average amount of funds the region is expected to receive, with individual amounts varying from year to year.
Most Federal funds are collected through fuel taxes and transfers from the general fund. United States Department of Transportation Formula Programs are distributed to state. States, working with MPOs in urban areas, determine projects to fund. These funding categories are listed below.
Central Arkansas, being part Transportation Management Area (Population over 200K), receives a direct allocation of federal funds. Metroplan directly distributes this funding to Member jurisdictions.
4.2.
Surface Transportation Block Grant (STBG)*
Transportation Alternatives (TAP) $1.5
Carbon Reduction Program (CRP)
$1.9
funding for preservation and improvement on the surface transportation system.
bikes and non-motorized transportation facilities.
for reducing highway carbon emissions.
*Metroplan has targeted $55 million in STBG and CRP funds towards implementation of the Regional Greenways Network.
Federal transit funds are distributed to areas based upon their population. Rock Region METRO is the recipient of funds for Little Rock/North Little Rock urbanized area. The City of Conway is the recipient for the Conway Urbanized area, but contracts with Rock Region METRO to provide transit service in this area.
Table 4.3. FTA Formula Funds
State and local funding also rely on fuel taxes but pull from additional taxes and fees collected by individual jurisdictions. Additionally, the State’s Act 101 made a ½ cent sales tax permanent to fund transportation improvements, which raises significant funds for state and local jurisdictions. State generated funding, including ACT 101, are distributed 70% (State), 15% (County), and 15% (City).
These funds are used as a required match to access federal funds and also to perform general maintenance on our infrastructure.
Table 4.4. State Funding
Amendment 101/Connecting Arkansas Program
extension of state sales tax for transportation
Table 4.7. Flexible Grants
RAISE Grant
(Discretionary) Project with a significant local or regional impact INFRA
Safe Streets and Roads for All
Connecting Communities
Bridge Investment Program
PROTECT
SMART
(Discretionary)
(Discretionary)
(Discretionary)
(Discretionary)
(Discretionary)
(Discretionary)
Charging, EV, and Fueling Variable (Discretionary)
Bus and Bus Facilities Grant Variable (Discretionary)
Low and No Emission Bus Grants
(Discretionary)
Multimodal freight and highway projects
Support local initiative to prevent transportation-related deaths and serious injury on roads and streets
Funding for mitigating impacts of transportation facilities by improving community connectivity
Improve bridge condition, safety, efficiency, and reliability
Planning, resilience improvements, community resilience and evacuation routes
Grants that advance smart city or community technologies
Deploy electric vehicle (EV) charging and hydrogen/ propane/natural gas fueling infrastructure
Capital projects to replace, rehabilitate and purchase buses, vans, and related equipment and to construct bus related facilities
Capital projects to replace, rehabilitate and purchase buses, vans, and related equipment and to construct bus related facilities with emission benefits
Figure 4.4. Federal Highway Administration Formula Funds
Central Arkansas Fundmarks (Annual Estimate)
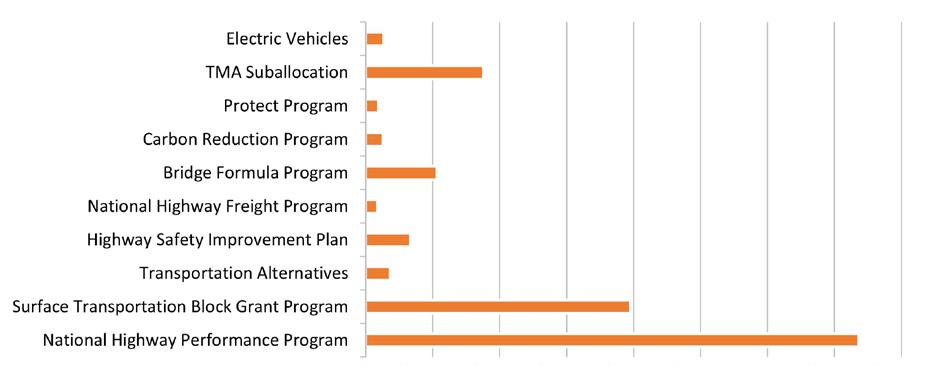
Figure 4.5. Federal Transit Administration Formula Funds
Central Arkansas Fundmarks (Annual Estimate)
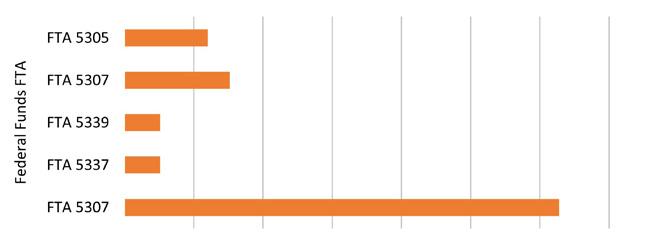
Fuel efficiency standards:
Corporate Average Fuel Economy (CAFÉ) standards govern fuel efficiency of all vehicles sold in the United States. In 2022, an industry-wide fleet average of approximately 49 mpg was adopted for passenger cars and light trucks for model year 2026, a 36% fuel-efficiency increase over year 2023*. While this is beneficial for energy conservation and the environment, it presents challenges for transportation revenue. Fuel taxes are collected on a per-gallon basis. Increased fuel efficiency means fewer gallons consumed, and therefore less revenue.
*https://www.nhtsa.gov/laws-regulations/corporate-average-fueleconomy#:~:text=The%20final%20rule%20establishes%20standards,annually%20 for%20model%20year%202026.
The Bipartisan Infrastructure Law (BIL) alleviated federal transportation spending concerns for several years to come.
Despite the BIL, revenue will not keep pace with the growing list of needed and desired investments as transportation costs rise. The plan must be judicious in choosing projects that best meet our diverse needs while maintaining the current system.
A 2% annual growth in revenue is assumed for federal funding sources, state fuel taxes, adn alocal turnback from fuel taxes. All other revenue sources use a 2.5% annual growth
Electric vehicles are jolting into popularity. Manufacturers are ramping up production and customers are lining up for the promise of cleaner, more economical personal vehicles. Recent legislation has incentivized charging infrastructure investments across our freeway system. EV sales, including hybrids, accounted for 15% of sales in quarter 2 of 2023 according to the US Energy Information Administration.
Policy, however, has been playing catch up with EVs’ rising star. Given the reliance on fuel tax to fund transportation infrastructure, a rise in EV use will undoubtedly create funding shortfalls. Without new policy it may be hard to predict revenue trends in the future. New policies supporting and investing in an electrified mass transit fleet can help deliver the environmental benefits of EVs while accounting for revenue impacts.
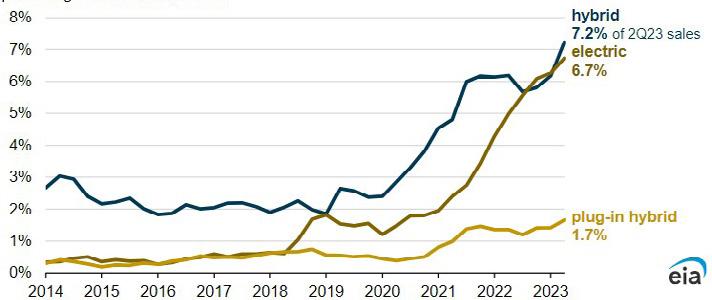
US Energy Information Administration https://www.eia.gov/todayinenergy/detail.php?id=60321
The prioritization strategy endorsed by Metroplan is a relatively simple one: (1) cover our existing obligations, (2) maintain what we have already built, (3) optimize our existing networks through stategic investments and system efficiency projects, and (4) identify new revenue sources for major new projects. The following sections describe this strategy in more detail. Individual projects are listed in Table 4-a and shown in Figure 4-b.
Projects in the MTP are selected as follows.
A number of project commitments were generated prior to the development of the MTP. These are projects that are already “in the pipeline” and should be followed through to completion. They are included in the financially constrained long-range transportation plan. These include:
• The 2023–2026 Transportation Improvement Program (TIP): Projects identified in the 2023-2026 TIP are considered part of this first priority.

• Connecting Arkansas Program (CAP) Projects—Phase II: The CAP program identifies specific projects for the CARTS area to be funded with anticipated revenues generated by the state-wide half-cent sales tax.
• Regional Greenways Projects—The Metroplan Board has targeted $55 Million for the implementation of the Regional Greenways plan.
The CAP program is a half-cent statewide sales tax for highway transportation projects. Set to expire in 2022, it was renewed as a permanent tax by voters in 2020 and took effect in June 2023. This pot of funding is not a direct allocation to Metroplan. However, it can be utilized on highway projects in the MTP in coordination with state plans.
Central Arkansas has a significant amount of transportation infrastructure that must be maintained to be kept in good, working order. This includes routine maintenance and major rehabilitation needs of our interstates, arterials, and collectors, plus maintaining existing transit service. This category also applies to projects that have been identified for safety improvements.
Given the significant gap that exists between maintenance needs and available revenue, new project commitments should focus on projects that optimize the existing transportation network and critical network projects. Critical projects that are a priority of the Metroplan Board are included in the first 10 years of the constrained project list. Additional projects may also be selected during the TIP development process using the non-project specific funding line of the MTP.
After funding the first three categories, there is limited existing funding is available for major Central Arkansas widening and new projects. These costly extensive projects will focus on partnering projects and new revenue sources.

Project costs are required to match revenue projections for the year that they are expected to start. For financial constraint, the plan must consider inflation by the year of expenditure. A 3% annual inflation rate is assumed for construction projects to the year 2050.
Hard to predict factors such as international disruptions, supply chain issues, or global pandemic may increase construction costs further. Although these do not affect projected revenue, they have a chilling effect on purchasing power. These trends will be assessed periodically throughout the plan horizon to adjust project starts as needed.
Metroplan maintains a list of projects that will be pursued during the plan’s horizon, in this case, through year 2050. The list is fiscally constrained. This means that the total estimated expenditures on these projects do not exceed the expected revenues to the year 2050. Illustrative projects are projects above the current estimated revenues and would require new or increased funding.
The first four years of projects are included in the Transportation Improvement Program (TIP) 2023 through
2026 window. These projects have already been identified as receiving funding and have been given a let year. Beyond 2026, projects and their cost estimates are included, but funds have not yet been allocated and the projects are not given a let year. During the TIP and STIP development period these projects will be considered for inclusion in future TIPs. The list also includes variable funding categories for maintenance of the transportation system and other projects that will be considered as part of TIP development. See Table 4.8.
Year of Expenditure
2023
2025
2025
2026
2027
2023 Improvements
2026
2023 Improvements
Widening (PE) $0.500 2023
Widening (PE) $0.500 2025
2023 Descretionary
Improvements
2026
2027
2028
2026
2023
2023
Improvements
and Appr
Improvements
Improvements
Improvements
Widening
Widening
Widening
and Appr
2026
2023
2025
2026
2023
2025
2025
2025
2027
2026
2025
2026
Widening $3.900 2027
and Appr $1.600 2026
and Appr $0.600 2026
Improvements $4.200 2023
Development $0.500 2025
Preservation $4.500 2023-2026
Preservation $8.300 2023-2026
Preservation $16.200 2023-2026
Preservation $4.800 2023-2026
Preservation $11.500 2025-2028
Preservation $26.800 2023-2026
Preservation $5.100 2023-2026
Preservation $0.400 2023-2026
Preservation $3.400 2025-2028
Preservation $6.400 2025-2028
Preservation $1.200 2023-2026
Preservation $2.000 2023-2026
Preservation $0.400 2023-2026
Preservation $1.100 2023-2026
Project Cost Millions
Preservation $1.100 2023-2026
Preservation $1.200 2023-2026
Preservation $2.900 2023-2026
Preservation $1.500 2023-2026
Preservation $3.500 2023-2026
Preservation $5.600 2023-2026
Preservation $1.100 2025-2028
Preservation $1.700 2023-2026
Preservation $0.900 2023-2026
Preservation $1.500 2023-2026
Preservation $1.000 2025-2028
Preservation $1.300 2023-2026
Preservation $2.600 2023-2026
Preservation $1.700 2025-2028
Preservation $3.200 2023-2026
Preservation $1.300 2023-2026
Preservation $0.500 2023-2026
Preservation $1.200 2025-2028
Preservation $1.900 2025-2028
Preservation $3.300 2025-2028
Preservation $1.400 2025-2028
Preservation $5.300 2025-2028
Preservation $3.000 2025-2028
Preservation $4.600 2025-2028
Preservation $0.600 2023-2026
Preservation $4.000 2025-2028
Preservation $0.900 2023-2026
Preservation $1.000 2023-2026
Preservation $1.600 2023-2026
Preservation $1.100 2023-2026
Preservation $1.100 2025-2028
Preservation $3.600 2023-2026
Preservation $6.400 2025-2028
Preservation $4.800 2023-2026
Preservation $4.800 2023-2026
Construction $24.648 2023 $24.648
Planning $2.500 2023 $2.500
Planning $0.875 2023 $0.875
Streets $31.250 2025 $31.250
Widening $75.000 2028
Widening $7.000 2029-2030
Widening $75.000 2029-2030
Widening $30.000 2029-2030
Improvements $40.000 2029-2030
Improvements $5.000 2029-2030
Improvements $20.000 2029-2030
2029-2030
2029-2030
2031-2040
2031-2040
2031-2040
Year of Expenditure
Year of Expenditure
2029-2030
2029-2030
2031-2040
2029-2030
2029-2030
2029-2030
2029-2030
2029-2030
2031-2040
2031-2040
2031-2040
2027-2030
2029-2030
2031-2040
2029-2030
2029-2030
2029-2030
2029-2030
2029-2030
2029-2030
2029-2030
2029-2030
2029-2030
$12.960 2029-2030
2031-2040
2041-2050
2029-2030
2031-2040
2041-2050 $201.996
Unallocated, or non-project specific, group category is intended to represent general maintenance of the transportation system. This is also intended to represent all regional statewide generic group projects, including but not limited; IRP Debt Service; Various Project Development Activities; Various Roadway System Preservation Projects; Various Preservation Projects; Rehabilitation and Replacement Projects; Various Safety Improvement Projects; Various Signal and Intersection Improvement Projects; Various Transportation Alternative Program Projects; and other Programs, Services and Activities. These project will be selected during the TIP development process. - Federal Funds Only
Unallocated, or non-project specific, group category is intended to represent general maintenance of the transportation system. This is also intended to represent all regional and statewide generic group projects, including but not limited; IRP Debt Service; Various Project Development Activities; Various Roadway System Preservation Projects; Various Bridge Preservation Projects; Rehabilitation and Replacement Projects; Various Safety Improvement Projects; Various Signal and Intersection Improvement Projects; Various Transportation Alternative Program Projects; and other Programs, Services and Activities. These project will be selected during the TIP development process. - Federal Funds Only
Construction
2031-2040
2031-2040
2029-2030
2029-2030
2029-2030
2029-2030
2029-2030
2031-2040
2029-2030
Bridge $62.000 2027
Improvements $72.000 2027
Widening $0.500 2025
2025
2027
2028
Preservation $11.200 2025-2028
Preservation $3.600 2025-2028
Preservation $7.600 2025-2028
Preservation $18.000 2025-2028
Preservation $4.200 2025-2028
Preservation $1.700 2025-2028
Preservation $2.300 2025-2028
Preservation $2.800 2025-2028
Preservation $9.200 2025-2028
Preservation $2.000 2025-2028
Preservation $1.800 2025-2028
Preservation $4.500 2025-2028
Preservation $2.300 2025-2028
Preservation $9.500 2025-2028
Preservation $3.200 2025-2028
Preservation $1.200 2025-2028
Preservation $2.500 2025-2028
Improvements
Improvements
$52.500 2025
$17.000 2027
Bridge $5.500 2028
Preservation $11.200 2025-2028
to represent all regional and Preservation Projects; Various Bridge Improvement Projects; Various Transportation Federal Funds Only
Year of Expenditure
$2.300
$9.500
$3.200
$1.200
$2.500
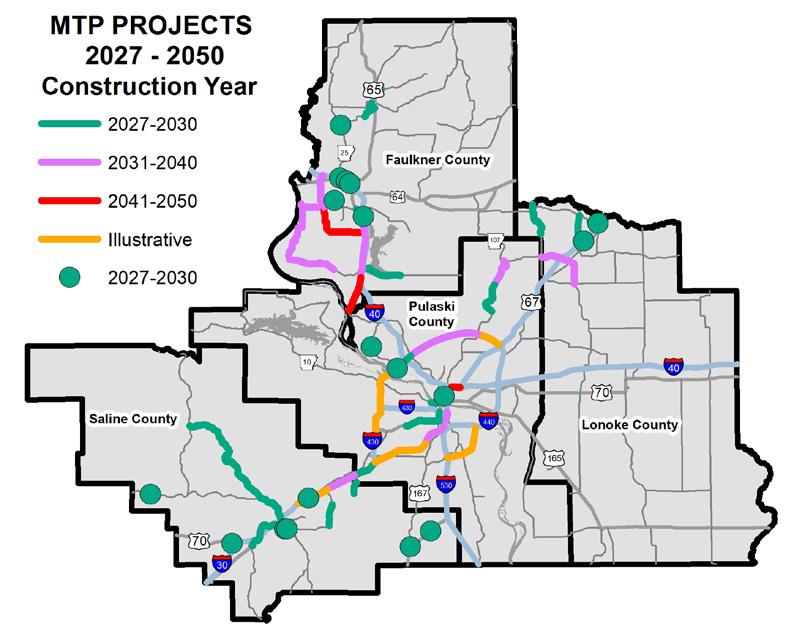
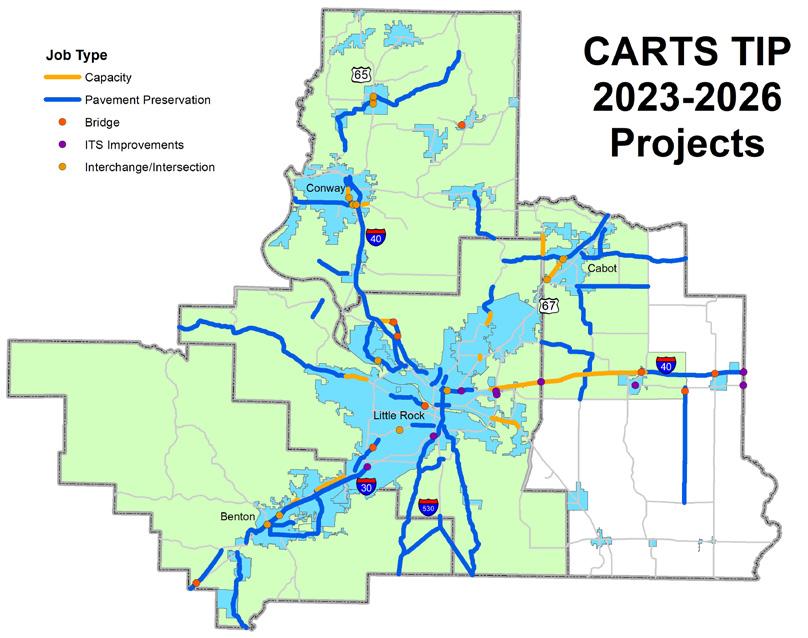
Since 2012, Federal Law requires states and MPOs to maintain performance-based decision making for their transportation plans, specifically for Federal-Aid Highway Program funded projects. Metroplan’s full report on performance measures can be found in Appendix A. The BIL continues this tradition.
The law establishes seven goal areas:
1. Safety
2. Infrastructure Condition
3. Congestion Reduction
4. System Reliability
5. Freight Movement and Economic Vitality
6. Environmental Sustainability
7. Reduced Project Delivery Delays
Performance measures must include data for pavement condition on the Interstate System and National Highway System (NHS), bridge condition, the number and rate of fatalities and serious injuries on all public roads, traffic congestion, and freight movement on the Interstate System. Data are collected and reported as an accumulative target over a period of 4 years.
Currently, Metroplan opts to support targets set by ARDOT but could create specific targets for Central Arkansas in the future. In addition, Metroplan supports Rock Region METRO’s Transit Asset Management Plan (TAM) and its associated performance measures. Table 4.9 displays baseline data for the performance areas within the CARTS region.
Table 4.9. Metroplan adopted performance targets from the State and Rock Region METRO
Transportation is what drives Central Arkansas. Metroplan’s Regional Goals and Core Policies will be at the forefront of transportation and land use decisions. The way forward is reinvesting in our current system and increasing multimodal opportunities as we maintain and improve our corridors. Metroplan will continue to engage with local jurisdictions to consider land development practices that foster more mobility and accessibility for all users. Continued regional coordination of these efforts will ensure consistency in decision-making and ensure a bright future. And we must not forget our commitment to improving the lives of our citizens by creating better places.
Central Arkansas is transforming mobility.
1. 3-P Public Participation Plan
2. Metroplan Unified Development Code 3. Metroplan Multimodal Infrastructure Guidelines
4. Regional Greenways Plan 5. Public Engagement Report
Safety Action Plan 7. Links to Partner Plans
Performance Measures Documentation
Public Participation Plan
https://metroplan.org/wp-content/uploads/2021/01/CARTS_PPP-2019.pdf
https://metroplan.org/wp-content/uploads/2022/10/UDO-ModelCodes-online.pdf
CARTS Multimodal Infrastructure Guidelines
https://metroplan.org/wp-content/uploads/2021/10/CARTS-Multimodal-Design-Guidelines.pdf
https://www.centralarkgreenways.com/online.pdf


https://metroplan.org/wp-content/uploads/2023/12/TransformingMobilityPublic_Engagement-Report.pdf
https://metroplan.org/wp-content/uploads/2024/05/MetroplanSafetyActionPlan.pdf
The following is a list of links to our partners’ planning documents that influenced Central Arkansas Transforming Mobility. The links are active as of December 2023.
1. Arkansas Strategic Highway Safety Plan (ARDOT, 2022) https://www.ardot.gov/wp-content/uploads/VRU_SHSP_AppendedFINAL.pdf
2. Arkansas State Freight Plan (ARDOT, 2017) www.ardot.gov/wp-content/uploads/2020/10/ArkStateFreightPlan_ExecSum-with-state-map.pdf
3. Arkansas Electric Vehicle Infrastructure Deployment Plan (ARDOT, 2022) www.ardot.gov/wp-content/uploads/ARDOT_EVID_NEVI_PLAN_2023.pdf
4. R.I.D.E. 2020 (Rock Region METRO, 2020) www.rrmetro.org/ride2020/
5. We Move Arkansas Transportation 2040 (ARDOT, 2017) www.wemovearkansas.com/
6. Arkansas Bicycle and pedestrian Transportation Plan (ARDOT, 2017) www.ardot.gov/wp-content/uploads/2020/10/Arkansas-Bike-Ped-Plan-FINAL-03312017.pdf
7. Full Steam Ahead (ARDOT, 2023) www.ardot.gov/wp-content/uploads/Strategic-Plan-Full-STEAM-Ahead.pdf
The documents contain the methodology used by ARDOT to set the Performance Measure Targets. The PM1 document applies to Safety Performance Measures while the PM2 and PM3 documents contain the measures associated with Infrastructure and Reliability. The Metroplan Board chose to support the targets set by ARDOT as part of the Federal reguirement.