• Housing Construction Responds to Interest Rate Trends
• The Demographics of Infill
• Mapping Infill Development
• Demographic Outlook 2024
• Statistical Supplement
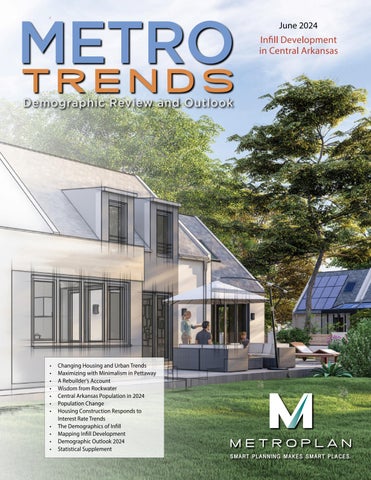
Changing Housing and Urban Trends
During the twentieth century it seemed like cities would keep spreading outward exponentially, but trends began shifting during the 1990s and early 2000s, when a few older inner-city neighborhoods began revitalizing.
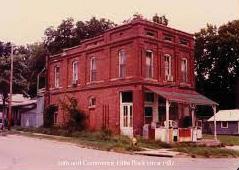
Central Arkansas first saw this trend with the emergence of the River Market District in the 1990s, a public-private partnership which turned a warehouse district into a revitalized New Urbanist neighborhood, rich in quality restaurants, high-end condos and apartments, and even new office space. Across the river the Argenta district in downtown North Little Rock began reviving. Two private redevelopments began; Rockwater Village along the Arkansas River Trail in North Little Rock, and Hendrix Village in Conway. Redevelopment is catching on.
neighborhoods like the Heights and Hillcrest in Little Rock. Such situations represent reinvestment in older neighborhoods, but do not amount to full-scale redevelopment.
A more complete definition of “infill” involves rehabilitating homes that were previously uninhabitable or vacant, or building new housing on vacant lots.
The trend of urban infill has begun to spread and can be verified by census data and property values. Not all older neighborhoods have revitalized, but the potential is there.
It is difficult to give an exact definition for “infill.” In some cases, it has just been a matter of buyers tearing down older, smaller homes and replacing them with bigger new ones in established
The trend will continue, in no small part because the underlying demographics have changed. Americans are older than they were in the 1990s, for example: Central Arkansas median age has increased from 32.2 in 1990 to 37.9 in 2020. Households are smaller, and fewer of them contain children under 18. As they age, people often want neighborhoods that are walkable and rich in amenities like restaurants and shops.
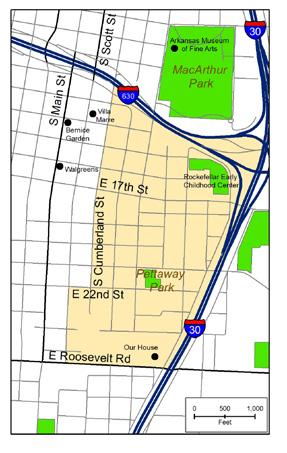
This issue of Metrotrends Demographic Review and Outlook will focus on infill development in Central Arkansas. It will put a particular emphasis on the Pettaway neighborhood in Little Rock, which has emerged with careful nurture and community-building work by the Downtown Little Rock Community Development Corporation (DLRCDC). In a time of rising housing costs, Pettaway offers an innovative model for building affordable housing in an older neighborhood, and doing it through old-fashioned entrepreneurship.
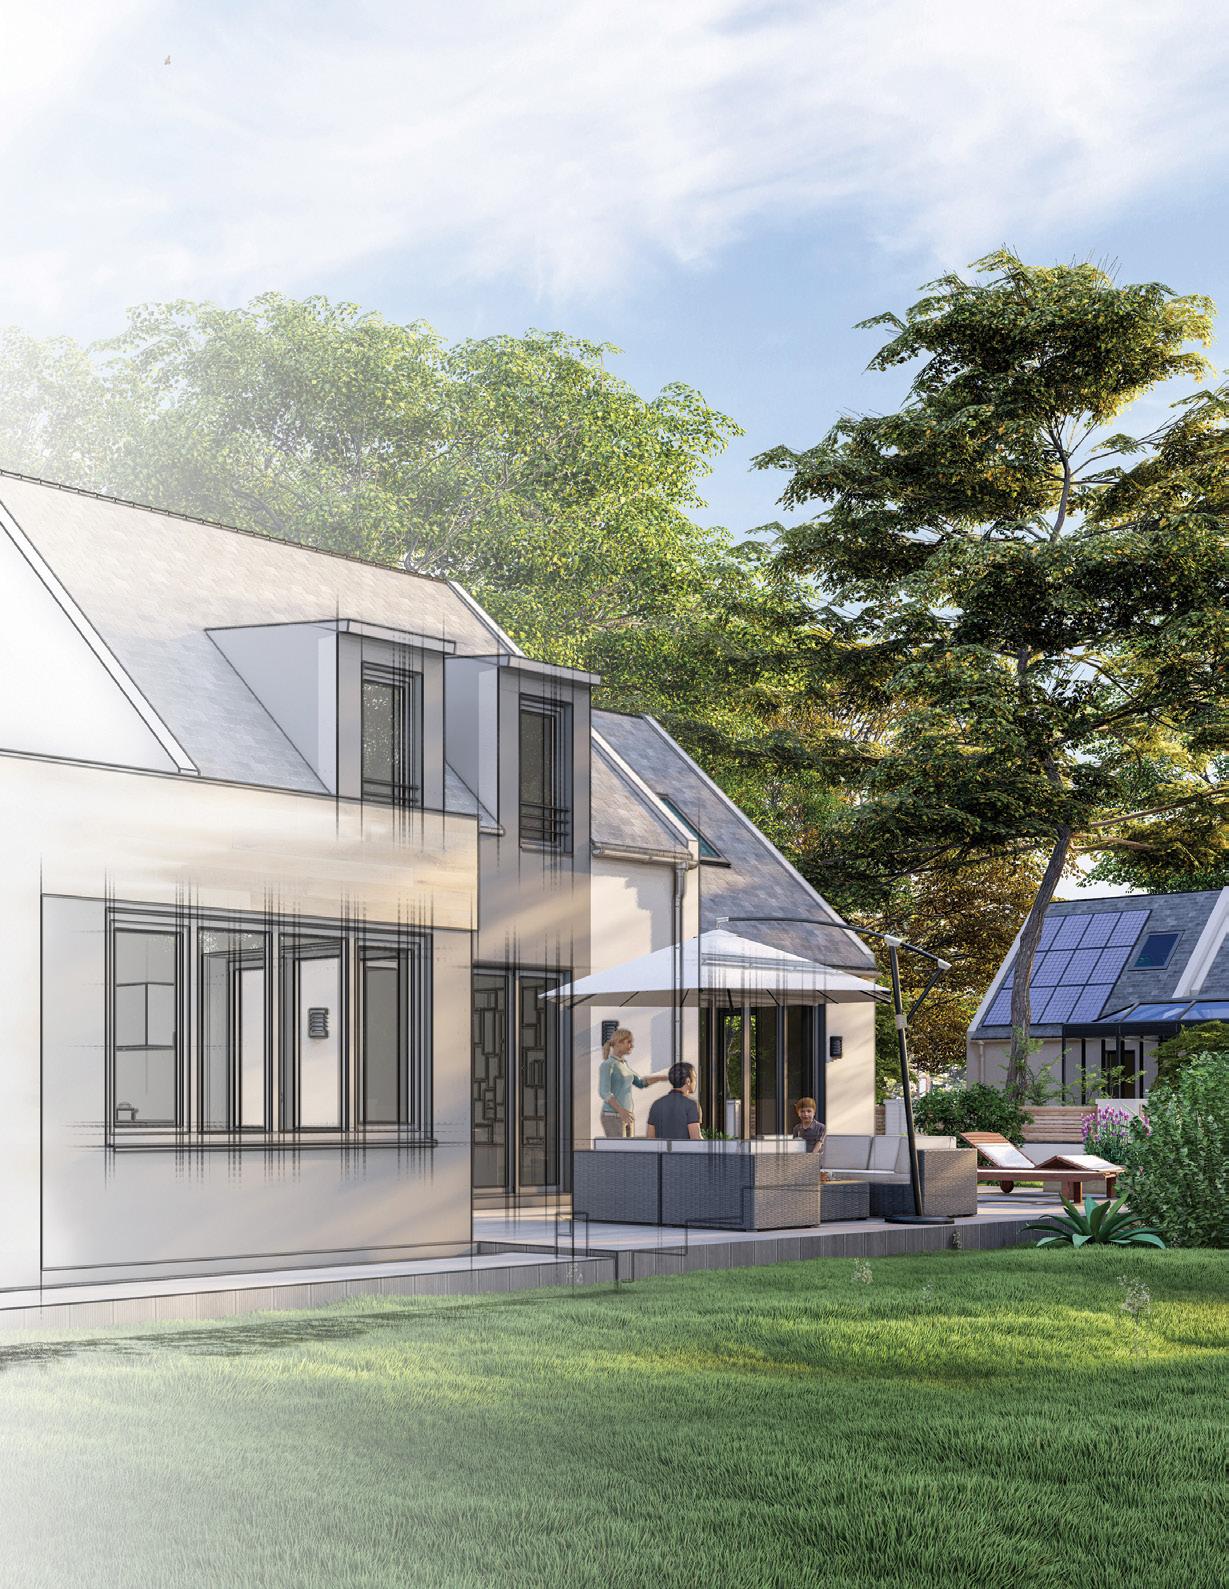
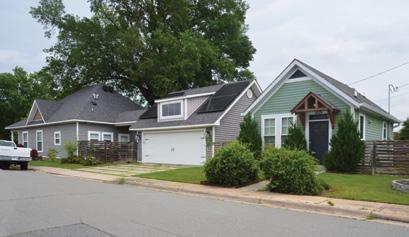
Little Rock’s Pettaway Neighborhood
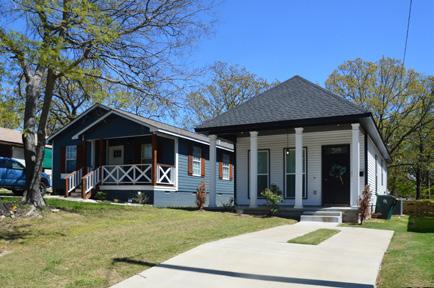
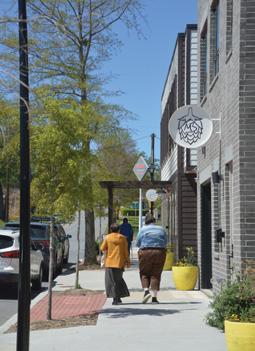
Accessory dwelling units (ADUs), like the green structure on the right, are small homes that open up a neighborhood for nontraditional households, including elders and young adults.
Maximizing with Minimalism in Pettaway
If you have seen Little Rock’s Pettaway neighborhood recently, you know it is revitalizing. When one of its most active developers is Mike Orndorff, you know why. His approach is practical, results-oriented, lean, and energetic. He is a self-proclaimed minimalist, and an advocate of energy efficiency. He started developing property in 2014 and, ten years later has built about 78 structures in the Pettaway area, most of them housing units.
He tells us he got his inspiration from two places: Adairville
help with affordability two ways: a buyer can pay some of the mortgage expense by renting the other unit out, while it adds an additional unit to the regional renting market.
While retail business remains shaky on a national scale, Mike is bullish about his stores and shops. The retail units in Pettaway Square (and those planned for future development) are typically about 600 square feet, designed to be ready for move-in with taxes already paid and foot traffic virtually guaranteed. The units
Mike Orndorff and his family. Photo courtesy of Mike Orndorff..
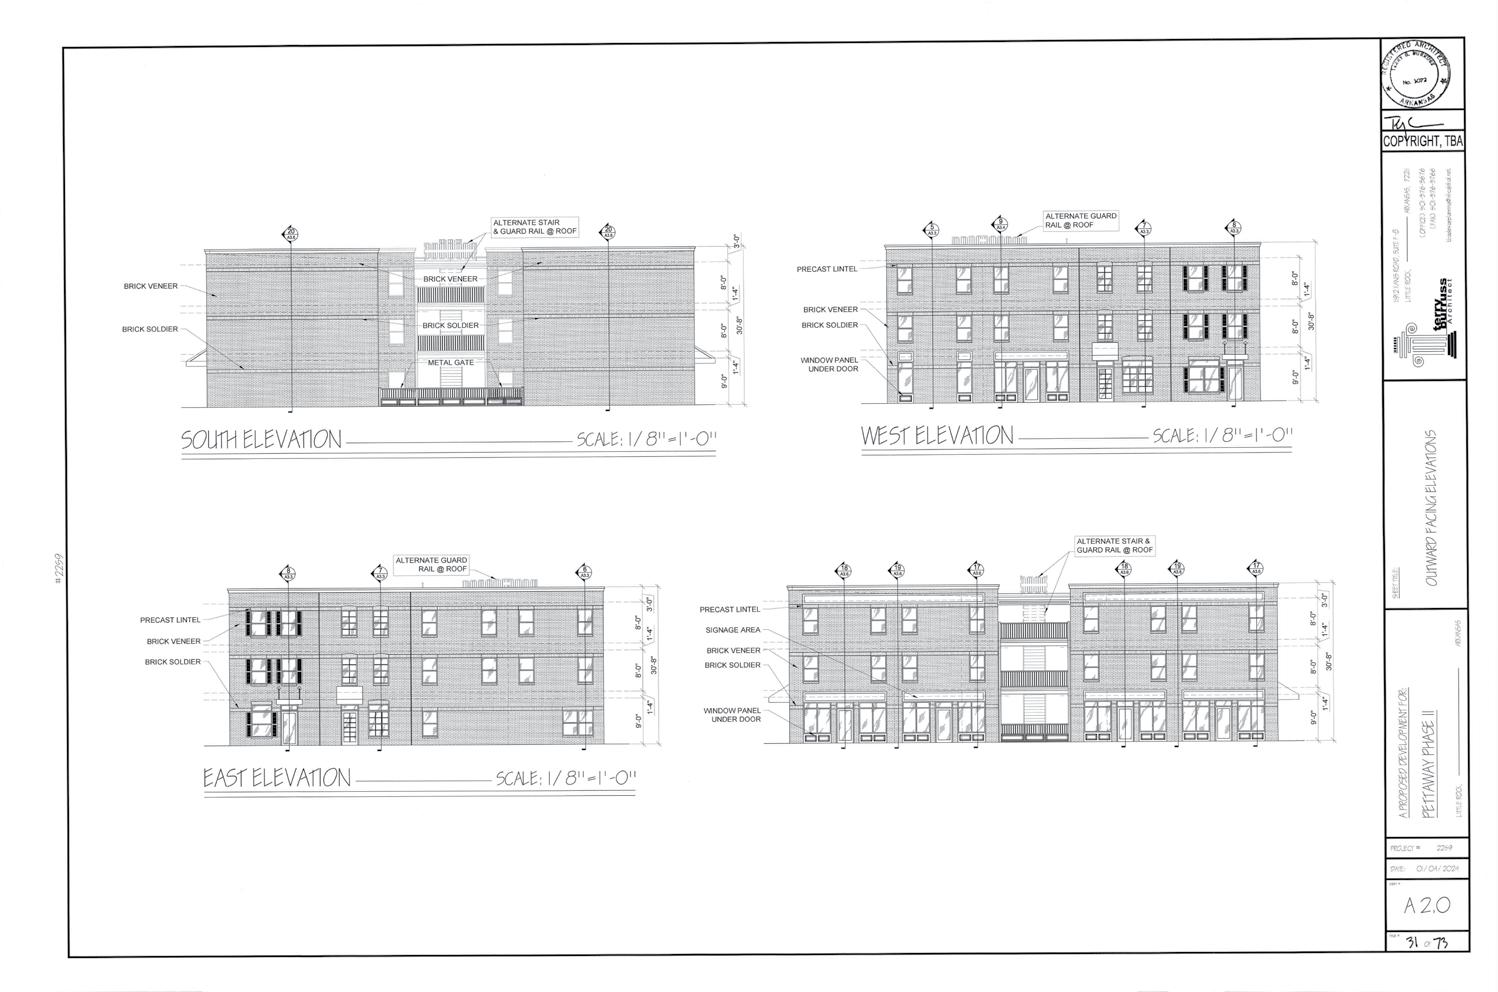
development, the proposed Rock|21 project brings the principles of Lean Urbanism to the intersection of Rock and 21st Street.
The leasable spaces are sized to keep to tenant costs attainable for small and new local businesses, while still unlocking the multiplier effect of density.
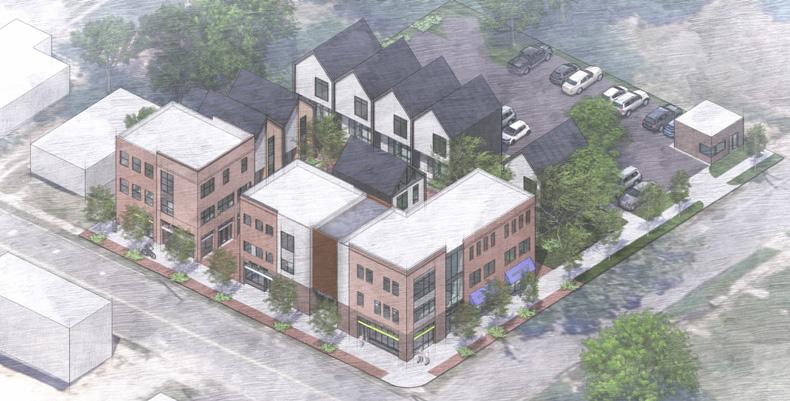
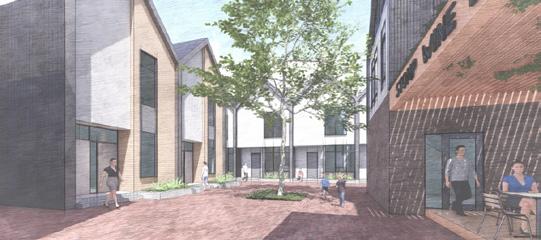
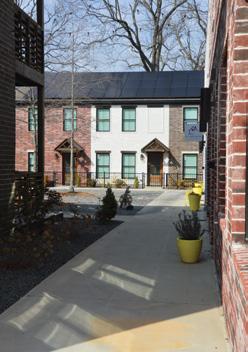
Rock and 21st Street are front by three story mixed-use buildings populated by locals restaurants, retail, and commercial office space. Residential townhouses wrap around the commercial buildings creating a pair of pedestrian courtyards. Floating in the center of the courtyard is a mixed use building that incorporates a first floor covered patio with outdoor seating, and a community event space above.
Parking for the development is nestled behind the townhouses and screened from Rock Street by landscaping and a micro commercial building facing the street.
Projects like Pettaway Square and Rock|21 are critical for urban neighborhoods like Pettaway to anchor themselves and provide all the basic services and amenities required for modern lifestyles in an affordable way and accessible way.
ROCK|21
Scale Urban Infill in the Pettaway Neighborhood
off the success of the neighboring Pettaway Square development, the proposed Rock|21 project brings the principles Urbanism to the intersection of Rock and 21st Street. leasable spaces are sized to keep to tenant costs attainable and new local businesses, while still unlocking the multiplier effect of density.
and 21st Street are front by three story mixed-use buildings populated by locals restaurants, retail, and commercial office
Residential townhouses wrap around the commercial creating a pair of pedestrian courtyards. Floating in the the courtyard is a mixed use building that incorporates floor covered patio with outdoor seating, and a community space above.
for the development is nestled behind the townhouses screened from Rock Street by landscaping and a micro commercial building facing the street.
like Pettaway Square and Rock|21 are critical for urban neighborhoods like Pettaway to anchor themselves and provide basic services and amenities required for modern lifestyles affordable way and accessible way.
The Pettaway neighborhood provides a wide variety of housing types and price points: modest single-family homes, duplexes, quadplexes, shotgun houses and apartments. Residents enjoy the neighborhood feel and convenience to the SoMA area of downtown Little Rock.
The images here depict the Rock 21 project, a mixed-use development soon to be under construction in Pettaway. It will contain modestly sized leasable spaces for small and startup businesses. Residential townhomes will wrap around two pedestrian courtyards, close to restaurants, retail, and office space. Parking is nestled behind the townhomes and screened by landscaping and structure. Mike Orndorff intends to keep costs affordable, while still unlocking the multiplier effect of density.
The Community Development Corporation’s Role
The Downtown Little Rock Community Development Corporation (DLRCDC) laid the groundwork for all the new growth in Pettaway. The DLRCDC grew out of an active Pettaway Neighborhood Association (before the neighborhood claimed that name). The DLRCDC was founded in 1993, and by 1996 it was operating 45 units of affordable housing from 6 completely rehabbed historic buildings along South Main and Scott Streets. Following the devastating tornado in 1999, the DLRCDC started building affordable and market rate housing in Pettaway. The DLRCDC partnered with the City of Little Rock, enlisting the University of Arkansas Community Design Center to develop a community revitalization plan (https://tinyurl.com/2b6yf437).
Daily life in Pettaway Square.
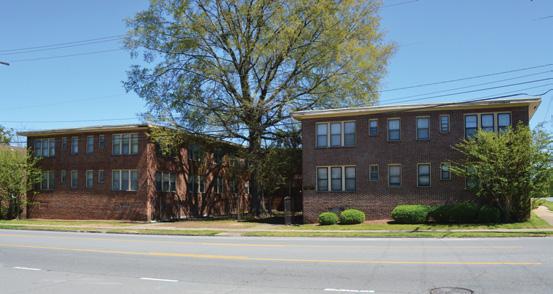
The Downtown Little Rock CDC transformed the Martin Mahlon Apartments from a condemned slum to quality affordable housing.
A Rebuilder’s Account
Guest writer: Adam Fogleman
While we didn’t know it when we found Pettaway, the process that the community has followed is a case study in community revitalization and “gentlefication.” At every step, it has been a “community first” approach. In the late 1980s and early 1990s, the community began to organize to improve quality of life, promote the community interest, deter criminal activity and abate neighborhood deterioration. The “community first” approach began with a neighbor-led nonprofit stabilizing the nuisance large apartment buildings and returning them to service as affordable housing.
A tornado struck in 1999 and left devastation in its wake. The response was swift—more affordable housing was built. This time they were single family homes designed to encourage community interaction: lots of front porches engaging the sidewalks and very few garages facing the streets. Affordable housing paved the way for market-rate housing. This took shape as a mix of historic rehabs and modern infill following the original development pattern with many narrow and small lots.
A neighborhood revitalization plan kept the area true to the original form. Development breeds development, and innovation attracts innovators. The new development in Pettaway attracted new families. Some of those new families began developing where we live and as we grow our families. Continued residential development and an active neighborhood association have led to tent fairs and pop-up movie nights
featuring food trucks on vacant lots. Lucky for us the land was still zoned commercial and the land use plan accommodated the return of mixed use. The revitalization plan guided building types to avoid car-first development in favor of people-scaled, community-engaging development.
The work is far from finished in Pettaway, but the process that has transformed this neighborhood could be put into practice in any city or small town. I’m convinced that the Pettaway model is the recipe for successful community development.
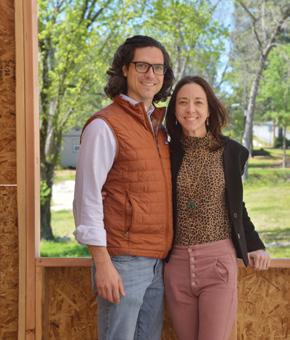
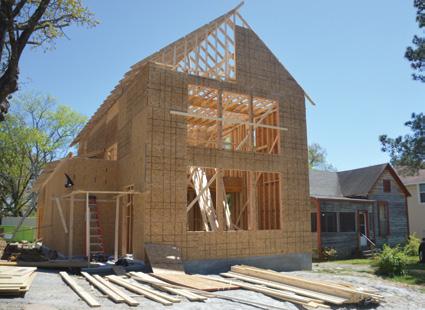
A single-family home under construction by Common Ground Development Co. in the Pettaway neighborhood.
Adam Fogleman and his wife Jill are coowners of Common Ground Properties and Common Ground Development Co. Adam is the current principal officer of the DLRCDC.
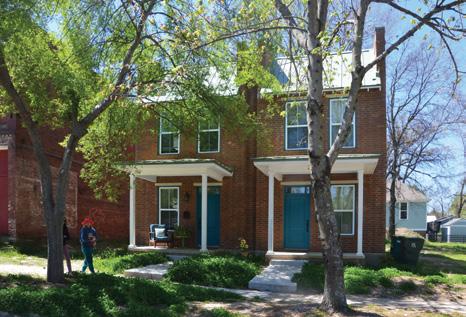
This townhouse-style duplex on Commerce Street, built by Common Ground Development Co., is a winner of the Richard Butler Award of Merit for Infill Development from the Quapaw Quarter Association.
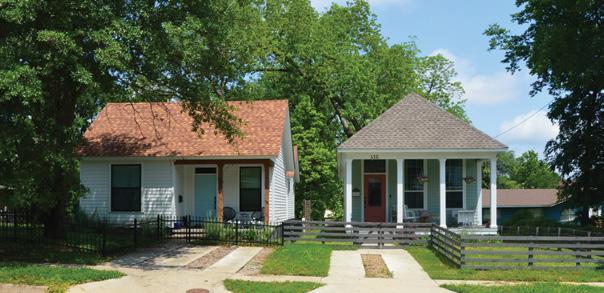
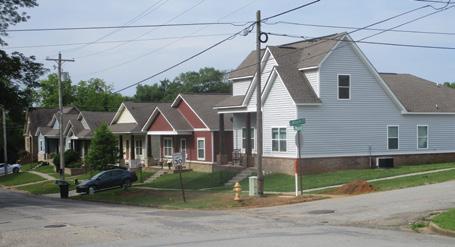
These new single-family houses on East Charles Bussey are examples of a side courtyard style (left) and shotgun style (right).
Other Contributors to Pettaway Neighborhood Redevelopment
• Stacy Williams was Chair of the DLRCDC for 15 years.
• Scott Grummer was the previous executive director of the DLRCDC and was instrumental in bringing the UofA Architecture School to Pettaway to construct three design-builds, opening the door to more modern designs. He remains active on the DLRCDC Board.
• Paige Wilson, Paul Paige Dwellings led the charge of modern/market-rate development in the area when only the CDC was actively working the neighborhood. He was active in the area from ~2005–2020.
• Mike Orndorff has built more homes in the neighborhood than any other builder. He’s now the leading developer of the Pettaway Commercial District.
• Rachel and Jeremiah Cotner are rehabiltating long-vacant homes as rental properties.
• Gwen and AJ Gilbert are currently in pre-development to transition the former Red Carpet Inn/Job Corps building on Vance Street into elder housing. The DLRCDC has signed on as a project supporter/sponsor.
Some Background on Pettaway
In the early 2000s the neighborhood association decided to call the area “Pettaway,” recalling The Reverend Caleb Pettaway (1886-1968) a local African American leader from days past. The neighborhood had been built out in the late 1800s and early 1900s prior to World War II, with a small portion added after the war. With a mixed BlackWhite population, Pettaway was “redlined” during the twentieth century, which caused severe disinvestment.
The tornado of January, 1999 destroyed many homes and other structures but, ironically, became a catalyst for change. When rebuilding began, some of the area remained zoned commercial, and surrounding areas were zoned for gentle density, providing the option for twofamily development. This conferred greater flexibility on redevelopers to build mixed use structures and design a neighborhood that connects with street life and pedestrians.
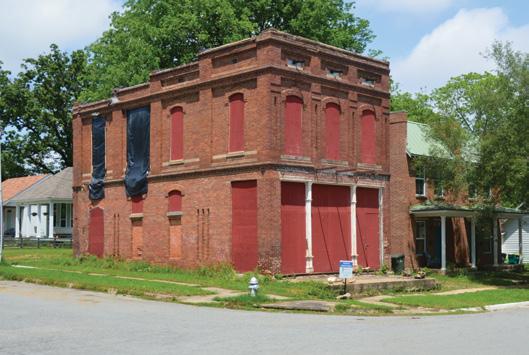
This structure at 1924 Commerce Street in the Pettaway neighborhood was built by a formerly enslaved person, William LaPorte. Born in 1828 at Arkansas Post, Mr. LaPorte escaped slavery in 1840, and found work as a steamboat steward on the Mississippi River. He used his earnings to free his mother and sister. During the Civil War, LaPorte served in the 54th Massachusetts Infantry. He came to Little Rock penniless in 1870, working as a plasterer and bricklayer. By 1889 he had $20,000 in savings ($585,000 in 2021 dollars) and owned nine houses. Mr. LaPorte was also named in 1877 to the Board of Trustees for a new school that became Little Rock’s Philander Smith College.
The William LaPorte Building has served roles as grocery store, restaurant, boarding house and appliance repair shop. The structure is being rebuilt today by Common Ground Properties with two residential units on the top floor, and retail and office space on the ground floor. It is on the National Register of Historic Places.
https://www.facebook.com/1924Commerce/
New life is coming to this historic structure.
Still Standing—Black Excellence in Reconstruction
Wisdom from Rockwater Village
Around 2007, Lisa Ferrell and Jim Jackson launched a plan to build a Traditional Neighborhood Development (TND) along the banks of the Arkansas River in North Little Rock. They worked with the local community, soliticing input from multiple community members and leaders. At first, they were amateurs in the land development business and—as with most successful infill projects—their dreams were described as “crazy” at times.
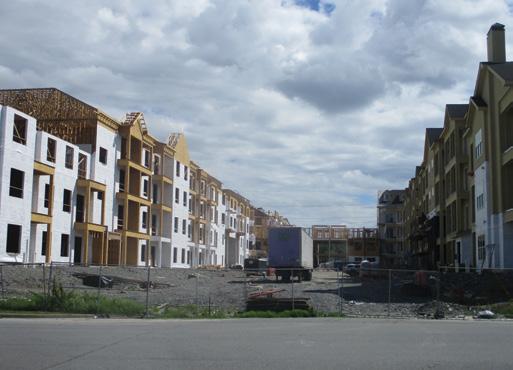
Today, Rockwater Village hosts over 300 housing units and, when an under-construction apartment complex is complete, the tally will be over 700. Varying from rental units to middlerange homes and quadplexes all the way to high-end singlefamily homes, Rockwater Village is here to stay and still has room to grow. At present quadplexes are being built, offering a mix of affordable options for owners and renters.
Talking with Lisa Ferrell, we gained several insights. First, while infill development has infrastructure costs, it can avoid some of the high up-front costs that come with greenfield development out on the rural fringe. Rockwater required a new sewer line, for example, but the distance to tie onto the city’s existing pipes was shorter than a typical suburban developer would face. Higher density and smaller infrastructure needs have helped keep housing units more affordable.
Retail and office space have remained challenges for Rockwater. With Downtown Argenta close by residents can
shop and dine plausibly well, but there is an opportunity for an entrepreneur willing to put up a coffee shop or wine bar.
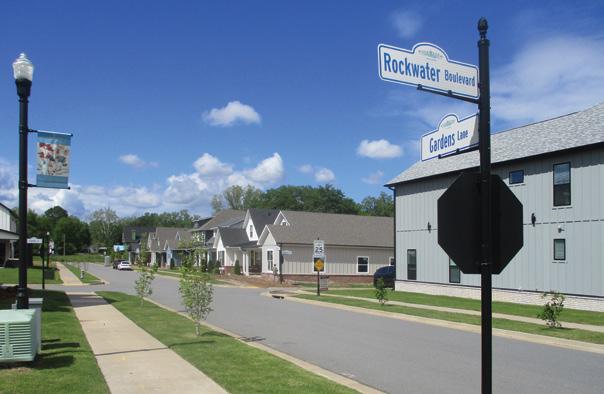
Rockwater offers a wide range of housing types, all in close proximity. This means people of different age and income ranges can afford to live there. And it is building with the long-term future in mind, modeled on successful TND projects elsewhere across the USA. “We offer ‘phase of life’ housing at Rockwater,” Lisa contends, “and this is what makes the highestvalue neighborhoods, the ones everybody likes the most. It’s how Hillcrest was built, how the Heights was built.”
Since 2010 over $300,000,000 has been invested in the Rockwater neighborhood and adjacent areas, including:
• Private construction of Class A multi-family projects (180 Million private investment)
• 124 new single-family residences, ranging from $120,000 to $2.2 million, $55 million private investment
• Rockwater Boulevard, sewer, drainage, lighting, landscaping—$1.2 million public investment
• New Craftsman-style housing in adjacent neighborhood—$8.2 million public investment (NSP)
• Additional neighborhood investors—$40 million private investment
• Commercial redevelopment—$2.2 million (including the Works at Rockwater - home to 6 businesses)
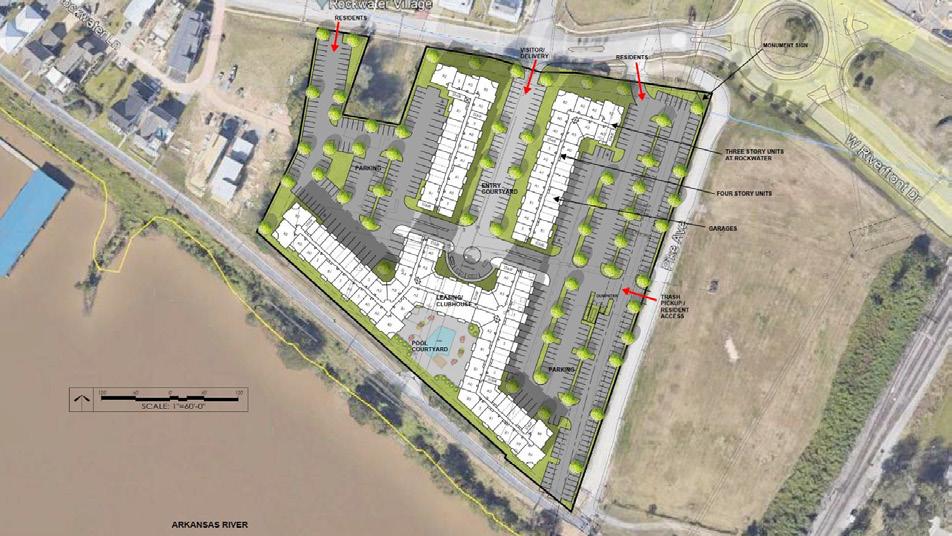
The Resort at Rockwater, at left, will add 360 units along the Arkansas River; at right, sidewalks and front porches help build neighborhood connections.
• City infrastructure, sidewalks, drainage—$1 million public investment
• $300 million private investment and $14 million public investment and over 500 jobs
• Since 2014 property tax revenue has increased from $64,500 to close to $1 million
7
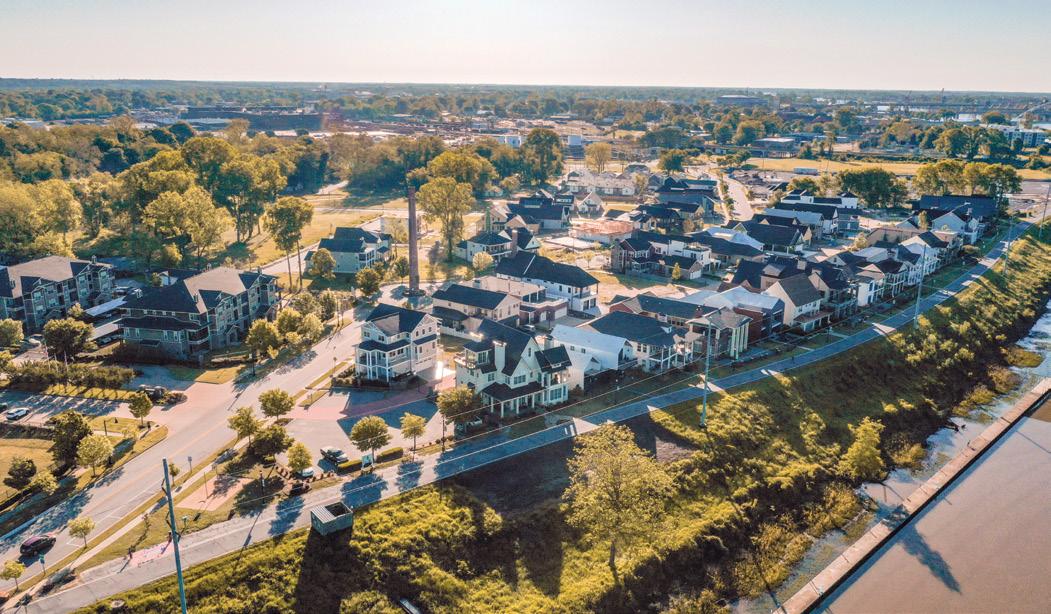
The layout below depicts the Resort at Rockwater apartments, with development opportunities close by. The aerial image above depicts Rockwater as it looks today, human-scaled and walkable along the Arkansas River Trail and near the core of a metro area with over 770,000 people.
SITE PLAN
Central Arkansas Population in 2024
Regional population continues growing slowly. Total population for the six-county Little Rock MSA was about 771,000 in early 2024, 3 percent higher than in 2020. Faulkner County was the fastest-growing in the region, growing 5.1 percent since 2020 to a total just shy of 130,000. Saline County grew almost as quickly, 3.9 percent to about 128,000. Lonoke County grew about 3.7 percent to about 77,000 population, and Pulaski County gained 2.1 percent to a population of about 407,000.
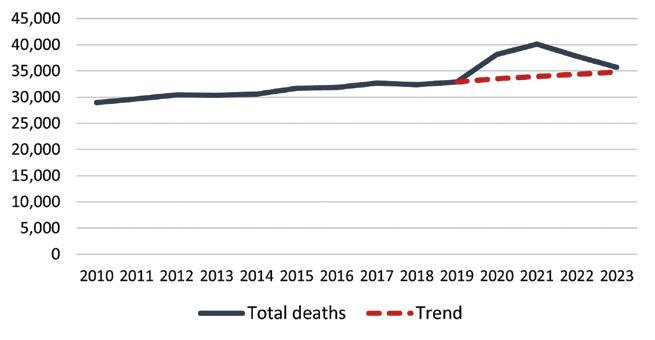
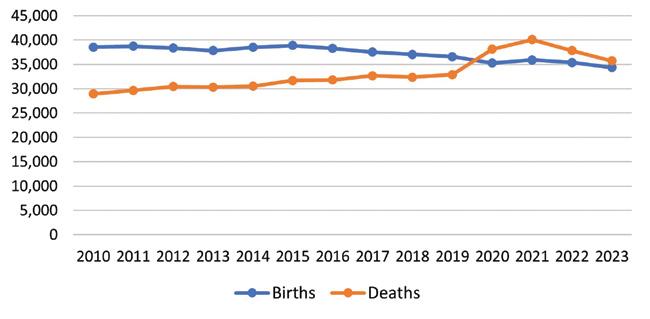
The “components of change” table below depicts population change by its demographic elements: births, deaths and migration. As you can see, migration accounted for a gain of about 20,000 people, the bulk of population growth. Natural increase, or the surplus of births over deaths, was about 2,300. As the chart shows, births remained higher than deaths although the margin was close in 2021. Total deaths in 2023 were down 11.2 percent from 2021, the year when deaths spiked the most due to Covid-19.
Little Rock MSA Births and Deaths 2010-2023
Sources: U.S. Centers for Disease Control and Arkansas department of Health. Figures post-2016 are provisional.
Sources: U.S. Centers for Disease Control and Arkansas department of Health. Figures post-2016 are provisional.
Components of Population Change 2020–2024
Little Rock Conway North Little Rock Benton
Sherwood
Five Largest Central Arkansas Cities by Population Size 2024
Five Largest Central Arkansas Cities by Population Size 2024
Population Change
Little Rock-North Little Rock-Conway MSA Population Change 2020–2023
*Small community populations are generally under 1,000 ** Represents portion of Alexander by county ***Official MSA since May 2003
Housing Construction Responds to Interest Rate Trends
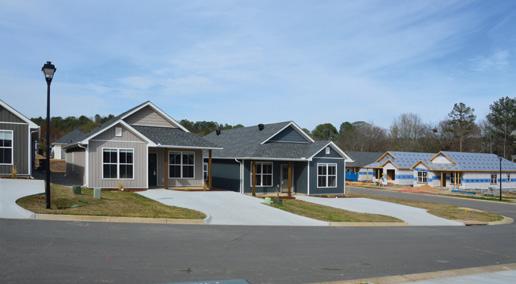
Interest rates were still rising at the beginning of 2023. The official “Federal Funds Effective Rate” peaked at 5.33 in August of 2023, and has remained level since then. It is not surprising that single-family housing construction in the Little Rock MSA was down a bit in 2023 compared with 2022, but housing construction only dipped about 16 percent in the region’s nine largest cities. At the same time, multi-family housing construction rose by about 27 percent. Thus, despite the challenge posed by higher rates for both single-family and multi-family markets, overall housing construction grew 2.5 percent.
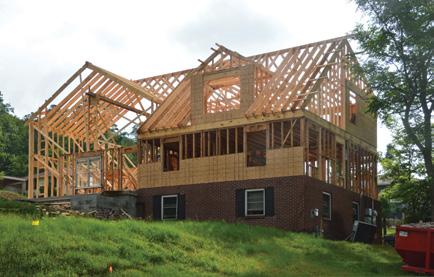
Some of the new housing replaces units destroyed in the March 31, 2023 tornado, which hit neighborhoods in Little Rock, North Little Rock, Sherwood and Jacksonville. This is reflected in both single-family and multi-family markets. In Little Rock the Napa Valley Apartments is rebuilding 144 units damaged or destroyed in the storm.
Looking more closely at single-family construction, most cities in the region saw fewer new units in 2023, but Sherwood and Jacksonville defied this trend, and Bryant and Little Rock also saw a marginal increase. Benton, North Little Rock, Hot Springs Village and Conway all saw a drop off in housing construction. In all cases, construction is likely to snap back upward when rates begin declining, possibly by late summer or early fall 2024.
Multi-family construction increased in 2023, with a total of 1,444 units started. As usual the bulk of new construction was in Little Rock, Conway and North Little Rock, the region’s three largest cities. Some new construction occurred in smaller communities. Cabot started two new complexes and Benton added 180 new units to the existing Longhills complex. Multi-family construction permits in Bryant, Jacksonville and Maumelle refer to duplex units.
* Totals exclude Hot Springs Village, which is in Garland County outside Metroplan’s planning jurisdiction.
NOTE: This housing permit data set records only cover the ten largest cities in Central Arkansas.
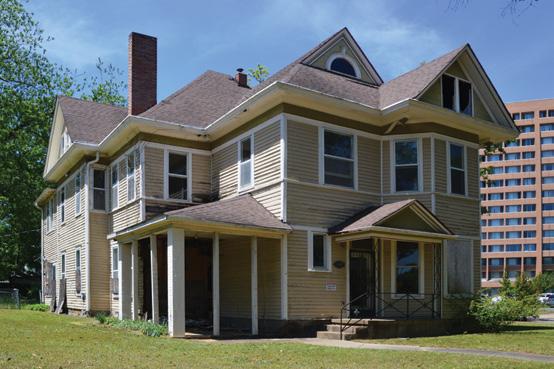
Some of today’s construction activity, like the house shown above, replaces homes destroyed by the tornado of March 31, 2023.
Rock
Federal Funds
1/1/2021 0.09
2/1/2021 0.08
3/1/2021 0.07 4/1/2021 0.07 5/1/2021 0.06
6/1/2021 0.08
7/1/2021 0.1
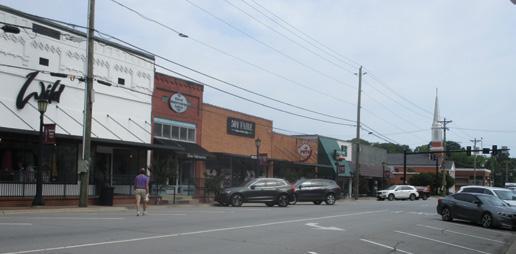
Revitalizing Downtown Benton
Like many older urban districts, downtown Benton is a place where housing units, offices, stores and restaurants are in close proximity of one another. Working with Metroplan, the City of Benton has modernized its zoning to encourage mixed uses and more flexible housing options. In the years 2017–2018 a local contractor redeveloped a city block just south of downtown, putting single-family homes and a handful of small accessory “granny flat” homes in walking distance of downtown. The city’s downtown
district also has a walkable mix of shops and restaurants, including a redevelopment of the former city hall that includes two restaurants, the Baja Grill and The Revival, as well as several upstairs housing units. Located centrally within a growing county approaching 130,000 population, with a zoning code that gives developers room to be creative, downtown Benton is primed for future infill.
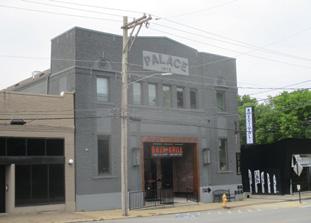
The Palace was an old theater, then Benton City Hall. Today it has been repurposed for two downtown restaurants, with Airbnb apartments upstairs.
Downtown Benton demonstrates how a legacy small-town downtown can serve as a pleasant and utilitarian activity center, with stores, restaurants and offices within walkable proximity.
The Demographics of Infill
Metroplan has examined several redeveloping areas across the Central Arkansas region. To examine infill, one must look up-close at census tracts, or even census block groups (BGs) for signals in the data over time. The table at right gives a sketchy, imperfect overview of areas known to be redeveloping in the region.
As you can see, most of these areas saw net population growth from 2010 to 2020. Pettaway did not, but there is no denying the growth trend. And since 2020, at least 49 new housing units have been built in Pettaway. By 2030 the trend will probably turn strongly positive; it simply takes time for an older inner-city area to reverse population decline.1 This is partly because household size with infill development is typically lower than household size was in earlier decades. For example, the charts below show that Argenta (tract 25) had an average of 2.44 persons per household in 1990. This declined steadily to 1.59 by 2020, even as population grew overall.
Argenta Persons / Household
The demographics of infill are thus a bit different from overall regional averages. While infill areas are somewhat diverse ethnically, they tend to contain a higher-than-average share of singles and relatively few households with children.
There are other areas around the region showing signs of redevelopment, not depicted in the table. These include several nodes in midtown and south-central Little Rock, downtown Benton, and downtown Lonoke. There is also a wide range of areas with older housing stock that have low
occupancy rates, and comparatively low property values that are ripe for redevelopment. As we have demonstrated from successful redevelopments around Central Arkansas, redevelopers are often dubbed “crazy” at first. Yet recent history has already shown that redevelopers who set a consistent goal of community-based redevelopment, who are willing to put in time and energy to build a product with lasting value, have usually met with success.
Wolfsbridge Loop - a new subdivision off of Brookside Road and Rodney Parham Road.
Mapping Infill Development
Infill is easy to discuss, but hard to define because it can take many forms. In some cases new homes get built in older areas to replace units destroyed by weather or fire. In others, a large new apartment complex will pop up on undeveloped but strategically located land inside built-up parts of a city.1 In other cases, like Pettaway, enterprising developers will rehabilitate existing structures, or build new ones on vacant lots, within older urban districts.
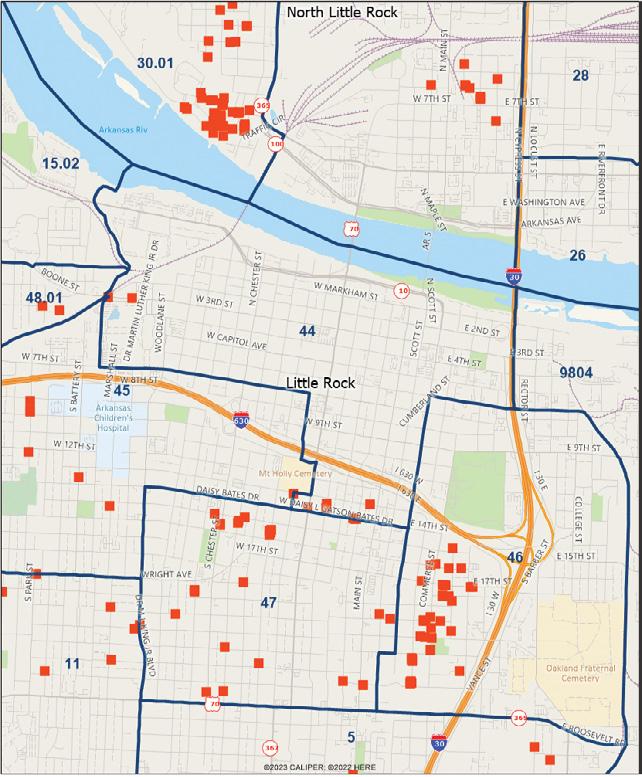
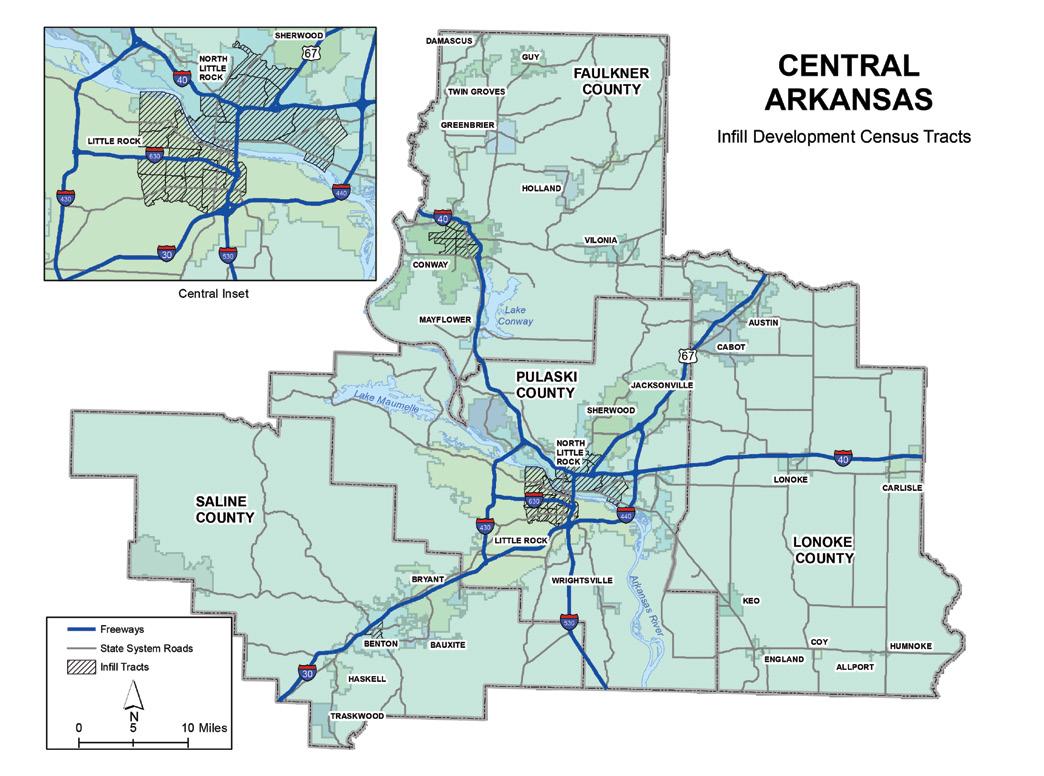
It appears that about 19 percent of new singlefamily units authorized in Central Arkansas during the period 2020–2023 can be classified as “infill.” An older analysis of the 2010–2017 period showed about 16 percent infill. The map on page 17 shows the census tracts selected as areas of infill development. Thus it appears that so-called “greenfield” projects still account for about 80 percent of new single-family housing construction, but the trend toward infill has grown.
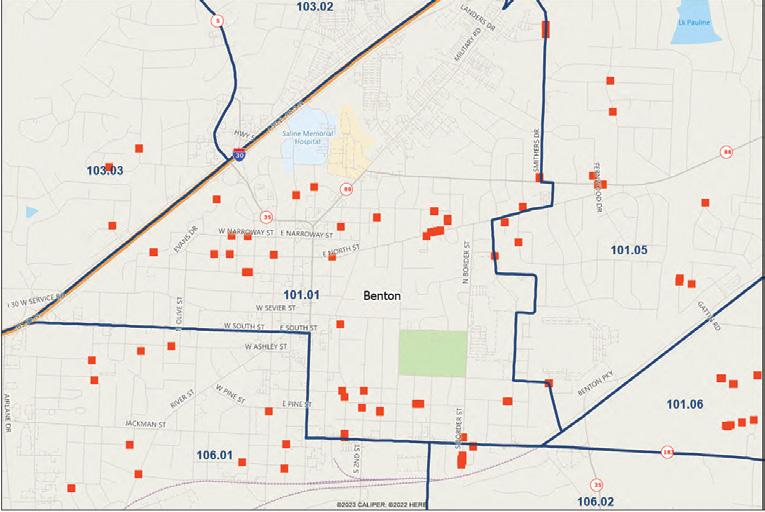
Benton New Single-family Housing Units
2020–2023
Little Rock/ North Little Rock New Single-family Housing Units
2020–2023
1 Local examples include apartment complexes in Little Rock’s Riverdale area, North Little Rock’s Lakewood neighborhood, and on the former airport site in south-central Conway.
Demographic Outlook 2024
The chart below compares population growth rates for the Little Rock MSA and selected south-central U.S. metro areas in the period 2020–2023. While not the same as Metroplan’s estimates, these figures show similar trends. As you can see, the Little Rock MSA is growing faster than the U.S. metropolitan average, and faster than the other south central metros except Tulsa and the Northwest Arkansas region.1
The success of multiple infill projects in Central Arkansas suggests the region is falling in line with national trends. Infill development has been going on in some districts (like River Market and Argenta) for more than twenty years, and the trend is spreading.
Urban revitalization can displace existing residents, often poor and/or minority people, with wealthier non-minority populations. At the same time, reinvestment in older neighborhoods can boost the local economy, provide job growth, and raise property values. The data in Central Arkansas show mixed trends.2
For example, in tract 25 (Argenta) minority population increased from 2010 to 2020. During the period 2012 to 2022 median household income in Argenta more than doubled, and the share in poverty declined. On the other hand, property values and rents increased faster than regional trends in most of the infill neighborhoods studied. This is a good trend for
most homeowners, but can reduce affordability for renters and home buyers.
Infill benefits the local economy and is fiscally beneficial to city governments. By comparison, a growing body of evidence shows that “greenfield” suburban development carries concealed long-term costs for cities. Infill development builds the economy and housing stock by taking advantage of streets, sewers and water lines that are already in place.
MSA_Growth_Comparison_2020-2023
City governments can help, mainly by updating their zoning codes to allow greater flexibility for urban infill. One of the best opportunities lies with ADUs (Accessory Dwelling Units), basically small housing units that share a lot with an existing home. Often prohibited by zoning, ADUs contribute to neighborhood revitalization while increasing the diversity of incomes and age groups that can live in a given area. This might involve young adults getting established among middleaged householders, or elders living close to supportive family members.
If you think of a city as an organism, strong core neighborhoods are vital to the health of the whole. The opportunities are just beginning. There remain plenty of older neighborhoods, particularly in the region’s larger cities, ripe with redevelopment opportunity.
Metro Area Population Change 2020–2023
Metro Area Population Change 2020-2023
Source: U.S. Bureau of the Census.
1 The term “Northwest Arkansas MSA” is easier to use in a chart than “Fayetteville-Springdale-Rogers Metropolitan Area.”
2 For further insight, see the Statistical Supplement on page 15.
Statistical Supplement
This page depicts Metroplan’s analysis of selected infill areas during the period 2010–2022. We compared Central Arkansas with several infill neighborhoods. Figures for “LR Downtown” represent census tract 44 in the traditional downtown area of Little Rock. Figures for “Argenta” represent census tract 25, downtown Argenta in North Little Rock. Tract 30.01 along the riverfront and stretching up Pike Avenue in North Little Rock includes the Rockwater neighborhood, but also a sizeable area north of Rockwater. Tract 46 includes the Pettaway neighborhood, but also large areas that are not yet being redeveloped. It was impossible to get data for more specific geographies due to sampling and privacy limitations of the Census Bureau’s American Community Survey.
The charts shown here depict changing economic and demographic characteristics of these infill areas. As you can see, median household income generally rose faster in the infill areas than the regional average. The poverty rate in 2022 declined in all the infill areas except 30.01, where it rose slightly. Median rent increased more quickly than the regional average in all areas except 30.01, of which the Rockwater area remains only a portion.
The final chart looks at population by race and ethnicity for 2010 and 2020 for selected infill areas, grouped together.1 This analysis was based on the decennial census, which allowed us to use the more specific Block Group geographic definition for Rockwater Village and Pettaway. As you can see, the White/Black balance shifted in these areas, with White population growing while Black population declined marginally. Hispanic and other ethnic groups grew in these areas from 2010 to 2020, so they are more diverse than the regional average.
Source: 5-year ACS 2010 and 2022.
Source: 5-year ACS 2010 and 2022.
Source: 5-year ACS 2010 and 2022.
NOTE: Tract 30.01 includes Rockwater and Tract 46 includes Pettaway.
1 Specifically, tracts 25 and 44, plus tract 30.01 Block Group (BG) 2 and tract 46 BG 1.
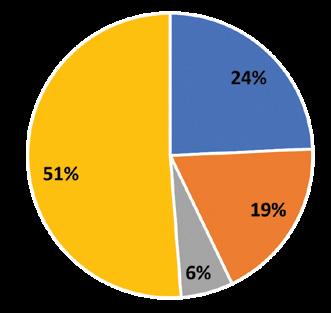
The year 2023 marked the fourth consecutive year in which deaths exceeded births in the state of Arkansas. The mortality trend is at least headed downward, so it is likely that by the time 2024 statistics are in, the blue line (births) may exceed the red line (deaths). Covid-19 still accounted for six percent of deaths in Arkansas during 2022, the most recent year for which we have detailed statistics. This was down from twelve percent in 2021, the pandemic’s worst year statistically.
Arkansas Mortality by Cause 2022
Arkansas Total Deaths and Trend 2010–2023
Arkansas Births and Deaths 2010–2023
Sources: U.S. Centers for Disease Control and Arkansas Department of Health. Figures 2012 and 2017-2023 are provisional.
Needed: A Local Salvage Industry
Not every historic home can be saved. But there are elements in old structures, particularly nineteenth century woodwork, that are valuable and can be repurposed on newer structures. One of the developers we talked with pointed out the local area lacks a real architectural salvage industry. Given the quality of some of the historic architecture in Central Arkansas, this is a business opportunity waiting to be filled.
The map above depicts the “infill tracts” defined in the statistical supplement on page 14, in Conway, central Little Rock/North Little Rock, and downtown Benton.
About Metroplan
Metroplan is a voluntary association of local governments that has operated by interlocal agreement since 1955. Metroplan now has members in five counties of the six-county metro area. Metroplan is the designated metropolitan planning organization (MPO) under Title 23 of the United States Code.
Metroplan serves as the regional voice on issues affecting Central Arkansas, develops transportation plans required by federal law, convenes stakeholders to deal with common environmental issues, and provides information and staff resources to our member local governments, the business community and the public. As part of that mission, Metroplan publishes Metrotrends twice yearly. The spring/ summer edition is normally the Demographic Review and Outlook and the fall/winter edition is the Economic Review and Outlook.
About CARTS
The Central Arkansas Regional Transportation Study, or CARTS, is the cooperative effort by the participating communities, transportation providers, and many other interested parties to develop a long-range transportation plan for the metropolitan area.
This report was funded in part through grant(s) from the Federal Highway Administration and Federal Transit Administration, U.S. Department of Transportation. The views and opinions of the authors expressed herein do not necessarily state or reflect those of the U.S. Department of Transportation. Notice of Nondiscrimination: https://tinyurl.com/yrp24d8a
Metroplan’s Demographic Review and Outlook is an annual chronicle providing demographic and housing data and insight for the Little Rock-North Little Rock-Conway MSA.
Prepared by: Jonathan Lupton—research, writing and editing
Lynn Bell—graphics, layout, illustrations, and editing
Photographs by Metroplan staff except where noted. Cover image by iStockphoto.com
PRESIDENT
Judge Barry Hyde Pulaski County
2024 Metroplan Board of Directors
Mayor Crystal Herrmann City of Alexander
Mayor Bernadette Chamberlain City of Austin
Mayor Eddie Jones City of Bauxite
Mayor Tom Farmer City of Benton
Mayor Chris Treat City of Bryant
Mayor Cody Kees City of Cammack Village
Mayor Bart Castleberry City of Conway
Mayor David “Butch” House City of England
Mayor Sammy Hartwick City of Greenbrier
Mayor Terry Williams City of Guy
Mayor Clyde Crookham City of Haskell
Mr. Keith Keck Hot Springs Village
VICE PRESIDENT
Judge Allen Dodson Faulkner County
Mayor Jeff Elmore City of Jacksonville
Mayor Stephanie White City of Keo
Mayor Frank Scott, Jr. City of Little Rock
Mayor Wayne McGee City of Lonoke
Mayor Caleb Norris City of Maumelle
Mayor Danny Hester City of Mayflower
Mayor Jonathon Hawkins City of Mount Vernon
Mayor Terry Hartwick City of North Little Rock
Mayor Mike Kemp City of Shannon Hills
Mayor Cain Nattin City of Sheridan
Mayor Mary Jo Heye-Townsell City of Sherwood
Mayor Kimberly Schane City of Traskwood
SECRETARY/TREASURER
Mayor Ken Kincade City of Cabot
Mayor Preston Scroggin City of Vilonia
Mayor Charles Gastineau City of Ward
Mayor Terry Don Robinson City of Wooster
Mayor Derrick Rainey City of Wrightsville
Judge Randy Pruitt Grant County
Judge Doug Erwin Lonoke County
Judge Matt Brumley Saline County
Mr. Brad McCaleb Arkansas Department of Transportation