• Demographics in a New Decade • An Unexpected Drop in College Enrollment
• Family Snapshots • Population Estimates & Population Change
• Regional Demographics—A Closer Look • The Mortality Challenge
• Housing Construction Impacted by Interest Rates • Hit by a Tornado
• Demographic and Housing Characteristics
• Statistical Supplement
• Demographic Outlook 2023
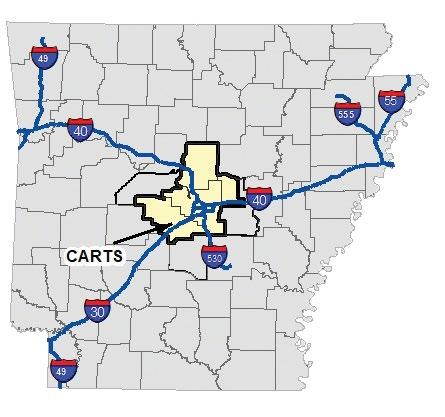
Metroplan is a voluntary association of local governments that has operated by interlocal agreement since 1955. Originally formed as the Metropolitan Area Planning Commission of Pulaski County, Metroplan now has members in five counties of the six-county metro area (see below). Metroplan is the designated metropolitan planning organization (MPO) under Title 23 of the United States Code.
Metroplan serves as the regional voice on issues affecting Central Arkansas, develops transportation plans required by federal law, convenes stakeholders to deal with common environmental issues, and provides information and staff resources to our member local governments, the business community and the public. As part of that mission, Metroplan publishes Metrotrends twice yearly. The spring/summer edition is normally the Demographic Review and Outlook and the fall/winter edition is the Economic Review and Outlook
About CARTS
The Central Arkansas Regional Transportation Study, or CARTS, is the cooperative effort by the participating communities, transportation providers, and many other interested parties to develop a long-range transportation plan for the metropolitan area.
Demographics in a New Decade
Today, approaching the middle of 2023, Metroplan has received most of the critical data we will get from Census 2020. The recent census now provides detailed population counts, broken down by sex and age group. It marks an opportunity to take a deeper look at recent demographic trends and figure out how the demographic structure in Central Arkansas is changing.
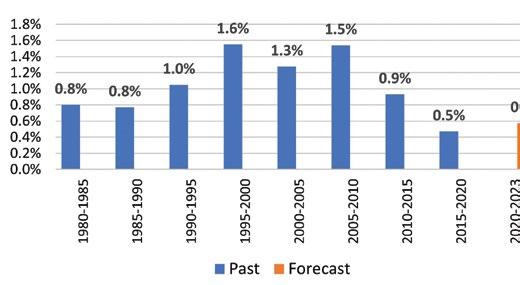
The chart below shows regional annualized population growth in five-year increments from 1970 to 2020. In the second half of the 1990s, and again from 2005 to 2010, the region was growing by nearly 1.6 percent annually. By the second half of the 2010–2020 decade, growth had slowed to about 0.5 percent annually. Preliminary estimates suggest this trend might have picked up—just a little—since 2020. Economic growth in sectors like finance and logistics may account for a slight increase in the regional population trend. The local
Rock Region Annualized Population Growth 1980–2023
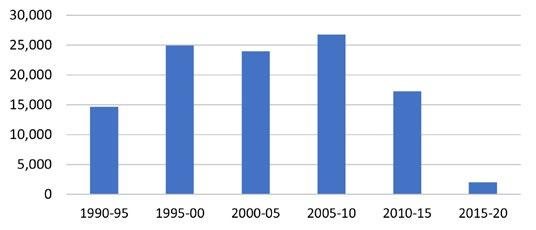
Central Arkansas Net Migration 1990–2020 (Five-Year Intervals)
Source: Migration totals derived from decennial census with Metroplan estimates for interim years and Arkansas Department of Health vital statistics. Arkansas Department of Health. Provisional data for years 2017-2022.
area’s remarkable housing affordability may also be making Central Arkansas attractive to outsiders.
Nonetheless, the region is growing more slowly than in decades as far back as the 1990s. Much of this owes to slower in-migration. As the chart below left shows, regional migration slowed pretty sharply after 2010, particularly in the years 2015–2020. Economic factors played a big role. The phase-out of the Alltel corporation correlated with a major slowdown in economic and population growth.
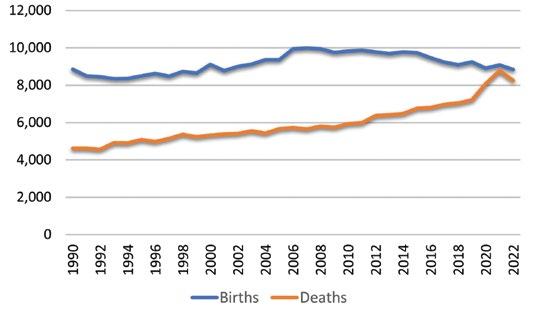
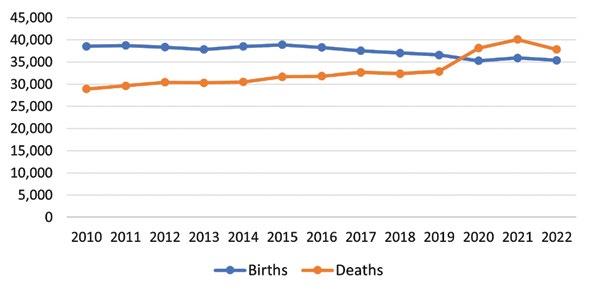
Since migration is becoming a lesser factor in population growth, the regional trend depends more on so-called “natural increase”—the excess of births over deaths. So long as there are more births than deaths, natural increase will remain in positive territory. Yet the surplus of births over deaths has narrowed since 1990.
As you can see below, in 1990 there were nearly 9,000 births, versus about 4,600 deaths—almost two for one. By 2014 the ratio was down to about three births for every two deaths. When covid-19 hit, mortality jumped while births continued
Little Rock MSA Births and Deaths 1990–2022
Source: Arkansas Department of Health. Provisional data for years 2017-2022.
Little
Source: Decennial census with Metroplan estimates for intercensal years.
slowly declining, although there were still slightly more births than deaths.
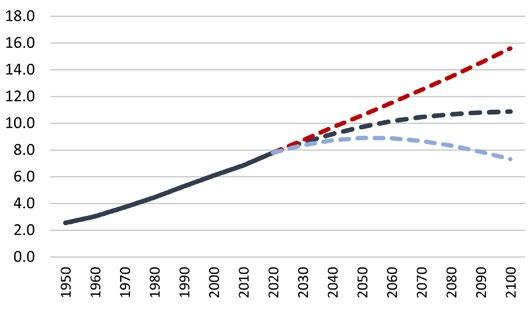
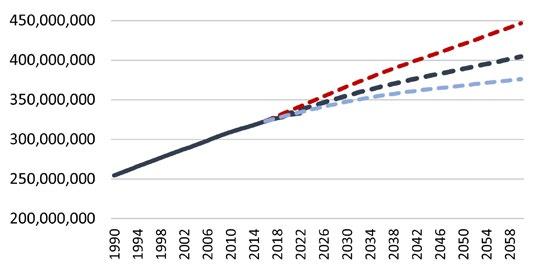
Past in-migration to Central Arkansas has been driven in part by general U.S. (and even global) population growth. The most likely forecast shows global population reaching approximate stability by 2050, and it could even begin declining after about 2100. U.S. population growth is running slower than the global average. With such “background” population growth
Global Population 1950–2020 With UN Forecasts to 2100 (in billions)
slowing, the pool of people likely to migrate into Central Arkansas will diminish. Economic factors like job growth, cost of living, and quality of life have a major influence on in-migration. On balance, a strong regional economy with low costs will attract more growth. But with slowing fertility and a smaller pool of population available for in-migration, the most likely future scenario for the Little Rock metro and other southern metro areas will be continuing but slow population growth.
U.S. Population 1990–2022 With Forecasts to 2060
An Unexpected Drop in College Enrollment
The correlation between educational attainment and economic prosperity is a strong one. People know this, which explains why educational attainment has been climbing throughout modern history. In 1960, about 6.2 percent of population over the age of 25 in Central Arkansas had a college degree. By 2010, that level had risen to about 26.2 percent—quadrupling in about fifty years.
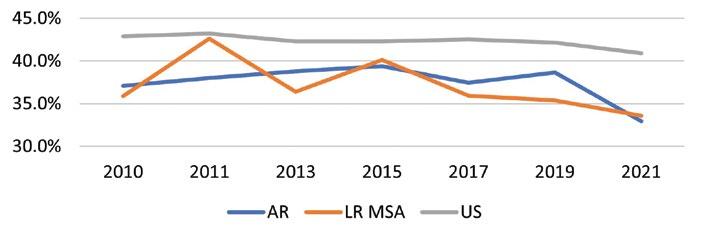
For that reason, the newest statistic is surprising. The chart below shows how far the share of persons ages 18 through 24
enrolled in college has dropped for the U.S., Arkansas, and the Little Rock MSA in the years 2010–2021. These figures are from the ACS and are subject to some margin of error, especially with smaller sample sizes. Overall educational attainment has nonetheless risen, and by 2021 33.3 percent of Central Arkansas residents had a college degree or more. If the share of college-age young adults actually attending college continues dropping though, educational attainment could flatten or decline, posing a risk to future prosperity.
Percent of Population Aged 18 to 24 Enrolled in College or Graduate School
Source: ACS 2010-2021 (one-year).
Source: U.S. Bureau of the Census. High, middle and low migration forecast scenarios developed by Census Bureau in 2017.
More students need to attend college to sustain regional educational levels.
Source: United Nations.
There is no single explanation for personal decisions on when, or whether, to have children. We talked with a few people to get beyond the data and look at the personal side of critical family decisions. The lead article points to declining fertility in the U.S. as well as Central Arkansas.
“The year I turned 30 was the year I realized that having faith in God, meant to also have faith in his timing. While still figuring out motherhood, raising my son, I was called to foster (and later adopt) a little angel.”
—Alexandria
“Deciding if and when to have children is one of the most personal decisions a family makes and our thinking has evolved over time. We have never felt that we were ‘delaying’ having children. Rather, we have had the privilege of deciding if and when to add a child to our family. We are looking forward to welcoming a baby girl this summer!”
—John and Ashley Matejka
Family Snapshots
“My husband and I worked to create our family over many years. After a year of training with DHS, our home opened for foster children in January 2020. Over two years later in May of 2022, we learned about two brothers who needed a forever family. Kameron, age 9, and Keyveon, age 6, were adopted in November of 2022 with Judge Ladd of Fort Smith presiding. That afternoon, Kameron said, ‘I feel free.’”
—Marie Lindquist and David Webb
“My partner and I decided early on in our relationship we did not want to raise kids of our own, but as a teacher and artist, I’m privileged to frequently work with and mentor young people. We value being part of our community, and we enjoy activities with friends, creating art, and spending time outside.”
—Jenna Jones
“June and Virginia hold immense importance in our lives. Being present for their formative years is a true blessing. As parents, we bear the responsibility of nurturing their curiosity, fostering critical thinking, and molding them into strong young women. By doing so, we shape their future and contribute to our state, creating future leaders and empowering individuals who are driven to make a lasting impact on their communities.”
—Abbey and Lee Atwill
Population Estimates 2023
Metroplan’s population estimates for 2023 suggest a small uptick in regional population growth. If current trends continue, the region may be growing a bit faster in the 2020 decade than it did in the 2010s. The biggest evidence of change is Faulkner County, which appears to be growing by over 2 percent annually, compared with less than one percent annually in the previous decade.
The tables below compare the top 15 cities in Central Arkansas in 1990 and 2023, ranked by population size. There have been some changes. Little Rock is still the largest, but its proportional dominance is less. Conway passed North Little Rock shortly after the 2020 census and is now the region’s second largest city. Benton climbed to fourth place, followed by Sherwood at fifth. Cabot has more than tripled in population size, now the region’s seventh-largest city. Yet Cabot is growing more slowly than it did during past decades, while nearby Ward is now the region’s fastest-growing city and also its tenth largest. Nearby Austin was the region’s fastest-growing city in the 2010–2020 interval, but housing construction has slowed markedly. There is little land for new subdivisions within the city, which is hemmed-in by boundaries from nearby Ward and Cabot.
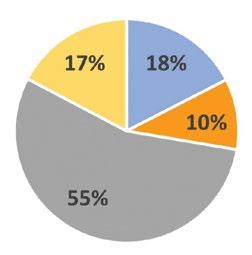
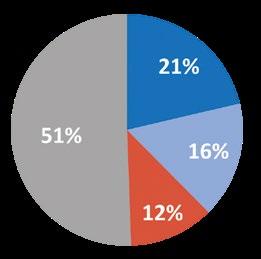
The charts below compare county population shares in 1990 and 2023. While Pulaski County remains larger than the three outlying counties combined, its share of the total has diminished. The outlying counties accounted for about 32 percent of regional population in 1990, and 45 percent by 2023.
Top Fifteen Central Arkansas Cities 1990 and 2023
Sources: Census 1990 and Metroplan 2023 estimates.
Population Change
Little Rock-North Little Rock-Conway MSA Population Change 2020–2023
*Represents portion of Alexander by county **Official MSA since May 2003
Regional Demographics: A Closer Look
Three factors drive population change: births, deaths, and migration. The “components of change” table below gives the figures by county.1 Deaths are subtracted from births to derive natural increase. Deaths were greater than births in three counties (Grant, Perry, and Saline) yielding negative natural increase. Covid-19 deaths accounted for a share of the deaths, but other factors have been affecting mortality too. Higher death rates are caused by aging of the population but there has also been a rising toll from “deaths of despair” caused by drug and alcohol abuse, and even suicides.
Historically, widespread vaccinations have been a critical factor in making mortality rates decline, including vaccination against a host of diseases that plagued the population long before Covid-19 existed. Popular receptivity to vaccination is in question today, and this could affect future death rates.
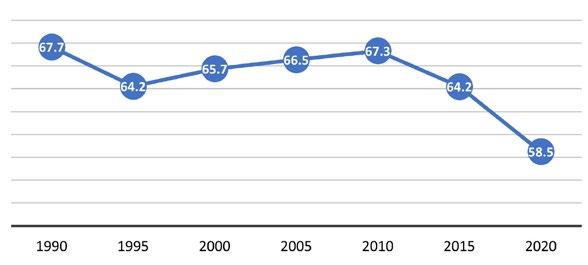
In the end it takes births to maintain a population. The critical factor is the General Fertility Rate, defined as the number of births per 1,000 women of childbearing
age. The chart below shows how this figure has declined in Central Arkansas from about 67.7 in 1990 to 58.5 in 2020.
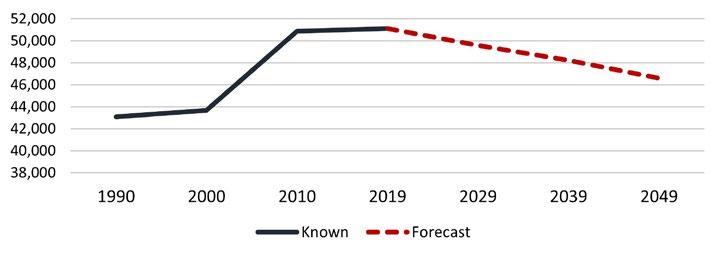
Not only is fertility declining, but the large Millennial generation will soon pass beyond the most fertile childbearing ages (typically 20 to 29). The chart at right tracks the region’s population of young women in these age groups. Females 20 to 29 rose by about 16 percent from 2000 to 2010, and grew again slightly to 2019. Underlying demographic factors suggest, however, that the population of females in childbearing ages will likely decline over the next thirty-odd years.
Central Arkansas General Fertility Rate 1990–2020
Source: Decennial Census, Census estimates, Arkansas Department of Health. Statistics 2017 onward are provisional.
Little Rock MSA Components of Population Change 2020-2023
Sources: Census 2020. Metroplan estimates for 2023. Arkansas Department of Health for births and deaths. Figures are provisional.
1 Birth and death data from Arkansas Department of Health. All recent figures are provisional and will be subject to minor changes before the numbers are finalized. Migration is a byproduct derived from Metroplan population estimates after accounting for births and deaths.
Central Arkansas Female Population Ages 20 to 29 1990 to 2019 Forecast to 2049
The Mortality Challenge
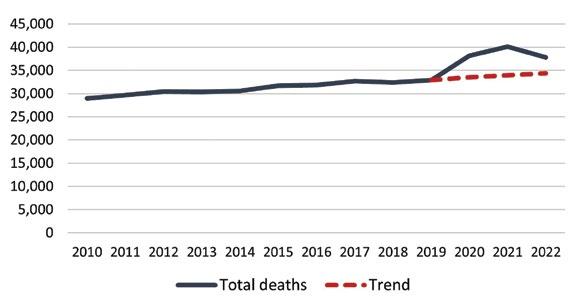
The chart at right shows that the state of Arkansas has now experienced negative natural population change for three consecutive years—2020, 2021 and 2022. Total deaths were higher than total births. Although births have been trending down for several years, and deaths were already trending up due to aging of the population, the sudden spike was caused by Covid-19. The next chart gives a trendline analysis, demonstrating that deaths in 2021 exceeded the normal trend by 6100. In the year 2021, the figure for Covid-19 mortality in Arkansas was 4,740. Deaths remained above the trend in 2022 but were coming down. In 2021, Covid-19 was the third leading cause of death in the state, after heart disease and cancer. The disease’s long-term impacts on mortality remain uncertain.
Sources: U.S. Centers for Disease Control and Arkansas Department of Health. Figures 2012 and 2017-2022 are provisional.
Sources: U.S. Centers for Disease Control and Arkansas Department of Health. Figures 2012 and 2017-2022 are
Photo: iStockphoto.com
Sources: Decennial census 1990, 2000 and 2010. ACS 2021 five-year. Metroplan forecasts for 2020, 2039 and 2049.
Arkansas Mortality by Cause 2021
Source: Arkansas Department of Health. 2021 statistics are provisional.
Arkansas Total Deaths and Trend 2010–2022
provisional.
Arkansas Births and Deaths 2010–2020
1“The Pandemic’s True Death Toll,” Economist Oct. 24, 2022.
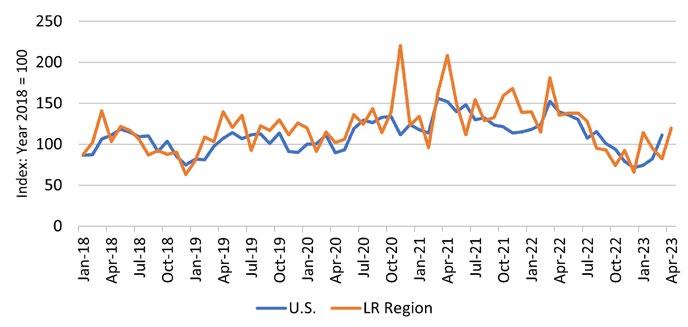
Housing Construction Impacted by Interest Rates
Housing construction veered downward during 2022. Local single-family housing starts began tapering by late spring 2022, in line with national trends. In early 2023 U.S. and local construction veered back upward a bit, but the pace remains below the pandemic-related surge of 2020 and 2021.
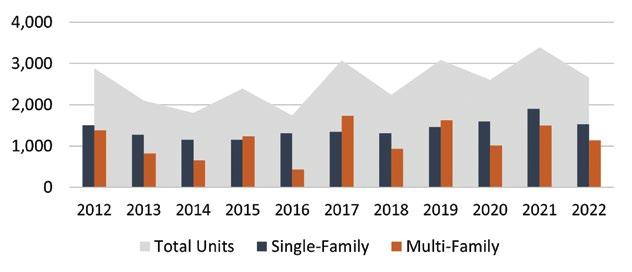
During 2022 the region saw 1,527 new single-family homes permitted, down about 20 percent from 1,904 in 2021. Among the cities in the survey, Jacksonville saw a big bump upward thanks in part to 31 new homes at The Meadows in June. North Little Rock also increased its permits by about four percent, and Hot Springs Village saw a two percent increase. All other cities saw fewer new homes than the preceding year. Little Rock saw the greatest decrease, down 30 percent from 517 homes in 2021 to 361 during 2022.
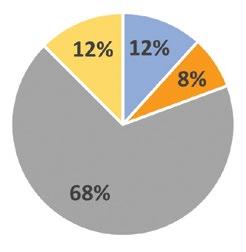
Multi-family permits were down also, dropping 24 percent from nearly 1,500 units in 2021 to about 1,100 in 2022. As usual the bulk of multi-family new construction activity was in the largest cities: Little Rock, North Little Rock, and Conway. The region is also seeing a minor increase in “missing middle” housing units like duplexes, triplexes and four-plexes. In summary, multi-family accounted for 43 percent of new units being built in the region during 2022.
Note: regional totals shown above exclude Hot Springs Village, part of which extends into Garland County beyond Metroplan’s area.
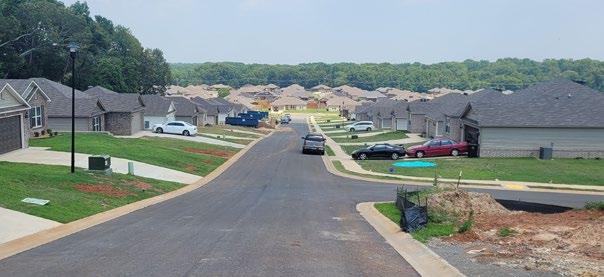
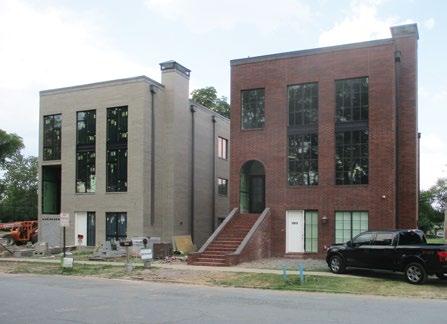
The new Oakland Grove subdivision in Ward, currently the region’s fastest growing city.
Sources: U.S. Bureau of the Census, Building Permits Survey. Metroplan records. Hit by a Tornado
Central Arkansas residents remember some bad tornadoes in 1999, 2011, and 2014. It happened again on March 31, 2023. This one affected even more people, ravaging heavily populated areas in Little Rock, North Little Rock, Sherwood and Jacksonville. Fatalities were few, but damage was widespread and numerous homes were destroyed. Replacing lost homes will boost local housing construction, and will reduce some of the dampening effect higher interest rates would otherwise have on local housing statistics.
This drone image captures some of the tornado’s worst damage in LIttle Rock’s Walnut Valley area along Shackleford Road. Photo credit: David Lewis
Major home repairs in Little Rock’s Kingwood neighborhood.
Damage to condominiums in Little Rock’s Foxcroft neighborhood.
This small apartment complex is going in north of Bishop Lindsey Drive in North Little Rock’s Argenta District.
Demographic and Housing Characteristics
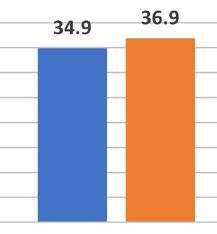
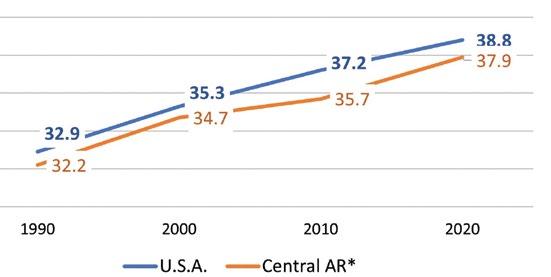
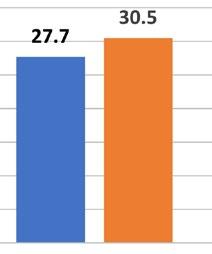
On May 25, 2023 the U.S. Bureau of the Census released its 2020 Demographic and Housing Characteristics (DHC) data, including detail on population by age. The share of younger people is smaller due to lower birth rates, and U.S. median age is now 38.8. Population is also aging in the Little Rock MSA, where median age reached 37.9.
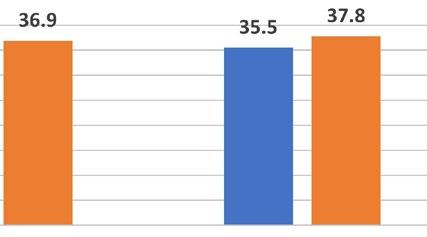
The new census data also provides background on housing characteristics, including the owner/renter balance. The share of renters is rising nationally as well as locally, now accounting for 37.8 percent of all housing units in Central Arkansas. Tighter lending markets since the Great Recession and rising economic inequality are probably contributing factors.
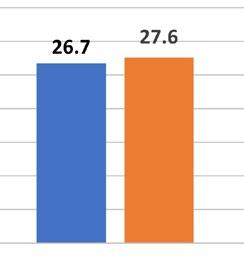
Declining average household size may also account for the rise in renting. Not only are households growing smaller, the number of people living alone has risen. In 2020 nearly onethird of local households consisted of persons living alone in Central Arkansas, slightly higher than the national average.
Single-Person Households as Share of Total Households 2010–2020
Renter-Occupied Housing as Share of Total Households 2010–2020
Median Age of Population 1990–2020
In 2020 nearly 1/3 of Central Arkansans lived alone.
Demographic Outlook 2023
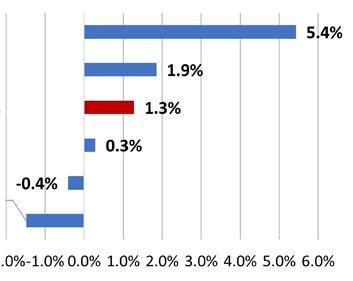
U.S. population growth is slowing, and recent Census 2020 population-by-age statistics show the population is also growing older. Seen in this light, the slowdown in local population growth is part of a larger trend. The chart below compares growth rates for the Little Rock MSA (in red) against rates for selected South Central U.S. metro areas. Aside from the Northwest Arkansas region, none of them
U.S.
Fayetteville-Springdale-Rogers, AR Tulsa, OK
Little Rock-North Little Rock-Conway, AR
Baton Rouge, LA Memphis, TN-MS-AR Jackson, MS
has grown more than 2 percent, while two metro areas— Jackson, Mississippi and Memphis, Tennessee—have shown net population decline. Government and business planning strategies need to adapt to the new demographic reality. Seen in perspective, slower growth reduces the pressure for rapid infrastructure development and allows a little more time for thoughtful planning.
Source: U.S. Bureau of the Census, Census 2020 and 2022 population estimates.
Statistical Supplement
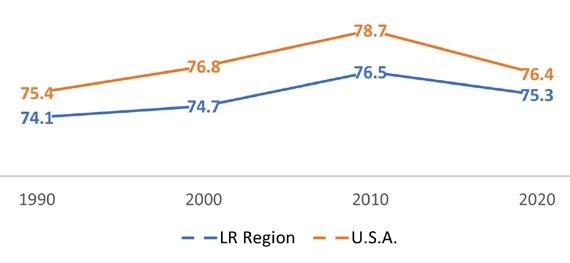
The chart below compares life expectancy trends since 1990, for the U.S.A. and the four-county Central Arkansas region. Historically life expectancy has tended to slowly rise, but since 2010 both U.S. and local life expectancies have declined. Covid-19 is at least part of the explanation, although a rise in so-called “deaths of despair” from drug and alcohol abuse is probably also a factor.
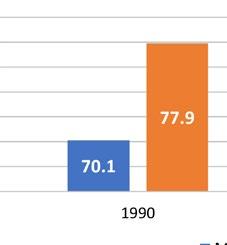
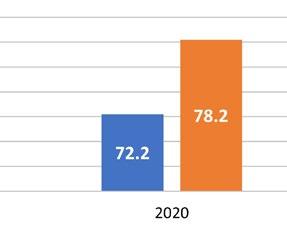
The final chart compares male and female life expectancy in Central Arkansas in 1990 and 2020. While male life expectancy remains lower, it has risen by more over the thirtyyear timeline. The local life expectancy figures were derived by Metroplan from mortality data provided by the Arkansas Department of Health. Mortality figures for years since 2017 remain provisional and are subject to continuing minor revisions.
Source: U.S. Centers for Disease Control, with Metroplan calculations for LR Region.
Source: Metroplan analysis based on Decennial Census with mortality data from Arkansas Department of Health. Statistics for 2020 are provisional.
PRESIDENT
Judge Barry Hyde Pulaski County
2023 Metroplan Board of Directors
VICE PRESIDENT
Mayor Allen E. Scott City of Bryant
SECRETARY/TREASURER
Judge Allen Dodson Faulkner County
Mayor Crystal Herrmann City of Alexander
Mayor Bernadette Chamberlain City of Austin
Mayor Eddie Jones City of Bauxite
Mayor Tom Farmer City of Benton
Mayor Ken Kincade City of Cabot
Mayor Cody Kees City of Cammack Village
Mayor Bart Castleberry City of Conway
Mayor David “Butch” House City of England
Mayor Sammy Hartwick City of Greenbrier
Mayor Terry Williams City of Guy
Mayor Clyde Crookham City of Haskell
Mr. Keith Keck Hot Springs Village
Mayor Jeff Elmore City of Jacksonville
Mayor Stephanie White City of Keo
Mayor Frank Scott, Jr. City of Little Rock
Mayor Wayne McGee City of Lonoke
Mayor Caleb Norris City of Maumelle
Mayor Danny Hester City of Mayflower
Mayor Jonathon Hawkins City of Mount Vernon
Mayor Terry Hartwick City of North Little Rock
Mayor Mike Kemp City of Shannon Hills
Mayor Cain Nattin City of Sheridan
Mayor Mary Jo Heye-Townsell City of Sherwood
Mayor Kimberly Schane City of Traskwood
Mayor Preston Scroggin City of Vilonia
Mayor Charles Gastineau City of Ward
Mayor Terry Don Robinson City of Wooster
Mayor Derrick Rainey City of Wrightsville
Judge Randy Pruitt Grant County
Judge Doug Erwin Lonoke County
Judge Matt Brumley Saline County
Mr. Brad McCaleb Arkansas Department of Transportation
Mr. Justin Avery Rock Region METRO
Mr. Bryan Day Little Rock Port Authority
Mr. Bryan Malinowski Clinton National Airport
Metroplan’s Demographic Review and Outlook is an annual chronicle providing demographic and housing data and insight for the Little Rock-North Little Rock-Conway MSA.
Prepared by: Jonathan Lupton, research, writing and editing Lynn Bell, graphics, layout, and illustrations
Photographs by Lynn Bell and Jonathan Lupton except where noted
This report was funded in part through grant(s) from the Federal Highway Administration and Federal Transit Administration, U.S. Department of Transportation. The views and opinions of the authors expressed herein do not necessarily state or reflect those of the U.S. Department of Transportation.
Notice of Nondiscrimination
Metroplan complies with all civil rights provisions of federal statutes and related authorities that prohibit discrimination in programs and activities receiving federal financial assistance. Therefore, Metroplan does not discriminate on the basis of race, sex, color, age, national origin, religion, disability, or income status, in admission or access to and treatment in Metroplan’s programs and activities, as well as Metroplan’s hiring or employment practices. Complaints of alleged discrimination and inquiries regarding Metroplan’s nondiscrimination policies may be directed to Sydney Dozier, Title VI/ADA/504 Coordinator, 501 West Markham Street, Suite B, Little Rock, AR 72201, (501) 372-3300, or the following e-mail address: sdozier@metroplan.org. (Hearing and speech impaired may dial 711.)
This notice is available upon request from the Title VI/ADA/504 Coordinator in large print, audiotape or braille.