• Census 2020 in Central Arkansas • A Demographic Perspective
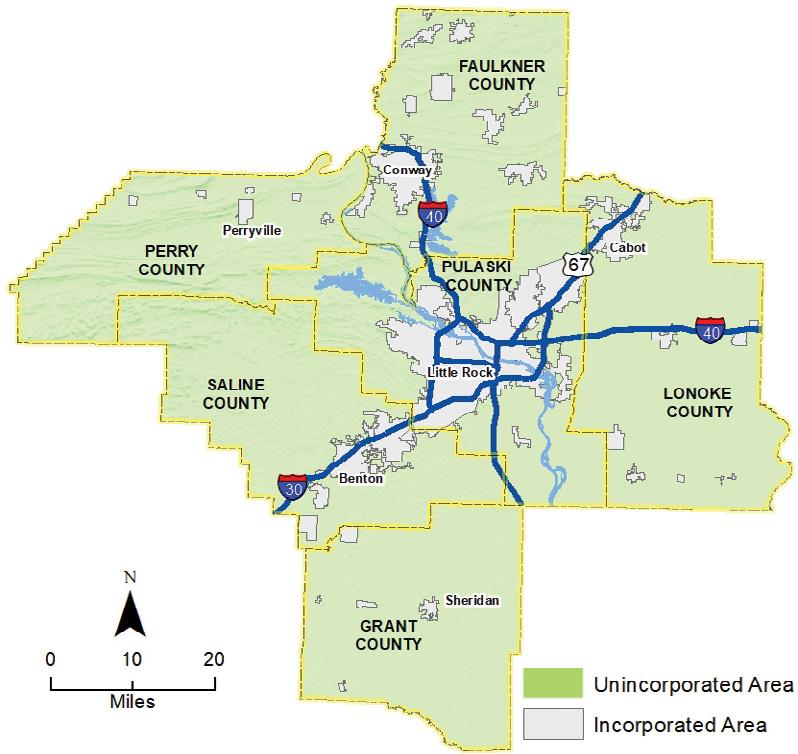
• Local Census 2020 Results • Population Change by County
• The Big Three Cities • Unincorporated Area Trends • Racial & Ethnic Change
• Housing Sector Rising • Demographic Outlook • Statistical Supplement
December 2021
Census 2020
About Metroplan
Metroplan is a voluntary association of local governments that has operated by interlocal agreement since 1955. Originally formed as the Metropolitan Area Planning Commission of Pulaski County, Metroplan now has members in five counties of the six-county metro area (see below). Metroplan is the designated metropolitan planning organization (MPO) under Title 23 of the United States Code.
Metroplan serves as the regional voice on issues affecting Central Arkansas, develops transportation plans required by federal law, convenes stakeholders to deal with common environmental issues, and provides information and staff resources to our member local governments, the business community and the public. As part of that mission, Metroplan publishes Metrotrends twice yearly. The spring/summer edition is normally the Demographic Review and Outlook and the fall/winter edition is the Economic Review and Outlook. In 2021 the release of the 2020 Census did not occur until August. Therefore, we reversed the order, with the Demographic Review and Outlook in the fall/winter period.
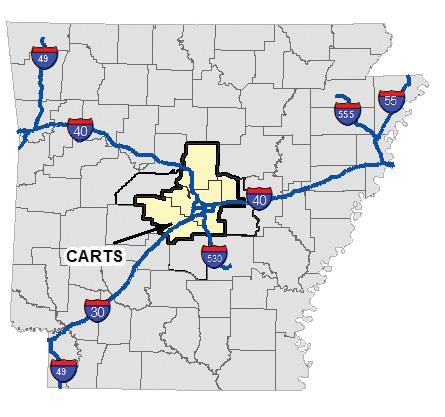
About CARTS
The Central Arkansas Regional Transportation Study, or CARTS, is the cooperative effort by the participating communities, transportation providers and many other interested parties to develop a long-range transportation plan for the metropolitan area.
Census 2020 in Central Arkansas
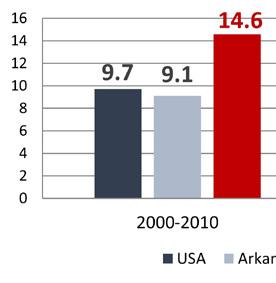
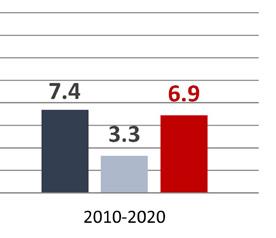
The U.S. Bureau of the Census finally released local-area census results during August 2021. The figures point to slowing growth at all levels—national, state and the Central Arkansas region. As the chart below shows, population growth ran slower from 2010 to 2020 than it did the previous decade.
Population Growth by Decade 2000 to 2020
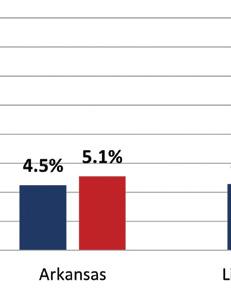
The drastic slowdown within the state of Arkansas demonstrated a contrast between population decline in rural areas and continuing growth in its two largest urban centers. The chart below breaks state population change into categories. Overall state population grew by 95,600 people, as shown in red at top. The state’s top two metro areas, shown immediately below, both grew. The Northwest Arkansas region gained 106,600, while Central Arkansas gained 48,300. The state’s other metro areas saw a net loss of 2,200 people. The biggest population loss was the state’s rural counties, which shed 57,100 people and, more than anything else, accounted for the state’s slow 3.3 percent overall population growth over the 2010–2020 decade.
The slowdown in Central Arkansas population growth correlates with an economic slowdown across the decade. While the Great Recession had a below-average impact on the local economy in the years 2008–2010 or so, the region’s subsequent recovery ran slower than the national average. There was little direct evidence of economic strain, because unemployment rates remained low. The lack of direct economic pain may have masked the way income, job and population growth over the decade ran lower than in previous economic eras.
Census 2020 also revealed changes in the region’s racial makeup, population density, and shifting growth trends among its cities, to be discussed in the remainder of this issue.
Rock-NLR-Conway MSA
Little Rock MSA population gain 2010–2020:
A Demographic Perspective
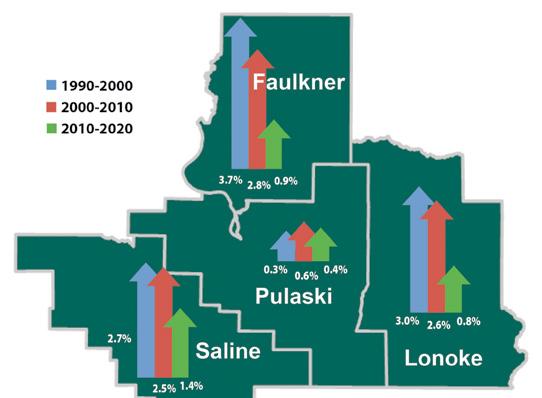
The table on the facing page gives Census 2020 figures for Metroplan’s communities. A few small cities, like Austin, Ward, Shannon Hills, Bryant, Wooster and Greenbrier grew by rates exceeding 20 percent, but overall regional growth was a modest 7.2 percent. Faulkner County narrowly edged out Saline County to remain the region’s second-largest. Since it has a 15.2 percent growth rate, compared with Faulkner County’s 9.1 percent, Saline County will soon have a larger population.
Population change in a place is caused by just three factors: births, deaths, and migration. When you look at big areas, like the globe or even nations, births and deaths tend to drive the change. For smaller areas migration is the prime cause for growth or decline.
In past decades the Little Rock MSA saw steady net in-migration, mainly from rural portions of the state. The region’s largest influx typically comes from young adults, often starting their careers in the region’s job market, which offers a wider variety of jobs and higher pay than rural areas. The Little Rock region’s unemployment rates run below state and national averages in good times and bad, signifying reliable demand for workers.
For the 2010–2020 decade net in-migration was still in positive territory, but slower than in the past. For this reason, natural increase—the excess of births over
deaths—was the larger overall factor in population growth. This may give us hints about the future, because natural increase will matter more if in-migration remains slow.
There are, of course, variations within the region. The largest share of migration went to Saline County, followed by Faulkner and Lonoke Counties. Pulaski County saw slight net out-migration but gained over 16,000 people due to natural increase. Some of the differences in county population growth represent migration within the region. As in past decades since at least the 1980s there was net out-flow from Pulaski County to suburban counties, but during the 2010–2020 decade the pace of outward migration slowed.
Sources: Birth and death data from Arkansas Department
Faulkner
Local Census 2020 Results
Little Rock-North Little Rock-Conway MSA Population Change 2010–2020
*Represents portion of Alexander by county **Official MSA since May 2003
Annualized Population Growth Rates Four-County Region 1990 to 2020
Population Change by County
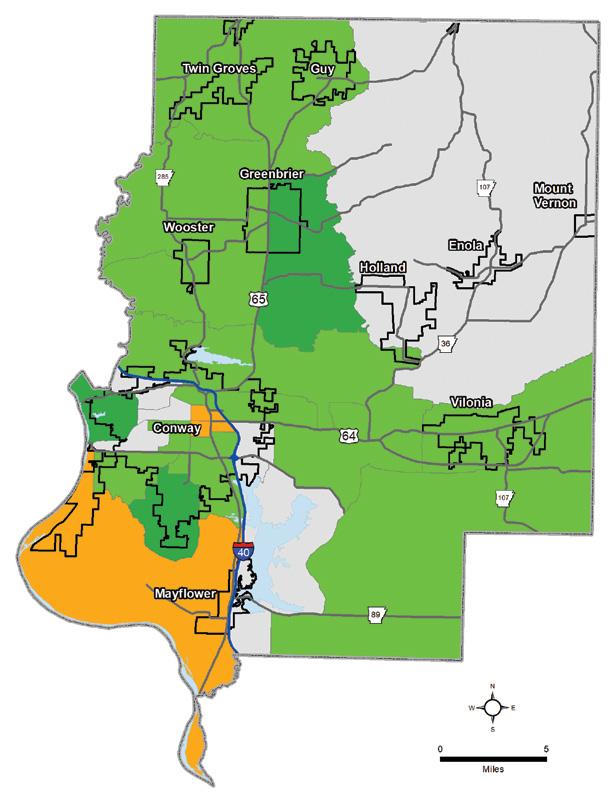
Faulkner County
Faulkner County grew by about 10,000 people from 2010 to 2020, a rate of 9.1 percent. This was solid growth, yet a major down-shift from a breathless 31.6 percent in the previous decade. Most portions of the county still saw net population gain, but portions of Conway and southern Faulkner County saw small amounts of population loss.
The fastest growth 2010–2020 was in south Conway, where tract 310.08 grew by 56 percent. This was the Round Mountain area. Western Conway, previously the city’s fastestgrowing area, saw growth west of Hogan Lane but the pace was slower here than the previous decade and portions of near-western Conway east of Hogan were essentially stable.
A fair amount of Conway’s growth in the decade came from multi-family housing construction. New complexes went up in several portions of the city, but the bulk of new apartments were built south of Dave Ward Drive. Older parts of Conway,
Faulkner County
Population Change by Census Tract 2010–2020
including downtown and areas eastward to I-40, saw net population decline. Some of this represents the familiar empty-nesting phenomenon which occurs in older neighborhoods. Northeastern Conway continued gaining population, including the mixed-use Hendrix Village community just east of Hendrix College.
Northern Faulkner County continued growing rapidly, especially the towns of Greenbrier and Wooster. Vilonia also saw fast growth in southeastern Faulkner County. Portions of southwestern Faulkner County saw some population loss in the recent decade. The county’s rural northeast portion was essentially unchanged.
A lot of new homes have been built in Wooster in recent years and more are coming.
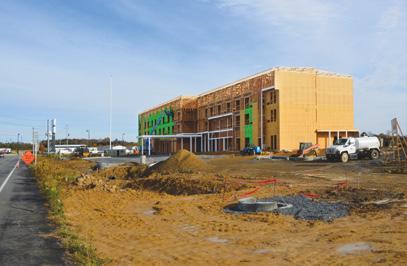
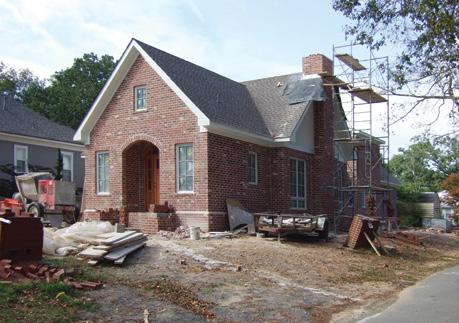
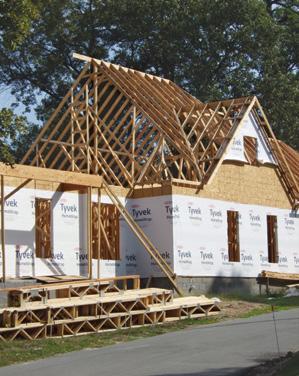
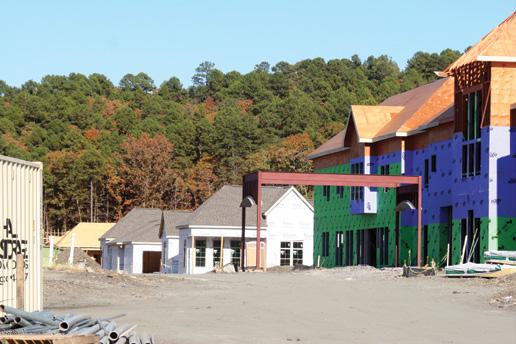
The Maly District east of I-40 and south of Dave Ward Drive in Conway is a $130 million project beginning with a new Courtyard Marriott, shown under construction here.
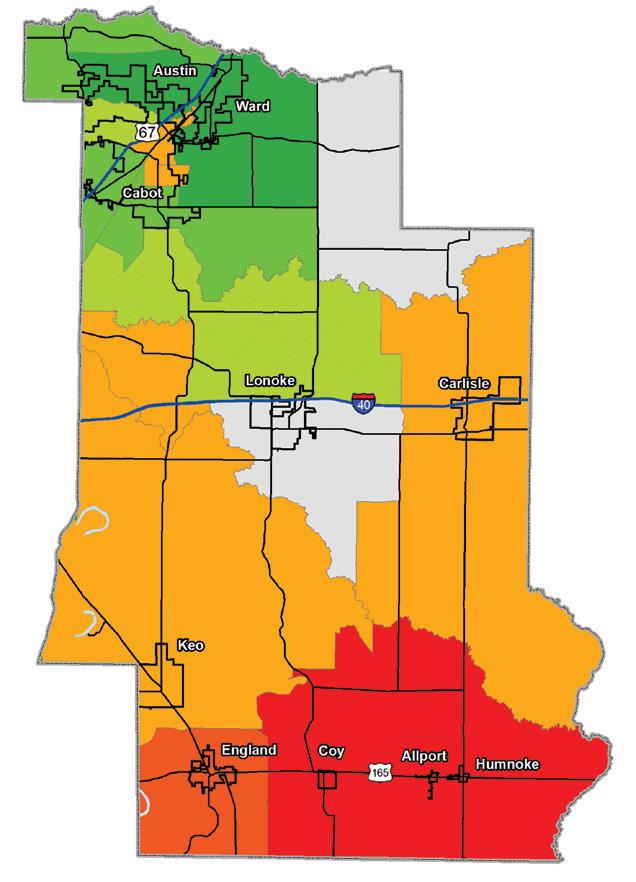
Lonoke County
Lonoke County gained nearly 6,000 people (8.3 percent), but with a sharp contrast between growing population in its suburban northwest area and continuing decline in rural central and southern portions. The fastest growth was in Austin and Ward, but Cabot also saw major gains in the Greystone area northwest of the freeway. Almost all this growth was in single-family homes. Cabot also saw slow population decline in central and northeastern portions of town, a common pattern that emerges twenty to thirty years after original build-out. This includes empty nesting as children outgrow family homes. Proximity and access to the U.S. 67-167 freeway remains an important factor in development because the bulk of employed residents in Lonoke County commute to jobs in Pulaski County.
The city of Lonoke grew slightly, shown with the gray central part of the map that denotes “essentially unchanged.” Areas south of Lonoke saw population decline. Most of this area is rural in nature, with demographic trends and patterns that correlate more with the state’s Delta region than with the Little Rock MSA.
Lonoke County Population Change by Census Tract 2010–2020
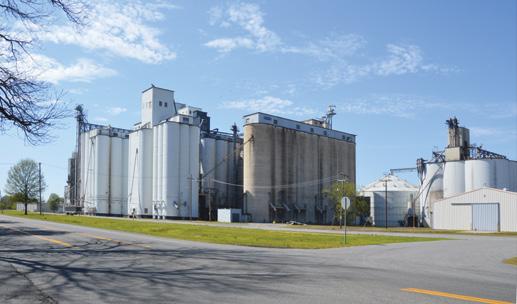
Agriculture and related industries remain an important part of Lonoke County’s economy.
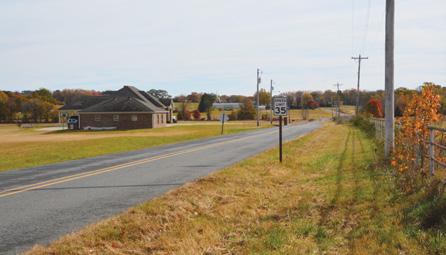
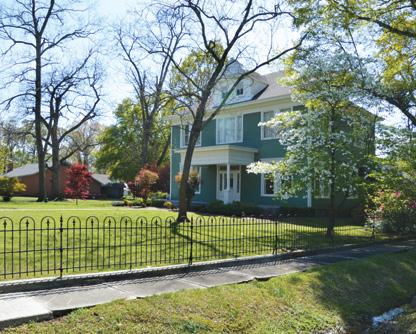
Lonoke is an older town with historic architecture and tree-lined streets.
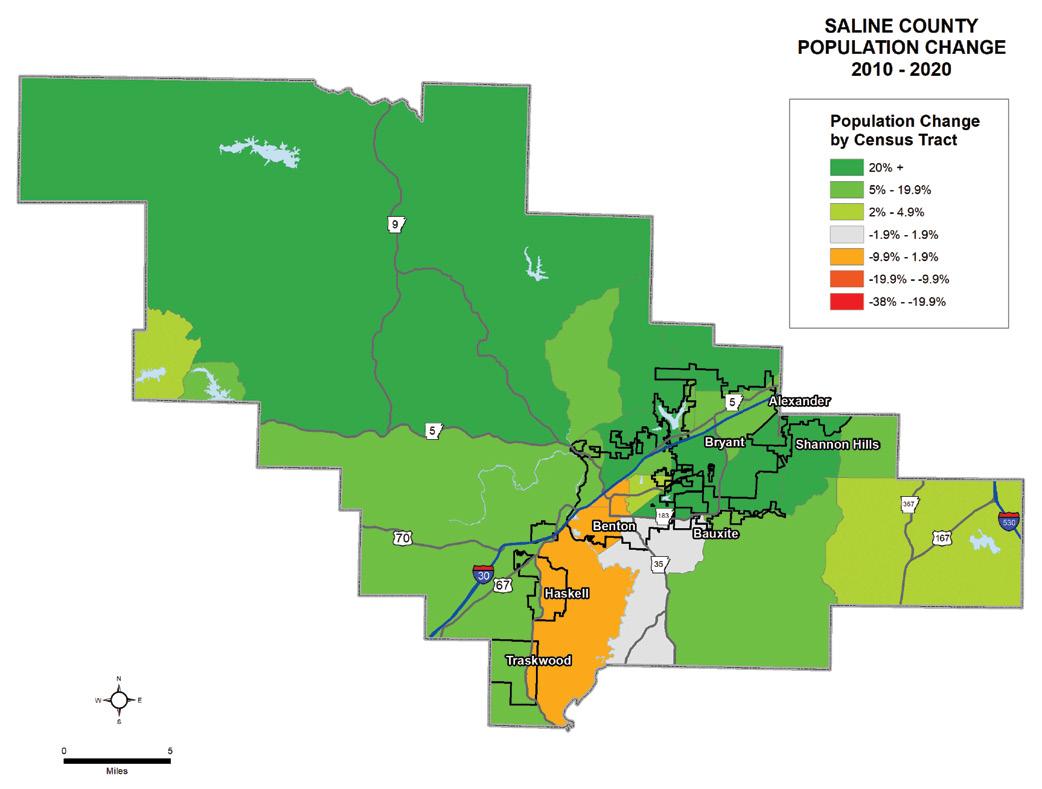
Saline County
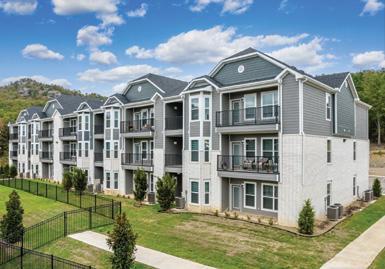
Saline County gained about 16,000 people over the decade (+15 percent), fastest among the region’s counties. Almost all portions of the county grew, with the sole exception of south Benton and rural areas in southern portions of the county. Benton gained over 4,000 people, mainly in the city’s northern portions. This included the sizeable Longhills apartment complex, which added 612 units north of I-30. Bryant grew even faster and crossed 20,000 by 2020. The abutting cities together have nearly 56,000 people, an urban conglomeration nearly as large as Conway. Shannon Hills, northeast of Bryant, also continues growing rapidly.
The large patch of “fast growth” green area in northern Saline County is a geographic anomaly since much of the area is unpopulated national forest. The dark green color suggests high growth rates from a small base. There is fast housing growth in pockets of this large expanse in northern Saline County, mostly outside incorporated cities, especially abutting Pulaski County. Hot Springs Village, an unincorporated
community part of which lies in western Saline County, also continued growing.
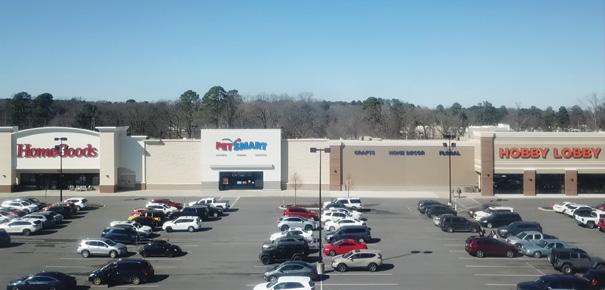
More jobs are emerging in Benton and Bryant but, for the moment at least, Saline County remains primarily a bedroom community. Over half of workers commute to jobs in Pulaski County, meaning the I-30 commuting spine remains a critical feature. Some of the county’s central areas, especially in Bryant, are building out and will grow more slowly in the future. The unincorporated East End community, which connects to I-530 in extreme eastern Saline County, continues growing at a moderate pace.
Saline County Population Change by Census Tract
Centers like Alcoa Crossing have given Saline County residents more shopping and dining options closer to home. Photo credit: City of Benton.
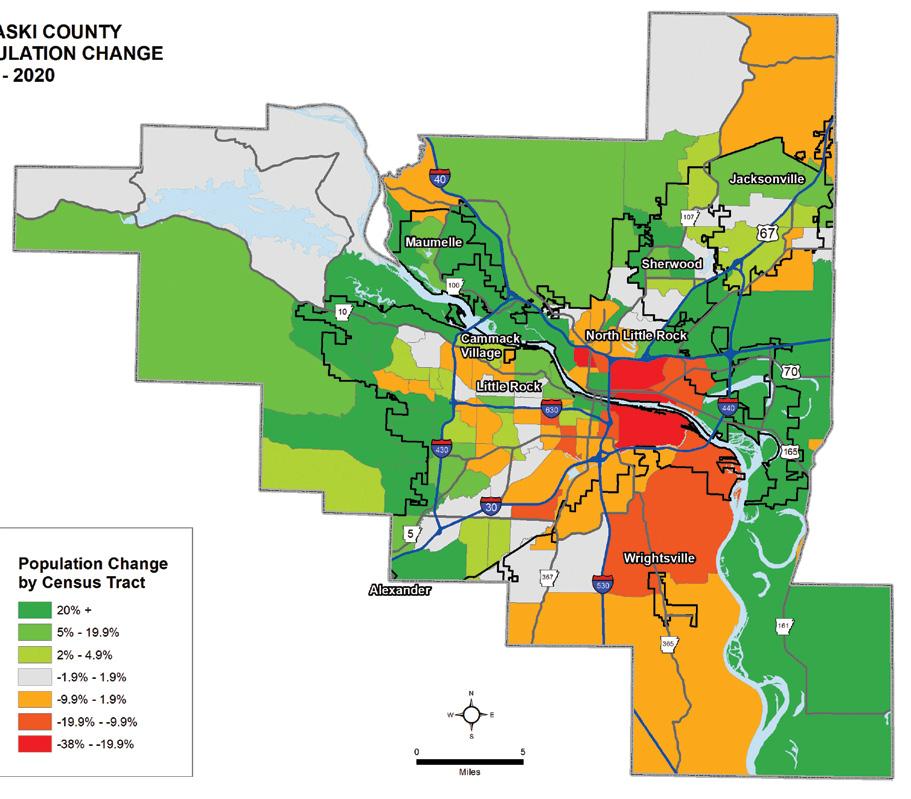
Pulaski County
Pulaski County gained about 16,000 people, a growth of 4.3 percent. Its internal population change was complex and varied. Western portions of Little Rock gained population by more than 20 percent, not just from new single-family homes but also from several sizeable apartment complexes. Apartment growth was most pronounced in a southwest axis along Bowman Road and near or west of I-430, but some units were also added in the Chenal area. Portions of near-west Little Rock saw stable population or even decline as single-family subdivisions built out in the 1990s began to reach the empty nesting phase.
The new Hampton Astoria Apartments with 108 units on Chenal Valley Road. Source: apartments.com/hamptonastoria-residential-apartments-little-rock-ar/c43cfmd/
Central Little Rock saw mixed trends, with slow population growth in areas near the river. This included net population gains in tracts 44 (downtown) and 45 (Children’s Hospital, Philander Smith College and environs). Tracts farther south were stable or lost population. The area surrounding the Clinton National Airport saw continuing loss of housing units, although the 2020 census count predated completion of 176 new apartments on the riverfront.
South Pulaski County saw continued population decline. This area has attractive landscapes and is in easy commuting distance of jobs in Little Rock as well as Bryant and Benton. It remains under-valued and has potential to attract new development.
North of the river, the greatest growth was at both east and west ends. Maumelle continued to grow but the largest population boost came from developments along and near
Pulaski County Population Change by Census Tract 2010–2020
Maumelle Boulevard in extreme western North Little Rock, mostly of a multi-family nature. With a new interchange on I-40 at White Oak Crossing the vector of fast growth will probably shift eastward, closer to the freeway. The portion of North Little Rock east of I-440 also saw growth, although the total numbers were smaller. The bulk of the city’s growth here was within about 1–2 miles north and south of U.S. 165.
Central portions of North Little Rock saw population decline, which was especially pronounced in areas just south of I-40. Downtown Argenta has continued its comeback although the net gain of about 400 population is moderate in scale. Major areas of Sherwood, Jacksonville and rural north Pulaski County that saw fast growth in the 1990s and early 2000s are now stable, although plenty of new housing has been built in and near the intersection of Brockington Road and State Highway 107 in northern Sherwood, with more coming.
The Big Three Cities
Between them, the region’s three largest cities account for nearly half—46 percent—of its population. They also account for about 70 percent of the region’s jobs (by place of work). Many of the region’s important places, like corporate and government offices, hospitals, college campuses, and other institutions are in these three cities.
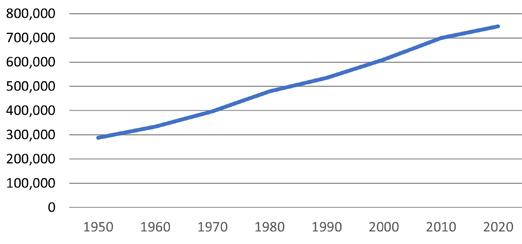
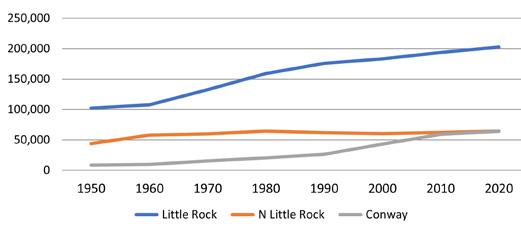
Census 2020 showed all three are growing. Little Rock easily passed the 200,000 mark, reaching 202,591. North Little Rock edged out Conway—just barely—to remain the region’s second-largest city with 64,591 people. Conway came in very close at 64,134 (just 457 people, or 0.7 percent shy of North Little Rock). As the chart below shows, Little Rock’s growth trend has been steady over the past forty-odd years. Conway has grown very quickly in recent years, but slowed down after 2010. North Little Rock’s trend has been the choppiest, showing population decline from 1980 to 2000. Since then, aided by growth in apartments near Maumelle Boulevard and west of I-430, the city has seen renewed population growth.
Little Rock-North Little Rock-Conway Population Trends 1950–2020
All three cities have seen downtown and near-downtown renewal in recent years. Redevelopment is most pronounced in Little Rock, where it is reaching into older suburbs near downtown. Jobs may be less numerous downtown postpandemic, but the opportunities for redevelopment into housing are just beginning. In North Little Rock there is new multi-family housing in the Argenta district, as well as a mix of single-family and multi-family housing in the new Rockwater Village neighborhood westward along the Arkansas River. Investments and new construction are
beginning to creep northward from both the Argenta and Rockwater districts.
Conway has also seen a return of investment to its downtown area in recent years, as well as in the Hendrix Village neighborhood a few blocks to the northeast. While population has declined just a bit in and near downtown, the number of occupied housing units has gone up, while commercial activity has risen. Farther south, areas of the city near the University of Central Arkansas campus have seen population and commercial growth.
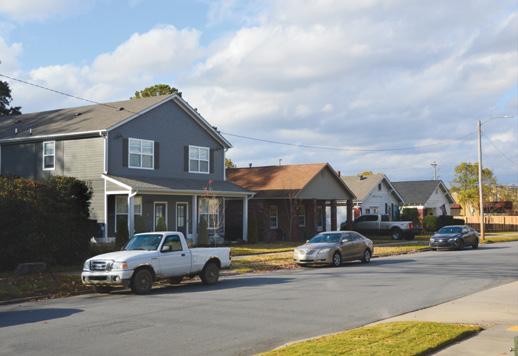
These new duplexes offer affordable housing in North Little Rock’s Argenta District.
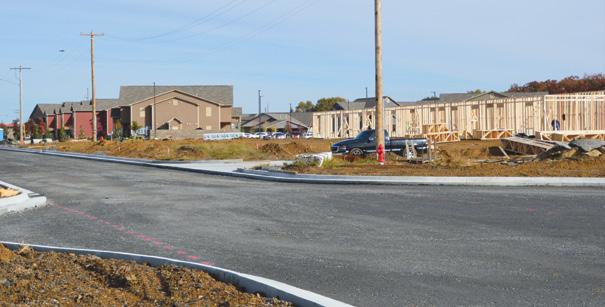
The 12 Hundred Place apartments were recently completed south of Dave Ward Drive in Conway, with more under construction.
Unincorporated Area Trends
One-quarter of regional population lies in unincorporated areas. This includes National Forest area, agricultural land, wetlands and lowdensity housing. It also includes a few low-density suburbs with names like East End, College Station, McAlmont, Hensley, Salem and Roland. Hot Springs Village in western Saline County (and extending outside the region into Garland County) has a population of 15,861 but it, too, is unincorporated, with no official government.
Unincorporated land accounts for about 88 percent of the region’s land area, but only about 26 percent of its people. Average density of unincorporated areas in the region is 74 persons per square mile, about one-twentieth the incorporated average of 1,352 persons per square mile. Of course, these are just averages, with major local variations.
Regional cities are growing, and regularly annex land and absorb formerly unincorporated areas. However, the pace of annexation has slowed in recent years, so trends are reasonably stable. Population in unincorporated areas is generally growing, albeit more slowly than urban population. Only in Pulaski
County has unincorporated population declined in the past decade, and that by just 1.7 percent (due in part to annexations). Each county’s share of unincorporated population varies, as the chart shows, between just 12 percent in Pulaski County to over 75 percent in Perry County.
Unincorporated areas are mostly white. In 2020 non-Hispanic whites accounted for about 82 percent of population, compared with 63 percent for the four-county area. Blacks accounted for about 7.6 percent of unincorporated population, but higher in Pulaski County—about 19 percent. Hispanics run about 5.4 percent in unincorporated areas, compared with the regional average of 7.1 percent.
Unincorporated Areas of Central Arkansas 2020
Unincorporated Area Incorporated Area
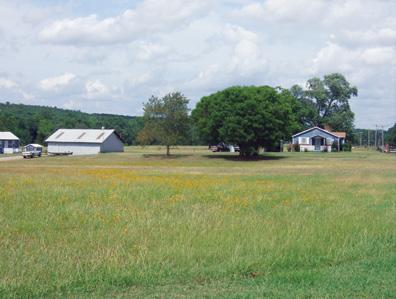
This kind of rural scene is common across a six-county region in which 88 percent of land area is unincorporated.
Racial and Ethnic Change
Like the rest of the country, the Little Rock MSA saw substantial change in its ethnic mix from 2010 to 2020. While by most measures a bit less diverse than the U.S. average, Central Arkansas is changing. While the regional core— mostly Little Rock and North Little Rock—is still the most diverse portion of the region, the greatest changes occurred in the region’s fastest-growing areas. Saline County saw the most change with both black and Hispanic populations doubling from 2010 to 2020. Blacks climbed from 4.6 percent of Saline County population in 2010 to 8.4 percent in 2020. No other county saw such a dramatic change in black population.
Nationally and locally, growth in population of two or more races was the biggest headline-grabber. Population in this group doubled nationally and tripled in the Little Rock region. By 2020 about 35,000 persons in the Little Rock MSA, or 4.7
MSA Population Change by Ethnicity 2010–2020
MSA Population Change by Ethnicity 2010-2020
Note: categories White, Black, Asian and Other represent non-Hispanic only.
percent of population, described themselves to the Census Bureau as belonging to two or more races. While demographic change is substantial, it is also possible that cultural and political factors may be influencing people when they self-
Little Rock MSA Share of Population by Race/Ethnicity 2020
Note: categories white, Black, Asian and other represent non-Hispanic only.
Whites account for about 63 percent of regional population, a higher share than the U.S. average.
Diversity is greater among younger populations, like these Hendrix College students.
describe their racial identity to the Census Bureau.
Overall, whites are about 63 percent of regional population, compared with a U.S. average of 58 percent. Blacks account for about 23 percent of local population, versus 12 percent nationally. The region has considerably fewer Hispanics (7.1 percent, versus 18.7 percent for the U.S.).
And while Asians account for 5.9 percent of U.S. population, they are 1.8 percent of the local area. However, most minority groups are growing and the regional ethnic composition will continue to change.
Density Trends
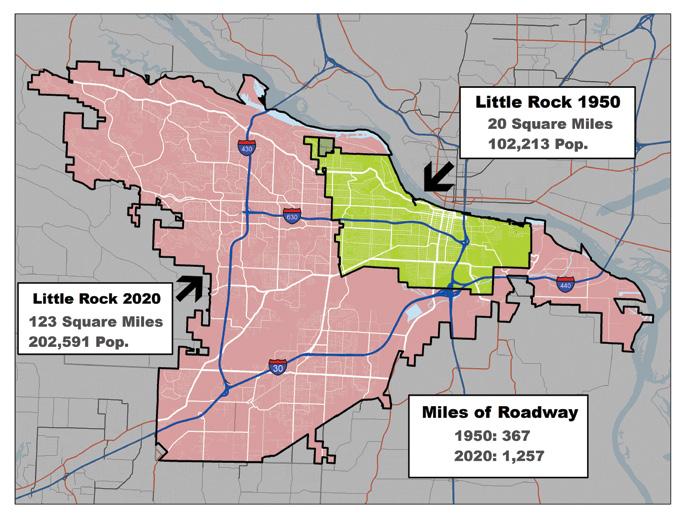
During the late 20th century U.S. urban density declined steadily. As recently as 1950, Little Rock had 102,000 people in 19.6 square miles of land area; by 2000 population had not quite doubled but the city occupied six times as much land area. Spreadout commercial shopping centers, more and larger single-family homes and acres of parking lots had changed the urban footprint as well as the manner of day-to-day life.
It might then surprise you that in 2020, for the second decade in a row, cities in Central Arkansas saw a slight increase in persons per square mile. Cities are annexing land more carefully, aware how snatching up extra land contributes to their fiscal burdens. Investment bankers are more careful about extending loans to developers and homebuyers after the 2006–2009 housing crash. Finally, multi-family housing now accounts for a greater share of housing growth. What this new tendency means for the future is hard to tell, but a long-term downward trend in urban density has become an upward nudge.
Central Arkansas Incorporated Area Population Density 1970-2020 Central Arkansas Incorporated Area Population Density* 1970–2020
*Persons/square mile
Housing Sector Rising
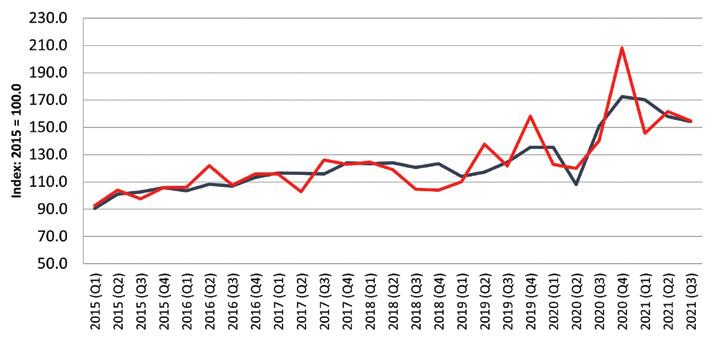
U.S. housing construction sagged briefly during the lockdown period in early 2020 and has been mostly running above average since. In the Little Rock MSA, housing has tracked with these national trends. Following a striking surge in the final quarter of 2020, new single-family construction has come down a bit but continues running faster than it did at mid-decade. The region saw 931 new single-family units permitted in its largest nine cities during the first six months of 2021, the highest level in several years. Permits were higher in most cities. Hot Springs Village saw its permits double over the first half of 2020, Little Rock permits rose 93 percent, and North Little Rock was up 65 percent. Most other cities saw increases in the 20 to 30 percent range, aside from decreases in Jacksonville and Sherwood.
Multi-family was up also, with 668 new units permitted. Little Rock led the pack with three new complexes. The largest was one of 249 units on Bass Pro Parkway in southwestern Little Rock, along with a senior care center and a small complex on Kanis Rd. Conway permitted 144 units on Covington Way, south of Dave Ward Drive, along with several duplex units. North Little Rock and Bryant also saw a few permits for duplexes.
The state of the housing market post-covid remains something of an enigma. The pandemic seems to have boosted housing demand, especially in single-family markets. Cost inflation problems have, however, also burdened the construction industry and this may be constraining the supply of new housing despite strong demand signals. It may take a few years yet for the post-pandemic housing market to clarify.
The demand for new single-family housing is strong, but faces challenges from rising construction costs.
Housing Unit Permits First Six Months of Each Year 2014–2021
Half Year (January - June) Housing Unit Permits 2018-2021
Half-Year (January–June) Housing Unit Permits 2018–2021
Note: regional totals shown above exclude Hot Springs Village, part of which extends into Garland County beyond Metroplan’s area.
Multi-family in the Big Picture
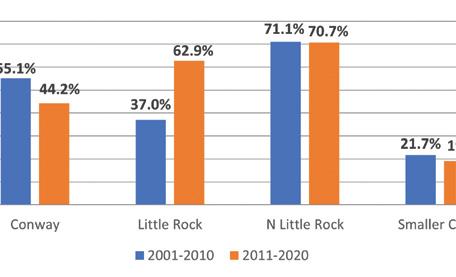
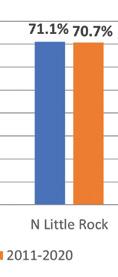
Multi-family housing has played a prominent role in population and housing growth in the region’s largest cities. As the chart below shows, both Little Rock and North Little Rock have built more multi-family than single-family housing over the past decade. In North Little Rock multi-family has dominated new construction for both decades, while in Little Rock it has risen from 37 percent of new units 2001–2010 to nearly 63 percent in the 2011–2020 decade. In Conway the multi-family ratio was 44 percent of new housing units from 2011 to 2020. As you can see, the region’s smaller cities had much less multi-family in their housing mix; just 19 percent from 2011 to 2020.
Multi-Family Units as Share of Total New Construction 2001–2020
Nearly 200 new units for senior living are under construction along Rahling Road in western Little Rock.
Demographic Outlook
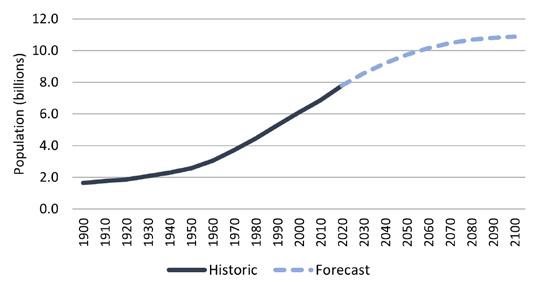
During the lifetimes of anyone reading this article today, global population explosion has been a constant. Global population doubled in the half-century from 1930 to 1980 and continued doing so in every fifty-year interval through 2020. Population growth has seemed predictable and inevitable. This is about to change.
The UN forecast shown here depicts a slowing of growth, possibly leading to global decline after 2100. Fertility has been dropping worldwide, from around 4.5 births per female in 1960 to about 2.4 today. Here in the United States fertility is below the replacement rate, at 1.84. Global population is down-shifting, and we will not be exempt.
World Population 1900–2020
With UN Forecast to 2100
Looking toward the future, three factors cause population change: births, deaths and migration. Birth rates show no likelihood of rising. Deaths, meanwhile, are up, influenced by rising opioid deaths and by the Covid-19 pandemic. The pandemic seems ready to wind down, yet its toll continues. Did you know that the state of Arkansas has already recorded more deaths from Covid-19 by October 2021 than in the prior year, with two months left to go? During 2020, the pandemic raised overall state mortality around 15 percent. Deaths will
probably begin dropping from 2022 onward, but with widespread vaccine refusal, Covid-19 has proven persistent. Year Months Covid Deaths
2020 Jan-Dec 4,027
2021 Jan-Oct 4,541
What about the demographic future? Historically, the prime source of population growth in Central Arkansas has been the arrival of newcomers, often young adults, from the state’s rural areas. This trend continues, but the state’s rural counties have seen net population decline over the past decade, meaning the pool of rural populations reaching young adulthood is diminishing.
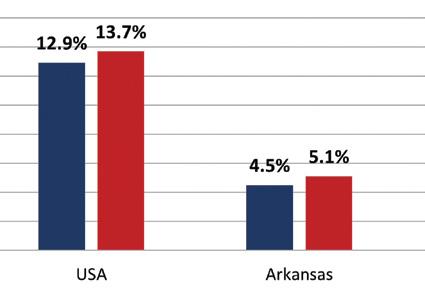
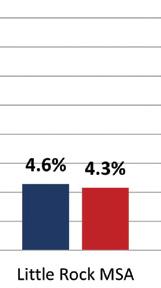
That leaves in-migration of foreign-born population, a major contributor of U.S. population growth. The local area gets little international migration, however. For the Little Rock region foreign-born population is less than one-third of the national average—just 4.3 percent, compared with 13.7 percent nationally. Meanwhile, local fertility rates resemble the national average and run below the replacement rate. Get used to slow growth. It is the new normal.
Source: U.S. Centers for Disease Control, Covid Data Tracker, consulted November 7, 2021.
Arkansas Deaths from Covid-19
Source: United Nations, Medium variant from 2019 forecast series.
Source: ACS 2010 and 2019 (1-yr ACS).
Foreign-born Population Share 2010 and 2019
New babies are precious and rare. Photo credit: Katie Skaggs.
Arkansas Covid-19 Mortality by Metro Area*
Sources: Arkansas Department of Health, U.S. Centers for Disease Control, Census 2020. Census 2020 population.
Metro and Rural Covid Vaccination Status (As of 11/15/2021)
The table above left shows mortality from Covid-19 as of midNovember, 2021. The Little Rock and Northwest Arkansas metro areas have seen the lowest death rates, while rural areas, West Memphis and the Pine Bluff metro have seen the highest. The Little Rock region’s death rate remains slightly below the U.S. average but has been catching up.
The table above right gives vaccination data, and provides most of the explanation behind mortality rates. Again, the Little Rock and Northwest Arkansas metro areas have the highest vaccination rates, while rates run quite low in rural counties and the West Memphis and Pine Bluff areas. Note that about 9 percent of state vaccinations lack county residence data, which explains why the state vaccination rate appears to run above even the Little Rock region, which otherwise has the state’s highest vaccination rate. In all cases vaccination rates are simply too low to fully curb the spread of Covid-19. Expect occasional infection surges in the future.
The table at right, for data geeks only, depicts detailed data on population density for incorporated and unincorporated areas by county. Perry County ranks least dense, not surprisingly, with just fourteen persons per square mile outside incorporated areas. Note that overall incorporated density is lower than the stats shown in the chart on page 11, which covers incorporated area inside the pre-2010 CARTS boundary to allow historical comparisons.
Source: U.S. Centers for Disease Control, compilations by Metroplan. AR portion only for multi-state MSAs. Population totals from Census 2020.
Note: state of AR vaccination rates run higher because county is unknown for about 9 percent of vaccinations
Little Rock MSA Population Density by County
PRESIDENT
Judge Doug Erwin Lonoke County
2021 Metroplan Board of Directors
VICE PRESIDENT
Judge Barry Hyde Pulaski County
SECRETARY/TREASURER
Mayor Allen E. Scott City of Bryant
Mayor Paul Mitchell City of Alexander
Mayor Bernadette Chamberlain City of Austin
Mayor Eddie Jones City of Bauxite
Mayor Tom Farmer City of Benton
Mayor Ken Kincade City of Cabot
Mayor David Graf City of Cammack Village
Mayor Bart Castleberry City of Conway
Mayor David “Butch” House City of England
Mayor Sammy Hartwick City of Greenbrier
Mayor Sam Higdon City of Guy
Mayor Roy H. Carman City of Haskell
Mr. Keith Keck Hot Springs Village
Mayor Bob Johnson City of Jacksonville
Mayor Frank Scott, Jr. City of Little Rock
Mayor Trae Reed, III City of Lonoke
Mayor Caleb Norris City of Maumelle
Mayor Randy Holland City of Mayflower
Mayor Jonathon Hawkins City of Mount Vernon
Mayor Terry Hartwick City of North Little Rock
Mayor Mike Kemp City of Shannon Hills
Mayor Joe Wise City of Sheridan
Mayor Virginia Young City of Sherwood
Mayor Michael Nash City of Traskwood
Mayor Charles Gastineau City of Ward
Mayor Terry Don Robinson City of Wooster
Mayor Allan Loring City of Wrightsville
Mayor Preston Scroggin City of Vilonia
Judge Jim Baker Faulkner County
Judge Randy Pruitt Grant County
Judge Jeff Arey Saline County
Mr. Brad McCaleb Arkansas Department of Transportation
Mr. Charles Frazier Rock Region METRO
Mr. Bryan Day Little Rock Port Authority
Mr. Bryan Malinowski Clinton National Airport
Metroplan’s Demographic Review and Outlook is an annual chronicle providing demographic and housing data and insight for the Little Rock-North Little Rock-Conway MSA.
Prepared by: Jonathan Lupton, research, writing and editing Lynn Bell, graphics, layout, and illustrations
Photographs by Lynn Bell and Jonathan Lupton except where noted
This report was funded in part through grant(s) from the Federal Highway Administration and Federal Transit Administration, U.S. Department of Transportation. The views and opinions of the authors expressed herein do not necessarily state or reflect those of the U.S. Department of Transportation.
Notice of Nondiscrimination
Metroplan complies with all civil rights provisions of federal statutes and related authorities that prohibit discrimination in programs and activities receiving federal financial assistance. Therefore, Metroplan does not discriminate on the basis of race, sex, color, age, national origin, religion, disability, or income status, in admission or access to and treatment in Metroplan’s programs and activities, as well as Metroplan’s hiring or employment practices. Complaints of alleged discrimination and inquiries regarding Metroplan’s nondiscrimination policies may be directed to La’Kesha Stewart, Title VI/ADA/504 Coordinator, 501 West Markham Street, Suite B, Little Rock, AR 72201, (501) 372-3300, or the following e-mail address: lstewart@metroplan.org. (Hearing and speech impaired may dial 711.)
This notice is available upon request from the Title VI/ADA/504 Coordinator in large print, audiotape or braille.
The Metroplan staff family suffered a painful loss with the death of Mariah Ashley Binns Skaggs on August 31, 2021 from Covid-19. She contracted the disease while pregnant and is survived by her infant daughter Bonnie, shown in the photo on page 14 with grandfather (and Metroplan staffer) Allen Skaggs. Mariah is also survived by her husband Josh and two sons, ages 6 and 9. Metroplan dedicates this issue of the Metro Trends Demographic Review and Outlook to the memory of Mariah and other Arkansas residents and their families who have suffered losses from Covid-19. Photo credit: Katie Skaggs.