Appendix B
September 19, 2024
Mr. Casey Covington Executive
Director
Metroplan
501 W. Markham St., Ste. B Little Rock, Arkansas 77201
Dear Mr. Covington:
The Metroplan Quality Assurance Project Plan (QAPP) for the GHG Inventory and Options Identification Phase of the CPRG Program, Q-Trak No. 24-434. I am pleased to inform you that the QAPP has been reviewed and approved by Brenton Gildner, R6 Air QA Officer, Region 6, EPA. The QAPP has an expiration date of September 5, 2025.
Please send all QAPP’s sixty days prior to the expiration of the recipient's approved QAPP, if there are any significant changes to operating procedures or regulations, please submit earlier than sixty-days. The recipient shall submit to the Project Officer a revised QAPP or certification that the QAPP is current and include a signed copy of the new approval page(s) for the QAPP.
Please find attached your digitally signed QAPP signature page(s), should you have any questions, please call me at (214) 665-8453.
Sincerely,
TERRIE WRIGHT
Digitally signed by TERRIE WRIGHT
Date: 2024.09.19 12:51:49 -05'00'
Terrie Wright Project Officer Air Grants Section
ENCLOSURES
1. GHG Inventory and Options Identification Phase of the CPRG Program
cc: Grant File
July31,2024
Digitally signed by TERRIE WRIGHT
Date: 2024.09.05 08:50:44 -05'00'
Digitally signed by MICHAEL GILDNER
Date: 2024.09.05 08:30:03 -05'00'
MICHAEL GILDNER
TERRIE WRIGHT
QAPP Revision History
Revision No. Description
QAPP Short Title: METROPLAN QAPP for CPRG
Section: Title / Approval Page
Revision No: 1 Date: 07/26/2024
Page: 2 of 44
Author Date
0 Original Version Linda K. Smith 6/24/2024
1 Corrected Version Bernadette Rhodes 7/26/2024
Section:
QAPP Short Title: METROPLAN QAPP for CPRG
Section: Table of Contents
Revision No: 1 Date: 07/16/2024
Page: 5 of 44
Abbreviations
ADEE Arkansas Department of Energy and Environment
ADT average daily traffic
AFOLU Agriculture, Forestry, and Other Land Use
AR Arkansas
CAA Clean Air Act
CCAP Comprehensive Climate Action Plan
CFR Code of Federal Regulations
CH4 methane
CO2 carbon dioxide
CO2e carbon dioxide equivalent
CPRG Climate Pollution Reduction Grant
DEQ Division of Environmental Quality
EEI Energy & Environment Innovation
EIE Environmental Insights Explorer
EPA U.S. Environmental Protection Agency
GHG Greenhouse Gas
GHGRP Greenhouse Gas Reporting Program (40 CFR Part 98)
GWP Global Warming Potential
FLIGHT Facility Level Information on GHG Tool
ICLEA International Council for Local Environmental Initiatives
ICR Information Collection Request
IRA Inflation Reduction Act
LEARN Land Emissions and Removals Navigator
LULUCF Land Use, Land-Use Change and Forestry
METROPLAN Metroplan
N2O nitrous oxide
NEI National Emissions Inventory
OAQ ADEE Office of Air Quality
OAR EPA Office of Air and Radiation
OWQ ADEE Office of Water Quality
PCAP Priority Climate Action Plan
PM Project Manager
PO EPA Project Officer for Grant
POP Period of Performance
POR EPA Project Officer’s Representative
PWP Project Work Plan
QA Quality Assurance
QAM Quality Assurance Manager
QAMD Quality Assurance Manager Delegate
QAPP Quality Assurance Project Plan
QC Quality Control
QCC Quality Control Coordinator
SIT EPA’s State Inventory Tool (SIT), 1
SLOPE State and Local Planning for Energy
TL Task Leader
US United States
1 https://www.epa.gov/statelocalenergy/state-inventory-and-projection-tool
QAPP Short Title: METROPLAN QAPP for CPRG
Section: Problem Definition
Revision No: 1 Date: 07/16/2024
Page: 6 of 44
1.3. Distribution List
This section presents the primary staff who will be working on the project. These staff will be identifying existing 2 data resources for evaluation and potential use under the project or serving in project-specific roles for implementing the Quality Assurance Project Plan (QAPP). The listing in Table 1.1 includes staff responsible for implementing independent internal quality management steps and staff serving in external oversight roles.
This QAPP and, as applicable, all major deliverables relying on existing data will be distributed to the staff presented in Table 1.1. Additionally, this QAPP will be provided to any unlisted staff who are assigned to perform work under this project. A secured copy of this QAPP will be maintained in the project files on Metroplan or Metroplan contractor project servers.
Table 1.1 QAPP Distribution List
Name Organization Role
Terrie Wright wright.terrie@epa.gov 214-665-8453
Michael Gildner gildner.michael@epa.gov 214-665-7376
Stacie Wassell stacie.wassell@arkansas.gov 501-682-0744
Erika Droke erika.droke@arkansas.gov 501-682-0542
Casey Covington ccovington@metroplan.org 501-372-3300
Bernadette Rhodes brhodes@metroplan.org 501-372-3300
Linda K. Smith Lksmith72227@gmail.com 501-680-1573
Jonathan Lupton jlupton@metroplan.org 501-372-3300
Brittany Nichols think.circl@gmail.com 479-439-2277
Jeff Runder jrunder@metroplan.org 501-372-3300
US EPA, Region 6
US EPA, Region 6
ADEE
ADEE
Metroplan
Metroplan
Metroplan, Contractor
Metroplan
Metroplan, Contractor
Metroplan
EPA Project Officer (PO) or PO Representative (POR)
EPA Quality Assurance Manager (QAM) or QAM Delegate (QAMD)
ADEE Interim Quality Assurance Manager (QAM), OWQ Associate Director
ADEE Project Manager, OAQ Policy Manager
Grantee Sr. Approver, Executive Director
Grantee Project Manager (PM)
Grantee Task 1-7 Leader (TL), Technical Advisor (TA)
Grantee QAM, Senior Planner for Publications
Grantee Technical Specialist
Grantee Technical Specialist, Senior Planner for Technical Analysis
2 The term “existing data” is defined by the EPA’s Environmental Information Quality Policy (CIO 2105.3) as “… data that have been collected, derived, stored, or reported in the past or by other parties (for a different purpose and/or using different methods and quality criteria). Sometimes referred to as data from other sources.” The term “secondary data” may also be used to describe “existing data” in historical EPA quality-related documents.
Short Title: METROPLAN QAPP for CPRG
Section: Problem Definition
Revision No: 1 Date: 07/16/2024
Page: 7 of 44
1.4. Project / Task Organization
The primary personnel responsible for implementation of this project are the Metroplan Project Manager (PM), Quality Assurance Manager (QAM), and Task Leader (TL). Their duties are outlined briefly in this section. The project QAM is independent of the unit generating the data.
Bernadette Rhodes is the Metroplan PM and will provide senior-level oversight. Bernadette has 16 years’ experience in the non-profit and government sectors. She earned a Master of Public Administration from UA Little Rock in 2019 and membership in the American Institute of Certified Planners in 2023. Bernadette manages the CPRG planning process for Metroplan, which is the Central Arkansas sub awardee of CPRG planning grant through the Arkansas Department of Energy and Environment.
The PM is responsible for Metroplan’s technical and financial performance as well as maintaining communications with the EPA to ensure mutual understanding of grant requirements, EPA expectations, and conformity with EPA quality procedures; managing oversight and conduct of project activities including allocation of resources to specific tasks; ensuring that quality procedures are incorporated into all aspects of the project; developing, conducting, and/or overseeing QA plans as necessary; ensuring that any corrective actions are implemented; operating project activities within the documented and approved QAPP; and ensuring all products delivered to the EPA are of specified type, quantity, and quality.
The Metroplan PM will assign a TL for all technical tasks with instructions to complete a baseline emissions inventory for the sector(s) under the task and to develop options for potential emissions reductions with estimated reductions per option.
Linda K. Smith will serve as the TL for assigned technical tasks. Linda earned a BS in Chemical Engineering in 1984 from the University of Arkansas and has over 40 years’ experience in technical and engineering experience in the petroleum and sustainability sectors. She has 15 years direct experience with GHG and sustainability projects with the US Green Building Council (LEED buildings) and as the Director of Sustainability for a regional water utility where she prepared GHG reports and developed a Net Zero 2050 Climate Action Plan. She has jointly presented at national water conferences with the EPA staff for case studies using the EPA Climate Resilience Evaluation and Awareness Tool (CREAT). Resilient tool.
Project-level management system. Tasks are expected to proceed concurrently, in parallel. The PM will maintain close communications with the TL and ensure any difficulties encountered or proposed changes at the task level are reviewed for implications on other similar or related tasks. The PM is also responsible for communicating progress or difficulties encountered (across all tasks) to the EPA PO or POR, who provides the EPA’s primary oversight function for this project at EPA OAR/ Region 6 Office and is responsible for review and approval of this QAPP and any future revisions. The PM (with support from the TL and assigned Metroplan technical staff) will be responsible for consulting with the EPA PO or POR, on planning, scheduling, and implementing the QA/QC for all project deliverables and obtaining required EPA approvals.
The Metroplan QAM, Jonathan Lupton, is responsible for overseeing the quality system, monitoring and facilitating QA activities on tasks, and generally helping the Metroplan contracted PM and TL understand and comply with EPA QA requirements. He will not be involved in data collection or analyses, which will be done by the Metroplan’s contracted consultant and other Metroplan staff.
Jonathan graduated from Kalamazoo College with a bachelor’s degree in history in 1982. In 1987 he earned a master’s degree in geography from the University of Chicago, and in 1990 a master’s degree in community and regional planning from the University of Texas at Austin. He has worked at Metroplan
QAPP Short Title: METROPLAN QAPP for CPRG
Section: Problem Definition
Revision No: 1 Date: 07/16/2024
Page: 8 of 44
since 1993, with an emphasis on demographic and economic forecasting, data analysis, research, and writing. In 1998 he became a member of the American Institute of Certified Planners.
QC functions will be carried out by other technical staff and will be carefully monitored by the PM, who will work with the QAM to oversee this plan and implement quality improvements. Metroplan will also consult with ADEE QAM and Policy and Planning for guidance. For work done under this project, technical staff will include persons with expertise in the region’s residential, commercial, and industrial activities. Technical staff may also include persons with expertise in air pollution engineering, technical reviewers, database specialists, quality auditors, and technical editors. The PM will ensure that technical staff do not review work in a QA capacity for which they were a primary or contributing author.
Brittany Nichols, contracted with Metroplan, is an experienced professional in project management and strategic operations, specializing in emissions inventories, data visualization, and program design in the public sector. Brittany holds a bachelor's degree from Arkansas Tech University in Industrial and Organizational Psychology and has been involved in national cohorts such as ICLEI's Race to Zero, DOE's Clean Energy to Communities, and NOAA's 2023 Heat Watch Campaign. A member of the Southeast Sustainability Directors Network, she currently works at the City of Little Rock, and contracted with Metroplan in 2023 to provide technical deliverables associated with the Climate Pollution Reduction Grant.
Jeff Runder, a Senior Planner for Technical Analysis with Metroplan, will serve as a technical staff member for data analysis and mapping. Jeff’s work with Metroplan has focused on transportation planning, planning assistance to member jurisdictions, Geographic Information Systems, and Travel Demand Modeling. A member of the American Institute of Certified Planners, he received a Bachelors in Geography from the University of Tennessee in 1993 and a MS in Geography from the University of Memphis with an emphasis in Geographic Information Systems, Cartography, and Remote Sensing in 1996.
QAPP Short Title:METROPLANQAPP for CPRG
Section:Problem Definition
Revision No:1 Date: 07/16/2024
Page: 9 of 44
Exhibit 1 presents the organizational chart for the project.
1. Project Organization 3
US EPARegion 6
Project Officer or Project Officer’s Representative
TerrieWright
Metroplan
Grantee Sr. Approver
US EPA Quality Assurance Officer
Michael Gildner
ADEE
OAQ Policy Manager
Erika Droke
Casey Covington Metroplan
Metroplan
Project Manager
Bernadette Rhodes
Legend
Line of reporting
Communication
1.5.Problem Definition / Background
Jonathan Lupton
MetroplanContractor
Task 1-5 Leader
Linda K. Smith
Metroplan Contractor
Technical Staff/QA/QC
Brittany Nichols
Jeff Runder
Originally formed as the Metropolitan Area Planning Commission of Pulaski County in 1955, Metroplanhas served as the area’s federally designated Metropolitan Planning Organization (MPO) since 1972. Its function as an MPO is to work with local governments, the state department of transportation, and local transit providers to determine transportation needs and funding priorities for federal transportation investments. Metroplanalso provides general planning, mapping, and technical assistance to local governments.
Under this project, Metroplanwillidentify, evaluate, and utilize data resources 4 to develop a regionalinventory of the major sources of greenhouse gas (GHG) emissions within Pulaski, Lonoke, Saline, Faulkner, Grant, and Perry counties, Arkansas, anduse that inventory data to develop a climate action plan. Task leaders and specialists will compile all data within the International Council for Local Environmental Initiatives’ (ICLEI) ClearPath GHG Reporting Tool (ClearPath). ICLEI’s ClearPath tool has two tracks: the Local Government Operations (LGO) track is specific to municipal and county
3 Under CIO 2105-S-02.0, section 3, the organization chart must also identify any contractor relationships relevant to environmental information operations.
4 EPA, Environmental Information Quality Policy, CIO 2105.3, 03/07/2023(p. 8) provides commonexamples of environmental information used to support the EPA’s mission at https://www.epa.gov/system/files/documents/2023-04/environmental_information_quality_policy.pdf.
Exhibit
QAPP Short Title: METROPLAN QAPP for CPRG
Section: Problem Definition
Revision No: 1 Date: 07/16/2024
Page: 10 of 44
governments and evaluating GHG emissions by their departments, and the Community-wide (CW) track, which could also include local government information. The two modules are companion tools, and any totals estimated in the LGO track can be included in the CW track. For example, a county could use the CW track and incorporate data from the LGO track completed by the cities within the county. Grantees using both tracks should conduct a quality check to ensure that emissions do not get double-counted. This template is based on the CW track and USCP.
This QAPP focuses on the handling of environmental information under sector-specific tasks by technical staff charged with completing the following subtasks in a future planning project implemented in accordance with this QAPP:
1. Develop a comprehensive GHG inventory for the largest sources within each sector,
2. Develop options for reducing emissions within each sector,
3. Develop estimates or ranges of estimates for reductions achievable under each option,
4. Present these analyses and options in technical reports consistent with the deliverables required under the CPRG planning grants.
The GHG inventory may utilize:
1. National-level data derived from EPA’s GHG Reporting Program (GHGRP) Inventory Data Explorer 5 that includes GHG emissions and sink emissions data for all sectors during the years 1990 through 2021.
2. State-level data derived from
a. EPA’s GHG Inventory Data Explorer that includes GHG emissions and sink emissions data for all sectors during the years 1990 through 2021; and
b. EPA State Inventory Tool (SIT) for Arkansas
c. DOE’s State and Local Planning for Energy (SLOPE) Data Viewer
3. Community-level data derived from
a. US Community Protocol’s Land Emissions and Removals Navigator (LEARN) Tool 6 in conjunction with International Council for Local Environmental Initiatives’ (ICLEI) ClearPath GHG Reporting Tool for Land Use, Land-Use Change and Forestry (LULUCF) sink emissions data
b. Facility Level Information on GHG Tool (FLIGHT)
c. Source-point data from vendors
4. County-level data derived from
a. EPA’s National Emission Inventory (NEI) Data Retrieval Tool 7 for the transportation, industrial, and agricultural sectors during the years 2017 and 2020. Excludes LULUCF sink emissions data
Data for the industrial sector includes only emissions derived from industrial equipment
Data for the agricultural sector includes only emissions derived from agricultural equipment
5 https://cfpub.epa.gov/ghgdata/inventoryexplorer/#allsectors/allsectors/allgas/econsect/all
6 https://icleiusa.org/LEARN/
7 https://awsedap.epa.gov/public/single/?appid=20230c40-026d-494e-903f-3f112761a208&sheet=5d3fdda7-14bc-4284-a9bbcfd856b9348d&opt=ctxmenu,currsel
QAPP Short Title: METROPLAN QAPP for CPRG
Section: Problem Definition
Revision No: 1 Date: 07/16/2024
Page: 11 of 44
b. DOE’s State and Local Planning for Energy (SLOPE) Data Viewer
c. Arkansas Department of Agriculture Annual Reports
1. Distribution of Fertilizer Sales
2. Lime Tonnage
3. Forestry Division
a. Prescribed Burns and Wildfires
b. County Forest Profiles and Fact Sheets
d. Google’s Environmental Insight Explorer (EIE) Tool 8 for the transportation sector during the years 2018 through 2023 as a supplemental tool to federal and state data; and
Includes commercial and residential building data for six counties (Pulaski, Saline, Faulkner, Lonoke, Grant, and Perry) in Metroplan area
Excludes LULUCF sink emissions data
5. City-level data derived from
a. DOE’s State and Local Planning for Energy (SLOPE) Data Viewer
b. Google’s Environmental Insight Explorer (EIE) Tool for the transportation sector during the years 2018 through 2023 as a supplemental tool to federal and state data; and
c. The City of Little Rock’s emissions inventory for all sectors except for agriculture during the years 2018-2022
Any independent regional estimates will be compared to corresponding federal, state, and/or local estimates for validation, as available. Significant differences between federal, state, or local estimates will be evaluated and discussed in the inventory report with the underlying data and methodology used for the independent regional estimates. The regional inventory will include the following source categories and gases:
ClearPath Source Categories
1. Transportation
2. Electricity Consumption
3. Stationary Combustion
4. Agriculture, Forestry, and other Land Use (AFOLU)
5. Solid Waste
6. Water and Wastewater
7. Other
8 https://insights.sustainability.google/
Greenhouse Gases (across all sectors)
carbon dioxide (CO2), methane (CH4), nitrous oxide (N2O), fluorinated gases (F-gases) including hydrofluorocarbons (HFCs), perfluorocarbons (PFCs), and sulfur hexafluoride (SF6)
QAPP Short Title: METROPLAN QAPP for CPRG
Section: Problem Definition
Revision No: 1 Date: 07/16/2024
Page: 12 of 44
1.5.1. Rationale for Selection of Sectors
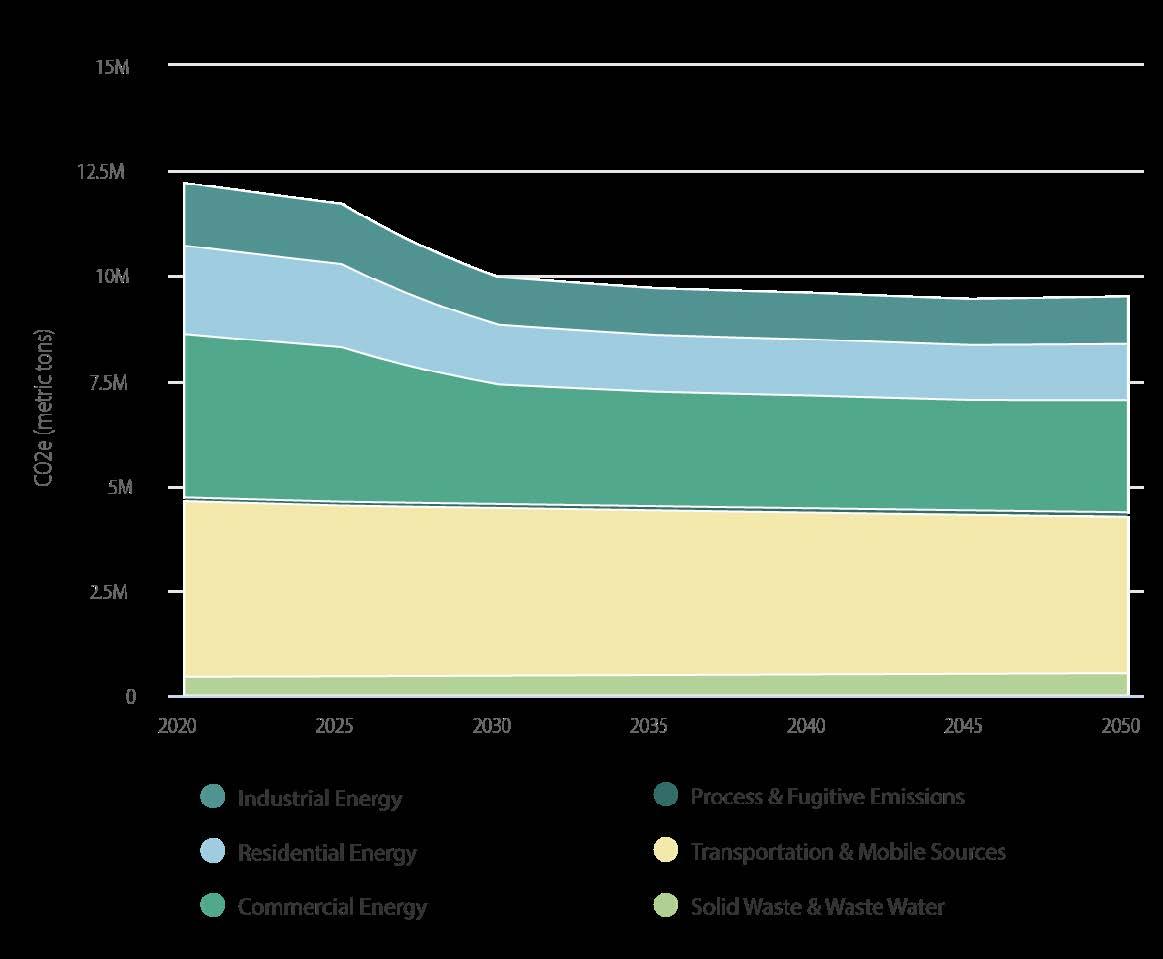
For each sector included in the regional inventory, Table 1.2 briefly describes why the sector was included in the inventory and the relative significance of the sector in terms of the magnitude of air emissions from existing inventories, the associated geographic distribution of the sources, and recent trends in readily available activity data for the source category.
Table
1.2 Rationale for Sector Selection
Sectors Included in Inventory
Rationale for Including in GHG Inventory
Transportation Transportation activities were the largest source (27 percent) of total US GHG emissions in 2020.
Transportation activities were the second largest source (24 percent) of total Arkansas GHG emissions in 2020.
GHG emissions from transportation primarily come from burning fossil fuel for cars, trucks, ships, trains, and planes. Over 94 percent of the fuel used for transportation is petroleum based, which includes primarily gasoline and diesel.
Transportation activities occur across all regions.
Electric Power Generation
The electric power sector accounted for 25 percent of total US GHG emissions in 2020.
Electric power activities were the largest source (28 percent) of total Arkansas GHG emissions in 2020.
Electric power includes emissions from electricity production used by other end sources (i.e. industry, commercial, and residential) and comes from burning fossil fuels, mostly coal and natural gas.
Power generation and/or consumption occurs across all regions.
Industry
The industrial sector accounted for 24 percent of US GHG emissions in 2020. Since 1990, industrial sector emissions have declined by 11 percent.
Industrial activities were the fourth largest source (16 percent) of total Arkansas GHG emissions in 2020.
GHG emissions from industry primarily come from the burning of fossil fuels, Scope 2 emissions associated with the purchase of electricity, as well as GHG emissions from certain chemical processes involved in the production of goods from raw materials. Any point source of emissions la rge enough to be included in EPA’s FLIGHT database, which is not already included in another sector, should also be included.
Commercial The commercial sector accounted for about 7 percent of US GHG emissions in 2020. Emissions from the commercial sector has increased since 1990.
In 2020, the commercial sector accounted for 7 percent of total Arkansas GHG emissions. Emissions in Arkansas from the commercial sector have increased since 1990.
Sectors Included in Inventory
QAPP Short Title: METROPLAN QAPP for CPRG
Section: Problem Definition
Revision No: 1 Date: 07/16/2024
Page: 13 of 44
Table 1.2 Rationale for Sector Selection
Rationale for Including in GHG Inventory
GHG emissions from the commercial sector include fossil fuels burned for heat and Scope 2 emissions associated with the purchase of electricity.
Residential The residential sector accounted for about 6 percent of US GHG emissions in 2020. Emissions from the residential sector have increased since 1990.
In 2020, the residential sector accounted for 3 percent of total Arkansas GHG emissions, respectively.
GHG emissions from the residential sector include fossil fuels burned for heat and Scope 2 emissions associated with the purchase of electricity.
Agriculture Agriculture accounted for about 11 percent of US. GHG emissions in 2020, and agricultural soil management was the largest source of N2O emissions.
Agricultural activities were 21 percent of total Arkansas GHG emissions in 2020.
GHG emissions from agriculture come from livestock such as cows, agricultural soils, and rice production.
Land Use, LandUse Change and Forestry (LULUCF)
Water and Wastewater
This sector includes increased carbon from activities such as converting forests to agricultural use and practices that decrease CO2 from the atmosphere and store it in long-term carbon sinks like forests. In 2020, the net CO2 removed from the atmosphere by natural and working lands was 12.5 percent of total US GHG emissions. Between 1990 and 2020, total carbon sequestration in this sector decreased by 14 percent, primarily due to a decrease in the rate of net carbon accumulation in forests, as well as an increase in CO2 emissions from urbanization.
A study published in 2017 in the Proceedings of the National Academy of Sciences estimated that nature-based solutions can account for up to 37 percent of the carbon sequestration needed to keep average global temperatures from increasing 2 degrees Celsius by 2030 9 and up to 20 percent of the carbon sequestration needed to keep average global temperatures from increasing 2 degrees Celsius by 2050 10
This sector includes landfills, composting, and anaerobic digestion. Landfills were the third largest source of anthropogenic methane emissions in 2021, and landfills accounted for 1.9 percent of total U.S. greenhouse gas emissions.
Wastewater treatment, both domestic and industrial, was the third largest anthropogenic source of N2O emissions in 2021, accounting for 5.2 percent of national N2O emissions and 0.3 percent of total U.S. greenhouse gas emissions. Emissions from wastewater treatment increased by 6.1 MMT CO2e (41.6 percent) since 1990 as a result of growing U.S. population and protein consumption.
9 https://www.ipbes.net/global-assessment
10 https://pubmed.ncbi.nlm.nih.gov/29078344/
Short Title: METROPLAN QAPP for CPRG
Section: Problem Definition
Revision No: 1 Date: 07/16/2024
Page: 14 of 44
1.5.2. Decisions to be Made
Existing EPA datasets of GHG emissions by sector and the state of Arkansas SIT tool provide many default values to facilitate developing regional estimates that are consistent with the National Inventory of GHG Emissions 11. ICLEI’s ClearPath tool covers categories of GHG emissions by source category (e.g., transportation, solid waste, etc.). ClearPath provides many default values to facilitate developing local estimates using methods consistent with the USCP for CW GHG Emissions. The TL will be charged with three primary decisions under each task of this project.
1. Determine (for each major activity) if the ClearPath estimate, a different federal estimate or tool, or a non-federal estimate should be used for the regional baseline estimate.
2. Determine the best options for reducing emissions of air pollution and achieving the following objectives 12 under the Inflation Reduction Act (IRA):
a. Deliver cleaner air by reducing harmful air pollution in places where people live, work, play, and go to school.
b. Reduce climate pollution, create good jobs, and lower energy costs for families.
c. Accelerate work addressing environmental injustice and empowering community driven solutions in overburdened neighborhoods.
3. Develop an estimate (or range) of reductions that could be achieved under each option.
1.5.3. Actions to be Taken, Action Limits, and Expected Outcomes
Initially, local estimates will be derived using ClearPath for each source category. Subsequently, Metroplan may elect to supplement estimates derived using ClearPath with estimates for each source category from existing local inventories, existing local activity data, or from other EPA or state resources. Calculated estimates derived from local activity data will be compared to federal datasets and/or downscaled state or county estimates for validation. The rationale for including any emissions estimates that show significant discrepancies from state or federal estimates will be documented in the Metroplan’s GHG inventory report along with the underlying data and calculation methodology.
When identifying the best options for reducing air pollution, the TL will consider the activities affecting the largest numbers of people, business establishments, recreation areas, and schools. Options will include potential reductions in task-level activities impacting nonattainment areas and impacting residential, commercial, and school districts in close proximity to the largest sources of air pollution.
1.5.4.
Reason for Project
The baseline GHG inventory and options analyses developed under this regional community project will be utilized by Metroplan for planning purposes to support Metroplan’s development of the following CPRG planning deliverables:
Metroplan’s Priority Climate Action Plan (PCAP), was submitted on December 1, 2023. This plan includes near-term, implementation-ready, priority GHG reduction measures and is a prerequisite for any implementation grant.
Metroplan’s Comprehensive Climate Action Plan (CCAP) is due on February 28, 2025. This plan will review all sectors that are significant GHG sources or sinks and include both near- and long-term GHG emission reduction goals consistent with state policy and strategies.
11 https://www.epa.gov/ghgemissions/inventory-us-greenhouse-gas-emissions-and-sinks-1990-2021
12 CPRG Program Guidance, page 4. Available at https://www.epa.gov/inflation-reduction-act/climate-pollutionreductiongrants#CPRGProgramGuidance.
QAPP Short Title: METROPLAN QAPP for CPRG
Section: Problem Definition
Revision No: 1 Date: 07/16/2024
Page: 15 of 44
Metroplan’s Status Report on progress towards statewide reduction goals, which is due in 2027. This progress report will include updated analyses, plans, and next steps for key metrics.
This QAPP describes in detail the necessary QA and QC requirements and technical activities that will be implemented to ensure the baseline GHG inventory, and the sector-specific emissions reduction options are reliable for the PCAP and CCAP.
1.5.5.
Relevant Clean Air Act Mandates and Authorizations
The inventory produced under this project will support grant applications authorized under 42 U.S.C.A. § 7437 for Greenhouse Gas Air Pollution Plans and Implementation Grants. The inventory will be used to evaluate opportunities for reducing GHG emissions from all major-emitting sources including both mobile source categories and stationary source categories. This project will include the fundamental research necessary to evaluate and plan new programs (and amendments to existing Clean Air Act [CAA] programs) for reducing emissions from fossil fuel combustion activities. Many activities in the GHG inventory (and subsequent emissions reductions options analyses) include major sources of criteria and air pollutants. Accordingly, the purpose of this project (to evaluate and plan for reductions in GHG emissions, including reductions from usage or production of fossil fuels) is also consistent with the following statutory mandates and authorizations under Clean Air Act Title I:
§
7403.
Research, investigation, training, and other activities
(a)Research and development program for prevention and control of air pollution
The Administrator shall establish a national research and development program for the prevention and control of air pollution
(1)conduct, and promote the coordination and acceleration of, research, investigations … and studies related to the causes … extent, prevention, and control of air pollution;
(2)encourage, cooperate with, and render technical services and provide financial assistance to air pollution control agencies and other appropriate public or private agencies, institutions, and organizations, and individuals in the conduct of such activities ….
(b)Authorized activities of Administrator in establishing research and development program
In carrying out the provisions of [paragraph (a)] the Administrator is authorized to–
(1)collect and make available, through publications and other appropriate means, the results of and other information, including appropriate recommendations by him in connection therewith, pertaining to such research and other activities….
(2) make grants to air pollution control agencies … for purposes … in subsection (a)(1) ….
§ 7404. Research related to fuels and vehicles
(a) Research programs; grants; ….
The Administrator shall give special emphasis to research and development into new and improved methods, having industry-wide application, for the prevention and control of air pollution and control of air pollution resulting from the combustion of fuels… he shall–
(1)conduct and accelerate research programs directed toward development of improved, cost-effective techniques for–
(A) control of combustion byproducts of fuels, ….
(B) improving efficiency of fuels combustion so as to decrease atmospheric emissions ….
§ 7405. Grants for support of air pollution planning and control programs
(a)Amounts; limitations; assurances of plan development capability.
QAPP Short Title: METROPLAN QAPP for CPRG
Section: Problem Definition
Revision No: 1 Date: 07/16/2024
Page: 16 of 44
(1)(A) The Administrator may make grants to air pollution control agencies … in an amount up to three-fifths of the cost of implementing programs for the prevention and control of air pollution …. For the purpose of this section, “implementing” means any activity related to the planning, developing, establishing, carrying-out, improving, or maintaining of such programs…. (C)With respect to any air quality control region or portion thereof for which there is an applicable implementation plan under section 7410 … grants under subparagraph (A) may be made only to air pollution control agencies which have substantial responsibilities for carrying out such applicable implementation plan.
1.5.6. Information Provided by the EPA under § 7403(b)(1)
Under authority of CAA § 7403(b)(1) the EPA has provided the following resources to regions to ensure reliable air emissions inventories are produced to support plans for reducing emissions:
Agency-wide Quality Program Documents
Quality Assurance-specific Directives
o CIO 2105.3 – Environmental Information Quality Policy, April 10, 2023
o CIO 2105-P-01.3 – Environmental Information Quality Procedure, March 7, 2023
o CIO 2105-S-02.0 – EPA’s Environmental Information QA Project Plan Standard
o EPA Regional Sites for Quality Management Plans and Guidance:
Region 1
Region 2
Region 3
Region 4
Region 5
Region 6
Region 7
Region 8
Region 9
Region 10
QA Guidance
o Latest QA guidance published on the following website: https://www.epa.gov/quality/agency-wide-quality-program-documents
Metroplan will utilize these resources, as applicable, to ensure evaluation of existing data and utilization of those data are consistent with the EPA’s relevant directives and guidance.
1.6.
Project / Task Description
An example schedule of deliverables for the technical tasks (Tasks 1-7) for GHG inventory QAPPs is presented in Tables 2.1 through 2.7. The work to be performed under this project involves preparing a regional GHG emissions inventory for Metroplan. The organization of the work is based on the use of the EPA’s GHG Inventory Data Explorer, EPA’s NEI Data Retrieval Tool, Arkansas ADEE’s SLEIS, 13 US Community Protocol’s LEARN Tool, Google’s EIE, and the City of Little Rock’s Emissions Inventory under the following sector-specific tasks:
Task 1: Regional inventory of transportation sector GHG emissions.
13 Recognizing the possibility of duplication between federal data and SLEIS, priority will be given to federal data and SLEIS used as a supplement.
QAPP Short Title: METROPLAN QAPP for CPRG
Section: References
Revision No: 1 Date: 07/16/2024
Page: 17 of 44
Task 2: Regional inventory of electric power generation sector GHG emissions.
Task 3: Regional inventory of industrial sector GHG emissions.
Task 4: Regional inventory of commercial sector GHG emissions.
Task 5: Regional inventory of residential sector GHG emissions.
Task 6: Regional inventory of agricultural sector GHG emissions.
Task 7: Regional inventory of LULUCF GHG sinks and emissions.
For each sector-specific task, Tables 2.1–2.7 provide planned activities and a schedule of deliverables for use by the region in preparing GHG inventories. The resulting estimates from a regionally developed inventory will be compared to EPA’s existing county, state, and national-level emissions data.
ClearPath is a greenhouse gas inventorying tool provided by ICLEI to ICLEI member communities. The tool performs both local government operations and community-wide inventories. The tool works by taking activity data (e.g. vehicle miles traveled) or usage data (e.g. gallons of diesel consumed) and uses emissions factors from national databases to calculate emissions. Additionally, ClearPath will accept calculated or modeled emissions data. For this project, staff will use the community-wide track of the ClearPath tool. Staff will complete seven separate inventories in ClearPath –one for each of the six counties in the region, and one for the six-county region as a whole, for calendar year 2020. Unless indicated, staff will obtain county-level data for each county, then sum that data for the regional inventory. For each sector-specific task, Tables 2.1–2.7 provide planned activities and a schedule of deliverables for use by communities preparing GHG inventories.
Metroplan will use contractors to support inventory development. Prior to the development of any emissions data by a contractor, each contractor must agree to the terms of each specific project and this QAPP. The PM and TL will review all inventory data submitted by each contractor prior to Metroplan’s acceptance of the data.
Tasks and Deliverables
Task 1. Transportation
1. The PM or TL will assign staff to collect county-level GHG emissions data for the transportation sector from the EPA’s NEI Data Retrieval Tool. Agricultural and industrial equipment will be removed from this dataset and designated supplemental to their coordinating sectors. This refined data will then be compared to the SIT and approximated based on state-level data from the EPA’s GHG Inventory Data Explorer and adjusted based on assumptions made for the transportation sector. Local sourcepoint data will be used if available.
2. An independent regional GHG inventory will be produced, including a profile of mobile source emissions using the following tools and resources:
a. 2020 state-level data from the EPA’s GHG Inventory Data Explorer.
b. 2020 county-level data from the EPA’s NEI Data Retrieval Tool for mobile sources.
Schedule
Concurrent to and within 120 days of QAPP approval by EPA.
Table 2.1 Technical Task Descriptions for Task 1.
QAPP Short Title: METROPLAN QAPP for CPRG
Section: References
Revision No: 1 Date: 07/16/2024
Page: 18 of 44
Table 2.1 Technical Task Descriptions for Task 1.
Tasks and Deliverables Schedule
Task 1. Transportation
c. 2020 city-level data from the Google Environmental Insights Explorer.
d. 2020 city-level data from the City of Little Rock’s Emissions Inventory.
e. 2020 source-point data, if available.
3. After the primary GHG emission calculations are complete, the PM, TL, or QAM will assign a QC staff member to complete the following steps:
a. Review the original sources of data from EPA’s NEI Data Retrieval Tool and any other sources used.
b. Validate that the values from the original state- and county-level sources were correctly calculated to produce regional approximations.
c. Compare the outputs, percentages, and listing of sources of the Arkansas GHG emission data for the transportation sector from the EPA’s GHG Inventory Data Explorer to the outputs, percentages, and listing of sources of the approximated Metroplan GHG emission inventory data for the transportation sector from EPA’s NEI Data Retrieval Tool.
d. Assess, if necessary, then calculate GHG emissions to reflect GWP and adjust accordingly. The EPA’s NEI Data Retrieval Tool provides data by GHG (carbon dioxide, methane, and nitrous oxide) and will require conversions based on GWP values. The EPA’s GHG Inventory Data Explorer provides data in CO2e, which does not require conversions based on GWP values.
e. Document findings and submit to the PM, TL, and QAM for resolution.
f. Document steps taken to resolve any findings.
4. Staff will review chapter 7 on transportation in the Global Protocol for CommunityScale GHG Emissions [available at Protocol for Community-Scale Inventories].
5. The GHG inventory report or separate report based on the GHG inventory will include a listing of options for emissions reductions from this sector that includes the following components:
a. The specific source categories and activities affected by the proposed option.
b. An estimate of the quantity of GHG emissions reduced by the options.
c. An estimate of the air pollutant emissions (as defined under applicable local, state, or federal rules for air toxics) reduced by the option.
d. A description of any estimated benefits including co-benefit reductions of criteria emissions and air pollutant emissions.
e. A description of any benefits that the option will impart to communities with known environmental injustice issues such as close proximity to major transportation corridors and other sources of air pollutant emissions.
QAPP Short Title: METROPLAN QAPP for CPRG
Section: References
Revision No: 1 Date: 07/16/2024
Page: 19 of 44
Table 2.2 Technical Task Descriptions for Task 2.
Tasks and Deliverables
Task 2. Electric Power
1. The PM or TL will assign staff to collect state-level GHG emissions data for the electric power sector from the EPA’s GHG Inventory Data Explorer. This data will then be compared to the SIT and approximated and adjusted based on assumptions made for the electrical sector. Local source-point data will be used if available.
2. An independent regional GHG inventory will be produced, including a profile of electric power emissions using the following tools and resources:
a. 2020 state-level data from the EPA’s GHG Inventory Data Explorer.
b. 2020 county-level data, if available.
c. 2020 city-level data from the Google Environmental Insights Explorer.
d. 2020 city-level data from the City of Little Rock’s Emissions Inventory.
e. 2020 source-point data, if available.
3. After the primary GHG emission calculations are complete, the PM, TL, or QAM will assign a QC staff member to complete the following steps:
a. Review the original sources of data from EPA’s GHG Inventory Data Explorer.
b. Validate that the values from the original state-level sources were correctly calculated to produce regional approximations.
c. Compare the outputs, percentages, and listing of sources of the Arkansas GHG emission data for the electric power industry sector from the EPA’s GHG Inventory Data Explorer to the outputs, percentages, and listing of sources of the approximated Metroplan GHG emission inventory data for the electric power sector.
d. Assess, if necessary, then calculate GHG emissions to reflect GWP and adjust accordingly. The EPA’s GHG Inventory Data Explorer provides data in CO2e, which does not require conversions based on GWP values.
e. Document findings and submit to the PM, TL, and QAM for resolution.
f. Document steps taken to resolve any findings.
4. Staff will review chapter 6 on stationary energy in the Global Protocol for CommunityScale GHG Emissions [available at Protocol for Community-Scale Inventories].
5. The GHG inventory report or separate report based on the GHG inventory will include a listing of options for emissions reductions from this sector that includes the following components:
a. The specific source categories and activities affected by the proposed option.
b. An estimate of the quantity of GHG emissions reduced by the options.
c. An estimate of the air pollutant emissions (as defined under applicable local, state or federal rules for air toxics) reduced by the option.
d. A description of any estimated benefits including co-benefit reductions of criteria emissions and air pollutant emissions.
e. A description of any benefits that the option will impart to communities with known environmental injustice issues such as close proximity to major transportation corridors and other sources of air pollutant emissions.
Schedule
Concurrent to and within 120 days of QAPP approval by EPA.
QAPP Short Title: METROPLAN QAPP for CPRG
Section: References
Revision No: 1 Date: 07/16/2024
Page: 20 of 44
Table 2.3 Technical Task Descriptions for Task 3.
Tasks and Deliverables Schedule
Task 3. Industry
1. The PM or TL will assign staff to collect county-level GHG emissions data for industrial equipment from the EPA’s NEI Data Retrieval Tool. This data will then be compared to the SIT and approximated based on state-level data from the EPA’s GHG Inventory Data Explorer and adjusted based on assumptions made for the industrial sector. Local source-point data will be used if available.
2. An independent regional GHG inventory will be produced, including a profile of industrial emissions using the following tools and resources:
a. 2020 state-level data from the EPA’s GHG Inventory Data Explorer.
b. 2020 county-level data from the EPA’s NEI Data Retrieval Tool for industrial equipment.
c. 2020 city-level data from the Google Environmental Insights Explorer.
d. 2020 city-level data from the City of Little Rock’s Emissions Inventory.
e. 2020 source-point data, if available.
3. After the primary GHG emission calculations are complete, the PM, TL, or QAM will assign a QC staff member to complete the following steps:
a. Review the original sources of data from the EPA’s NEI Data Retrieval Tool, EPA’s GHG Inventory Data Explorer, and any other sources.
b. Validate that the values from the original state-level sources were correctly calculated to produce regional approximations.
c. Compare the outputs, percentages, and listing of sources of the Arkansas GHG emission data for the industrial sector from the EPA’s GHG Inventory Data Explorer to the outputs, percentages, and listing of sources of the approximated Metroplan GHG emission inventory data for industrial equipment from the EPA’s NEI Data Retrieval Tool.
d. Assess, if necessary, then calculate GHG emissions to reflect Global Warming Potential (GWP) 14 and adjust accordingly. The EPA’s NEI Data Retrieval Tool provides data by GHG (carbon dioxide, methane, and nitrous oxide) and will require conversions based on GWP values. The EPA’s GHG Inventory Data Explorer provides data in CO2e, which does not require conversions based on GWP values.
e. Document findings and submit to the PM, TL, and QAM for resolution.
f. Given that industrial equipment may not represent the entire industrial sector, QC staff member and PM, TL, or QAM will deem emission totals for the sector suitable or unsuitable for the region. If unsuitable, approximations will be made based primarily on state-level data and their correlating percentages for the industrial sector from the EPA’s GHG Inventory Data Explorer.
g. Document steps taken to resolve any findings.
14 https://ghgprotocol.org/sites/default/files/ghgp/Global-Warming-Potential-Values%20%28Feb%2016%202016%29_1.pdf
Concurrent to and within 120 days of QAPP approval by EPA.
Short Title: METROPLAN QAPP for CPRG
Section: References
Revision No: 1 Date: 07/16/2024
Page: 21 of 44
Tasks and Deliverables
Task 3. Industry
4. Staff will review chapter 9 on industrial processes and product use in the Global Protocol for Community-Scale GHG Emissions [available at Protocol for Community-Scale Inventories].
5. The GHG inventory report or separate report based on the GHG inventory will include a listing of options for emissions reductions from this sector that includes the following components:
a. The specific source categories and activities affected by the proposed option.
b. An estimate of the quantity of GHG emissions reduced by the options.
c. An estimate of the air pollutant emissions (as defined under applicable local, state or federal rules for air toxics) reduced by the option.
d. A description of any estimated benefits including co-benefit reductions of criteria emissions and air pollutant emissions.
e. A description of any benefits that the option will impart to communities with known environmental injustice issues such as close proximity to major transportation corridors and other sources of air pollutant emissions.
Table 2.4 Technical Task Descriptions for Task 4.
Tasks and Deliverables
Task 4. Commercial
1. The PM or TL will assign staff to collect state-level GHG emissions data for the commercial sector from the EPA’s GHG Inventory Data Explorer. This data will then be approximated and adjusted based on assumptions made for the commercial sector. Local source-point data will be used if available.
2. An independent regional GHG inventory will be produced, including a profile of commercial emissions using the following tools and resources:
a. 2020 state-level data from the EPA’s GHG Inventory Data Explorer.
b. 2020 county- and city-level data from the Google Environmental Insights Explorer.
c. 2020 city-level data from the City of Little Rock’s Emissions Inventory.
d. 2020 source-point data, if available.
3. After the primary GHG emission calculations are complete, the PM, TL, or QAM will assign a QC staff member to complete the following steps:
a. Review the original sources of data from EPA’s GHG Inventory Data Explorer and any other sources used.
b. Validate that the values from the original state-level sources were correctly calculated to produce regional approximations.
c. Compare the outputs, percentages, and listing of sources of the Arkansas GHG emission data for the commercial sector from the EPA’s GHG Inventory Data Explorer and Google’s EIE to the outputs, percentages, and
Schedule
Concurrent to and within 120 days of QAPP approval by EPA.
Schedule
Concurrent to and within 120 days of QAPP approval by EPA.
QAPP Short Title: METROPLAN QAPP for CPRG
Section: References
Revision No: 1 Date: 07/16/2024
Page: 22 of 44
Tasks and Deliverables
Task 4. Commercial
listing of sources of the approximated Metroplan GHG emission inventory data for the commercial sector.
d. Assess, if necessary, then calculate GHG emissions to reflect GWP and adjust accordingly. The EPA’s GHG Inventory Data Explorer provides data in CO2e, which does not require conversions based on GWP values. Google’s EIE provides data in CO2 and will require conversions based on GWP values.
e. Document findings and submit to the PM, TL, and QAM for resolution.
f. Document steps taken to resolve any findings.
4. Staff will review chapter 6 on stationary energy in the Global Protocol for Community-Scale GHG Emissions [available at Protocol for Community-Scale Inventories].
5. The GHG inventory report or separate report based on the GHG inventory will include a listing of options for emissions reductions from this sector that includes the following components:
a. The specific source categories and activities affected by the proposed option
b. An estimate of the quantity of GHG emissions reduced by the options.
c. An estimate of the air pollutant emissions (as defined under applicable local, state or federal rules for air toxics) reduced by the option.
d. A description of any estimated benefits including co-benefit reductions of criteria emissions and air pollutant emissions.
e. A description of any benefits that the option will impart to communities with known environmental injustice issues such as close proximity to major transportation corridors and other sources of air pollutant emissions.
Schedule
Table 2.5 Technical Task Descriptions for Task 5. Tasks and Deliverables Schedule Task 5. Residential
1. The PM or TL will assign staff to collect state-level GHG emissions data for the residential sector from the EPA’s GHG Inventory Data Explorer. This data will then be approximated and adjusted based on assumptions made for the residential sector. Local source-point data will be used if available.
2. An independent regional GHG inventory will be produced, including a profile of residential emissions using the following tools and resources:
a. 2020 state-level data from the EPA’s GHG Inventory Data Explorer.
b. 2020 county- and city-level data from the Google Environmental Insights Explorer.
c. 2020 city-level data from the City of Little Rock’s Emissions Inventory.
d. 2020 source-point data, if available.
Concurrent to and within 120 days of QAPP approval by EPA.
QAPP Short Title: METROPLAN QAPP for CPRG
Section: References
Revision No: 1 Date: 07/16/2024
Page: 23 of 44
Tasks and Deliverables
Task 4. Commercial
3. After the primary GHG emission calculations are complete, the PM, TL, or QAM will assign a QC staff member to complete the following steps:
a. Review the original sources of data from EPA’s GHG Inventory Data Explorer and any other sources used.
b. Validate that the values from the original state-level sources were correctly calculated to produce regional approximations.
c. Compare the outputs, percentages, and listing of sources of the Arkansas GHG emission data for the residential sector from the EPA’s GHG Inventory Data Explorer and Google’s EIE to the outputs, percentages, and listing of sources of the approximated Metroplan GHG emission inventory data for the residential sector.
d. Assess, if necessary, then calculate GHG emissions to reflect GWP and adjust accordingly. The EPA’s GHG Inventory Data Explorer provides data in CO2e, which does not require conversions based on GWP values. Google’s EIE provides data in CO2 and will require conversions based on GWP values.
e. Document findings and submit to the PM, TL, and QAM for resolution.
f. Document steps taken to resolve any findings.
4. Staff will review chapter 6 on stationary energy in the Global Protocol for Community-Scale GHG Emissions [available at Protocol for Community-Scale Inventories].
5. The GHG inventory report or separate report based on the GHG inventory will include a listing of options for emissions reductions from this sector that includes the following components:
a. The specific source categories and activities affected by the proposed option
b. An estimate of the quantity of GHG emissions reduced by the options.
c. An estimate of the air pollutant emissions (as defined under applicable local, state or federal rules for air toxics) reduced by the option.
d. A description of any estimated benefits including co-benefit reductions of criteria emissions and air pollutant emissions.
e. A description of any benefits that the option will impart to communities with known environmental injustice issues such as close proximity to major transportation corridors and other sources of air pollutant emissions.
Schedule
QAPP Short Title: METROPLAN QAPP for CPRG
Section: References
Revision No: 1 Date: 07/16/2024
Page: 24 of 44
Table 2.6 Technical Task Descriptions for Task 6. Tasks and Deliverables Schedule Task 6. Agriculture
1. The PM or TL will assign staff to collect county-level GHG emissions data for agricultural equipment from the EPA’s NEI Data Retrieval Tool. This data will then be compared to the SIT and approximated based on state-level data from the EPA’s GHG Inventory Data Explorer. Local source-point data will be used if available.
2. An independent regional GHG inventory will be produced, including a profile of agricultural emissions using the following tools and resources:
a. 2020 state-level data from the EPA’s GHG Inventory Data Explorer.
b. 2020 county-level data from the EPA’s NEI Data Retrieval Tool for agricultural equipment.
c. 2020 city-level data from the Google Environmental Insights Explorer.
d. 2020 city-level data from the City of Little Rock’s Emissions Inventory.
e. 2020 source-point data, if available.
3. Assess the urban and rural landscape of the Metroplan region in comparison to that of the state.
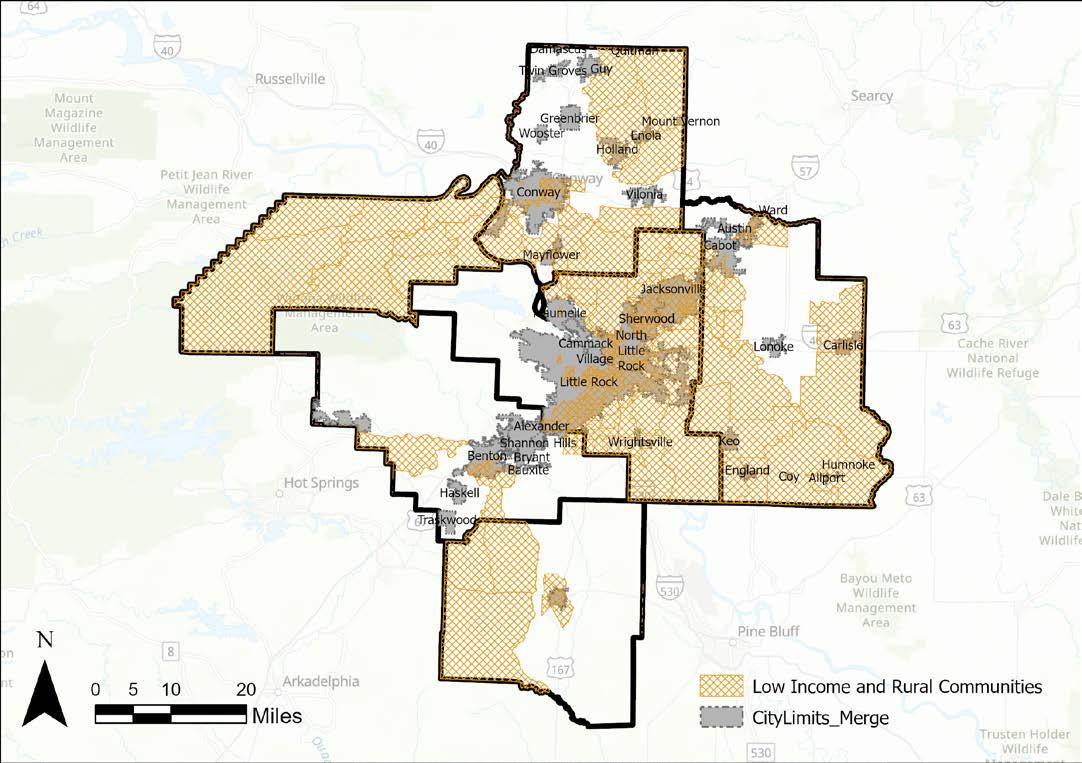
a. Research obtained from readily available and credible sources shows that approximately 92.4 percent of the region is rural, and 7.6 percent is urban. In comparison, about 99 percent of Arkansas is rural and one percent is urban. Since the Metroplan agricultural sector emissions data may be approximated based primarily on state-level data, this will likely require adjustments. Assumptions should be made that the agriculture sector emissions are to be reduced. The remaining percentage points shall be re-allocated to the other sectors.
4. After the primary GHG emission calculations are complete, the PM, TL, or QAM will assign a QC staff member to complete the following steps:
a. Review the original sources of data from the EPA’s NEI Data Retrieval Tool, the EPA’s GHG Inventory Data Explorer, and any other sources used.
b. Validate that the values from the original state-level sources were correctly calculated to produce regional approximations.
c. Compare the outputs, percentages, and listing of sources of the Arkansas GHG emission data for the agriculture sector from the EPA’s GHG Inventory Data Explorer to the outputs, percentages, and listing of sources of the approximated Metroplan GHG emission inventory data for agricultural equipment from the EPA’s NEI Data Retrieval Tool.
d. Assess, if necessary, then calculate GHG emissions to reflect GWP and adjust accordingly. The EPA’s NEI Data Retrieval Tool provides data by GHG (carbon dioxide, methane, and nitrous oxide) and will require conversions based on GWP values. The EPA’s GHG Inventory Data Explorer provides data in CO2e, which does not require conversions based on GWP values.
e. Document findings and submit to the PM, TL, and QAM for resolution.
Concurrent to and within 120 days of QAPP approval by EPA.
QAPP Short Title: METROPLAN QAPP for CPRG
Section: References
Revision No: 1 Date: 07/16/2024
Page: 25 of 44
Table
2.6 Technical Task Descriptions for Task 6.
Tasks and Deliverables
Task 6. Agriculture
f. Similar to the industrial sector, agricultural equipment may not represent the entire agricultural sector. The QC staff member and PM, TL, or QAM will deem emission totals for the sector suitable or unsuitable for the region. If unsuitable, approximations will be made based primarily on state-level data and their correlating percentages for the agricultural sector from the EPA’s GHG Inventory Data Explorer. The QC staff member and PM, TL, or QAM will then consider the conclusions drawn from the urban and rural landscape research collected for the region and determine how that compares to the state of Arkansas. Adjustments will be made accordingly.
g. Document steps taken to resolve any findings.
5. Staff will review chapter 10 on agriculture, forestry, and other land use in the Global Protocol for Community-Scale GHG Emissions [available at Protocol for CommunityScale Inventories].
6. The GHG inventory report or separate report based on the GHG inventory will include a listing of options for emissions reductions from this sector that includes the following components:
a. The specific source categories and activities affected by the proposed option.
b. An estimate of the quantity of GHG emissions reduced by the options.
c. A description of any estimated benefits including co-benefit reductions of criteria emissions and air pollutant emissions.
d. A description of any benefits that the option will impart to communities with known environmental injustice issues such as close proximity to major transportation corridors and other sources of air pollutant emissions.
Tasks and Deliverables
Task
Table 2.7 Technical Task Descriptions for Task 7.
7. Land Use, Land Use Change and Forestry (LULUCF)
1. The PM or TL will assign staff to collect community-level GHG sink emissions data for LULUCF. Local source-point data will be used if available. This data will then be used to inventory GHG sink emissions.
2. A profile of LULUCF sink emissions will either be approximated using state-level sink data from the EPA’s GHG Data Explorer, or will be inventoried using IPCC 15 and/or EPA emission factors for the following categories if land use data is available:
a. Forest Land Remaining Forest Land
b. Settlements Remaining Settlements
15 https://ghgprotocol.org/sites/default/files/ghgp/Global-Warming-Potential-Values%20%28Feb%2016%202016%29_1.pdf
Schedule
Schedule
Concurrent to and within 120 days of QAPP approval by EPA.
QAPP Short Title: METROPLAN QAPP for CPRG
Section: References
Revision No: 1 Date: 07/16/2024
Page: 26 of 44
Table 2.7 Technical Task Descriptions for Task 7.
Tasks and Deliverables Schedule
Task 7. Land Use, Land Use Change and Forestry (LULUCF)
c. Land Converted to Forest Land
d. Cropland Remaining Cropland
e. Wetlands Remaining Wetlands
3. After the primary GHG emission reduction calculations are complete, the PM, TL, or QAM will assign a QC staff member to complete the following steps:
a. Review the original sources of data from the tools and resources utilized.
b. Validate that the values from the tools, resources, and inputs (i.e. acres of land use category, emissions factors used to calculate GHG sink emissions) were correctly compiled.
c. Validate that the values from the tools, resources, and outputs (i.e. acres of land use category, emissions factors used to calculate GHG sink emissions) were correctly calculated.
d. Document findings and submit to the PM, TL, and QAM for resolution.
e. Document steps taken to resolve any findings.
4. The GHG inventory report or separate report based on the GHG inventory will include a listing of options for emissions reductions from this sector that includes the following components:
a. The specific source categories, sectors, and activities affected by the proposed option.
b. An estimate of the quantity of GHG emissions reduced by the options.
c. A description of any estimated benefits including co-benefit reductions of criteria emissions and air pollutant emissions.
d. A description of any benefits that the option will impart to communities with known environmental injustice issues such as close proximity to major transportation corridors and other sources of air pollutant emissions.
Short Title: METROPLAN QAPP for CPRG
Section: References
Revision No: 1 Date: 07/16/2024
Page: 27 of 44
1.7. Quality Objectives / Criteria
1.7.1.
Data Quality Objectives
The primary objectives for this project are to develop reliable inventories for each of the GHGemitting sectors in the region, and to identify options for reducing emissions from those sectors. Accordingly, all quality objectives and criteria are aligned with these objectives. The quality system used for this project is the joint responsibility of the Metroplan PM, TL, and QAM. An organizationally independent QAM will maintain oversight of all required measures in this QAPP. QC functions will be carried out by technical staff and will be carefully monitored by the responsible TL, who will work with the QAM to identify and implement quality improvements. All activities performed under this project will conform to this QAPP.
1.7.2. Data Quality, Management, and Analyses
For this project, Metroplan will use a variety of QC techniques and criteria to ensure the quality of data and analyses. Quality will largely be ensured and inherent because readily available datasets from EPA will primarily be used. Data of known and documented quality are essential components for the success of the project, as these data will be used to inform the decision-making process for the CCAP and Status Reports as discussed in Section 1.5.4.
The data quality objectives and criteria for this project are accuracy, precision, bias, completeness, representativeness, and comparability. Accuracy is a measure of the overall agreement of a measurement to a known value. It includes a combination of random error (precision) and systematic error (bias). Precision is a measure of how reproducible a measurement is or how close a calculated estimate is to the actual value. Bias is a systematic error in the method of measurement or calculation. If the calculated value is consistently high or consistently low, the value is said to be biased. Our goal is to ensure that information and data generated and collected are as accurate, precise, and unbiased as possible within project constraints. It is not anticipated that this project will include primary data collection. Generally, existing data and tools provided by the EPA and other qualified sources will be used for project tasks. A subject matter specialist familiar with technical reporting standards will be used to QA all data utilized for developing the regional GHG inventory. Metroplan will verify the accuracy of all data by checking for logical consistency among datasets. All existing environmental data shall meet the applicable criteria defined in CFR and associated guidance, such as the validation templates provided in the EPA QA Handbook Volume II.
For the data analysis completed under this project, analytical methods will be reviewed to ensure the approach is appropriate and calculations are accurate. Spreadsheets will be used to store data and complete necessary analyses. Design of spreadsheets will be configured for the intended use. All data and methodologies specific to each analysis will be defined and documented. Tables and fields will be clearly and unambiguously named. Spreadsheets will be checked to ensure algorithms call data correctly and units of measure are internally consistent. Hand-entered or electronically transferred data will be checked to ensure the data are accurately transcribed and transferred.
The draft inventory will be evaluated for GHG-emitting-sector and geographic completeness. Metroplan will utilize the framework of sectors in the EPA’s GHG Inventory Data Explorer, to ensure that the inventory prepared under this project includes all major GHG-emitting sectors.
Representativeness is a qualitative term that expresses the degree to which data accurately and precisely represent a characteristic of a population, parameter variations at a sampling point, a process condition, or an environmental condition. Metroplan will use the most complete and accurate information available to compile representative data for the region’s GHG-emitting activities.
QAPP Short Title: METROPLAN QAPP for CPRG
Section: References
Revision No: 1 Date: 07/16/2024
Page: 28 of 44
Data comparability is a qualitative term that expresses the measure of confidence that one dataset can be compared to another and can be combined for the decision(s) to be made. Metroplan will compare datasets when available from different sources to check for the quality of the data. This QA step will also ensure that any highly correlated datasets or indicators are identified. Supporting data, such as information on reference methods used and complete test reports, are important to ensure the comparability of emissions data.
1.8. Special Training / Certifications
All Metroplan staff assigned to work on this project shall have appropriate technical and QA training to properly perform their assignments. The PM and TL under this project will have completed an online training course on air emissions inventories on the Air Knowledge website 16. The contractor team shall have experience quantifying GHG emissions.
No additional technical training is required. If training is required for new staff or for particular segments of the GHG inventory, the PM in coordination with the TL will identify available training resources for the inventory segment and incorporate the required training into the project schedule.
1.9. Documents and Records
Metroplan will document in electronic form (and/or hard copy) QC activities for this project. The TL is responsible for ensuring that copies of all completed QC forms, along with other QA records (including this QAPP), will be maintained in the project files. Project files will be retained for a minimum of five years by Metroplan on its general server after the completion of the project until they are obsolete or superseded. The types of documentation that will be prepared for this project include:
Planning documentation (e.g., QAPP)
Implementation documentation (i.e., Review/Approval Forms)
Metroplan GHG Emissions Inventory and calculations records
Detailed documentation of QC activities for a specific task or subtask will be maintained using the QC Documentation Form shown in Appendix A. This form will document the completion of the QC techniques planned for use on this project as listed in Technical Task Descriptions, Tables 2.1 through 2.7. One or more completed versions of these forms, as necessary, will be maintained in the project files. The types of documents and activities for which QC will be conducted and documented may include raw data, data from other sources such as data bases or literature, data entry into the EPA tools and conversion calculators, calculations necessary to transform raw data into sector specific category data summarizations, and comparisons of primary state-level data with Metroplan estimates.
Technical reviews will be used to corroborate the scientific defensibility of any data analyses. A technical review (i.e., internal senior review) is a documented critical review of a specific technical work product. It is conducted by subject matter experts who are collectively equivalent (or senior) in technical expertise to those who performed the work. Given the nature of the deliverables under this project, a technical review is an in-depth assessment of the assumptions, calculations, extrapolations, alternative interpretations, and conclusions in technical work products.
At this time, Metroplan does not expect the project will collect or handle personally identifiable information (PII) subject to the Privacy Act of 1974. However, if during the course of this project technical staff determine that PII is required to support project objectives, Metroplan will meet all
16 https://airknowledge.gov/EMIS-SI.html
QAPP Short Title: METROPLAN QAPP for CPRG
Section: References
Revision No: 1 Date: 07/16/2024
Page: 29 of 44
requirements of the Privacy Act of 1974. Appendix B indicates the status of the region’s determination regarding applicability of the Privacy Act of 1974 under this project.
2. Existing Data Acquisition and Management Protocols (Group B)
2.1.
2.1.1.
Sampling Process Design
Need and Intended Use of Data Used
As indicated in Tables 2.1–2.7, a wide range of data for a diverse set of GHG-emitting activity is necessary to prepare a regional inventory. Existing data resource may include source-specific or facilityspecific GHG emissions estimates, emissions factors, or activity data for use with emissions factors. Existing data resources (including but not limited to data from previously completed inventories) will be utilized to develop the primary GHG emissions estimates using the EPA’s GHG Inventory Data Explorer, EPA’s NEI Data Retrieval Tool, ADEE SLEIS, 17 US Community Protocol’s LEARN Tool, Google’s EIE, and the City of Little Rock’s Emissions Inventory.
Subsequently, QC staff will complete an independent assessment of proper use of the original data source and will validate that the original data was properly transformed for the primary entries into Metroplan’s estimated emission inventory spreadsheet. Any discrepancies between the primary state-level data and Metroplan estimates will be reviewed by the PM or QAM and documented including the steps taken to reconcile any significant differences.
2.1.2. Identification of Data Sources and Acquisition
The following data sources will be evaluated for use under each task to develop primary estimates for the major-emitting sectors in Metroplan or for use in validation of the primary estimates:
Task 1: Transportation
o 2020 EPA GHG Inventory Data Explorer state-level data.
o 2020 EPA National Emissions Inventory (NEI) county-level data for mobile sources.
o 2020 Google Environmental Insights Explorer city-level data.
o 2020 City of Little Rock’s Emissions Inventory city-level data.
o 2020 source-point data, if available.
Task 2: Electric Power Generation
o 2020 EPA GHG Inventory Data Explorer state-level data.
o 2020 county-level data, if available.
o 2020 Google Environmental Insights Explorer city-level data.
o 2020 City of Little Rock’s Emissions Inventory city-level data.
o 2020 source-point data, if available.
Task 3: Industry
o 2020 EPA GHG Inventory Data Explorer state-level data.
17 Recognizing the possibility of duplication between federal data and SLEIS, priority will be given to federal data and SLEIS used as a supplement.
Short Title: METROPLAN QAPP for CPRG
Section: References
Revision No: 1 Date: 07/16/2024
Page: 30 of 44
o 2020 EPA National Emissions Inventory (NEI) county-level data for industrial equipment
o 2020 Google Environmental Insights Explorer city-level data.
o 2020 City of Little Rock’s Emissions Inventory city-level data.
o 2020 source-point data, if available.
Task 4: Commercial
o 2020 EPA GHG Inventory Data Explorer state-level data.
o 2020 Google Environmental Insights Explorer county- and city-level data.
o 2020 City of Little Rock’s Emissions Inventory city-level data.
o 2020 source-point data, if available.
Task 5: Residential
o 2020 EPA GHG Inventory Data Explorer state-level data.
o 2020 Google Environmental Insights Explorer county- and city-level data.
o 2020 City of Little Rock’s Emissions Inventory city-level data.
o 2020 source-point data, if available.
Task 6: Agriculture
o 2020 EPA GHG Inventory Data Explorer state-level data.
o 2020 EPA National Emissions Inventory (NEI) county-level data for agricultural equipment.
o 2020 Google Environmental Insights Explorer city-level data.
o 2020 City of Little Rock’s Emissions Inventory city-level data.
o 2020 source-point data, if available.
Task 7: Land Use, Land Use Change, and Forests (LULUCF)
o 2020 EPA GHG Inventory Data Explorer state-level data.
o 2020 land use data and IPCC data.
o 2020 source-point data, if available.
2.2. Quality Control
All data operations conducted for this project will involve existing, non-direct measurement data. All data received will be reviewed by a senior technical staff member to assess data quality and completeness before their use. In addition to reviewing and assessing the data collected, all data entered into spreadsheets and all calculations completed for analyses will be reviewed by a senior technical QC reviewer. The QC reviewer will evaluate the approach to ensure the methods are appropriate and have been applied correctly to the analysis. The QC reviewer will also confirm all data were entered correctly and that calculations are complete and accurate. Calculations will be checked by repeating each calculation, independently, and comparing the results of the two calculations. Any data entry and calculation errors will be identified and corrected. Data tables prepared for the draft and final reports will be checked against the spreadsheets used to store the data and complete the analysis.
No statistical analysis and calculations were required to assess the data/datasets because readily available data from the EPA was used.
Short Title: METROPLAN QAPP for CPRG
Section: References
Revision No: 1 Date: 07/16/2024
Page: 31 of 44
2.3. Non-direct Measurements
All data operations conducted on this project will involve existing, non-direct measurement data. All existing data received will be reviewed by a senior technical staff member to assess data quality and completeness before their use.
Consistent with the EPA’s QA requirements, this QAPP describes the procedures that will be used to ensure the selection of appropriate data and information to support the goals and objectives of this project. Specific elements addressed by this QAPP include:
Identifying the sources of existing data, Presenting the hierarchy for data selection, Describing the review process and data quality criteria, Discussing quality checks and procedures should errors be identified, and Explaining how data will be managed, analyzed, and interpreted.
Data presented in the GHG inventory will be traced to its source (e.g., database input and output). Key resources include data collected by the EPA (e.g., NEI data), and data from EPA-approved data sources. These sources may include primary literature (i.e., peer-reviewed journal articles and reports) or databases. We may also use approved existing sources (e.g., handbooks, databases). Original sources for all information and data contained in the document will be included in a list of references with appropriate citations. When peer-reviewed literature or EPA-approved data sources cannot be used, we will document any significant limitations to the data sources used.
We will document information regarding each dataset and our rationale/selection criteria for selecting the data sources used in the inventory. The TL will be responsible for overseeing and confirming the selection of the data for the project tasks.
Table 3.1 provides a hierarchy for data quality when identifying and reviewing available sources of data and information. When evaluating data resources, efforts will be made to identify and select data sources that most closely conform to the highest ranked criteria. Data quality metrics and documentation may not be provided by each source, and as necessary, we may consult with subject matter experts from permitted facilities or trade associations operating in Central Arkansas to qualify data for use to meet project objectives.
Any available data quality information will be reviewed by Metroplan and project advisors to ensure that the data represent full-scale designs and commercial processes, and that they are applicable to economic and regulatory conditions in the United States. Metroplan will document data sources used and any significant limitations of utilized data or information to ensure that the data are appropriate for their intended use. An internal technical reviewer will review the approach for selecting and compiling data; the review will include examination of the data sources and the intended use of the data. The specific QC techniques used will depend on the technical activity or analysis to which they are applied. The Metroplan PM and TL are responsible for verifying the usability of data and related information.
QAPP Short Title: METROPLAN QAPP for CPRG
Section: References
Revision No: 1 Date: 07/16/2024
Page: 32 of 44
Table 3.1 Existing Data Quality Ranking Hierarchy
Quality Rank Source Type
Highest Federal, state, and local government agencies
Second Consultant reports for state and local government agencies
Third NGO studies; peer-reviewed journal articles; trade journal articles; conference proceedings
Fourth Conference proceedings and other trade literature: non-peer-reviewed
Fifth Source-point data from vendors
Metroplan will work with EPA and ADEE to ensure that all data used for the project are appropriate for their intended use. The main criteria that will be used in the selection of the data are the vintage and quality of the data (based on peer review). The quality of the data will consider the credibility of the source, and the QA documentation provided by the data source. Senior technical staff will also evaluate the availability of alternative datasets, suitability of the selected data for the intended purpose, and agreement with TGIT estimates.
Metroplan will use the Secondary Data Quality Ranking Hierarchy when identifying and reviewing available sources of data and information. The source types in Table 3.1 appear in the order in which they are likely to meet the data quality criteria. For example, federal government data are more likely to be from a credible source, thoroughly reviewed, suitable, available, and representative, and any exceptions to these data criteria are likely to be noted in the government data, providing transparency. Data from individuals are expected to be less reliable, not peer reviewed, and may not be suitable or representative of regional activities.
If it is determined that data meeting the fourth (i.e., conference proceedings and other trade literature: non-peer-reviewed) or fifth (i.e., individual estimates such as personal communications with vendors) level compose the best or only available data source, the TL will include in the inventory a description of these data with associated limitations for review and approval by the EPA PO or delegate.
These measures of data quality will be used to judge whether the data are acceptable for their intended use. In cases where available data do not or may not meet data quality acceptance criteria, the TL will include in the inventory a discussion for review and approval by the EPA PO or delegate explaining how emissions estimate that relied on such data compare to state-level data from the EPA’s GHG Inventory Data Explorer.
We will also consider, for example, the age (i.e., date of the source dataset) and the representativeness of the data and will include in the inventory report for review and approval by the PM and QAM any quality concerns or uncertainties introduced with use of these data, such as data gaps or inconsistencies with other sources. Any data source utilized that is older than 10 years will specifically be flagged in the inventory report.
Representativeness will be evaluated by determining that the emissions or activity data are descriptive of conditions in the United States, that the data are current, and that the data are descriptive of similar processes within Metroplan. Any incomplete datasets will be identified, and deficiencies will be evaluated to determine whether data are missing or confusing and if they meet secondary-use quality objectives.
QAPP Short Title: METROPLAN QAPP for CPRG
Section: References
Revision No: 1 Date: 07/16/2024
Page: 33 of 44
Key screening criteria will be used to screen the sources identified. The Metroplan TL will provide oversight to the screening process to ensure sources collected are the most relevant and meet quality requirements. Available data and information from the selected sources will be compiled and relevant summary information will be extracted out of the information sources to develop the required output for each of the project tasks.
2.3.1. Criteria for Accepting Existing Data for Intended Use
The criteria for determining whether the data are acceptable for use in developing the region-wide inventory will be based on a comparison of the primary emissions estimate to the independent emissions estimate produced using the EPA’s GHG Inventory Data Explorer, EPA’s NEI Data Retrieval Tool, ADEE SLEIS, US Community Protocol’s LEARN Tool, Google’s EIE, and the City of Little Rock’s Emissions Inventory or other reliable sources of activity data.
2.4. Data Management
Data management procedures include file storage and file transfer. All project and data files will be stored on Metroplan or Metroplan contractor project servers. Files will be organized and maintained by the TL in folders by project, task, and function, including a system of file labeling to ensure version control. File naming, version control, and storage will be using established Metroplan and/or contractor procedures.
Note that changes made to deliverables will be documented using the software’s track changes feature, which allows a user to track and view all changes that are made to the document version. All deliverable reviews will be documented in a QC Documentation Form (see Appendix A) for the project. This form will be maintained in the project files.
ICLEI ClearPath software as well as general software available through the Microsoft Suite including Excel, PowerPoint, Access, and Word will be used to perform the work (described in Tables 2.1–2.7) for this project.
3. Assessment and Oversight (Group C)
Metroplan is committed to preparing a comprehensive and reliable inventory of GHG emissions for the region. Under this project our senior management team has dedicated the necessary resources to ensure we deliver an inventory that can be relied upon for future policy decisions. Accordingly, under this project, we will concurrently implement existing quality management systems that Metroplan has previously utilized.
3.1. Assessments and Response Actions
The QA program includes periodic review of data files and draft deliverables. The essential steps in the QA program are as follows:
1. Identify and define the problem
2. Assign responsibility for investigating the problem
3. Investigate and determine the cause of the problem
4. Assign and accept responsibility for implementing appropriate corrective actions
5. Establish the effectiveness of and implement the corrective action
6. Verify that the corrective action has eliminated the problem.
Short Title: METROPLAN QAPP for CPRG
Section: References
Revision No: 1 Date: 07/16/2024
Page: 34 of 44
The TL will provide day-to-day oversight of the quality system. Periodic project file reviews will be carried out by the QAM, at least once per year to verify that required records, documentation, and technical review information are maintained in the files. The QAM will ensure that problems found during the review are brought to the attention of the TL and are corrected immediately. All nonconforming data will be noted, and corrective measures to bring nonconforming data into conformance will be recorded.
The TL and QAM are responsible for determining whether the quality system established for the project is appropriate and functioning in a manner that ensures the integrity of all work products. All technical staff have roles and will participate in the corrective action process. Corrective actions for errors found during QC checks will be determined by the TL and, if necessary, with direction from the QAM or PM, as appropriate. The originator of the work will make the corrections and will note on the QC form that the errors were corrected. A reviewer or TL, not involved in the creation of the work, will review the corrections to ensure the errors were corrected. Any problems noted during audits will be reviewed and corrected by the QAM and discussed with the TL as needed. Depending on the severity of the deficiency, the TL may consult the QAM and stop work until the cited deficiency is resolved. Deficiencies identified and their resolution will be documented in monthly project reports, as applicable. The QAM, PM, and TL will comply and respond to all internal and EPA audits on the project, as needed. The QAM will produce a report outlining any corrective actions taken.
4. Data Validation and Usability (Group D)
4.1. Data Review, Verification, Validation
All work conducted under this project will be subject to technical and editorial review. When existing data for the same GHG-emitting activity are available from multiple sources, the background information documents will be reviewed for all sources to determine the dataset that is the most representative of regional operations. Additionally, the inventory report will include the vintage of the existing data resource and preference will be given to the most recent dataset that is representative of similar GHG-emitting regional activities. Reviews will be conducted by an independent, qualified person—or a person not directly involved in the production of the deliverable. The term “validation” refers to whether the data meet the QAPP-defined user requirements while the term “verification” refers to whether conclusions can be correctly drawn from the data. The quality of data used and generated for the project will be reviewed and verified at multiple levels by the project team. This review will be conducted by the Metroplan TL or a senior technical reviewer with specific, applicable expertise. All original and modified data files will be reviewed for input, handling, and calculation errors. Additionally, all units of measure will be checked for consistency. Any potential issues identified through this review process will be evaluated and, if necessary, data will be corrected, and analysis will be revised as necessary, using corrected data. These corrections will be documented in project records. These measures of data quality will be used to judge whether the data are acceptable for their intended use. In cases where available data do not or may not meet data quality acceptance criteria, the TL will document these findings in the inventory along with corrective actions or use of alternative data sources.
4.2. Verification and Validation Methods
As a standard operating procedure, all data (retrieved and generated) will be verified and validated through a review of data files by an independent, qualified technical staff member (i.e., someone other than the document originator), and ultimately, the Metroplan TL. Forms for documenting
QAPP Short Title: METROPLAN QAPP for CPRG
Section: References
Revision No: 1 Date: 07/16/2024
Page: 35 of 44
QC activities and review of deliverables are included in Appendix A. Documentation of calculations will be included in spreadsheet work products and in supporting memoranda, as appropriate.
4.3. Reconciliation with User Requirements
All data (retrieved and generated) and deliverables in this project will be analyzed and reconciled with project data quality requirements. To ensure deliverables meet user requirements, the TL or senior technical lead will review all data and deliverables throughout the project to ensure that the data, methodologies, and tools used meet data quality objectives, are clearly conveyed, and represent sound and established science.
QAPP Short Title: METROPLAN QAPP for CPRG
Section: References
Revision No: 1 Date: 07/16/2024
Page: 36 of 44
5. References
C40 Cities Climate Leadership Group, World Resources Institute, and ICLEI – Local Governments for Sustainability, Global Protocol for Community-Scale Greenhouse Gas Inventories: An Accounting and Reporting Standard for Cities. Version 1.1. Available at https://ghgprotocol.org/sites/default/files/standards/GPC_Full_MASTER_RW_v7.pdf. Accessed on 5/1/2024.
Ecological Society of America, Prairie restoration and carbon sequestration: Difficulties quantifying C sources and sinks using a biometric approach. Available at https://www.researchgate.net/publication/40691972_Prairie_restoration_and_carbon_sequestratio n_Difficulties_quantifying_C_sources_and_sinks_using_a_biometrie_approach. Accessed on 5/1/2024.
EPA, Chief Information Officer’s Policy Directive on Environmental Information Quality Policy. Available at EPA IT/IM Directive: Environmental Information Quality Policy, Directive # CIO 2105.3. Accessed on 7/26/2023.
EPA, Chief Information Officer’s Policy Directive on Information Technology / Information Management: Quality Assurance Project Plan (QAPP) Standard, Directive # CIO 2105-S-02.0 Available at https://www.epa.gov/irmpoli8/quality-assurance-project-plan-qapp-standard Accessed on 7/24/2023.
EPA, EPA-454/B-17-001, Quality Assurance Handbook for Air Pollution Measurement Systems, Ambient Air Quality Monitoring Program, Volume II. Available at https://www3.epa.gov/ttnamti1/files/ambient/pm25/qa/Final%20Handbook%20Document%201_ 17.pdf. Accessed on 6/23/2023.
EPA, Fact Sheet: Areas where differences between state GHG inventories and the EPA’s Inventory of US GHG Emissions and Sinks by State: 1990-2020 estimates may occur. Available at https://www.epa.gov/system/files/documents/2022-03/fact-sheet-differences-epa-and-officalstate-ghgi.pdf. Accessed on 7/31/2023
EPA, Fuel heating values and CO2 emission factors. Available at https://www.ecfr.gov/current/title40/chapter-I/subchapter-C/part-98. Accessed on 7/26/2023.
EPA, GHGRP State and Tribal Fact Sheet. Available at https://www.epa.gov/ghgreporting/ghgrp-stateand-tribal-fact-sheet. Accessed on 5/1/2024.
EPA, Global warming potentials. Available at https://www.ecfr.gov/current/title-40/chapter-I/subchapterC/part-98/subpart-A?toc=1. Accessed on 5/1/2024.
EPA, Greenhouse Gas Equivalencies Calculator. Available at https://www.epa.gov/energy/greenhousegas-equivalencies-calculator. Accessed on 5/1/2024.
EPA, Greenhouse Gas Inventory Data Explorer. Available at https://cfpub.epa.gov/ghgdata/inventoryexplorer/#all sectors/allsectors/allgas/econsect/all Accessed on 5/1/2024.
EPA, Greenhouse Gas Reporting Program (GHGRP). Available at https://www.epa.gov/ghgreporting/data-sets. Accessed on 7/26/2023.
QAPP Short Title: METROPLAN QAPP for CPRG
Section: References
Revision No: 1 Date: 07/16/2024
Page: 37 of 44
EPA, Inventory of U.S. Greenhouse Gas Emissions and Sinks: 1990-202. Available at https://www.epa.gov/ghgemissions/inventory-us-greenhouse-gas-emissions-and-sinks-19902021. Accessed on 7/26/2023.
EPA, National Emission Inventory (NEI) Data Retrieval Tool Available at https://awsedap.epa.gov/public/single/ ?appid=20230c40-026d-494e-903f3f112761a208&sheet=5d3fdda7-14bc-4284-a9bb-cfd856b9348d&opt=ctxmenu,currsel. Accessed on 5/1/2024.
EPA, State and Tribal Greenhouse Gas Data and Resources. Available at https://www.epa.gov/ghgemissions/state-and-tribal-greenhouse-gas-data-and-resources. Accessed on 7/26/2023.
EPA, State GHG Emissions and Removals. Available at https://www.epa.gov/ghgemissions/state-ghgemissions-and-removals. Accessed on 5/1/2024.
EPA, Fuel heating values and CO2 emission factors. Available at eCFR :: 40 CFR Part 98 -- Mandatory Greenhouse Gas Reporting. Accessed on 7/26/2023.
ICLEI, LEARN (Land Emissions and Removals Navigator) Tool. Available at https://icleiusa.org/LEARN/. Accessed on 5/1/2024.
Litzsinger Road Ecology Center, Estimation of Carbon Sequestration in a Restored Tallgrass Prairie Ecosystem in Eastern Missouri. Available at https://www.litzsinger.org/research/west-haake.pdf. Accessed on 5/1/2024.
Tierra Resources, Restoration of Degraded Deltaic Wetlands of the Mississippi Delta. Available at https://tierraresourcesllc.com/wp-content/uploads/2013/12/Methodology-communications-ACRemal.pdf. Accessed on 5/1/2024.
USDA Forest Service, Greenhouse gas emissions and removals from forest land, woodlands, and urban trees in the United States, 1990-2019. Available at https://www.fs.usda.gov/research/treesearch/62418. Accessed on 7/26/2023.
US DOT, Highway Statistics Series. Available at https://www.fhwa.dot.gov/policyinformation/statistics/2021/vm1.cfm. Accessed on 7/26/2023.
University of California Cooperative Extension (UCCE), Mitigating Greenhouse Gas Emissions through Riparian Revegetation. Available at https://www.marinrcd.org/wp/wpcontent/uploads/2014/05/Creek-Carbon_Mitigating-GH-Gas-via-Rip.-Veg_UCCE.pdf. Accessed on 5/1/2024.
Appendix B: Example Check Lists of Quality Control Activities for Deliverables
Tasks and Deliverables Quality Control Procedures
Task 1. Transportation Sector GHG Inventory (Mobile Sources)
Statewide tabular inventory of GHG emissions from mobile sources with narrative report describing data sources, methodology, and documentation of QAPP implementation.
1. Comparison of (a) statewide inventory versus (b) statewide inventory developed using the EPA’s State Inventory Tool (SIT).
2. For any values used in state inventory inconsistent with values calculated using the SIT, the table below will be utilized to assess precision and bias of the statewide inventory versus SIT estimates:
Transportation Fuel State Estimate Federal Estimate Statistics*
Aviation Gasoline
Distillate Fuel
Ethanol
Jet Fuel, Kerosene Jet Fuel, Naphtha Hydrocarbon Gas Liquids
Lubricants
Motor Gasoline
Natural Gas Residual Fuel
Other
* Precision and bias calculations will be in accordance with the EPA’s Data Assessment Statistical Calculator (DASC) Tool available at https://www.epa.gov/sites/default/files/202010/dasc_11_3_17.xls with the state’s estimate taken as the measured value and the SIT value taken as the audit value.
3. Review by TL or senior technical reviewer—analytical methods and results are explained clearly, technical terms are defined, conclusions are reasonable based on information presented, and level of technical detail is appropriate.
4. Editor review—writing is clear, free of grammatical and typographical errors.
Tasks and Deliverables Quality Control Procedures
Task 2. Electric Power Generation and Consumption
Statewide tabular inventory of GHG emissions from electric power generation with narrative report describing data sources, methodology, and documentation of QAPP implementation.
1. Comparison of (a) statewide inventory versus (b) statewide federal estimate developed by the EPA.
2. For any values in the state inventory that are significantly different from federal estimates, the table below will be utilized to assess precision and bias of the state’s estimate versus the federal estimate: Electric Power Fuel State Estimate Federal Estimate Statistics* Coal Distillate Fuel Natural Gas Petroleum Coke Residual Fuel Wood Other
* Precision and bias calculations will be in accordance with the EPA’s Data Assessment Statistical Calculator (DASC) Tool available at https://www.epa.gov/sites/default/files/202010/dasc_11_3_17.xls with the state’s estimate taken as the measured value and the SIT value taken as the audit value.
Ensure the GWPs used for the state estimate and the federal estimate are on the same basis. For example, the SIT tool uses AR5 GWP (e.g., methane GWP = 28).
3. Technical review of methods, calculations, and underlying datasets—data are appropriate for intended use, data are complete and representative and current, data sources documented, analytical methods are appropriate, and calculations are accurate.
4. Review by TL or senior technical reviewer—analytical methods and results are explained clearly, technical terms are defined, conclusions are reasonable based on information presented, and level of technical detail is appropriate)
5. Editor review—writing is clear, free of grammatical and typographical errors.
Tasks and Deliverables Quality Control Procedures
Task 3. Natural and Working Lands and Forestry
Statewide tabular inventory of GHG emissions and sinks from natural and working lands and forestry with narrative report describing data sources, methodology, and documentation of QAPP implementation.
1. Comparison of (a) statewide inventory versus (b) statewide inventory developed using the EPA’s State Inventory Tool (SIT).
2. For any values used in state inventory inconsistent with values calculated using the SIT, the table below will be utilized to assess precision and bias of the statewide inventory versus SIT estimates:
Natural and Working Lands and Forestry
Component State Estimate SIT Estimate Statistics*
Net Forest Carbon Flux
Urban Trees
Landfilled Yard Trimmings Food Scraps
Forest Fires
N2O from Settlement Soils
Agricultural Soil Carbon Flux
Other
* Precision and bias calculations will be in accordance with the EPA’s Data Assessment Statistical Calculator (DASC) Tool available at https://www.epa.gov/sites/default/files/202010/dasc_11_3_17.xls with the state’s estimate taken as the measured value and the SIT value taken as the audit value.
3. Technical review of methods, calculations, and underlying datasets—data are appropriate for intended use, data are complete and representative and current, data sources documented, analytical methods are appropriate, and calculations are accurate.
4. Review by TL or senior technical reviewer—analytical methods and results are explained clearly, technical terms are defined, conclusions are reasonable based on information presented, and level of technical detail is appropriate)
5. Editor review—writing is clear, free of grammatical and typographical errors.
Tasks and Deliverables
Task 4. State Inventory of GHG Emissions from
Statewide tabular inventory of GHG emissions from the state’s major industrial, sources with narrative report describing data sources, methodology, and documentation of QAPP implementation.
Other Major Sectors
1. Comparison of (a) statewide inventory versus (b) statewide inventory developed using the EPA’s State Inventory Tool (SIT).
2. For any values used in state inventory inconsistent with values calculated using the SIT, the table below will be utilized to assess precision and bias of the statewide inventory versus SIT estimates:
Fuels and Feedstocks for Other Major Sectors State Estimate SIT Estimate Statistics*
Asphalt and Road Oil
Aviation Gasoline Blending Components
Coal
Coking Coal
Crude Oil
Distillate Fuel
Feedstocks, Naphtha less than 401 F
Feedstocks, Other Oils greater than 401 F
Hydrocarbon Gas Liquids
Kerosene
Lubricants
Misc. Petro Products
Motor Gasoline
Motor Gasoline Blending Components
Natural Gas
Pentanes Plus
Petroleum Coke
Residual Fuel
Special Naphtha
Still Gas
Unfinished Oils
Waxes
Wood
Other
* Precision and bias calculations will be in accordance with the EPA’s Data Assessment Statistical Calculator (DASC) Tool available at https://www.epa.gov/sites/default/files/202010/dasc_11_3_17.xls with the state’s estimate taken as the measured value and the SIT value taken as the audit value.
3. Technical review of methods, calculations, and underlying datasets—data are appropriate for intended use, data are complete and representative and current, data sources documented, analytical methods are appropriate, and calculations are accurate.
4. Review by TL or senior technical reviewer—analytical methods and results are explained clearly, technical terms are defined, conclusions are reasonable based on information presented, and level of detail appropriate.
5. Editor review: writing is clear, free of grammatical and typographical errors.
Tasks and Deliverables Quality Control Procedures
Task 5. State Inventory of GHG Emissions from Minor Sectors
Statewide tabular inventory of GHG emissions from the state’s minor sectors with narrative report describing data sources, methodology, and documentation of QAPP implementation.
1. Comparison of (a) statewide inventory versus (b) statewide inventory developed using the EPA’s State Inventory Tool (SIT).
2. For any values used in state inventory inconsistent with values calculated using the SIT, the table below will be utilized to assess precision and bias of the statewide inventory for minor sectors versus SIT estimates: Fuels and Feedstocks for Other Major Sectors State Estimate SIT Estimate Statistics*
Asphalt and Road Oil
Aviation Gasoline Blending Components
Coal
Coking Coal
Crude Oil
Distillate Fuel
Feedstocks, Naphtha less than 401 F
Feedstocks, Other Oils greater than 401 F
Hydrocarbon Gas Liquids
Kerosene
Lubricants
Misc. Petro Products
Motor Gasoline
Motor Gasoline Blending Components
Natural Gas
Pentanes Plus
Petroleum Coke
Residual Fuel
Special Naphtha
Still Gas
Unfinished Oils
Waxes
Wood
Other
* Precision and bias calculations will be in accordance with the EPA’s Data Assessment Statistical Calculator (DASC) Tool available at https://www.epa.gov/sites/default/files/202010/dasc_11_3_17.xls with the state’s estimate taken as the measured value and the SIT value taken as the audit value.
3. Technical review of methods, calculations, and underlying datasets—data are appropriate for intended use, data are complete and representative and current, data sources documented, analytical methods are appropriate, and calculations are accurate.
4. Review by TL or senior technical reviewer—analytical methods and results are explained clearly, technical terms are defined, conclusions are reasonable based on information presented, and level of detail appropriate.
5. Editor review: writing is clear, free of grammatical and typographical errors.
Appendix C: Compliance with Requirements Under the Privacy Act of 1974
Note about Personally Identifiable Information (PII)
The Privacy Act of 1974 (5 U.S.C. § 552a) mandates how federal agencies maintain records about individuals. Per OMB Circular A-130, Personally Identifiable Information (PII) is "information that can be used to distinguish or trace an individual’s identity, either alone or when combined with other information that is linked or linkable to a specific individual."
EPA systems/applications that collect PII must comply with EPA's Privacy Policy and procedures to guard against unauthorized disclosure or misuse of PII in all forms. For more information click here. If PII are collected, then the QAPP will describe how the PII are managed and controlled.
Personally identifiable information (PII):
Please verify one of the following two options by checking the corresponding box:
1. This project will not collect Personally Identifiable Information (PII):
2. This project will collect Personally Identifiable Information (PII):
This QAPP will comply with 5 U.S.C. § 552a and EPA’s Privacy Policy.