
Brought to you by www.jacketmediaco.com The Manufacturing & Business Podcast Network LISTEN TO OUR PODCASTS AT: OUR PODCASTS: NOVEMBER ISM PMI: 49% Released December 1st -The Full Executive Summary Report On Business - Page 16 [ ECONOMIC OUTLOOK: MANUFACTURING 2023 CASS FREIGHT INDEX REPORT PAGE 14 NORTH AMERICA OUTLOOK PAGE 20 ASIA OUTLOOK PAGE 26 AEROSPACE OUTLOOK PAGE 34 CYBER SECURITY OUTLOOK PAGE 44 PAGE 10


3 Manufacturing Outlook / December 2022 MANUFACTURING TALK RADIO PODCAST (MFGTALKRADIO.COM) Streaming New Shows Every Week (Over 1,000 Shows Since 2013) Listen To The Experts And Their Guests Host Tim Grady Host Lew Weiss Listen to our entire family of podcasts at jacketmediaco.com
© 2022 Jacket Media Co. No part of this publication may be reproduced or used in any form without the prior written permission of the publisher. Manufacturing Outlook is a registered trademark of Jacket Media Co.
4 Manufacturing Outlook / December 2022
Creative
Writers
CHRIS
LESLIE
CHRIS
CHRISTINE
KEN
Production Manager LINDA
Advertising ADVERTISE@MFGTALKRADIO.COM Editorial Office
TABLE OF CONTENTS What Recession? by Lewis A. Weiss PUBLISHER’S STATEMENT 5 Spotlight on Peru by Royce Lowe SOUTH AMERICA OUTLOOK 24 Where Have All The Cars Gone? by Royce Lowe AUTOMOTIVE OUTLOOK The Vertiport, and the Moon by Royce Lowe AEROSPACE OUTLOOK 34 Energizing Africa by Royce Lowe ENERGY OUTLOOK 36 Global PMI At A 29 Year Low by Royce Lowe MANUFACTURING OUTLOOK 6 Firewalls, VPNs, and Doing As the Romans Do by Ken Fanger CYBER SECURITY OUTLOOK 44 ISSUES OUTLOOK 46 Fruitful Training by Royce Lowe MATERIALS OUTLOOK 38 Batteries in the Round by Royce Lowe Open call for... Contributing Writers for new and existing content. Let’s start a conversation –Contact us at info@jacketmediaco.com ISM MANUFACTURING REPORT ON BUSINESS 16 The Manufacturing PMI is 49% 10 COVER STORY: ECONOMIC OUTLOOK: MANUFACTURING 2023 Options to Build a Multi-Channel Revenue Stream by Leslie MacAskill Decoupling? What We Have Is Reverse and Diverse Coupling. The Semiconductor Industry Readjusts by Christine Casati ASIA OUTLOOK 26 by Chris Anderson EUROZONE OUTLOOK 31 Insights From Inside Manufacturing In Action MANUFACTURING TIDBITS Keeping up with change has been a full-time task for manufacturers during the past five years. by Lewis Weiss PICK UP THE PACE 32 42 Cass Transportation Systems NORTH AMERICAN OUTLOOK 20 by Dr. Chris Kuehl 2023 Outlook for Cross First and Banking in General CASS FREIGHT INDEX® REPORT BY CASS INFORMATION SYSTEMS INC. 14 US Cutting Tool Orders Totaled $200.6 Million in October by USMTO MACHINE TOOL OUTLOOK 40
Publisher LEWIS A WEISS Editor in Chief TIM GRADY
Director CRAIG ROVERE Contributing
ROYCE LOWE
KUEHL
MACASKILL
ANDERSON
CASATI
FANGER
HOPLER
JACKET MEDIA CO. 75 LANE ROAD FAIRFIELD, NJ 07004 (973) 808-8300
What Recession?
The usual economic indicators have become skewed post-Pandemic. We are watching a 6-month long yield inversion in Treasury bonds, and softening of the ISM PMI and the JP Morgan Global PMI – both now under 50, but many manufacturing industry sectors are still strong. The addition of 263,000 jobs in November that pushed manufacturing employment to 12,394,000 – the highest since 1984, has not been shaken by the Fed rate hikes. Several tech sector companies are adjusting their payrolls as they adjust their business models, and other large corporate titans are allowing attrition to reduce head count, but we are not seeing Draconian drops in employment.
It is possible that a recession could be soft and short – it has happened in the past, and there is some discussion around that becoming more likely. Inflation is cooling, albeit slowly, and the Fed is talking about less aggressive rate hikes. Consumer confidence is one measure to watch because consumers comprise 70% of spending in the economy.
Each month, we interview Dr. Chris Kuehl on Manufacturing Talk Radio about ASIS, the Armada Strategic Intelligence System that forecasts the growth or decline of manufacturing activity. For the near-term, it is showing a recovery toward growth in 2023. We encourage our readers to subscribe to this monthly reporting system because the usual indicators are difficult to use to predict the near-term. His firm, Armada Corporate Intelligence, also publishes the Flagship Report three times each week as a flash update of conditions at hand. You can also read his North America Outlook in this issue.
The Manufacturing Talk Radio podcast has been available for 10 years and is expanding into an old but powerful communications medium – terrestrial radio. WLEA in Hornell, New York is leading the way, attracting thousands of new listeners to their drive-time broadcast and website, where listeners can access the show at their convenience. Other radio stations are being added through syndication.
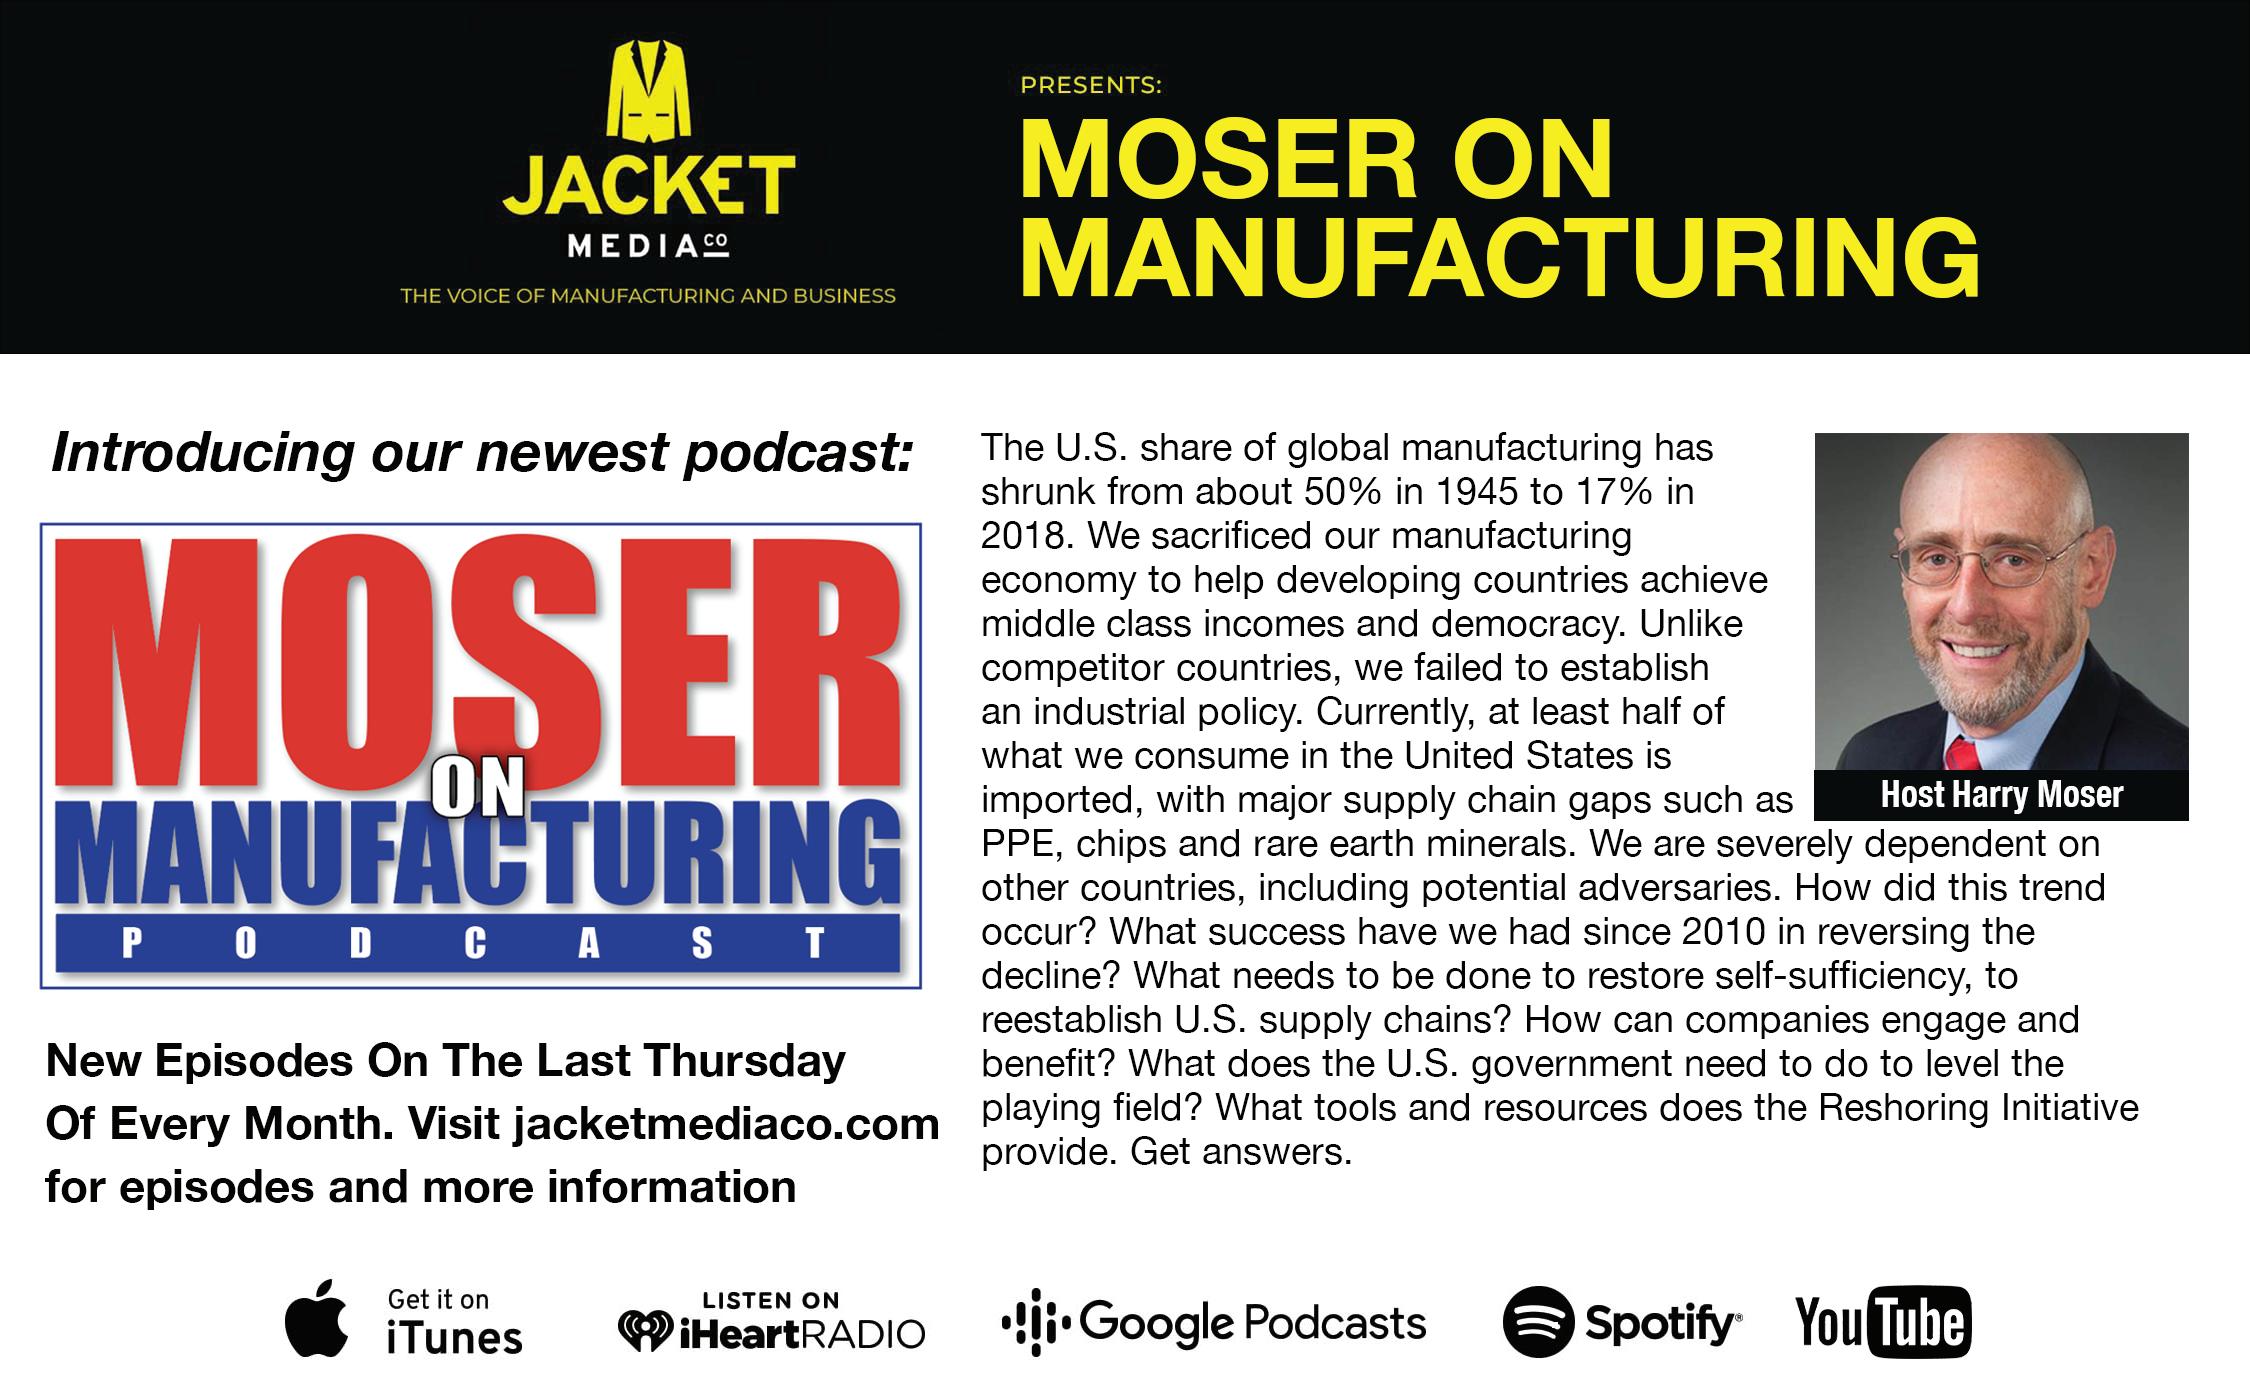
The Manufacturing Talk Radio podcast includes several shows, including myself and Tim Grady hosting Manufacturing Talk Radio, Dr. Chris Kuehl discussing the Flagship Report and ASIS, Cliff Waldman compering Cliff Notes, and Harry Moser presenting Moser on Manufacturing. In addition to current topics, various evergreen and relevant shows from the back catalog will be available to AM and FM broadcasters. Upcoming and previous shows include guests from manufacturers, think tanks, service and software providers, industry thought leaders, university academics, senior executives from government agencies, senators, and House Representatives, each discussing facets of the industry underpinning the American economy.
The Manufacturing Outlook Ezine and the Manufacturing Talk Radio Podcast are two sources of industry-leading information provided to listeners and viewers to keep them ahead of the curve with forward-looking, forward-thinking content. The ezine subscription is free, and the podcast show content can be heard on Google Play, Apple Podcasts, Spotify, Blubrry, iHeartRadio, and many listening apps users choose as their personal podcast preference. n


Lewis A. Weiss, Publisher

Contact laweiss@mfgtalkradio.com for comments, suggestions and ideas and guest requests for MFGTALKRADIO.COM podcast or any of our podcasts.


5 Manufacturing Outlook / December 2022 PUBLISHERS STATEMENT
FOLLOW US:
SUBSCRIBE
MANUFACTURING OUTLOOK

GLOBAL
PMI AT 29-YEAR LOW. STILL IN CONTRACTION. DEMAND, INTERNATIONAL TRADE, BUSINESS CONFIDENCE STILL SLIDING. US MANUFACTURING, AND THAT OF MANY COUNTRIES, IN CONTRACTION.
By: Royce Lowe
Manufacturing is not looking to show any improvement in the near future. Projections from the ASIS Intelligence Report - as mentioned here last month - are an upcoming recession of
some six months duration, through to early- to mid-2023. Considering the dip in the last two major recessions, that of 2008-2209 and the pandemic recession, as a twenty-point dip, the
latest will more likely represent a ten-point dip. The ensuing recovery will manifest through the latter part of 2023, into early 2024.
With a current price of $628 per ton for hot-rolled coil, steelmakers U.S. Steel, Cleveland Cliffs, and Nucor in the U.S. bumped their prices at the end of November by $60 per ton, targeting base pricing of $680-700 per ton; Stelco and Dofasco upped theirs by $80 per ton. Cold-rolled coil and hot dip galvanized in the U.S. were raised to $950 per ton. Futures prices for HR coil are $671 for December; $725 for January; $740 for February, and $740 for March.
6 Manufacturing Outlook / December 2022 MANUFACTURING OUTLOOK
continued
There were some significant increases during November in the prices of non-ferrous metals. Aluminum went from $1.12 per lb to $1.22, copper from $3.48 to $3.75, nickel from $10.5 to $12.2, and zinc from $1.26 to $1.38. This pricing is the first time we have seen such increases in some months, and it may be a temporary reaction to reduced inventories.
The year 2023, according to the Economist Intelligence Unit, will see global sales of new cars up by just 1%, but those of EVs by 25%, as China backs down on plans to scrap tax breaks. The U.S. increases its defense budget to $800 bn, or three times that of China. The energy crisis will deteriorate in 2023, with Europe feeling the brunt.
All predictions could be reduced in large part depending on China’s performance in the realms of lockdowns and its property market. There could be reduced demand in China, which would not augur well for the countries that depend on China for a good portion of their business.
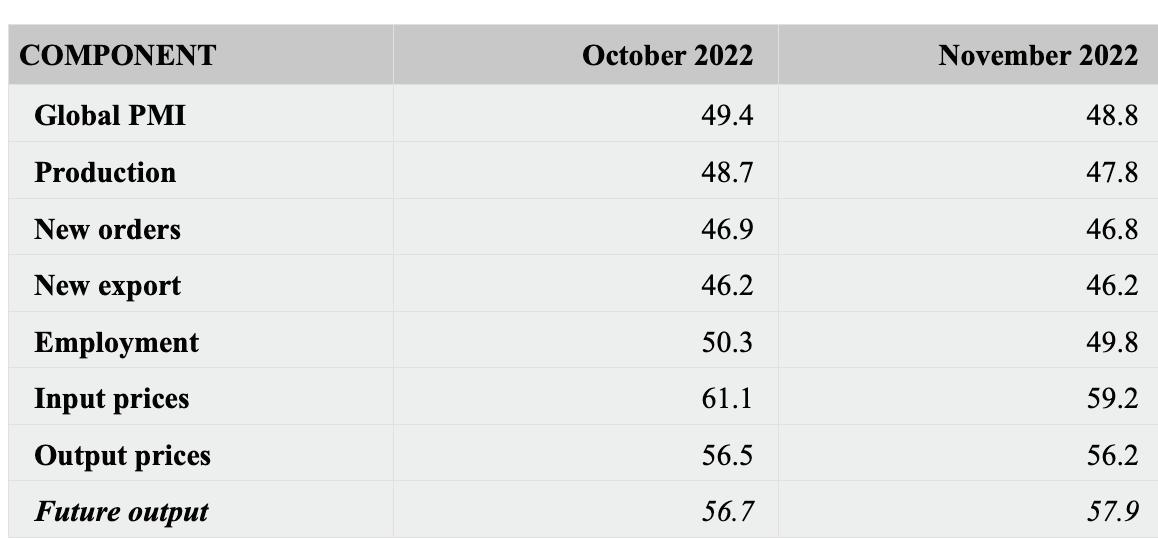
The JP MORGAN GLOBAL MANUFACTURING PMI – a composite index produced by JPMorgan and S & P Global in association with ISM and IFPSM (International Federation of Purchasing and Supply Management) – fell from 49.4 in October to 48.8 in November. This is a 29-year low, which is rather astonishing considering the impact of the pandemic and shutdowns on economies around the world.
The downturn intensified in November as production and new orders fell at faster rates. Production fell in all three categories, with the worst being in intermediate goods, along with relatively mild downturns in consumer and investment goods. Although there was a slight increase in business optimism, it is still at one of its lowest levels outside the pandemic-affected months of early 2020.
November survey data also highlighted several potential headwinds for the sector during the coming months. New order intakes fell for the fifth month running and to the greatest extent in two-and-a-half years. International trade also retreated further, posting a decline for the ninth successive month.
continued
7 Manufacturing Outlook / December 2022 MANUFACTURING OUTLOOK
The Bureau of Economic Analysis says the U.S. Real Gross Domestic Product increased at an annual rate of 2.9% in the third quarter, according to the second estimate. This was following a decrease of 0.6% in the second quarter of 2022.
Conflicting reports show November new auto sales up 10.8% year-overyear. Toyota’s figures are up 10%, Subaru 52%, Hyundai 43%, Kia 25%, and Mazda 31%. Honda was down 6.1%. Demand still exceeds supply, but this situation is improving. Western European car sales were up 14.7% year-over-year in October. The sales forecast for 2022 is for 9.91 million vehicles, and 11.01 million for 2023. China vehicle sales (including commercial) were up 6.9% year-over-year in October, at 2.505 million units. Total plug-in sales for the month were just under 580,000, up 75% year-overyear.
GLOBAL CRUDE STEEL PRODUCTION WAS UNCHANGED YEAR-OVER-YEAR IN THE MONTH OF OCTOBER for the 64 reporting countries – which represent 98 percent of world crude steel production – to 147.3 million tons (MT). Production for the first ten months was down 3.9% year-over-year, at 1,552.7 million tons. The global production of primary aluminum continued at its normal pace in September, with China producing almost 60% of the 5.850 MT total.
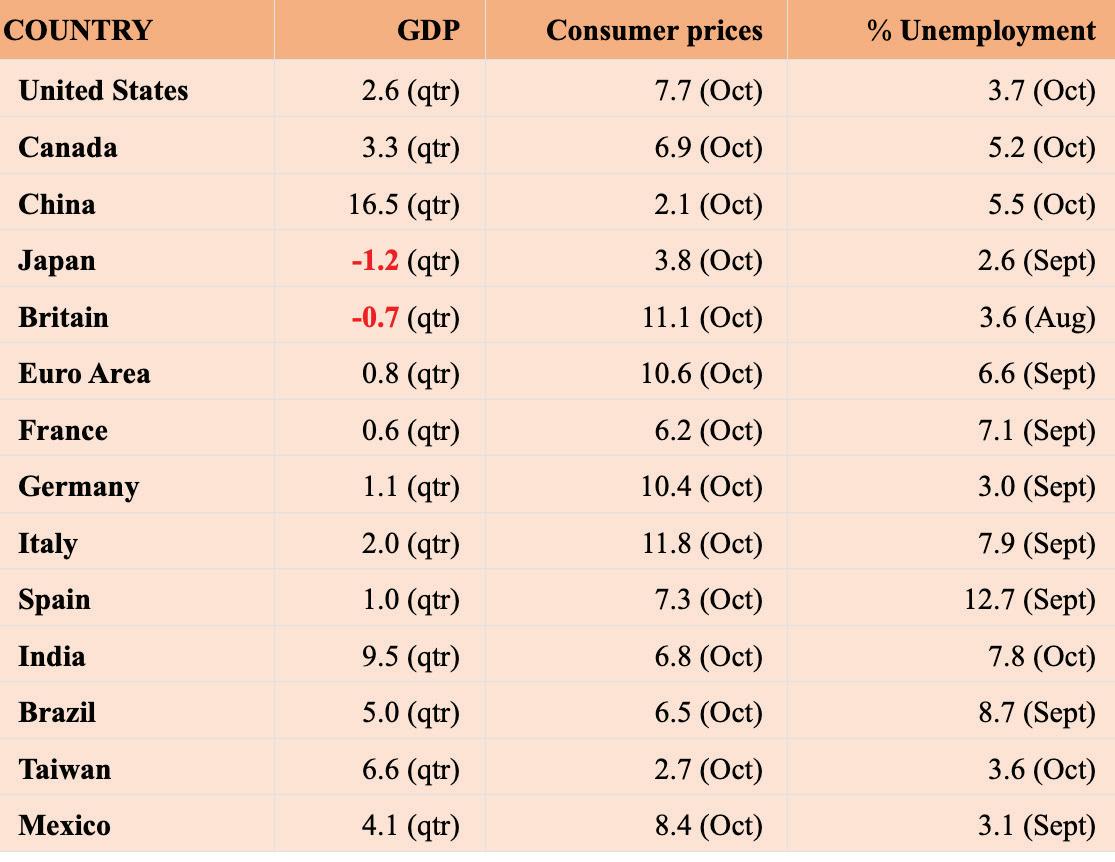
THE ECONOMIST magazine, in its latest weekly report on world economies, highlights changes in Gross Domestic Product (GDP), Consumer Prices, and Unemployment Rates for what it considers the world’s major economies. These data are not neccontinued
8 Manufacturing Outlook / December 2022
MANUFACTURING OUTLOOK
essarily good to the present day, but are mostly applicable to the past two months, and show definite trends in the world economy. The figures are qualified as being the latest available, and with reference to a given quarter or month. The figures for GDP represent the percent change on the previous quarter, or annual rate.
The consumer price increases represent year-over-year changes. The unemployment percentage figures are for the month as noted.
Author profile: Royce Lowe, Manufacturing Talk Radio, UK and EU International Correspondent, Contributing Writer, Manufacturing Outlook. n


9 Manufacturing Outlook / December 2022
MANUFACTURING OUTLOOK
Economic Outlook Manufacturing 2023
by Leslie MacAskill
As 2022 calendars run out of pages, U.S. manufacturers, suppliers, and others intently focus on the outlook for 2023. The Institute for Supply Management’s November report shows that new orders are contracting even as prices drop and raw material inventories grow. U.S. manufacturing activity slipped in November for the first time in 2.5 years, and the production index also registered a slight

decrease. However, six industries reported growth, compared to twelve that contracted. The winners include:
• Apparel, leather, and allied products
• Nonmetallic mineral products
• Primary metals
• Miscellaneous manufacturing
• Petroleum and coal
• Transportation equipment
Why is the health of U.S. manufacturing so important?
Manufacturing in the U.S. contributes over $2.3 trillion in GDP and employs more than 12 million workers. In addition, manufacturing companies account for 70 percent of the spending on business-related research and development and provide 60 percent of U.S. exports. While the overall manufacturing sector has been soft
10 Manufacturing Outlook / December 2022 continued
COVER STORY
for some time compared to the broader economy, experts at consultant McKinsey believe that opportunities for growth and advancement are both ample and critical to be implemented. The McKinsey analysis indicates that strengthening manufacturing overall could improve the earnings prospects for millions of middle-skill workers while reducing the U.S. trade deficit. What is the outlook for U.S. manufacturers heading into 2023?
How can we analyze the impact of diverse variables like rising interest rates, supply chain hiccups, and customer fears to assess the overall potential for manufacturing in the new year?
Consider the forecast from the International Monetary Fund, which anticipates minimal worldwide economic growth in 2023 of 2.7 percent. On a regional basis, the IMF expects economic activity to decelerate in the Western Hemisphere throughout 2023. However, this news is somewhat tempered by the expectation that monetary policy will succeed in slowing inflation. Similarly, consultant Deloitte forecasts limited growth for overall U.S. manufacturing activity in 2023.
To examine the underlying causes in more detail, we can focus on some contributing factors for closer attention:
Interest rates
According to Mark Zandi with Moody’s Analytics, the consecutive interest rate hikes are now hitting manufacturing after first slowing construction activity. Zandi notes: “Up until now, the manufacturing base has had a number of tailwinds. Now, all those tailwinds will soon start to turn into headwinds. Manufacturing is kind of treading water at this point, losing steam, and will be in recession shortly.”
Combined with the rise of the U.S. dollar, which makes exports less competitive, manufacturers are wisely concerned about the orders for next year. The Federal Reserve aims to slow growth, hopefully without tipping the economy or any sectors into recession. Moreover, slower growth should ease the runaway inflation of the last year by curbing demand for goods.
The trick for the Federal Reserve is finding that sweet spot, and whether they can reach equilibrium next year
remains to be seen. However, Forbes contributor Bill Conerly suggests that they have already overshot the mark, triggering a slowdown that could veer into recession unless they change course.
But inflation is no panacea, particularly when it affects the housing market. Whether potential buyers are scared off by high interest rates or rising prices for homes, a soft housing market can drag down the entire economy, including manufacturing. Michael Hicks, director of the Center for Business and Economic Research at Ball State University, notes that rising interest rates reduce demand and increase operational expenses. “Just as we think we were coming out of the supply chain problems, interest rates start rising,” Hicks said. He notes that even if the Fed can hit the target of a “softish” landing with marginal economic growth, manufacturing and housing will likely be sluggish. Hicks concludes that neither consumers nor producers should have high hopes going into 2023.
Interest rate increases can also disrupt inventory management, which is already hampered by supply chain disruptions. Daniel Son, head of
11 Manufacturing Outlook / December 2022 COVER STORY
Global Banking at U.S. Bank, points out that when interest rates rise, companies reduce inventory to avoid increasing carrying costs for the stock they haven’t sold. This reaction can stall efforts to resolve supply issues.
Supply chain disruption. Forbes Magazine manufacturing guru Dave Evans recently noted that supply chain disruptions preceded the COVID-19 pandemic and have since been exacerbated by other local and world events. Therefore, it would be foolhardy to think that easing the pandemic will end the disruptions. Instead, Evans suggests that manufacturers should incorporate the potential for disruption into their planning, developing a more agile supply chain. He notes that companies that can create a flexible chain that includes supplier diversification and strategic contingency planning
will enjoy a competitive advantage over their rivals.
One potential impact of this focus is fueling the trend toward outsourced manufacturing by U.S. companies. The 2022 State of Manufacturing Report (from analyst Fictiv) noted that almost half of respondents reported increasing their outsourcing in 2022, while three-quarters of those surveyed cite the benefits of quality, speed, efficiency, and pricing as reasons to consider the option.
The National Association of Manufacturers states that supply chain disruptions will continue through 2023, citing continued pandemic lockdowns, blocked shipping lanes, container scarcity, military conflicts (like Ukraine), widespread weather issues, and material shortages. However, NAM points out that organiza-
tions are looking for ways to reduce interruptions by expanding their sources and reducing the complexity of their networks. Adding to the concern about contingency planning and resilience, NAM reports that 73 percent of manufacturing companies that responded to their questions expressed concern about the overall stability of their supply chains.
The NAM review cited planned improvements to the digitization of supply chains as the most common plan for remediation. However, manufacturers are facing some challenges in adopting digital technology, including:
• Lack of ability in partner organizations
• Mismatched data platforms
• Need for upgraded equipment
• Lack of employee skills
As manufacturers continue to seek improvements in the supply chain, two standard approaches being adopted are the development of local capacity and a shift from “just-intime” inventory to redundant sourcing.
Ukraine war
As some manufacturing sectors started to recover from the supply concerns caused by covid, many took an unexpected hit from the Russian attack on Ukraine, which has degraded the global supply of steel and commodities used in the critical production of semiconductors and other products. Furthermore, the sanctions levied against Russia and the resulting decrease in the ruble’s value have hindered Russia’s ability to buy at its typical levels. While Russia usually is a net exporter of commodities, it is a net importer of manufactured items and components. New car imports to Russia, in addition to automo -

12 Manufacturing Outlook / December 2022 MANUFACTURING TIDBITS continued
bile assembly parts, are dropping. Ukraine is a much smaller market but is a customer of U.S. transportation equipment, machinery, and mechanical appliances.
Is there any solution?
Deloitte suggests that successful manufacturers in 2023 will enact some changes to assure their continued viability. The consultant applauds the digitization trend and recommends investing in other advanced manufacturing technologies. Also, Deloitte notes that despite aggressive hiring over the past year, manufacturing companies still have record-high openings. To compete, companies will need to refine their recruitment and retention strategies.
Forbes, which highlighted the move toward digital transformation, sug-
gests that it’s vital for manufacturers to pursue not only the digitization of their supply chain but other technologies that will provide a competitive edge. These advances include artificial intelligence, virtual and augmented reality, blockchain, and faster network computing capabilities. Technology can not only improve manufacturing processes, but it’s also necessary for customer service, product enhancements, and marketing.

One example is the emerging IIOT (Industrial Internet of Things) which features interconnected devices used to collect data throughout the manufacturing process. These high-tech sensors help manufacturers optimize performance, reduce interruptions, and predict when things will go awry. McKinsey reports that adopters of digital technology overall are enjoy-
ing improvements in sustainability, productivity, agility, and speed-tomarket.
In any economic cycle, there are winners and losers. In 2023, those who want to win need to be more technologically savvy than their competitors and be bold about incorporating modernization into their processes.
About the Author Leslie MacAskill is a Harvard-educated professional with over 30 years of experience writing and editing in diverse business and political environments. n

13 Manufacturing Outlook / December 2022 MANUFACTURING TIDBITS
by CASS INFORMATION SYSTEMS, INC.
Cass Transportation Index Report
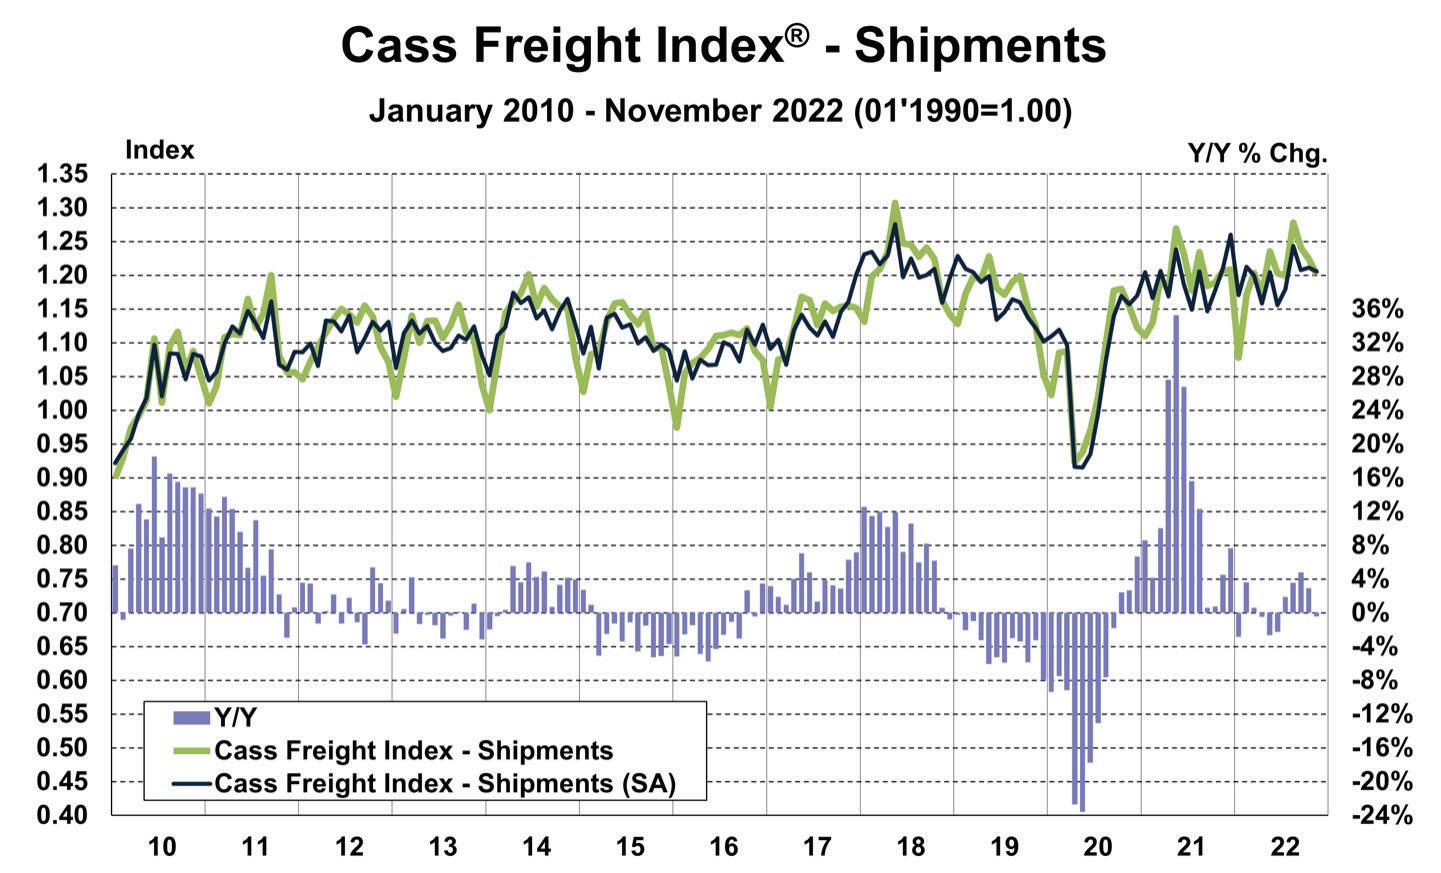
Cass Freight Index - Shipments
The shipments component of the Cass Freight Index® fell 0.4% y/y in November. On a m/m basis, the index fell 1.9%, or 0.5% on a seasonally adjusted (SA) basis.
After some noise in recent months related to comparisons and other temporary factors like repositioning mistimed inventory, and consumers getting ahead of rising interest rates, freight volumes settled back to a flattish level in November versus a year ago.

Still a very stable environment overall, but still one with many headwinds.
Sharpening declines in imports, into
the West Coast in particular, suggest near-term trends could soften further. Normal seasonality from here would have shipments down 5% y/y in December and about flat for the year.
Freight Expenditures
The expenditures component of the Cass Freight Index, which measures the total amount spent on freight, rose 4.7% y/y in November, slowing from an 11.1% increase in October.
Expenditures rose 1.8% m/m after a 4.9% drop in October. Against a shipment decline of 1.9% m/m in November, we can infer that rates overall were up 3.7%. The increase in rates m/m appears mainly due to changes in modal mix.
On an SA basis, expenditures rose 3.9% m/m in November, with shipments down 0.5% m/m and rates up 4.4%.
This index includes changes in fuel, modal mix, intramodal mix, and accessorial charges, so is a bit more volatile than the cleaner Cass Truckload Linehaul Index®.
Following normal seasonality from here, this index is now likely to be flattish on a y/y basis in December and end the year with a 23% increase.
Inferred Freight Rates
The slowdown in freight rates continued this month, with the rates embedded in the two components of the Cass Freight Index® slowing to
14 Manufacturing Outlook / December 2022 CASS INDEX OUTLOOK
This CASS INDEX has been posted
the
of Cass Information Systems, Inc. continued
with
permission
5.1% y/y growth in November, from 7.9% y/y growth in October.
Cass Inferred Freight Rates rose 3.7% m/m (4.4% SA) in November, essentially reversing the decline in October. After considerable noise from fuel prices, which remain elevated, and modal mix, we see the decline as the result of the looser freight market supply/demand balance, and a downturn is nearing on a y/y basis.
The supply/demand balance in U.S. trucking markets has loosened significantly this year, and as a result freight rates are leveling off and set to soften further in the months to come.
The normal seasonal pattern would have this index turning down on a y/y basis in February 2023, but it could happen sooner given market conditions.
Shippers are starting to see real savings and considerable cost relief is now likely for 2023, which should be increasingly positive news for the complex inflation picture.
Cass Inferred Freight Rates are a simple calculation of the Cass Freight Index data—expenditures divided by shipments—producing a data set that explains the overall movement in cost per shipment. The data set is
diversified among all modes, with truckload representing more than half of the dollars, followed by LTL, rail, parcel, and so on.
Truckload Linehaul Index
The downtrend in truckload linehaul rates completed its sixth month in November, as the Cass Truckload Linehaul Index slowed to a 1.7% y/y increase from 2.0% in October.
On a m/m basis, the Cass Truckload Linehaul Index fell 1.2% after a 1.5% decline in October.
The index seems likely to stay positive on a y/y basis in December but will likely start declining in January.
As a broad market indicator, this index includes both spot and contract freight, and with spot rates already down significantly, the larger contract market is likely to continue adjusting down more gradually but in the same direction.
Freight Expectations
To mix it up from our usual freight market discussion in this last month of the year, we’d like to address a question that arose after Tesla recently announced its first 500-mile journey in a Semi electric tractor with an 81,000-lb. load.
We broke down the Cass database by mode and mileage to see specifically what proportion of shipments in each mode fall into each mileage bucket, and the results are below. While we’d of course love smaller buckets, the chart below represents an excellent sample of about 120 million shipments.
In the dry van truckload market, the heart of the industry where the Semi is targeted, about 47% of shipments are under a 450-mile length of haul. Just 4% of shipments are under 150 miles, and another 25% are under 300 miles. We have to slice our 301-600 mile bucket to answer the question, and we’ll err on the side of caution considering the 500-mile range seems more like a stretch than a normal operation and take half of that 37% bucket. Adding it up, about 47% of dry van shipments are likely addressable by the Semi.
In the reefer, or temp-controlled, truckload market, about 40% of shipments are under a 450-mile length of haul. A larger share, 12% of shipments are under 150 miles and 15% are 150-300 miles. But with more long-haul, we estimate using the same logic as above that 41% of the reefer market is under 450-miles, and with refrigeration energy to account for, a lower threshold is appropriate, though the reefer unit makers have creative ways to support electrification as well. About 40% of LTL is under the 450-mile threshold as well.
We expect the more local shipments, like snacks and drinks, to be the first to electrify, and even though payback periods for EVs have fallen this year as diesel prices surge and inventories remain fairly tight, the overall economics haven’t improved much because of higher electricity and battery costs, though the $40k per unit incentive in the Inflation Reduction Act helps. n
15 Manufacturing Outlook / December 2022 CASS INDEX OUTLOOK

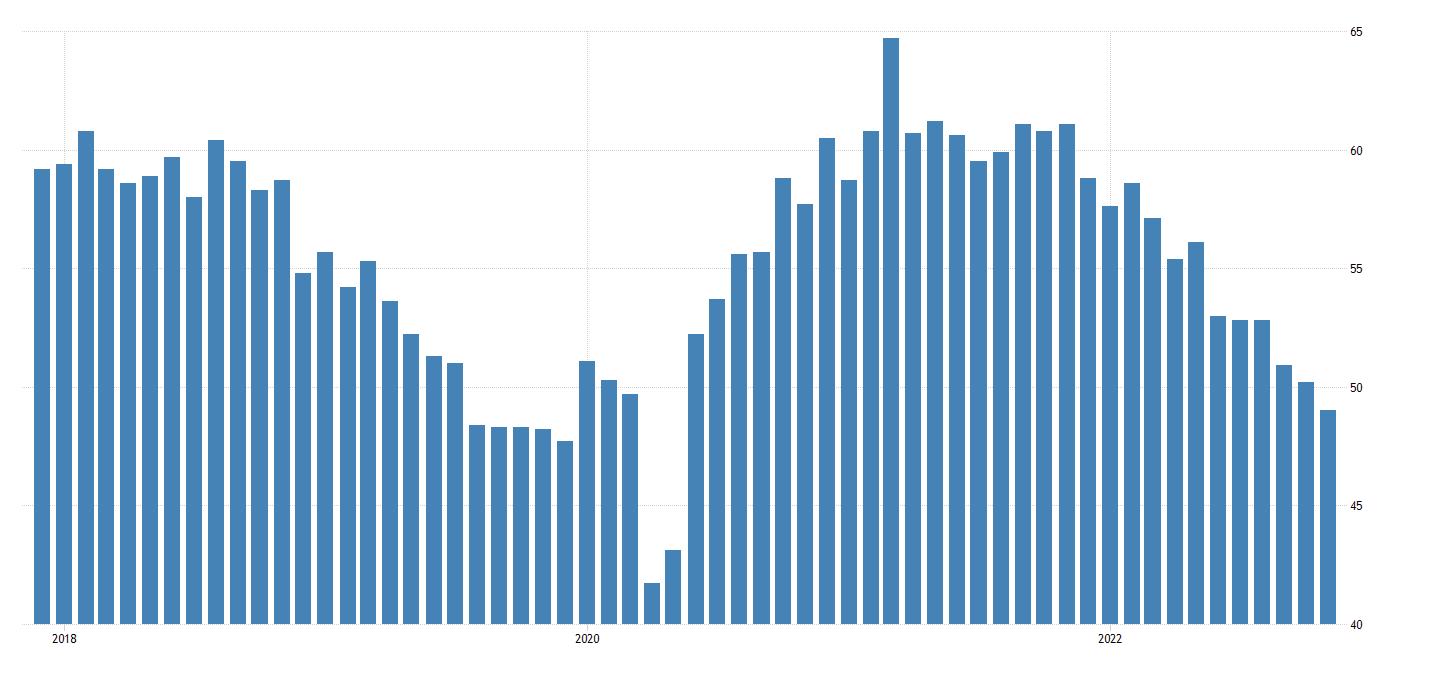
16 Manufacturing Outlook / December 2022 THE INSTITUTE FOR SUPPLY MANAGEMENT’S MANUFACTURING REPORT ON BUSINESS® BREAKING NEWS ISM PMI at 49% for November 2022 ISM REPORT OUTLOOK NOVEMBER 2022 49% Released December 1st ISM PMI for the past 5 years Expanding Contracting continued
reportonbusiness
Economic activity in the manufacturing sector contracted in November for the first time since May 2020 after 29 consecutive months of growth, say the nation’s supply executives in the latest Manufacturing ISM® Report On Business®
The November Manufacturing PMI® registered 49 percent. Regarding the overall economy, this figure indicates expansion for the 30th month in a row after contraction in April and May 2020. The Manufacturing PMI® figure is the lowest since May 2020, when it registered 43.5 percent. The New Orders Index remained in contraction territory at 47.2 percent, 2 percentage points lower than the 49.2 percent recorded in October. The Production Index reading of 51.5 percent is a 0.8-percentage point decrease compared to October’s figure of 52.3 percent. The Prices Index registered 43 percent, down 3.6 percentage points compared to the October figure of 46.6 percent; this is the index’s lowest reading since May 2020 (40.8 percent). Managing head counts and total supply chain inventories remain primary goals. Order backlogs, prices and now lead times are declining rapidly, which should bring buyers and sellers back to the table to refill order books based on 2023 business plans. Six manufacturing industries reported growth in November, in the following order: Apparel, Leather & Allied Products; Nonmetallic Mineral Products; Primary Metals; Miscellaneous Manufacturing‡; Petroleum & Coal Products; and Transportation Equipment. ISM
‡Miscellaneous Manufacturing (products such as medical equipment and supplies, jewelry, sporting goods, toys and office supplies).
Analysis by Timothy R. Fiore, CPSM, C.P.M. Chair of the Institute for Supply Management® Manufacturing Business Survey Committee
PMI® at 49% MANUFACTURING
The U.S. manufacturing sector contracted in November, as the Manufacturing PMI® registered 49 percent, 1.2 percentage points below the reading of 50.2 percent recorded in October. After five months of flat or marginally positive change, the decrease last month took the Manufacturing PMI® into contraction. Of the five subindexes that directly factor into the Manufacturing PMI®, two (Production and Inventories) were in growth territory, though both eased.
Manufacturing at a Glance
INDEX
Nov Index Oct Index % Point Change
Direction Rate of Change Trend* (months)
Manufacturing PMI® 49.0 50.2 -1.2 Contracting From Growing 1 New Orders 47.2 49.2 -2.0 Contracting Faster 3 Production 51.5 52.3 -0.8 Growing Slower 30 Employment 48.4 50.0 -1.6 Contracting From Unchanged 1
Supplier Deliveries 47.2 46.8 +0.4 Faster Slower 2 Inventories 50.9 52.5 -1.6 Growing Slower 16 Customers’ Inventories 48.7 41.6 +7.1 Too Low Slower 74 Prices 43.0 46.6 -3.6 Decreasing Faster 2
Backlog of Orders 40.0 45.3 -5.3 Contracting Faster 2 New Export Orders 48.4 46.5 +1.9 Contracting Slower 4 Imports 46.6 50.8 -4.2 Contracting From Growing 1
Overall Economy
Growing Slower 30
Manufacturing Sector Contracting From Growing 1
*Number of months moving in current direction.
Manufacturing ISM® Report On Business® data has been seasonally adjusted for the New Orders, Production, Employment and Inventories indexes.
Commodities Reported
Commodities Up in Price: Electrical Components; Electricity; Electronic Components (24); and Labor — Temporary (3).
Commodities Down in Price: Aluminum (7); Copper (2); Freight; Lumber (3); Ocean Freight (3); Plastic Resins (6); Polypropylene (4); Steel (7); Steel — Carbon (5); Steel — Hot Rolled (7); and Steel Products (5).
Commodities in Short Supply: Electrical Components (26); Electronic Components (24); Hydraulic Components (7); Rubber Based Products; Semiconductors (24); and Steel Products.
17 Manufacturing Outlook / December 2022 ISM REPORT OUTLOOK continued 12 ISM WORLD.ORG
PMI 48.7% = Overall Economy Breakeven Line 50% = Manufacturing Economy Breakeven Line 2022 2021 2020 49%
Note: To view the full report, visit the ISM ® Report On Business® website at ismrob.org The number of consecutive months the commodity has been listed is indicated after each item.
INSTITUTE FOR SUPPLY MANAGEMENT®
ISM® Report On Business®
New Orders
Production
The Production Index registered 51.5 percent. The seven industries reporting growth in production during the month of November — listed in order — are: Apparel, Leather & Allied Products; Primary Metals; Nonmetallic Mineral Products; Computer & Electronic Products; Plastics & Rubber Products; Transportation Equipment; and Electrical Equipment, Appliances & Components.
ISM’s New Orders Index registered 47.2 percent. Of the 18 manufacturing industries, only one reported growth in new orders in November: Apparel, Leather & Allied Products. Fourteen industries reported a decline in new orders in November, in the following order: Wood Products; Printing & Related Support Activities; Paper Products; Primary Metals; Nonmetallic Mineral Products; Electrical Equipment, Appliances & Components; Fabricated Metal Products; Machinery; Plastics & Rubber Products; Chemical Products; Transportation Equipment; Miscellaneous Manufacturing‡; Food, Beverage & Tobacco Products; and Computer & Electronic Products. Employment (Manufacturing)
Employment
ISM’s Employment Index registered 48.4 percent. Of 18 manufacturing industries, seven reported employment growth in November, in the following order: Apparel, Leather & Allied Products; Primary Metals; Miscellaneous Manufacturing‡; Electrical Equipment, Appliances & Components; Plastics & Rubber Products; Food, Beverage & Tobacco Products; and Machinery.
Supplier Deliveries
The Supplier Deliveries Index registered 47.2 percent. Six of 18 manufacturing industries reported slower supplier deliveries in November, in the following order: Apparel, Leather & Allied Products; Textile Mills; Petroleum & Coal Products; Nonmetallic Mineral Products; Primary Metals; and Miscellaneous Manufacturing‡
Inventories
The Inventories Index registered 50.9 percent. Of 18 manufacturing industries, the eight reporting higher inventories in November — in the following order — are: Nonmetallic Mineral Products; Electrical Equipment, Appliances & Components; Miscellaneous Manufacturing‡; Primary Metals; Machinery; Computer & Electronic Products; Transportation Equipment; and Chemical Products. ‡Miscellaneous Manufacturing (products such as medical
18 Manufacturing Outlook / December 2022
Manufacturing PMI®
Analysis by Timothy R. Fiore, CPSM, C.P.M. , Chair of the Institute for Supply Management ® Manufacturing Business Survey Committee
= Census Bureau Mfg. Breakeven Line
2020
New Orders (Manufacturing) 52.9%
2022 20 2021
47.2%
50.5% = B.L.S. Mfg. Employment Breakeven Line 2022 2021 2020
44.4% = B.E.A. Overall Mfg. Inventories Breakeven Line 2022 2021 2020
52.4% = Federal Reserve Board Industrial Production Breakeven Line 2022 2021 2020
48.4% 20 Supplier Deliveries (Manufacturing) 2022 80 2021 2020 53.1% 47.2% Inventories (Manufacturing)
50.9% Production (Manufacturing)
51.5% 70
November 2022 ISM REPORT OUTLOOK continued
equipment and supplies, jewelry, sporting goods, toys and office supplies).
ISM® Report On Business®
Manufacturing PMI®
Customer Inventories (Manufacturing) 2022 2021 2020 48.7%
Prices (Manufacturing)
Backlog of Orders (Manufacturing) 2022 2021 2020 40%
Customers’ Inventories
ISM’s Customers’ Inventories Index registered 48.7 percent. Six industries reported customers’ inventories as too high in November, in the following order: Textile Mills; Paper Products; Wood Products; Primary Metals; Chemical Products; and Electrical Equipment, Appliances & Components.
New Export Orders (Manufacturing) 2022 2021 2020 48.4%
Prices
The ISM Prices Index registered 43 percent. In November, only one industry reported paying increased prices for raw materials: Miscellaneous Manufacturing‡. The 10 industries reporting paying decreased prices for raw materials in November — in the following order — are: Textile Mills; Wood Products; Furniture & Related Products; Fabricated Metal Products; Plastics & Rubber Products; Transportation Equipment; Chemical Products; Electrical Equipment, Appliances & Components; Machinery; and Computer & Electronic Products. Seven industries reported no change in prices in November compared to October.
Backlog of Orders
ISM’s Backlog of Orders Index registered 40 percent. Two industries reported growth in order backlogs in November: Apparel, Leather & Allied Products; and Machinery. Twelve industries reported lower backlogs in November, in the following order: Wood Products; Textile Mills; Printing & Related Support Activities; Paper Products; Primary Metals; Furniture & Related Products; Chemical Products; Plastics & Rubber Products; Computer & Electronic Products; Electrical Equipment, Appliances & Components; Transportation Equipment; and Fabricated Metal Products.
New Export Orders
ISM’s New Export Orders Index registered 48.4 percent. Three industries reported growth in new export orders in November: Nonmetallic Mineral Products; Plastics & Rubber Products; and Food, Beverage & Tobacco Products. The four industries reporting a decrease in new export orders in November are: Fabricated Metal Products; Chemical Products; Machinery; and Computer & Electronic Products.
Imports (Manufacturing) 2022 2021 2020 46.6%
Imports
ISM’s Imports Index registered 46.6 percent. The four industries reporting growth in imports in November are: Apparel, Leather & Allied Products; Computer & Electronic Products; Miscellaneous Manufacturing‡; and Transportation Equipment.
19 Manufacturing Outlook / December 2022
Analysis by Timothy R. Fiore, CPSM, C.P.M. , Chair of the Institute for Supply Management ® Manufacturing Business Survey Committee
52.6% = B.L.S. Producer Prices Index for Intermediate Materials Breakeven Line 2022 2021 2020 43%
‡Miscellaneous Manufacturing (products such as medical equipment and supplies, jewelry, sporting goods, toys and office supplies). November
ISM REPORT OUTLOOK n
2022
DECEMBER 2022
NORTH AMERICA OUTLOOK
 2023 Outlook for Cross First and Banking in General
by Dr. Chris Kuehl
2023 Outlook for Cross First and Banking in General
by Dr. Chris Kuehl
There are the basics as far as the 2023 economy is concerned, and there has not been all that much consensus among analysts. The most pressing sets of questions obviously concern the potential for a recession and the corollary regarding the path of inflation. Frankly, there is fodder for both the “glass half empty” crowd as well as for the “glass half full” position. Much of the variability revolves around the pace of interest
rate hikes. If the Federal Reserve still thinks the greater threat is coming from inflation, the rate hikes will keep coming. If there is a sense that inflation may have reached its peak, the emphasis will shift towards limiting the damage to the economy. Remember the intent of the central banks in general – they raise rates until the economy breaks, and then they set about fixing what they broke by lowering rates. In the past several
decades, the pattern has been that once the breaking has been deemed to have occurred, the rates start to come down about seven to nine months later. The question is whether there is evidence that a breaking point has been reached.
There is some evidence that global inflation rates may have peaked or are close to that point. The first factor is that factory gate prices have been
20 Manufacturing Outlook / December 2022 NORTH AMERICA OUTLOOK
continued
falling for the last few months – at least as measured by the Producer Price Index. It was up another 0.3% in the previous reading and is 7.4% above what it was at this time last year. The growth has been more noticeable in the services sector than in goods, but there has been positive movement in both categories. The second positive trend has been seen in the cost of shipping. Container rates are 40% below what they were just a few months ago, and the capacity issue in trucking has eased from the start of the year when there were a whopping 14 loads for every truck. That rate is now down to about four loads per truck, and normal is considered two loads per truck.
The rail strike was averted, and that took pressure off as well. The third positive sign as far as global inflation has been a decline in commodity pricing. This has obviously not been universal, but the per barrel price for oil has fallen to $71 for WTI and $76 for Brent. This has allowed the per gallon price for gasoline to fall quickly, and the average has been under $3. Lumber prices are down on reduced demand, and there have even been some reductions in the metal prices, although steel has been staying stubbornly elevated.
The fourth shift has been seen with consumer expectations. The fact that consumers are slightly less worried about inflation in 2023 has helped stall price hikes. When people expect higher down the road, they tend to make purchases sooner than later, and that additional demand helps drive higher prices. The reduction in gas prices has apparently convinced the consumer that next year may not be that bad. All of this combines to suggest that inflation may be fading as a motivator, and that could allow a slowing of the rate hikes.
There is the issue of determining if the economy has broken enough for the rates to start heading back down. Usually, the breaking point is indicated by the job market. The Fed has indicated that when the rate of unemployment hits 4.5%, that is a sign that enough damage has been done, and right now the jobless rate is still at 3.7%, and that would seem to give the Fed more room to hike rates. There are several factors that have made using the jobless numbers more complicated. The layoffs that might have been expected by this point have not happened because many of the manufacturers that might have been reducing their workforce are reluctant to lose the people they have had to
struggle so hard to find the last few years. The labor shortage issue has been acute, and that affects decisions about hiring and firing.
There are also many millions that have engaged in the “gig economy” of Uber, Lyft, Doordash, and dozens of other variations. They are very hard to count as part of the workforce. The Fed now seems to be looking at other indications of a slowdown – such as the sharp reduction in the housing sector. It can be successfully argued that single-family housing is already in a recession, with permits down by over 10% from last year. The multifamily sector is booming, however, with permits up by over 11.05% and as high as they have been since the 1980s.
What does all this mean from the standpoint of a recession in 2023? If there is a consensus view emerging, it is that there will be a recession in the first couple of quarters. The downturn would be fairly sharp and shallow and would be followed by recovery in the third and fourth quarters (growth between 2.5% and 3.0%). This is the national estimate, and for some parts of the country, the rebound could be quicker if certain factors play out. Top among these factors is the potential for extensive reshoring activity. It is obvious that supply chains are in flux, and reshoring has already taken place in the U.S. – roughly a trillion dollars so far this year. The expectation is that there will be a trillion dollars invested in reshoring every year for the next seven to ten years. Companies that are moving out of China are investing in other overseas platforms such as Vietnam, Thailand, Mexico, and even Africa. Many have elected to return to the U.S. as well, given that they can rely on technology and robotics to enable them to be competitive with the low-cost platforms in the rest of the world. There are many compelling

21 Manufacturing Outlook / December 2022 NORTH AMERICA OUTLOOK
arguments for the reshoring of production, but there are challenges as well. The three limiting factors for reshoring include 1) availability of labor, 2) availability of transportation, and 3) availability of materials and energy.
The rise in interest rates has certainly slowed the economy as it is intended to do, but it comes with some advantages for the banking sector and borrowers. There is more margin to work with than has been the case over the last few years, and that allows banks to be slightly more risk-tolerant than might have been the case even a year or so ago. That likely means more opportunity for those companies looking to engage in the reshoring effort.
If there is an overall assessment of what lies ahead in 2023, it is one of

cautious optimism weighted towards the latter part of the year. The first two quarters will be rough for most, but from that point the advantages start to manifest.
For documentation supporting this outlook, please sign up for a free trial of ASIS, the Armada Strategic Intelligence System that analyses the durable goods sector and other indicators in the manufacturing industry, which can be found at www. armada-intel.com.
Canadian Outlook
Much of the growth noted at the start of the year in Canada has slowed, but it has not stopped. The drivers at the start of the year were similar to those in the U.S. (and in Mexico to a degree). The most important driver was expanded consumer demand, but there was
also a great deal of inventory build taking place as companies sought to regain control of their supply chain. Canada also enjoyed a boom in energy demand as the U.S. required more Canadian output to make up the difference between U.S. production and consumption of oil. The U.S. is producing at roughly a 13 million barrel per day rate and consumes at a 20 million bpd rate. Canada makes up around half of that deficit.
Much of the non-residential construction in Canada has been tied to the energy sector, and there has been growth of 2.7%. This has been welcome but is 4.0% below the levels seen in 2019. Productivity, in general, has been down by around 1.3% from the pre-pandemic rate, but wages have been up by over 14%. That has been the major factor affecting productivity – the increase from

22 Manufacturing Outlook / December 2022
NORTH AMERICA OUTLOOK 200” Max O.D. 6” Min O.D. To 80,000 lbs. TOLL FREE IN THE U.S. 800.600.9290 - 973.276.5000 - CANADA: 416.363.2244 - INFO@STEELFORGE.COM - STEELFORGE.COM
continued
THE FLAGSHIP REPORTS

The Flagship Reports with Dr. Chris Kuehl is both an “Officer of the Watch” briefing of economic conditions and an Executive Briefing on specific situations impacting those conditions. Written and presented by the officers of Armada Corporate Intelligence, Dr. Kuehl lightens up the mood of sometimes distressful geoeconomic news with a bit of humor. This monthly podcast includes information from the Flagship Reports issued 3 times and week, and AISI, the Armada Strategic Intelligence System, a tool for durable goods manufacturers that dives deep into the sector each month to provide more than 95% accurate near-term forecasts.


expanded robotics and technology has been offset by the hike in wages. There have been substantial GDP gains in sectors such as oil and gas development, automotive manufacturing, computers, and robotics, but this has been at the same time that residential building has fallen along with all the ancillary businesses connected to the sector.
In December, the Bank of Canada pushed rates another 50 basis points to 4.25%, and that spells even more reduction in housing activity. Inflation numbers in Canada have started to weaken a little but still remain far higher than the BoC is comfortable with.
Mexico Outlook
The Mexican economy grew at a 4.1% rate in the third quarter, and that marks the fourth straight quarter of GDP growth. While
the U.S. languished in negative territory for both Q1 and Q2, the Mexican economy enjoyed a surge in demand for its manufactured output (especially in the automotive sector) and also benefited from the rise in overall oil prices. There has not been a recovery in the tourist sector as yet, and remittances are still less than they have been historically. The service sector grew by 4.8%, and manufacturing grew by 3.6%.
The real surprise was a 7.2% gain in the agricultural sector as there was increased demand from global food importers reacting to the sanctions imposed on Russia.
Overall industrial production was a little less than that in the U.S., but manufacturing production was up substantially from the U.S. level.
There has been a considerable interest in reshoring in the U.S., but there has

been even more interest in Mexico as it offers the reduced labor costs and regulator costs offered by the Asian states but with superior transportation opportunities. Unfortunately, the labor situation is not much better in Mexico than in the U.S. – at least as far as skills are concerned.
The level of migration (legal and illegal) into the U.S. has rarely been this low. The vast majority of the illegal migrants that are entering the U.S. are coming from Central and Latin America, and as they traverse Mexico, they are putting a significant burden on the government. As is usually the case, the economy of Mexico relies on the U.S. and that has many worried about what a recession in the U.S. does to Mexico –even if it is a mild one. n
23 Manufacturing Outlook / December 2022 NORTH AMERICA OUTLOOK
DECEMBER 2022
SOUTH AMERICA OUTLOOK
 by Royce Lowe
Spotlight on Peru
Peru, like its South American neighbors, is politically not the most stable of countries. It is presently in the throes of a corruption inquiry, which resulted in its Prime Minister resigning, and its President on a very sticky wicket. The country is beautiful, populated by 32 million people, and home to one of the world’s wonders, Machu Picchu. Like many countries in South America, Peru has a trading relationship with
China, its biggest trading partner.
The top exports from Peru - as exemplified by 2020 figures - are copper ore ($9.23 bn); Gold ($6.46 bn); Refined copper ($1.8 bn); Petroleum gas ($1.41bn); Animal meal and pellets ($ 1.2 bn), and Iron ore ($1.08 bn); mostly exported to China ($11.3 bn); US $6.36 bn); South Korea ($2.71bn); Canada ($2.42 bn) and Japan ($1.91 bn.)
Top imports - again for 2020 - by Peru are Refined petroleum ($2.18 bn); Broadcasting equipment ($1.08 bn); Computers ($833 mn); Cars ($828 mn) and crude petroleum ($752 mn.) Total imports from China were $9.9 bn; from U.S. $6.82 bn; from Brazil $1.77 bn; from Chile $1.46 bn; and from Argentina $1.41 bn.
Car imports were: China, $160 mn; Japan, $100 mn; India,$90 mn; Brazil,
24 Manufacturing Outlook / December 2022
SOUTH AMERICA OUTLOOK
continued
$87 mn; Mexico, $75 mn; Indonesia, $64 mn; U.S., $56 mn; South Korea $40 mn; and Germany, $25 mn.
In 2021, Peru imported $2.69 billion of iron and steel products, of which $1.14 bn from China, $230 mn from
the U.S., and $92 mn from Japan.
Although not in the same league as most of the U.S.’s customers, there do seem to be opportunities, perhaps for the smaller enterprises, in Peru.
Meanwhile, over in Brazil, exPresident Bolsonaro, who was recently pipped at the post by the ex/ new President Lula, is not contesting the election results as such, but some of his supporters are manifesting their displeasure. Bolsonaro is a fan of Donald Trump, and one of his sons supported the storming of the U.S. Capitol on January 6, 2021. It is thought that he is building strength for another run in 2026. The incoming President has his work cut out reviving his country’s economy: there again, he’s not alone on that score.
Author profile: Royce Lowe, Manufacturing Talk Radio, UK and EU International Correspondent, Contributing Writer, Manufacturing Outlook. n


25 Manufacturing Outlook / December 2022
SOUTH AMERICA OUTLOOK
ASIA OUTLOOK
by Christine Casati
Decoupling? What We Have Is Reverse and Diverse Coupling The Semiconductor Industry Readjusts
Geopolitics aside, in the industrial world, we have perhaps already reached a point in globalization where there is no turning back. To achieve the sweet spot in final product pricing to attract the most customers, successful companies around the world have developed complex
manufacturing supply chains that inevitably involve some combination of offshore and GLOBAL design, raw material sourcing, skilled labor sourcing, component sourcing, assembly sourcing, multilingual quality evaluation systems, packaging sourcing, cross-border logistics, and digital
back-up. If we look more deeply, which we should, we find that nowhere is this complex global supply ecosystem more apparent and more vulnerable than in the semiconductor industry, especially with regard to what is happening now between Asia and the West.

26 Manufacturing Outlook / December 2022
continued ASIA OUTLOOK
DECEMBER
2022
Given the relentless advancement of technologies and artificial intelligence, it is not an understatement to say that the defense and economic well-being of most nations is directly related to achieving stable and secure supplies of semiconductors, even when facing market downturns. And this will always involve hard choices. Should we regionalize? Or deepen our transatlantic and transpacific relationships?
Let’s look at some examples of choices that have already been made by many of the key players, as well as some planned readjustments in the supply landscape in the face of new U.S. export controls in the semiconductor industry.

Impacts of Recent U.S. Restrictions on Semiconductor Exports
This year has been transformational with respect to moves by the U.S. Congress and the Executive branch to change the semiconductor landscape for both economic and security rea-
sons. In August, Congress passed the CHIPS+ Act to provide support for the U.S. semiconductor industry and encourage manufacturing in the U.S. as opposed to Asia, where most of our chips come from. In September, President Biden imposed export controls on advanced chips and chipmaking tools and technology (including local and overseas personnel training and operation of newly restricted equipment already in place in China, which came to a halt), primarily to prevent China from further developing its semiconductor industry using U.S. technology. And in November, the U.S. banned five Chinese companies that can use surveillance chips in their telecommunications equipment from sales to the U.S, including Huawei and ZTE.
U.S. MANUFACTURERS IN CHINA: These restrictions have imposed new problems for many U.S. manufacturers within China who produce electronics, automobiles, lighting systems, smart phones, and many other goods for both domestic consumption
and export, which are dependent on chips from Chinese factories. U.S. lawmakers have long been warning companies like Apple, which produces its iPhones in Zhengzhou, Henan, about the use of chips. In light of widespread unrest and resentment at all levels of Chinese society, and recent incidents of its workers running away, having to pay $1400 bonuses to get them to come back, and protests in major cities due to extended COVID lockdowns, Apple is considering other locations, such as India and Vietnam, while China’s operating environment becomes more difficult and less stable.
TAIWAN SEMICONDUCTOR MANUFACTURING COMPANY
(TSMC): China itself has never been able to fully supply all the demand for chips within China, and for years has turned mostly to TSMC to make up the shortfall (one reason why China is unlikely to invade). This is the very company where the U.S. sources over 90 percent of its chip supply. TSMC does not design the chips nor the advanced toolmaking technology which is provided by U.S. companies and other multinationals. TSMC is now faced with a huge challenge and is caught up in what some experts refer to as the U.S.- China chipmaking “cold war.” As they supply chips using U.S. technology to manufacturers all over Asia, they will now be required to limit how their customers use them, to prevent advanced chips from falling into China’s (or Russia’s) hands.
TSMC officials downplay the threat and are confident their markets will not be shaken. With the support of the U.S. Congress, they have taken steps to invest $12 billion to build a wafer plant in Arizona using the advanced 5 nanometer process. Usually, these start-ups require years to bring online, but TSMC is confident
27 Manufacturing Outlook / December 2022
continued ASIA OUTLOOK
that commercial production will start in 2024 as scheduled, with the initial monthly capacity of 20,000 units. They have also begun construction on an additional facility nearby which could eventually house a second fabrication plant. They are keen to boost their expansion efforts in the
U.S., and U.S investors welcome it. Warren Buffet has recently invested $4 billion in TSMC.
SOUTH KOREA – SAMSUNG:
Big players in South Korea are also planning big moves. Samsung announced in May of this year that

they are investing up to $360 billion in chipmaking and biotech over the next five years (in Asia and U.S.). On July 29th, they filed with the State of Texas seeking tax exemptions in two school districts to invest $200 billion in 11 new chip factories (9 in Taylor, 2 in Austin). They have not totally committed this amount, however. They are now constructing a $17 billion plant in Taylor, close to its existing massive fabrication plant in Austin. In August, they pledged $15 billion in a new semiconductor development R&D center as it broke ground on a 100,000 square foot facility in Giheung, South Korea. Its goal is to be a hub of innovation and solidify its competitive edge, despite concerns that the industry is facing a considerable downturn after a global chip shortage. continued

28 Manufacturing Outlook / December 2022
ASIA OUTLOOK
It should be noted that South Korea also walks a tightrope concerning its security and commercial relationships between the U.S. and China. For decades they have tried to balance relations equally with both, as both are critical for trade and stability in the peninsula. But as South Korea’s security is tied to the U.S, and in the wake of U.S. competition with China for economic and military dominance in the region, they are more likely to move our way. (For in depth analysis see wilsoncenter.org webcast “SK In Between The Eagle and the Dragon,” 11/29/22).
IMPACT ON UK AND EUROPE OF U.S. EXPORT CONTROLS ON

CHINA: The U.S. has been stepping up the push on its Allies to fall into
alignment with U.S. export curbs. But this could risk the perception of “China bashing” and also escalate tensions with China. Not all governments are in alignment with the businesses they represent, and vice versa. Here are some recent developments in the semiconductor sector. This November, Germany blocked two sales of semiconductor-related enterprises to Chinese companies. According to the Financial Times, one is ERS Electronics of Bavaria, which makes the thermal chunks used to hold wafers in place during probing. Another stoppage was the sale of a Dortmund-based company, Elmos Semiconductor, to China’s Silex Microsystems. In the UK, a similar development has taken place. The UK blocked the sale of one of their
biggest semiconductor plants, Newport Wafer Fab, to a Dutch Company which is owned by China’s Wingtech. In all cases above, the reasons cited were high-tech security concerns. The Dutch chip toolmaker ASMI is taking issue with the Biden administration on these rising tensions over China. Upcoming meetings with the U.S. and the Transatlantic Tech Council will hopefully lead to a de-escalation and some joint progress.
Author profile: Christine is cofounder and President of China Human Resources Group, Inc, a management consulting firm based in Princeton NJ. She has provided U.S. companies with strategic development and project implementation services for projects in China since 1986 n

29 Manufacturing Outlook / December 2022
We want your participation. Now interviewing for additional podcast hosts Now interviewing for regular and contributing writers for Manufacturing Outlook ezine New ideas wanted for monthly Manufacturing Talk Radio topics Contact Jacket Media Co. at 973-808-8300 or info@jacketmediaco.com
ASIA OUTLOOK


*Toll free within the U.S. * ISO9001:2015 SINCE 1994 AND AS9100D SINCE 1998 NIST SP 800-171 (COMPLIANCE UNDER DEVELOPMENT)
EUROZONE GLOBAL OUTLOOK
 by Chris Anderson
S&P Global Eurozone Manufacturing Composite Purchasing Managers’ Index (PMI), rose from 46.4 in October to 47.1 in November. The manufacturing production index rose from 43.8 in October to 46.0 in November. The rates of decline in production and new orders were somewhat milder than those seen in October. There was a further easing of inflationary pressures.
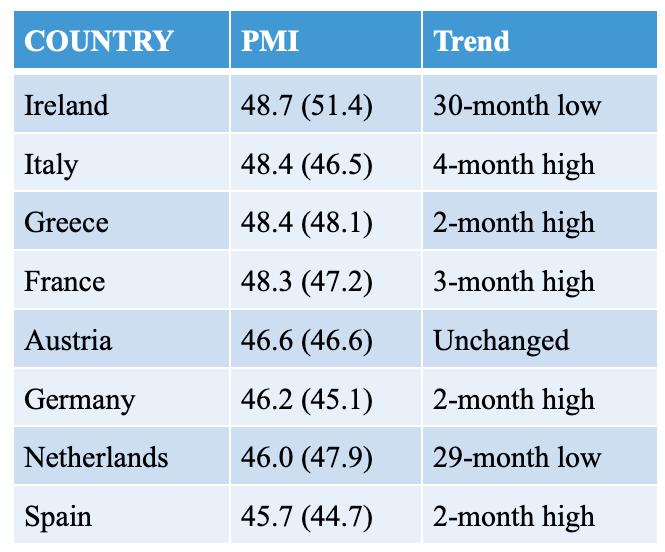
The 12-month outlook for European production is pessimistic, with lower demand, continuing high inflation, and the European energy crisis all weighing on business sentiment. In spite of all this, companies are still adding to their workforce.

Like all manufacturing countries in Europe, the Netherlands - or Holland - is currently going through hard times for all the reasons we have already mentioned. The country is normally one of the most efficient and productive in Europe, as witnessed by its strength in manufacturing and the standard of living of its people. It has a relatively small population of some 17 million. It has the EU’s fifthlargest economy.
Who hasn’t heard of its windmills, its canals, its cheeses, it’s tulips, and
its beers? But the country exports chemicals, refined petroleum, and electrical machinery, and has a highly-mechanized and profitable agricultural sector.
The semiconductor equipment sector is an important part of the economy, particularly its exports. In 2021, exports of “machinery for making semiconductors” were second only to processed petroleum oils on the export list.
According to the Netherlands Enterprise Agency, almost all chips
around the world have a Dutch part inside them or are manufactured with Dutch tools. Worldwide, the Netherlands has a market share of 20 percent. One of the leading manufacturers of semiconductor equipment in the Netherlands is ASML, with chip manufacturer NXP, operating in over 33 countries, being another player in the field.
The Netherlands will see the recession through, and will return to its place as one of the most important European economies. n
31 Manufacturing Outlook / December 2022 EUROZONE OUTLOOK
by Lewis Weiss
This article originally appeared in the November 2022 issue of


MANUFACTURING TIDBITS continued
KEEPING UP WITH CHANGE HAS BEEN A FULL-TIME TASK FOR MANUFACTURERS DURING THE PAST
YEARS
PICK UP THE PACE
FIVE
Manufacturers are always looking for ways to improve operations and grow their share of business. The internet can be a Niagara Falls of information, and manufacturers are standing below it with only a teacup. Manufacturing Outlook and Manufacturing Talk Radio’s audience, however, is above the falls, observing the information stream before it becomes a cascading torrent.
In 2013, All Metals & Forge Group created an industry podcast called Manufacturing Talk Radio to focus on information available to the manufacturing community. Each 30-minute show features interviews with industry experts and thought leaders on subjects pertinent to manufacturing’s future.
Reports on the manufacturing and services sectors are covered by Tim Fiore and Anthony Nieves, the committee chairs for the Manufacturing Report on Business and Services Report on Business, respectively.
Dr. Chris Kuehl, an economist with Armada Corporate Intelligence, answers questions about global economies and how they impact the U.S., particularly manufacturing, in The Flagship Reports on the Manufacturing Talk Radio channel. Many manufacturers and vendors to these companies have contributed to the conversation in nearly 800 interviews over the years.
CREATE CONVERSATIONS
AMFG also recently upgraded its 4-page newsletter, originally launched in 1989, into a digital magazine called Manufacturing Outlook. This forward-looking, forward- thinking e-zine focuses on the future, featuring quick-read articles of around 700 words that are interspersed with in-depth analyses
of industry trends predicted to have favorable or unfavorable impacts on manufacturing.
Both Manufacturing Talk Radio and Manufacturing Outlook provide industry executives with a voice to discuss and share issues in manufacturing, from policies in Washington, D.C., to technology that can increase efficiency on the factory floor. The challenges and potential outcomes of supply chain weaknesses, from raw material sources through production to downstream customers or end users, as well as other vital discussions, are conducted during in-depth interviews or insightful articles. Both forums have an open invitation to senior executives to join the conversation and help the industry.
One of the serendipities seen in this industry is the willingness of one manufacturer to help another manufacturer by sharing their experiences with processes, software, employment issues, supply chain difficulties, and how they are working to resolve these challenges, whether at an industry trade show, a phone conversation, a podcast discussion or a magazine article. Those in the industry know that the fundamental strength of America is the agility and ubiquity of its manufacturing base.
Nothing exemplified that more than manufacturing’s response to the pandemic.
SPECIALTIES AND SPECIFICATIONS
AMFG manufactures high-quality seamless rolled rings with excellent tensile and yield properties for gear, bearing, aircraft engines, wind turbines and heavy machinery applications. The company can produce forged rings in diameters
up to 200 in. for steel alloys and up to 80 in. for other metals, with wall thickness ranging from 2 in. and up. Industries served include aerospace and aircraft, defense, oil and gas exploration, energy and power generation, mining and tunnel boring, pulp and paper, transportation, food processing, valves and pumps, and petroleum and chemicals.
In addition to large seamless rolled rings, AMFG can produce a wide range of forged shapes, including forged bars, blocks, gear blanks, shafts, step shafts, discs, hubs and flanges as rough machined or finished machined to print. Forgings are produced to industry-standard specifications, including AISI, ASTM, AMS, API, SAE, ASME, AWS, UNS, JIS and GB in various heat-treated conditions for the customer’s desired physical and mechanical properties for their intended end use. Large, heavyweight forgings are a specialty of All Metals & Forge Group.
To further serve its customers, AMFG has also been an information provider on its website for several decades, with pages on metal melting ranges, alloy information reports, metallurgical definitions, a history of forgings, a guide on how to buy forgings, machinability ratings and much more.
Author profile: Lewis Weiss is the president and CEO of All Metals & Forge Group, Jacket Media Co and Manufacturing Outlook. n

33 Manufacturing Outlook / December 2022
MANUFACTURING TIDBITS
AEROSPACE OUTLOOK
by Royce Lowe
The Vertiport, and the Moon
A vertiport - the name the aircraft industry has given to a new type of air terminal - can be found at Pontoise-Cormeilles, a regional airport some 25 miles northwest of Paris. Vertiports, when there are enough of them, will be used by the so-named flying taxis, or evTOLS, aircraft that take off and land vertically, like helicopters. But they don’t make the noisy, choppy racket that helicopters make, because they are powered by electrically driven rotors.
The vertiport opened on November 10th, and so far serves solely as a prototype. Being the first of its kind in Europe, it has no matching partner to fly to and land. But ADP, the group that manages Paris’s airports,

hopes that by the time Paris hosts the Olympics in 2024, there will be access to two routes operating in the area, with a total of ten air taxis, each flying two or three trips an hour. Vertiport to downtown Paris should take around 20 minutes. These would link the Olympic village with the major airports and the Paris heliport south of the city. The terminal building, no bigger than a medium-sized apartment, was built by Skyports of the UK, the evTOL by Volocopter, a German company. Skyports has opened a similar vertiport in Marina, California, which is being used by Joby Aviation, an American company also working on a flying taxi. Skyport is planning others in London and Singapore, among other places.
All is quiet around a vertiport, much different from a heliport. Hence a good reason to allow the evTOLS to operate in city centers. And if they are recharged from a renewable source of electricity, they are greener. Their relative mechanical simplicity makes them cheaper to run. Costs will fall further as autonomous flight becomes the norm, freeing up the pilot’s seat for an extra passenger. This of course, will take some time. Volocoptor’s model, VoloCity, takes just one passenger. Joby is testing a five-seater, and Shanghai-based AutoFlight, a four-seater. Airbus has a four-seater in development. Boeing, teamed up with California’s Wisk Aero, is looking for autonomous flight from the beginning. There are 18 rotors on a VoloCity, and if one fails
34 Manufacturing Outlook / December 2022 AEROSPACE OUTLOOK continued
DECEMBER 2022
it will hardly be noticed, unlike a rotor failure in a normal helicopter, where an emergency landing would be required.
With improving technology, evTOLs will grow, particularly from improvements in battery technology for electric cars. A bigger, faster version of VoloCity is already in development. It is likely that evTOLS will be buzzing around many of the world’s major cities by the end of the decade.
Meanwhile, and on a somewhat bigger scale, the world’s largest rocket, the Space Launch System (SLS), which NASA has been trying to fly since August 29th, finally found its way off the launch pad at 2a.m. on November 16th. This followed attempts since August 29th that were hindered by technical problems, as
well as a hurricane. The crewless capsule the SLS carries, called Orion, was on its way to the moon, where it will not land, but if all goes well, it will make way for further attempts to put astronauts back on the moon half a century after the end of the Apollo program.
This voyage will drop a few so-called cubesats that will carry out studies before circling the moon a few times and returning to earth on December 11th. Next will be a crewed flypast in 2024 and a landing in 2025, if all goes well. The SLS has cost $23 billion to develop, and each launch is projected to cost $2 billion.
There are other options. NASA already uses SpaceX’s reusable Falcon-9 rocket to ferry astronauts to the International Space Station. And SpaceX is working on developing
its own giant rocket, Starship. If all works well with this, it may cost as little as $10 million per launch. Starship’s first orbital flight will happen soon, and if that works, Starship will make the SLS look pointless. But this won’t stop more SLS launches. When (then) NASA’s boss suggested in 2019 that SpaceX’s existing Falcon Heavy Rocket could be a quicker, cheaper way back to the lunar surface, he was rebuffed by pro-SLS politicians. It will be an expensive ride back to the moon.
Author profile:Royce Lowe, Manufacturing Talk Radio, UK and EU International Correspondent, Contributing Writer, Manufacturing Outlook. n


35 Manufacturing Outlook / December 2022 AEROSPACE OUTLOOK
ENERGY OUTLOOK
Energizing Africa
by Royce Lowe
Africa, with a population around 1.4 billion, is home to 18% of humanity. It’s a poor continent, but is still, officially, party to global attempts to clean up the planet. In the rich world, the big energy challenge is how to make the supply cleaner. In Africa, the problem is how to generate more energy. Average consumption per capita in sub-Saharan Africa, excluding South Africa, is a mere 185 kilowatt-hours (kWh) per year, compared with some 6,500 kWh in Europe and 12,700 kWh in America. An American fridge uses more electricity annually than a typical
African household. Low energy use is a consequence of poverty, but it is also the cause of it. If Africa is to grow richer, it will need to consume a lot more energy, including fossil fuels.
But Africa’s efforts to improve its lot is on a collision course with hypocritical rich countries, who are happy to import fossil fuels for their use while simultaneously restricting public financing for African gas projects intended for domestic use. Clean-energy technologies provide a huge opportunity for Africa, and they are already the major power

source for 22 of Africa’s 54 countries. But the continent needs much more than renewable power to increase consumption. Electricity, for example, is still unavailable to some 590 million people, or around 50% of sub-Saharan Africans.
Africa’s electricity is unreliable and expensive. Some 78% of African firms experienced power cuts in the past year. Many businesses and welloff households rely on generators. Although home to 18% of humanity, Africa receives less than 5% of global energy investment. Much of this goes
36 Manufacturing Outlook / December 2022 ENERGY OUTLOOK
continued
DECEMBER 2022
to producing oil and gas for export. The International Energy Association (IEA) thinks that investment in energy between 2026 and 2030 must be effectively double that spent between 2016 and 2020.
It’s all about investment, where it’s to come from, and when. Even China is backing off with its previously generous lending. The IEA looks to huge private foreign capital, but investors complain of a shortage of bankable projects in Africa. Coal or gas plants are relatively cheap to build, and most of their operating costs come from fuel purchases. Solar and wind power projects are cheap to run but very expensive to build.
Tiny little Namibia, with a population of some 2.5 million, is having a go. It has a plan to use solar plants and wind turbines to electrolyze water into oxygen and green hydrogen to make ammonia. This project could come about through a $9.4 billion investment by a German-led consortium. A drop in the ocean or the start of a trend? It is an effort to help along Namibia’s economy.
Gas has played a very big part in powering up the continent. In the ten years to 2021, some two-thirds of new electricity generation capacity
came from gas-fired stations. Even with future investments in renewable energy over the coming decades, many African countries will still require a stand-by source of electricity to cover the dull, wind-free days. There are floating fossil-fuel power plants in use in Gambia, Ghana, GuineaBissau, Ivory Coast, Senegal, and Sierra Leone, that produce a large share of these countries’ electricity. Some run on heavy fuel oil, some on gas.
On the bright side of things, in much of Africa, renewable energy is already cost-competitive with gas and coal. This should improve through 2030. Better and cheaper batteries could eventually help renewables cope better with peak demand. But for the time being, gas-fired plants may still offer the best flexibility, stability, and price. Hence the West’s reluctance to finance gas projects goes against Africa’s desire to generate more energy. Last year 39 countries and organizations, including all the world’s big, rich democracies, pledged to stop almost all financing of new fossil-fuel projects internationally by the end of the year. This also included the world bank. Three-quarters of the European members of the 39 are building new fossil-fuel projects at home.
Private firms usually finance gas exploration and development projects, so the ban will not stop gas being found and pumped. Any project that goes through, for example, in Senegal, has world demand and soaring prices following the invasion of Ukraine. This all attracted private investment.
Africa is naturally angry about all this. They argue, and quite convincingly that Africans using more gas should not be a cause for “climate panic.” Because so many Africans are poor, they are much more vulnerable to droughts, disease, and higher food prices than people in wealthier countries. If much of Africa become rich enough, it will be better equipped to deal with the consequences of a warming planet. The task will be much more challenging if Africans are denied cheap and reliable power. And it will do almost nothing to curb global warming.
Author profile: Royce Lowe, Manufacturing Talk Radio, UK and EU International Correspondent, Contributing Writer, Manufacturing Outlook n
Guiding Manufacturers Through Economic Turmoil

Your business needs a guide through today’s economic turbulence to assess the direction of your markets and the evolution of your industry.
New Word Economics tailors economic analysis and data creation for the unique needs of every manufacturing organization.
For more information visit us at newworldeconomic.com
37 Manufacturing Outlook / December 2022
ENERGY OUTLOOK
MATERIALS OUTLOOK
Batteries in the Round
by Royce Lowe
As we all know, EVs need batteries. These batteries, which represent the most expensive component of an EV, are made and will be so increasingly in what is known as gigafactories. The term was initially coined by Tesla for a battery factory in Nevada, which it began building in 2014 in collaboration with Panasonic. The name relates to an annual production measured in gigawatt-hours (GWh) of storage capacity.
Northvolt, a Swedish battery maker, has a factory that was set up by a pair of ex-Tesla executives. It is effectively a model gigafactory and can make every part of an EV battery, unlike other plants that purchase components
such as electrodes. The factory develops battery cells for new vehicles that are, in turn, being developed by its customers, which include Volvo cars, BMW, and the VW Group. It then makes the batteries for fleets of prototype vehicles which those (EV) producers use for testing. Once the cell designs are completed, mass production of the batteries is transferred to bigger gigafactories. Northvolt has one of these in Northern Sweden, with two production lines, each 300 meters long, to which it is adding three more lines. Northvolt is also building a second Swedish gigafactory in a joint venture with Volvo and one in Germany. It is aiming for a total annual output of 150 GWh by 2030, or enough
battery power to make more than 2 million EVs. By then, these factories should be obtaining half their raw materials, including lithium, cobalt, nickel, and manganese, from recycled batteries. If this aim is a success, it will represent a big step towards circular manufacturing, in which firms make new products by recycling old ones, thus greatly reducing their environmental footprints.
There is an obsession with cleanliness at the start of the process, since this is where the chemicals that enable a battery to store energy are mixed into so-called ‘active” materials. In a lithium-ion battery, the slightest impurity can interfere with the flow of

38 Manufacturing Outlook / December 2022 MATERIALS OUTLOOK
continued
DECEMBER
2022
the lithium ions. These ions are created at one electrode, the anode, by taking electrons from lithium atoms. They then flow through a liquid electrolyte to the second electrode, the cathode. At the same time, the electrons move toward the cathode along an external circuit, which powers the EV’s motor. Ions and electrons find themselves at the cathode and stay there until the battery is plugged into a recharger, and the process is reversed.
Cathodes represent some 40% of the cost of an EV battery and are made from various combinations of chemicals. Cathode chemistry is an important part of battery technology and is adjusted to fit both EV manufacturers and different models, from sports cars to sedans to SUVs. Cathode mixes use combinations of nickel, manganese, and cobalt. Anodes are usually made from ultra-pure graphite. Once the ingredients have been mixed, they are blended into a slurry. The cathode mixture is coated onto a roll of aluminum foil, and the graphite is spread onto a roll of copper. The foils are then oven-dried, pressed, and rolled up again.
The next step in this complicated and expensive process brings in robotized machines, which unwind the electrode foils and cut them into thin strips. The anodes and cathodes are then interleaved to make cells, with fillings made up of lithium-laced electrolytes and separators to prevent the anodes and cathodes from making contact and shorting. These cells are the basis of lithium-ion batteries. A dozen or so cells go to make a module, about the size of a hardback book, with electrical connectors attached. The modules are then tested by charging and discharging.
Along with all this is the recycling of used batteries that the aging of the global EV fleet will generate, something that will obviously take a couple of decades. The various materials in batteries are extracted and recycled, another process requiring specific and meticulous treatment.
Northvolt is not alone in seeing the
advantages of circular manufacturing. China’s CATL, based in Fujian province, and the world’s biggest producer of EV batteries, suggests that it is possible to reduce most of the carbon footprint of a battery by using renewable power, largescale recycling of battery materials, energy conservation, and improved production processes. CATL says its largely hydro-powered gigafactory in Sichuan province is working to bring these various parameters to its ten production sites around the world. CATL is also building a gigafactory in Germany, has plans for one in Hungary, and is searching for a site in North America. Another Chinese company, Shanghai-based Envision, is expanding Britain’s only gigafactory, next door to Nissan’s car plant in Sunderland, which it supplies.
The original gigafactory in Nevada is following a similar course. Redwood Materials, founded by Tesla’s ex-Chief Technology Executive, is building a giant battery-recycling center nearby. It is expected to soon start supplying anode and cathode materials to its neighbor. Prior to an accumulation of old EV batteries, Redwood will recycle batteries from defunct devices such as cell phones and power tools.
Circular manufacturing yields financial and environmental benefits, and it is a road that car manufacturers and their suppliers may be forced to take in any event. From July 2024, the carbon footprint of batteries in EVs sold in the EU will need to be declared. And by 2030, these same batteries will have to contain minimum levels of recycled material.
So this is the road that the major EV and battery makers must tread to stay in line with both production and environmental requirements. The world has decided this is the way it will be; now the public must make up its mind to continue to buy the EVs.
Author profile: Royce Lowe, Manufacturing Talk Radio, UK and EU International Correspondent, Contributing Writer, Manufacturing Outlook. n

39 Manufacturing Outlook / December 2022 MATERIALS OUTLOOK
MACHINE TOOL OUTLOOK NOVEMBER 2022
by USMTO
McLean, Va. (December 15, 2022)
– October 2022 U.S. cutting tool consumption totaled $200.6 million, according to the U.S. Cutting Tool Institute (USCTI) and AMT – The Association For Manufacturing Technology. This total, as reported by companies participating in

the Cutting Tool Market Report collaboration, was up 3.4% from September’s $194.0 million and up 11.7% when compared with the $179.6 million reported for October 2021. This has been the highest monthly total since October 2019. With a year-to-date total of
$1.8 billion, 2022 is up 9.4% when compared to the same time period in 2021.
These numbers and all data in this report are based on the totals reported by the companies participating in the CTMR program. The totals here represent the
The graph above includes the 12-month moving average for the durable goods shipments and cutting tool orders. These values are calculated by taking the average of the most recent 12 months and plotting them over time.
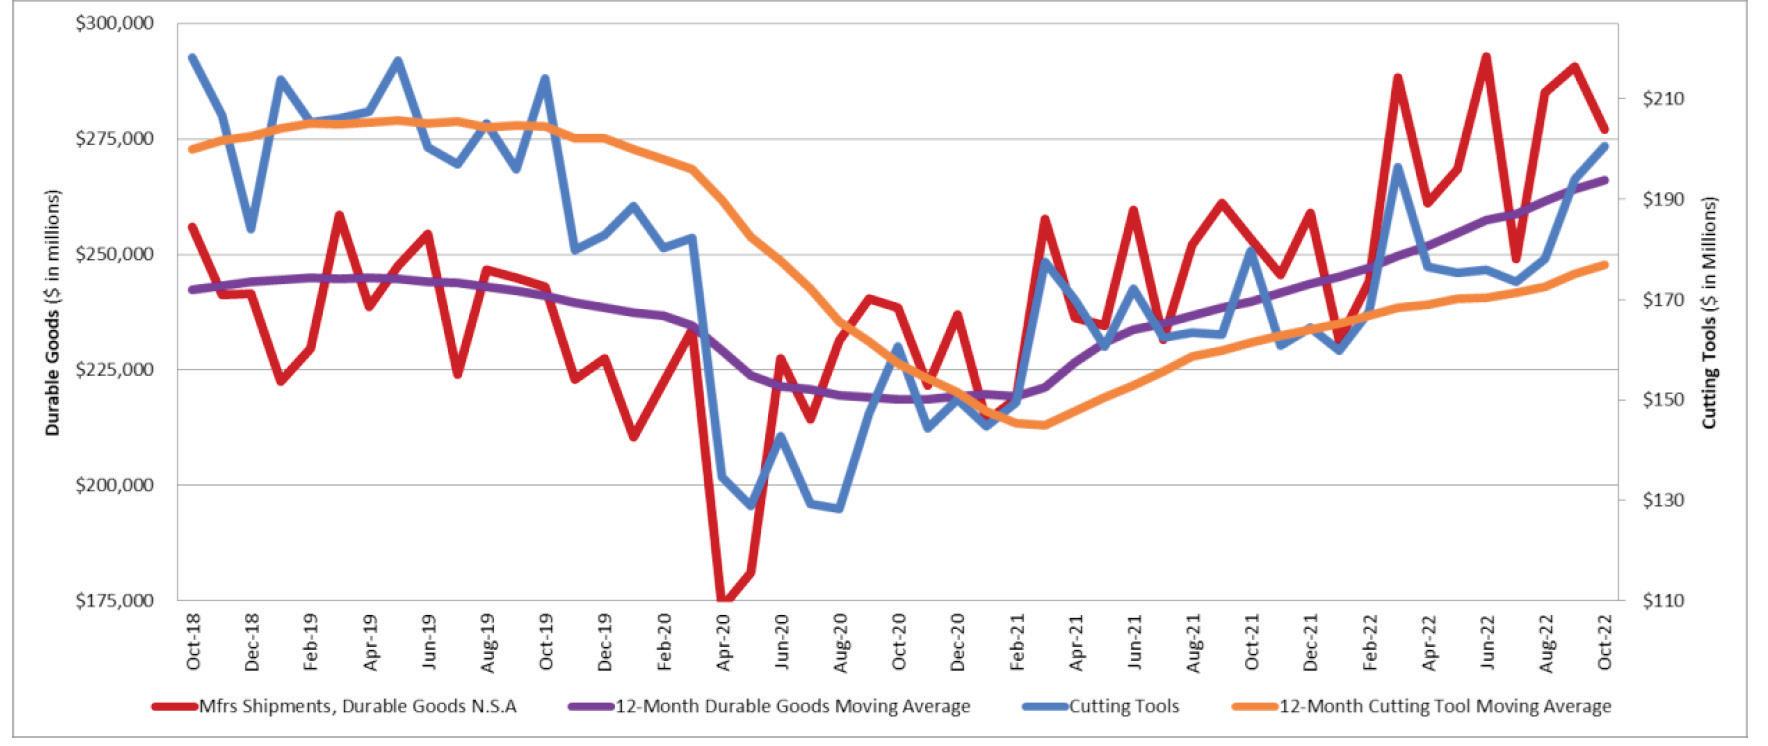
40 Manufacturing Outlook / December 2022 MACHINE TOOL OUTLOOK
continued
US Cutting Tool Orders Totaled $200.6 Million in October 2022, Bringing Year-Over-Year Total to 11.7% Over 2021
majority of the U.S. market for cutting tools.
“Market conditions for the cutting tool industry remain positive,” commented Jeff Major, President of USCTI. “Overall year-to-date sales versus 2021 are up 9.4%. Cutting tool sales for 2023 are expected to remain positive, led by the automotive and aerospace market segments. Shipping costs have stabilized somewhat, which helps our overall business, while there still remains some uncertainty with raw material costs.”
Steve Stokey, executive vice president and owner of Allied Machine and Engineering, also had a positive attitude toward

the direction of the cutting tool industry, stating, “Cutting tool orders continue to climb even through rocky waters. Certainly, we are all bracing for the impact of the interest rate increases by the Federal Reserve.” Stokey continued on, discussing how the durable goods industry influences the cutting tool industry. “The real key for our industry will be how durable goods perform in the months ahead. If durable goods production continues to grow, our industry may be able to stay in positive territory through an overall slowing economy.”
The Cutting Tool Market Report is jointly compiled by AMT and USCTI, two trade associations representing the development,
production, and distribution of cutting tool technology and products. It provides a monthly statement on U.S. manufacturers’ consumption of the primary consumable in the manufacturing process – the cutting tool. Analysis of cutting tool consumption is a leading indicator of both upturns and downturns in U.S. manufacturing activity, as it is a true measure of actual production levels.
Historical data for the Cutting Tool Market Report is available dating back to January 2012. This collaboration of AMT and USCTI is the first step in the two associations working together to promote and support U.S.-based manufacturers of cutting tool technology. n
41 Manufacturing Outlook / December 2022
MACHINE TOOL OUTLOOK
AUTOMOTIVE OUTLOOK
by Royce Lowe
Where have all the Cars Gone?

Time was when the world was in awe of, or scared to death of, that little island just across the channel from France. They sang songs such as Rule Britannia, Britannia rules the waves, etc., and not too long ago, they spoke of Cool Britannia. The country took the Industrial Revolution in hand, sent its metals, particularly its steel, and the goods made from them worldwide.
Hundreds, even thousands of workers left Britain’s shores and landed in
Pittsburgh, where they showed America how to make steel. They made the most of that German invention, the automobile, and until the 1970s - when the unions wounded the industry - they produced some of the world’s finest cars. Most of these cars are now being built by Germany and India, with the iconic Aston Martin being in the hands of a Canadian consortium. GM and Ford have long been in the UK automotive business. Japan, of course, is very present in
the UK. Japan also had a thriving steel industry, and that went sideways. But that’s another story as is Brexit, which was responsible for a downturn in investment in the automotive industry. During the 12 months leading up to the 2016 referendum, Britain produced almost 1.7 million cars. In the past year, carmakers have produced less than half that.
Arrival, a UK-based electric-van startup, recently announced its CEO
42 Manufacturing Outlook / December 2022 AUTOMOTIVE OUTLOOK
continued
DECEMBER
2022
and president were stepping down. Last week, the CEO of Britain’s biggest auto manufacturer, Jaguar Land Rover, resigned after failing to push the company ahead on a shift to all-electric announced two years ago. Britishvolt, Britain’s aspiring EV battery maker, is struggling. Were it not for prominent foreign manufacturers, there would effectively be no car industry in the UK. The question is, will it ever come back?
It’s a more optimistic picture in the U.S., where President Joe Biden is wooing car and battery manufacturers with billions of dollars as a challenge to China’s dominance of the global EV supply chain.
The UK’s struggle to modernize its auto industry threatens thousands of industrial jobs. Companies are not investing in the UK the way they were. BMW recently said it will move production of electric Mini hatchbacks from Oxford, to China. Honda closed its car factory in Swindon last year, leaving Britain with just four mass manufacturers: JLR, Nissan, BMW, and Toyota. The UK
boasted the world’s second-biggest auto manufacturing base in the 1950s. It has since dropped to 18th place, behind such countries as Canada and Slovakia.
To add to this, the demand isn’t there presently. Companies are now looking at their worst year of sales since 1982.
The UK lacks a battery supply chain needed to support mass manufacturing of EVs. The only reasonably sized cell plant in operation is owned by China’s Envision Group. But the UK isn’t at risk of total car industry collapse.
Bentley, owned by Volkswagen, is spending £2.5 billion to modernize its factory in Crewe, and electrify its entire lineup by the end of the decade. Nissan has committed to making battery cars at its Sunderland plant, creating 1,650 jobs. Stellantis is investing £100 million to retool its 60-year-old Vauxhall factory near Liverpool to make electric vans.
The UK needs to move fast if it wants to reverse the downward spiral it’s on. Toyota, which makes engines and Corollas in the UK, has not yet started
to retool its two local plants for the electric age. Large battery factories have been announced or opened this year from Italy and Spain to Sweden, near the Arctic Circle. Bloomberg reported this past May that JLR had been looking to bring in supplies from Europe. But still, things are not good in the UK auto industry. They are playing catch-up, and it will take good production decisions and government collaboration to put it back on track. Meanwhile, in the land of the EV, China recently reported its electricvehicle sales for October, and the numbers continue to mount. A total of 722,000 plug-in passenger and commercial vehicles were sold. Battery-electric vehicles were 22% of the passenger car market, and plug-in hybrids claimed another 9% share.
China represents an ever-growing portion of the global EV market. Its share of global passenger EV sales has gone from 26% in 2015, to 48% in 2021, to 56% in the first half of 2022. A big surge is expected in the final months of the year that could push this share over 60%. In other segments like trucks, buses, and two-wheeled vehicles, China is even further ahead. Ranges are increasing through improved battery efficiency, and China’s battery makers are forming joint ventures and looking to build battery plants worldwide.
China versus the U.S. in the EV business will be a long and hard-fought battle. It’s not really that long since the world started writing about EVs, but the battle is on. There is room in there for a bunch of contestants.

Author profile: Royce Lowe, Manufacturing Talk Radio, UK and EU International Correspondent, Contributing Writer, Manufacturing Outlook. n
43 Manufacturing Outlook / December 2022 AUTOMOTIVE OUTLOOK
DECEMBER 2022
CYBER SECURITY OUTLOOK
Firewalls, VPNs, and Doing As the Romans Do
By Ken Fanger, MBA, CMMC-RP, President, On Technology Partners
As someone in the cyber security field with an interest in history, I often find myself thinking about how the Romans might have felt with the Germanic tribes always charging southward to storm their cities. I know that may not be what comes to your mind when you think of cybersecurity, but let me explain. The only barrier between Romans and the marauding hordes was their city gates. Rome was a massive city with many strongly defended gates, but 32 kilometers away was the city of Capena, which had just a single gate to hold back enemies. The gate in Capena is still standing today and is an incredible marvel to see.
As small businesses, we face similar experiences to these ancient peoples: the threat of hordes of cyber attackers storming in to invade our beautiful land—er, computers—and pillage our valuable information. Like comparing Capena’s singular gate to Rome’s numerous, a small business owner may begin to feel like only large companies with vast resources can build the best defenses to protect themselves from attackers.
Larger companies are able to spend mounds of money trying to defend themselves, implementing the best technologies, and having entire departments focused on cyber security. How-
ever, it’s equally important to remember that even companies like Target, Facebook, Adobe, Capital One, AT&T, BP, and Apple have all experienced cyber security breaches and attacks. Financial institutions aren’t immune either. You’d be hard-pressed to find a single bank or major corporation that hasn’t faced at least one cyber attack. Rome was well protected, but danger still knocked on its gates.
You may now be considering, “If they can’t protect their companies from cyber attacks, what am I supposed to do to protect mine?” To this, I want to keep in mind Capena, their one gate, and what a gate is used for. Gates allow

44 Manufacturing Outlook / December 2022
CYBER SECURITY OUTLOOK
continued
good people to come in and keep the bad people out. How does it keep the bad people out? Simple: it blocks their entrance. If you close off a gate, the only way through is to knock it down, which takes large amounts of effort and time. Gates also keep the good people out as well. How do you let the good people back in? You need to open the gates. After all this time, Capena’s gate is still standing – its value lies in quality and good use of the gate, not quantity.
This is where your gate, a firewall, comes into play. Modern firewalls are good at keeping undesirable things out as long as no one opens up the gates. Each time we open a connection via the internet, we form a road between our little “village” (your server/computer) and the site we are visiting. If that site is secure, we’re safe and happily getting what we need. If that site is bad or unsecure, then we’re opening the gates to potential hordes of armies to come rushing in.
Hackers are well aware of this. Barging through a firewall is difficult, but if someone opens the gates, it doesn’t take much effort to get through. This is why hackers use items like emails and bad web links to gain access to your network. To access web pages and other cloud-based sites, you have to open the gates, so to speak. If you open the gates up to the wrong person, they can get in and begin attacking from the inside.
To counteract this, we can introduce “guards” to watch the gate called an
IDS (Intrusion Detection System) and an IPS (Intrusion Protection System). These guards stand watch to help detect if there are “undesirables” trying to follow you back into your village— AKA cyber criminals after your data. It’s important to have these guards on our gates, but it’s also important to remember that any time you open the gates, bad people will try to get in.
I had a client that had a server within their “secure village” (their office) that was protected behind a good firewall. The problem was that they accessed this server from locations outside of their office. Until they began working with us, they had always connected directly into their server from outside the office, meaning that their gate was always open. To prevent unsavory characters following them into their server, we create a defended path, a VPN (Virtual Private Network), to that server so that when they were outside the office, they would be protected. A VPN (Virtual Private Network) keeps the information that is being shared hidden, so that only you and the computer you are talking to can read it.
This client had never experienced a breach before, so they assumed that their village was so small that no one would ever try to attack them. “Why would anyone want to go after my little company?” they asked. It was now my job to show them that being small didn’t protect them from the barbarians at the gates. I extracted a log of all activity going through the gate, their firewall, and in just one week they had 356,002 attacks on their server! The
hackers were using a brute force attack to try and gain access into the server.
So, what’s a business to do? As a small business, it’s necessary to create a layered defense. This layered defense starts with a firewall, the gate to your village. You’ll want to ensure you’re purchasing and using a firewall that supports IPS/IDS service, which is generally an annual subscription. It’s also important to make sure that the company deploying it understands how to configure and set up your firewall.

Now that we’ve learned about gates and firewalls, we have a good start to defending your network. This isn’t the end of your defenses, just the beginning. You’ll want to have a layering of defenses to keep your team and your business safe—and perhaps from now on, ancient civilizations will come to your mind, too, when thinking about your own cybersecurity.
Author profile:
Ken Fanger, MBA has 30 years of industry experience in the fields of technology and cyber security, and is a sought-after CMMC Registered Professional, helping manufacturers and contractors to meet DoD requirements for CMMC compliance. He is passionate about technology deployment, and his MBA in Operations & Logistics has helped him to be an asset in the designing and deployment of networks to enhance the manufacturing experience. Over the past 5 years, he has focused on compliance and security, including working on the SCADA control system for the Cleveland Power Grid. Mr. Fanger works with each client to identify their unique needs, and develops a customized approach to meeting those needs in the most efficient and cost-effective ways, ensuring client success n

45 Manufacturing Outlook / December 2022 CYBER SECURITY OUTLOOK
2022 ISSUES OUTLOOK
Fruitful Training
We’re all aware of the lack of skilled talent and its effects in American manufacturing, and last year the research firm Korn Ferry predicted that unrealized output from manufacturing talent shortfalls will grow to more than $607 billion by 2030. It’s an ongoing struggle for manufacturing leaders to attract and retain talented workers. It is suggested that it would help to consider a broader cross-section of the population. The industry is currently some 80% white, and
only around 30% of its employees are women, according to 2021 U.S. Bureau of Labor Statistics data. The whole talent pool needs to find a place in manufacturing. Pay should increase as skills are accordingly improved.

Ethan Karp is president and CEO of the nonprofit MAGNET, (the Manufacturing and Growth Network), an Ohio Manufacturing Extension Partnership. He has some thoughts on the search for, training, and use of
by Royce Lowe
talent in American manufacturing. He recently wrote about three companies - in Industry Weekwho have developed innovative methods to serve their own particular requirements.
MAGNET’s experience suggests that its approach will pay dividends to the manufacturer. Mr. Karp describes three examples followed by his company.
Two decades ago, Clevelandbased National Safety Apparel had continued
46 Manufacturing Outlook / December 2022 ISSUES OUTLOOK
DECEMBER
no problem finding talent. The company makes protective apparel for industrial and electrical utility workers, the U.S. military, and the postal service. All it took at the time was an ad in the Cleveland Plain Dealer. The applications just came pouring in. With time, however, there were many fewer candidates. There simply weren’t as many people with sewing or manufacturing skills. National Safety Apparel found a way to attract and train talent through refugee resettlement agencies that were helping to bring immigrants to the area. The company created training programs for these groups, helping them into full-time positions.
In 2018, NSA went a step further, establishing an in-house sewing school, where trainees are paid to learn to sew, and graduates are placed in positions within NSA. All it really takes is a desire to learn. The school runs six weeks, with the first two weeks devoted to familiarity with the machines and the next four weeks working within a team. The scheme here not only improves candidates’ skills but will also improve their self-esteem.
Elsons International is a corrugated box maker. This company also suffered from a shrinking talent pool. But the company took a step that its CEO, Andrew Jackson, calls his greatest competitive advantage, namely hiring people who were previously incarcerated.
Jackson says he came from humble beginnings and never forgets what it’s like to be down in life. Many people struggle to overcome a criminal record as they search for jobs and a new life after their release. But Jackson believes in second chances. Before bringing them into the company, he tries to understand what the applicants did, how they spent their time behind bars, and how they changed during that time. “You know they made a mistake, but I want to know what they did to change their trajectory while incarcerated.” he says.
“If you know anything about an exoffender who is really determined to change their life, you know they’re going to be a better worker than the average,” Jackson says. “I know they’re going to show up on time, they’re going to work a little harder, and they’re going to be a great employee because they’re invested in making their life better.”
About half of Jackson’s staff are now people who were previously incarcerated, and many have moved up the chain of command. One worker spent 19 years behind bars before joining Elsons – he’s now a supervisor. Jackson is pleased with the results of his efforts. They’ve worked, and the workers he’s hired are a testament to that. They’re staying with him, having learned a trade, plus they’ve grown in selfesteem. He’s reaping the rewards of the talent that he and his workers have created together.
There is a current shortage of 10,000 to 12,000 workers in Manufacturingrich Northeast Ohio. Schemes such as those practiced by Elsons and National Safety Apparel contribute to a solution. Still, initiatives are required that create enthusiasm and
incentives early in life, persuading young people to choose careers in manufacturing. It’s no news that manufacturing has long had the reputation of being a “dirty business,” but the stigma seems to be receding.

MAGNET’s Early College, Early Career (ECEC) program gives high school students a chance to do paid apprenticeships at local manufacturers, working 1-2 days a week while earning college credits as they train. When they graduate, they’re eligible for offers that can include full- or part-time employment, plus college tuition reimbursement. The program also equips students with support services, from transportation to mentorship, that lower the barriers to entry, allowing more people from more socioeconomic backgrounds to apply and succeed. Since the ECEC program began five years ago, 92 students have successfully graduated. Eighty-seven percent went straight into a manufacturing career, into college, or a combination of both.
The three methods we have discussed here are not likely, in the short term, to fill a big hole in the skills deficit. But what they will do is make those responsible for running the manufacturing industry aware of the possibilities available. There are many ways of imparting skills to potential workers, and all are effectively along the lines of apprenticeships. From the French verb “apprendre”; to learn.
Author profile: Royce Lowe, Manufacturing Talk Radio, UK and EU International Correspondent, Contributing Writer, Manufacturing Outlook. n
47 Manufacturing Outlook / December 2022 ISSUES OUTLOOK

*Toll free within the U.S. * ISO9001:2015 SINCE 1994 AND AS9100D SINCE 1998 NIST SP 800-171 (COMPLIANCE UNDER DEVELOPMENT)


JOIN THECAUS E JOINTHE CAUSE Help change the perception of Manufacturing in the USA! www.championnow.org terry@championnow.org 847-299-2461 Finding America’s Greatest Champion Audio Book $24.99 l eBook $9.97 Paperback $21.99 l Hard Cover $27.99 Training CNC Mill and Lathe Package Table Top Champ CNC Lathe $7,795 l Table Top Champ CNC Mill $7,795 (requires laptop or PC for each ) Package with laptop $16,995 ➧ ➧ OUR FUTURE DEPENDS ON YOU. CNC Rocks Virtual Manufacturing Camp 22 videos 4.5 hours in length Schools: $500 annual subscription Industry: $750 annual subscription ➧ www.championnow.org Champion Individual Annual Corporate Membership For companies of 200 or less employees — $995 For companies over 200 employees — $1,995 With your NOW!membership you receive: l Applicant Advantage Annual Membership (student video resume portal) l Annual membership certificate l Finding America's Greatest
l CNC Rocks Virtual Manufacturing Camp
subscription) l Access to networking community/mentoring focused on MFG workforce development l A promotional video produced by your company posted to the ChampionNOW ROKU Channel
Champion Book (signed by Terry Iverson)
(annual


VIDEO INTERVIEWS AVAILABLE ON YOUTUBE PLUS 3 MONTHLY SHOWS
