
A YEAR LIKE NO OTHER. 2022 ANNUAL REPORT. MERCURY NZ LIMITED
This Annual Report is dated 16 August 2022 and is signed on behalf of the Board by: PRUE FLACKS // CHAIR JAMES MILLER // DIRECTOR CUSTOMER19 PARTNERSHIPS22 KAITIAKITANGA25 PEOPLE28 COMMERCIAL31 04 WHO WE ARE 05 OUR BUSINESS MODEL 08 CHAIR & EXECUTIVECHIEFUPDATE 13 ENGAGING WITH IWI AND STAKEHOLDERS 14 THE RISKS WE FACE 15 PULLING IT ALL TOGETHER 17 CREATING VALUE IN THE FUTURE 82 YOUR EXECUTIVE TEAM 83 GOVERNANCE AT MERCURY 100 REMUNERATION REPORT 106 DIRECTORS' DISCLOSURES 108 SECURITY INFORMATIONHOLDER 113 COMPANY DISCLOSURES 114 OTHER DISCLOSURES 116 GLOBAL REPORTING INITIATIVE (GRI) INDEX 119 INFORMATION SHAREHOLDERSFOR 120 DIRECTORY 121 GLOSSARY 122 RĀRANGI INGOA LIST OF NAMES 35 FINANCIAL COMMENTARY 37 FINANCIAL TRACK RECORD 38 INDEPENDENT AUDITOR’S REPORT 41 FINANCIAL STATEMENTS 66 TCFD REPORT
The directors are pleased to present Mercury NZ Limited’s integrated Annual Report and Financial Statements for the year ended 30 June 2022. The Auditor-General is required to be Mercury’s auditor, and has appointed Lloyd Bunyan of Ernst & Young to undertake the audit on his behalf.
22022REPORTANNUALMERCURYMENU5. THE TEAM BEHIND ENERGY FREEDOM. TE TĪMA MANAWHIRI PŪNGAO. REPORTTHISABOUT 1. ENERGY FREEDOM TODAY. MANAWHIRI PŪNGAO Ā-MOHOA NEI. 4. ENERGY FREEDOM IN NUMBERS. NGĀ NAMA O TE MANAWHIRI PŪNGAO. 2. OUR WORLD OF ENERGY FREEDOM. HE TAIAO MANAWHIRI PŪNGAO. MENU. 3. LIVING ENERGY FREEDOM. TE ĀHUANOHO I TE MANAWHIRI PŪNGAO. OUR PILLAR STORIES ABOUT REPORT.THIS Mercury is committed to providing the full picture: transparent disclosures in easily understood, comparable and engaging ways so that we meet the expectations of our many stakeholders. This report follows the Integrated Reporting <IR> framework. We describe Our Business Model, including inputs, outputs and the outcomes of our strategic approach across the five pillars that make up how we generate long-term value. We include a specific Global Reporting Initiative (GRI) Index and our comprehensive TCFD Report, which is prepared in accordance with the recommendations of the Task Force on Climate-related Financial Disclosures (TCFD). We have grouped our reporting into five sections to help you find areas of particular interest, but they are all part of who we are, what we do and why. Across all this, our aim is to report openly and honestly on our performance in a way that shows the integrated approach we take. If you have any comments about this report, including things we could do better, please email annualreport@mercury.co.nz STATEMENT FROM THE DIRECTORS


3MENUMERCURYANNUALREPORT2022ENERGYFREEDOMTODAYENERGY FREEDOM TODAY.
MANAWHIRI PŪNGAO Ā-MOHOA NEI. We are focussed on being here for the long term. In this section we introduce you to Mercury. We provide an overview of how we operate, highlight the factors that affect our ability to create value over time (Our Business Model) and outline our past and current performance and outcomes. Our Chair, Prue Flacks, and Chief Executive, Vince Hawksworth, then jointly summarise our 2022 financial year.

We are an electricity generator and multi-product utility retailer of electricity, gas, broadband and mobile services focussed on delivering wonderful solutions for New Zealanders at home, at work and on the move. Our mission, which guides us in what we do and why, is Energy Freedom for all. This is about Aotearoa New Zealand being stronger economically and more sustainable through better use of homegrown, renewable energy. Thinking in an integrated way about how we create long-term value is part of who we are. Since 2015, we’ve been building understanding across Mercury of how we collectively contribute to the delivery of our strategy by following Our Business Model and focussing on things that matter most (to us, and to our partners and stakeholders). We generate electricity from 100% renewable sources: hydro, geothermal and wind. Our electricity generation sites are located along the Waikato River (hydro), the nearby steamfields of the northern part of the Central Plateau (geothermal) and in the Manawatū, South Taranaki and Otago regions (wind). We are currently building our Turitea wind farm in the Tararua Ranges of the Manawatū region, which will be New Zealand’s largest wind farm once complete. We have a pipeline of future wind development sites across the country. We are committed to building and maintaining strong, authentic relationships with iwi/Māori in the lands around our generating assets, and listening to understand where our aspirations align.
Our retail operations serve residential and small to medium sized business customers through our Mercury and Trustpower brands. We sell electricity, gas and broadband through Mercury and electricity, gas, LPG, broadband and mobile services through Trustpower. Our sub-brand GLOBUG is our pre-pay electricity product. Our Commercial sales team service industrial and wholesale market customers offering electricity and natural gas products. We have offices in Auckland, Tauranga, Hamilton, Rotorua, Taupō, Palmerston North, Wellington and Oamaru, as well as at our power stations.
MARAETAIKARĀPIROARAPUNIWAIPĀPAANDIIWHAKAMARU ARATIATIAĀTIAMURIŌHAKURINGĀTAMARIKINGĀPŪRUAAWA LAKE TAUPŌ ROTOKAWA MŌKAI KAWERAU MAHINERANGI WAIPIPITURITEA++TARARUA + not 100% owned by Mercury ++ under construction HYDRO WINDGEOTHERMALSTATIONSSTATIONSFARMS 42022REPORTANNUALMERCURYENERGYFREEDOMTODAYMENUOUR MISSION: ENERGY FREEDOM.
WHO WE ARE.
52022REPORTANNUALMERCURYENERGYFREEDOMTODAYMENUOUR BUSINESS MODEL. 2,5683,662 4,7721,269GWh GENERATIONGWGENERATIONHYDROhGEO GWh SALESGWGENERATIONWINDhPHYSICAL13%CONSUMPTIONMARKETSHAREMARKETGENERATION18%SHARE 574k electricity 95k gas 117k telecommunications 13k mobile 675 women 659 men 1 non-binary 456 in Auckland 487 in Tauranga 91 in Hamilton 126 Rest of NZ 54 in Rotorua 32 in Taupō 89 Oamaru 9 hydro 5 geothermal 6 wind 2 geothermal joint ventures 5 formal iwi partnerships 15 community and commercial partnerships74KSHAREHOLDERS799KCUSTOMERCONNECTIONS20POWERSTATIONS1,335PERMANENTEMPLOYEES BONDHOLDERS3K 157FORMAL PARTNERSHIPSRELATIONSHIPSIWI OUR MODELBUSINESSEXPLAINED. Our Business Model shows our key inputs interacting with our business activities to create outputs of sustainable, commercial value. The outcomes of our activity are measured and take us towards mid-term and long-term goals that reflect our enduring mission. OUR BUSINESS MODEL IS CONTINUED OVER THE NEXT PAGES AHS•RE&CONNECT • COMMIT&OWNIT• CURIOUS & ORIGINAL INPUTS OUR BUSINESS ACTIVITIES OUTPUTS KAITIAKITANGA LONG-TERM SUSTAINABILITY OF NATURAL RESOURCES AND ASSETS. PEOPLE ENABLING OUR PEOPLE TO PERFORM TOGETHER IN A CHANGING ENVIRONMENT AND KEEP EACH OTHER SAFE. COMMERCIAL ACHIEVING OUR COMMERCIAL GOALS THROUGH SUSTAINABLE GROWTH. CUSTOMER INSPIRING, REWARDING AND MAKING IT EASIER FOR OUR CUSTOMERS. PARTNERSHIPS PROVIDING GREATER OPPORTUNITIES FOR NEW ZEALAND, OUR INDUSTRY, OUR PARTNERS AND OUR BUSINESS THROUGH LONG-TERM COLLABORATION.
62022REPORTANNUALMERCURYENERGYFREEDOMTODAYMENU• We are a Zero Harm organisation • No serious injury at a safety sensitive site or of customers through our service • Enhanced engagement with iwi, partners and stakeholders • Collaboration with stakeholders in the Waikato to improve the catchment • Good practice approach to climate risk • Delivering on our customer care plan • EBITDAF growth • Thrive contribution • Retail value growth • Portfolio management • Generation asset performance OUTCOMESFY22OBJECTIVESTHREE-YEAR HOW WE MEASURE THIS LONG-TERM GOALS ZERO INCIDENTSANDSEVERITYHIGHHEALTHSAFETY $47M FY22 THRIVE BENEFIT EXTERNAL RELATIONSHIPS AND SECTOR ENGAGEMENT REVIEWS COMPLETED PEOPLE REPRESENTATIONDIVERSELEADERSHIP 17% RETURNSHAREHOLDERTOTAL -12.6% 12 FINALCPSDIVIDEND CULTURE 72%INCREASEDINDEXFROMTO75% ENHANCE OUR LICENCE $700MBUSINESSVALUEINCREASESTAKEHOLDERSWORKCOLLABORATIVEOPERATETOTHROUGHWITHOURTHEOFOURTO$800MEBITDAFUNLEASHTHEFULLPOTENTIALOFOURPEOPLETHROUGHTRANSFORMINGCULTURE OUR BUSINESS MODEL. • Improvement in Culture Index • Increase in diverse representation • Learning opportunities taken up that lift capability THRIVING TODAY CUSTOMER ANDIMPLEMENTEDGUIDELINESCAREMONITORED OF PEOPLE BIASCOMPLETEDLEADERSUNCONSCIOUSTRAINING 90%
72022REPORTANNUALMERCURYENERGYFREEDOMTODAYMENU• Our people taking up opportunities through internal movement • Our systems are fit for purpose • Electricity is viewed as an enabler of the transition to a low carbon economy • Progress on engagement with new technology • Support for transport decarbonisation • Progress on reducing our own emissions CONSENT GRANTED FOR WORKINGFLEXIBLENEWANDEMISSIONSPROGRAMMESONCONSTRUCTIVEWINDKAIWAIKAWEFARMENGAGEMENTKEYTRANSITIONINCLUDINGREDUCTIONPLANNZBATTERYPROJECTHIGH-TRUST,FULLYAPPROACHTOROLLEDOUT OUTCOMESFY22OBJECTIVESTHREE-YEAR VACANCIES FILLED BY CANDIDATESINTERNAL COMPLETEDPLATFORMTECHNOLOGYREVIEW ECONOMYTOZEALAND’SWORKCROSS-SECTORSUPPORTINGONNEWPATHWAYALOWCARBON 51% COMPLETEDRETAILTRUSTPOWERACQUISITION WINDPROGRESSEDPIPELINEDEVELOPMENTPPAINPLACE BE AN ADAPTIVE AND GROWTHOPTIONSCREATEECONOMYATRANSITIONSUCCESSFULZEALAND’SROLEPLAYFUTURERESPONSIVEORGANISATION,RESILIENTTONEEDSALEADINGINNEWTOLOWCARBONEXECUTABLEFORNEW OUR BUSINESS MODEL. • New opportunities for growth • Executable development options SHAPING TOMORROW For our long-term goals linked to each of our pillar icons, see ‘Our Strategic Framework’ on p16 HOW WE MEASURE THIS LONG-TERM GOALS
PRUE FLACKS // CHAIR VINCE HAWKSWORTH // CHIEF
GLOBAL CONTEXT
82022REPORTANNUALMERCURYENERGYFREEDOMTODAYMENUCHAIR & UPDATE.EXECUTIVECHIEF
Nau mai ki te Pūrongo ā-Tau a Mercury 2022. Ka hoki whakamuri ki te pai rānei o ngā mahi a Mercury i te tau nei i te wāhi ki te mākete, te mātai arowai me ētahi atu whāurunga. Ka whai whakaaro hoki ki te tūāoma hei ā 30 o Hune 2022. Ka anga whakamua anō rā ki ā mātou whakaritenga mō te anamata me te whakakitenga o Mercury e taea ana.
Welcome to Mercury’s 2022 Annual Report. We’ll look back at Mercury’s performance this year in the context of the market, hydrology and other inputs, and consider where we are as of 30 June 2022. We’ll also look forward to our plans for the future and vision for what Mercury could grow to be.
The post-Covid world is refocusing attention on decarbonising the global energy system. Energy consumption is increasing as economies rebuild. Constraints on supply are well documented - severe droughts in many large economies are constraining hydro outputs; the war in Ukraine is impacting gas supplies across much of Europe. Demand for gas and coal internationally is rising and global energy prices have soared as volatile fossil fuels dominate the energy mix. This, together with the rising cost of carbon has amplified and accelerated the renewables agenda Inflationaryglobally. pressures and the cost of living are increasing, and New Zealand is not immune. As governments around the world take action to provide muchEXECUTIVE needed relief for consumers against these challenges, it is imperative this action does not unintentionally impede investment in cleaner and more resilient energy systems. This is as true for New Zealand as it is for other economies. Our sector will make a material contribution to decarbonising the New Zealand economy. However, we also play a vital role in the wellbeing of New Zealanders, and we must balance these objectives as the transition to a low-carbon world gathers pace.
The Government’s first Emissions Reduction Plan is a landmark document, laying out the plan to decarbonise. It sends important signals for where our collective efforts will need to be invested, and what actions the Government will take to encourage and coordinate that activity.

Mercury reported $581 million EBITDAF 1, $118 million up on the prior year’s $463 million OperationalEBITDAF.expenditure was $230 million, up $40 million on the prior year, while total stay-in-business capital expenditure was $68 million (up $12 million on the prior year).
During the year we worked with the Commerce Commission after incorrectly applying early termination fees for about 2,000 customers between 2016 and 2020, and were charged for breaching the Fair Trading Act following year-end. As part of responding to this, we completed remediation in early 2021. The 44-day unplanned outage at Kawerau geothermal power station also extended into the start of the financial year (ending on 20 July), coinciding with high spot prices. Mercury received a $26 million interim insurance payment.
We are on track to exceed our three-year objective of increasing the value of our business to $700 million EBITDAF on a normalised basis and have increased this target to $800 million EBITDAF. We have established strong platforms for growth over the year and look forward to continuing to grow value as we realise these opportunities.
While the completion of this acquisition was slightly delayed, we remain on-track to deliver the signalled synergy benefits
CREATING EXECUTABLE OPTIONS FOR NEW GROWTH FY22 has seen Mercury establish an enviable platform for future growth, setting us up for a period of rapid change as we continue to execute and deliver on these Ouropportunities.capitalbond and underwritten interim dividend reinvestment plan (DRP) have enabled much of this activity, as we have increased balance sheet flexibility while also refinancing about $360 million of the Trustpower retail acquisition.
The National Energy Strategy is an important next step. It must be aligned with the best long-term economics, and it needs to be cognisant of maintaining high levels of security and affordability as we increase the renewability of our energy system.
FY22 HAS SEEN MERCURY ESTABLISH AN ENVIABLE PLATFORM FOR FUTURE GROWTH, SETTING US UP FOR A PERIOD OF RAPID CHANGE.
Mercury’s net profit after tax was $469 million, up $328 million on the previous year, driven by the $367 million net gain on sale of our Tilt Renewables shareholding which funded the associated acquisition of Tilt’s New Zealand operations and future development options.
This has been a transformative year for Mercury. In twelve months, we have gone from having no wind generation to becoming New Zealand’s largest wind generator through the acquisition of Tilt’s New Zealand operations and the commissioning of the northern section of Turitea windfarm. In May, we became New Zealand’s biggest electricity retailer by customer market share and a truly multi-product utility provider through our Trustpower retail acquisition. There are also headwinds. Inflationary pressures and supply chain issues have seen project costs increase and will require careful navigation as we consider investment Weopportunities.areveryconscious of our responsibilities to our customers, particularly our vulnerable customers. Our approach to customer care continues to shape much of our existing and future retail activity. Electricity is one of many costs consumers are juggling, and holistic solutions are key to effecting meaningful change. Our nearly $500 million commitment to the ongoing refurbishment of our Waikato hydro stations continues, with the first turbine and generator replacement at Karāpiro now underway. Mercury has also signed a five-year geothermal drilling contract with Iceland Drilling, with the first phase of the extensive eight well programme underway. Our continued focus on a strong health and safety culture also delivered positive outcomes over the year. There were no serious harm injuries over the period and TRIFR (Total Recordable Incident Frequency) continued to trend down slightly (0.60 from 0.64 at the end of FY21). Addressing physical and psychological safety in parallel remains key to our continued success. Our ZIP (Zero Incident Process) training this year has helped us reinforce a zero-harm mindset across the business. Our Thrive programme supported shifting mindsets towards continuous improvement and long-term thinking. Taking what we have learned in the past two years, we are evolving to the next stage of the programme, which will focus on implementing changes to our ways of working through key strategic initiatives. We are pleased to report that Thrive has delivered an $47 million EBITDAF uplift compared to the $30 million forecast at HY21.
92022REPORTANNUALMERCURYENERGYFREEDOMTODAYMENU
THE VALUE OF OUR BUSINESS IS GROWING Decarbonisation of the New Zealand economy will underpin significant growth for Mercury over the coming decade. We are well placed to contribute to decarbonisation through our existing and future generation assets, supported by a scale retail business which is now a substantial contributor to forward revenue. Wind generation contributed to our financial performance for the first time in FY22, albeit that less windy weather constrained performance of our newest assets. The northern section of the Turitea windfarm is now on stream and generating, with construction of the southern section well advanced. Completion remains scheduled for Drymid-2023.weatherfor most of the year impacted on our hydro output as we focussed on prudent lake management coming into winter.Elevated spot pricing continued as a result of constrained conditions nationally. The electricity forward curve indicates this will continue for some time due to ongoing forecast, the rising cost of thermal fuels, and increasing carbon prices. This saw a lift in yields from the Commercial & Industrial segment, supported by an increase in physical sales following the re-contracting of previous Norske Skog volume at a price more reflective of the current market. Mass market yields were also up, albeit to a lesser degree. This reflected a mass market energy price increase of 5.2%, offset by a slight decline in customer numbers for the Mercury brand over the year.
As a result, Mercury’s FY23 EBITDAF guidance has been set at $580 million ($756 million on a normalised basis).
BUSINESS HIGHLIGHTS
102022REPORTANNUALMERCURYENERGYFREEDOMTODAYMENUfrom combining our two retail businesses. Looking forward, the team are working towards successful integration with an early focus on people and culture. Our vision for growth in the consumer segment is anchored around bundling opportunities outside the traditional energy offering. Our generation development pipeline continues to advance well, despite some of the challenges noted earlier. We were pleased to have gained consent for Kaiwaikawe wind farm during the year and continue to progress the business case for this alongside Kaiwera Downs and Puketoi windfarms and the expansion of the Ngā Tamariki geothermal station. The $30 million rebalancing works at the Rotokawa geothermal field noted in our interim update (delivering an additional 7MW on average per year) encountered some operational challenges during the year which has impacted immediate value gains, including a 'water hammer' event during commissioning, which resulted in a loss of containment of steam. While there were no injuries, we notified WorkSafe of the incident and have been charged for breaches of health and safety legislation following year-end. We are co-operating with WorkSafe, and plan to incorporate the findings that have come out of this project into FY23 as part of our focus on continuous Capitallearning.expenditure of $1,420 million comprised of $68 million of stay-inbusiness CAPEX and $1,352 million of growth CAPEX.
We also remain focussed on helping shape key policies that support decarbonisation including sharing our insights with the Market Development Advisory Group, New Zealand Battery Project and the Electricity Authority’s Wholesale Market Review. A carbon capture pilot at one on the four units at Ngā Tamariki geothermal station is also progressing well. If successful, Mercury will evaluate extending the technology to Ngā Tamariki's three other units. The sequestration of emissions from all four units could represent a reduction of approximately 30,000 tonnes of carbon dioxide per year. Looking forward, these learnings will be captured and help inform a potential extension of the pilot at Kawerau geothermal station.
The last two years have been a pressure test for resilience. It has heightened the importance of building the resilience of our people by developing an adaptive, learningfocussed organisation so we can continue to respond to an ever-changing future. Our culture change programme, Whakapuāwai is helping support business performance into the future. By building our internal capability, we have enabled greater internal career progression by extending learning opportunities across the organisation. During the year 51% of vacancies were filled by internal candidates against our target of 60%. Taking a more holistic approach to diversity and inclusion is key to future-proofing our pipeline of talent. Although Mercury has had diversity and inclusion objectives for a number of years, we are not satisfied with the progress we have made. Focus areas over the year included supporting employee network groups (the Pride Network, and Te Ao Māori ki Mercury), building strategic partnerships to grow our Māori and Pasifika employee base, capability building and awareness measures (like our Diverse Emerging Leaders programme), and a policy
PLAYING A LEADING ROLE IN NEW ZEALAND’S LOW-CARBON TRANSITION
We are committed to making a meaningful contribution to New Zealand’s lower-carbon future. We are working constructively with the sector, Government and officials to ensure the new resource management regime results in improved environmental outcomes. However there is a very real risk that the regime fundamentally inhibits decarbonisation. It is important that fair process and equal access is at the forefront of policy, rather than picking winners. The sector will need to embrace new ways of working together. The evolving Power Purchase Agreement (PPA) market in New Zealand is an example, supporting further renewables investment.
BEING ADAPTIVE AND RESILIENT, RESPONDING TO FUTURE NEEDS

112022REPORTANNUALMERCURYENERGYFREEDOMTODAYMENU
FULL-YEAR DIVIDEND
PRUE FLACKS // CHAIR VINCE HAWKSWORTH // CHIEF EXECUTIVE
EBITDAF: Earnings before net interest expense, tax expense, depreciation and amortisation, change in the fair value of financial instruments, gain on sale and impairments.
Getting to this stage is the result of many hands, and we extend our thanks to all our people. We also welcome our newest team members –including our 570 new Trustpower colleagues. We are grateful to all our shareholders, and the confidence you place in our company – including the 86% who have been with us since listing.
environment that supports an inclusive culture (like our refreshed flexible working Likeguidelines).manybusinesses, we continue to navigate a challenging labour market post-pandemic with staff churn at 20.8% over the period. We anticipate these challenges will continue for some time and are mindful of this as we eye up our future growth ambitions. We know our people are fundamental to our success, and measures like those noted above remain key to ensuring we continue to attract and retain talent.Building an adaptive and resilient company in a digital age has also shaped our focus on a future fit technology strategy. During the year we completed a review of our technology platforms, including the acquired Trustpower retail environment, and now have a blueprint that will unlock the targeted integration synergies and lay the foundations for a Future Ready digitally transformed Mercury.
Our advocacy and engagement with key communities continued over the year, including building on our work to redefine our approach to customer care. We established a ‘Here to Help’ team aimed at setting up vulnerable customers for a relationship with us that works for their individual circumstances. We also conducted an in-depth review of our relationships with iwi/Māori to understand how we could better work with them, and we are now working to improve and enhance these relationships. We’d like to thank all of those who participated in this important survey. Finally, we celebrated the 20th anniversary of our relationship with the Starship Foundation, and would like to extend this recognition to our customers who generously support this important work with us.
The Board has declared a full-year dividend of 12.0 cents per share (cps). This brings the full-year ordinary dividend to 20.0 cps, up 18% (17.0 cps FY21). We have extended our Dividend Reinvestment Plan to allow our shareholders to further support Mercury’s Wegrowth.areacutely aware that our dividend is an additional source of revenue for many New Zealanders – both our 74,000 shareholders and taxpayers more broadly. We are pleased to be able to increase the dividend for the fourteenth year in a row. FY23 ordinary dividend guidance is 21.8 cps, fully imputed, representing a 9.0% increase on FY22 and the 15th consecutive year of ordinary dividend increases.
CONTRIBUTING TO OUR COMMUNITIES
Next year will mark a decade since listing on the NZX and ASX. We are a different organisation to what we were in 2013. We have a bold vision for our future. We are excited at the opportunities ahead and what they will mean for our people, our customers, our partners, our shareholders and the communities in which we operate. Poipoia te kākano kia puāwai (nurture the seed and it will bloom). Together we are Mercury, Energy made Wonderful. Ngā mihi nui ki a koutou katoa.
CLOSING REMARKS FY2022 has been a memorable year. We have taken ambitious steps to position Mercury as a company ready for a decarbonised, digitalised, highly diverse future.


In this section we build on the key changes in our external environment covered by our Chair and Chief Executive and consider how we have taken into account and responded to our stakeholders’ identified needs, interests and opportunities in FY22. We cover the risks we face, and how we balance trade-offs through the lens of what matters most – what’s important to us and to our stakeholders. We look at how this all shapes our focus on how we create value in the coming years through to FY25.
12OURWORLDOFENERGYFREEDOMMENUMERCURYANNUALREPORT2022
OUR WORLD OF ENERGY FREEDOM. HE TAIAO MANAWHIRI PŪNGAO.

132022REPORTANNUALMERCURYOURWORLDOFENERGYFREEDOMMENU
Mercury undertook a review of our relationships with iwi, gathering insights into what Mercury and iwi consider to be most important as we work with one another, to understand how we can better work with them. We also conducted a public and private sector engagement review to understand the sector’s knowledge of Mercury and provide a benchmark for future engagement. (For further detail regarding our engagement in FY22, see our Partnerships pillar story on page 22).
• A co-design pilot in a targeted area with Mercury, Ministry of Social Development and FinCap’s Money Talks, which aims to successfully connect consumers with adverse credit to power through either Mercury or GLOBUG.
• A new 'Here to Help' team who are dedicated to working with customers in hardship, particularly those with high bills or in complex situations.
ENGAGING WITH IWI AND STAKEHOLDERS.
KEY GROUPS WE WORK WITH For further detail around the groups we work with and what’s important to them about Mercury, please see the Engaging with Our Stakeholders content on our website. Electricity Authority’s work on market operations under a 100% renewable electricity supply. A key focus in FY23 will be contributing to an independent study that will bring together information from across the electricity and gas sector to look at the best pathway towards a low carbon energy system for Aotearoa and a roadmap to deliver that pathway.
COMMUNITY SUPPLIERSPARTICIPANTSINDUSTRY CUSTOMERS EMPLOYEES
SUPPORTING OUR COMMUNITIES During FY22 Mercury continued to work within our communities on several initiatives including:
• The ERANZ Energy Mate pilot (winner of the Outcomes Award at the national Energy Excellence Awards) –a partnership between electricity retailers, lines companies, community organisations and the Government to help whānau get the most out of their electricity.
Building and maintaining relationships with iwi and stakeholders across our business is crucial to our success. We need to know what's important to the people and groups we work with and rely on for our business. That way we can commit the right resource to the most relevant business activities. Our strategy and business plans are developed with consideration given to the relevant needs and wants identified by iwi and stakeholders as most important to them. We also recognise we need to maintain, and potentially build, stakeholder relationships over Duringtime.FY22
Te Ihingarangi is descended from the Tainui waka, and is tupuna (ancestor) to Ngāti Koroki Kahukura. This mahi toi (monument) to Te Ihingarangi stands above the Karāpiro Dam. Artist: Lyonel Grant (Ngāti Pikiao, Ngāti Rangiwewehi, Te Arawa).
WORKING TOWARDS A SUSTAINABLE FUTURE In FY22 we worked with other companies and Government through the Aotearoa Circle’s Low Carbon Energy Roadmap initiative. This roadmap outlines a low carbon path that ensures energy security, affordability and a just transition towards the Government’s target of net zero carbon emissions across the economy by 2050. In addition to this work, we continue to be actively involved in various initiatives and programmes seeking to work through issues facing the sector, including supporting the Climate Change Commission, providing feedback on New Zealand’s Emissions Reduction Plan and submitting on the
INVESTORS
PARTNERS IWI &GOVERNMENTREGULATORS
RESPONDING TO WHAT WE HAVE LEARNED Based on the feedback we've received through these reviews, we are considering how we engage with iwi to improve the mutual value gained from these interactions. We also aim to increase Mercury’s cultural capacity and enable our staff to better participate in iwi relationships. For our public and private sector stakeholders, we recognise the importance of contributing more towards the national conversation on decarbonisation, realising that the electricity sector needs to take a leading role in addressing climate change. We are eager to gather additional insights from our partners and stakeholders and will continue to define the most appropriate and productive ways to shape our engagement processes in FY23. Details of our iwi relationships and our stakeholder groups, alongside what’s important to them about Mercury, can be found on our website.

THE
142022REPORTANNUALMERCURYOURWORLDOFENERGYFREEDOMMENU
KEY AREARISK SAFETY COMPLIANCEANDREGULATORY REPUTATION OPERATIONAL FINANCIAL PEOPLE TRENDSCURRENTIMPACTINGFACTORS
PILLARSOUR A comprehensive summary of our key risks and how we manage them is included in the Governance at Mercury section of the report. We review and update these risks every year to take into account changes in the external environment and our internal operations. In this section we provide a summary of the trends we have seen this year in our key risk areas. We take these into account in our view of what matters most and to shape our focus for how we create value over time. RISKS WE FACE.
Safety is an essential objective for us and is one of the major risks that could affect the wellbeing of employees, contractors, customers, and the public. Our focus on process safety continues as a priority at our Generating assets. The resources in our Process Safety team have been increased to assist delivering in this area. A amountconsiderableofprojectwork has been completed in FY22 improving our safety critical elements at our three Major Hazard Facilities. We continue to monitor and meet the requirements of our safety collaboratingcases,regularly with ManagingWorkSafe. safety risk is of primary importance to us, particularly with large projects, including our Turitea wind farm, hydro and shuts.geothermalrefurbishmentsgeothermalandmaintenance
Compliance with resource consents and the Electricity Industry Participation Code is important for our ability to operate. Compliance with internal policies is an important tool to assess risks and deter fraud. We also consider regulatory change in this area, which presents significant risks to Duringus.
FY22, several regulatory processes with the potential for significant impact to us were progressed (e.g. RMA reform, Emissions Reduction Plan, National Energy Strategy, NZ Battery Project, Price discovery when 100% renewable electricity, wholesale market review, Transmission Pricing implementation,MethodologyLow Fixed Charge Tariff and Prompt Payment Discount removal). Our reputation with investors, stakeholders and the broader community is one of our most significant assets. Ensuring that our fuel resources, plants and systems don’t have negative impacts on others is critical. The importance of stakeholder relationships and input has continued to grow across each of our key stakeholder groups – our customers, communities, partners and owners. The level of activity and sophistication of cyber-attacks continues to increase within New Zealand and globally. We continue to implement a comprehensive and multi-faceted security uplift programme which seeks to improve our security maturity. Operational risks have a potentially significant impact on our ability to generate electricity and create revenue. The key operational risks include: asset management and availability; fuel availability; market exposure; and business interruption (events such as natural disasters or Inpandemics).globalmanagingthese risks, in FY22, we focussed on our programme of hydro refurbishments and geothermal shuts; adding Turitea and the Tilt wind assets into our generation fleet; and actively balancing the challenges faced by constrained fuel supplies (water, wind and gas). Key financial risks include: climate change impacts, appropriate insurance cover and our ability to execute on projects and new growth initiatives. Finance and related activities have key process controls that are subject to regular review and continuous improvement. A core element of financial sustainability is the opportunity cost related to our ability to identify and execute growth options. In FY22, this risk was mitigated through the completion of the of the northern section of the Turitea wind farm, along with the successful acquisition and integration of the Trustpower business into Mercury. Attracting, developing and retaining capable people who can contribute to our strategic priorities and grow with the business continues to be our focus. We also continue to focus on the physical and mental wellbeing of all people who are important to our Withbusiness.theprogression of Thrive and Whakapuāwai, Mercury continues to provide opportunities for high levels of employee involvement and engagement. These initiatives seek to create a culture and way-of-working that embraces learning, challenges mindsets, lifts capability and celebrates curiosity.
OUR PILLARS <IR> CAPITALS CUSTOMER SOCIAL RELATIONSHIP& KAITIAKITANGAPARTNERSHIPS
right-hand corner are those that
them to define the reporting boundaries. WHAT’S IMPORTANT TO US STAKEHOLDERSOURTOIMPORTANTWHAT’S INDUSTRYRESEARCH& CUSTOMERLOYALTY EXPERIENCECUSTOMER MATERIALITYDEVELOPMENTGENERATION ASSESSMENTASSETSGOVERNMENT®ULATORSDEVELOPMENTCAPABILITYPERFORMANCEHIGHTEAMS& IWIBRAND CHANGECLIMATE SAFETY WELLBEING& RESOURCESNATURALOPERATIONALEXCELLENCE GROWTHSUSTAINABLE
PULLING IT ALL TOGETHER.
MANUFACTUREDNATURAL PEOPLE INTELLECTUALHUMAN COMMERCIAL FINANCIAL
This is visualised through our materiality assessment (shown below from FY21) which combines what matters most to our stakeholders and what matters most to us. We are conscious of the changing world we operate in and will review our assessment to gather any changes in FY23.
the highest.
the most important topics we have covered them in this Annual Report and
152022REPORTANNUALMERCURYOURWORLDOFENERGYFREEDOMMENU
Our five pillars, established in 2016, represent the key drivers of material value creation for our business. They enable us to integrate what matters most to Mercury and our stakeholders. They form the framework for our long-term strategy and short-term business planning and reflect the six capitals of the Integrated Reporting <IR> framework (see below). Each year our view of what is material for us is informed by reviewing our strategy against a broad context including: • the items covered in the preceding pages • the external environment • feedback from our stakeholders on what is important to them about Mercury • risks to manage and opportunities to explore We keep up to date with changes in these areas to consider how our approach needs to evolve to ensure we continue to create value. These insights are combined to form a view of what’s material to our business. We have maintained our view of materiality (which was updated in FY21), with feedback from our stakeholders and the insights from our risk assessment confirming that we continue to focus on what is most important.
The focus areas in the top rank As used

162022REPORTANNUALMERCURYOURWORLDOFENERGYFREEDOMMENUCUSTOMER New Zealand’s leading energy brand. KAITIAKITANGA Recognised as a leader in the ultra-long-term management of both physical and natural assets. COMMERCIAL Leading our sector in terms of financial performance and shareholder returns, earning at least our cost of capital. PEOPLE A Zero Harm organisation that has enabled our people to adapt to the changing nature of work to deliver the highest levels of performance and productivity. PARTNERSHIPS Recognised as a leader within our industry, with our industry recognised as a positive contributor to New Zealand, and with Mercury’s access to fuel enduring and enhanced. OUR MISSION: FREEDOMENERGY OUR 2030 LONG-TERM GOALS THRIVIN G TODAY SHAPING TOMORROW OURTHREE-YEAR OBJECTIVES TO INSPIRE NEW ZEALANDERS TO ENJOY ENERGY IN MORE WONDERFULWAYS OUR PURPOSE OUR FY22–24 STRATEGIC FRAMEWORK.CURIOUS&ORIGINAL•SHARE&CONNECTCOMMIT&OWNITBe an adaptive and resilientfutureresponsiveorganisation,toneeds. Play a leading role in New successfulZealand’stransitiontoalow-carboneconomy. Enhance our licence to operate through collaborative work with stakeholders.our Createoptionsexecutablefornewgrowth.Unleashthefull potential of our peopletransformingthroughculture. Increase the value of $700Mbusinessourto$800MEBITDAF. CURRENTLY UNDER REVIEW CURRENTLY UNDER REVIEW SHAPING
• executing options for new growth through the acquisition of the Trustpower retail business Like all businesses, we are seeing an ever-accelerating pace of change and we recognise our strategic framework will evolve, especially due to the significant changes seen in our business in FY22 (such as our acquisition of Trustpower’s retail business).
•including:adapting our organisation and responding to needs through our programme of continuous operational improvement called ‘Thrive’
• unleashing the potential of our people by building capability and culture through our Whakapuāwai programme
• what we learn from our partners and stakeholders • the risks we face • materiality In FY22 we implemented our refreshed framework to align our activities towards our new mid-term (three-year) objectives. One objective was to enhance our licence to operate through collaborative work with our stakeholders. During FY22 we undertook reviews of our relationships with key groups and integrated insights into our business planning. We are on track to exceed our three-year objective to increase the value of our business to $700M EBITDAF, and have increased this target to $800M EBITDAF. We intend to review our purpose and our long-term goals in the light of these changes, looking to evolve our strategic framework to balance insight with clarity of direction to guide action to build success in the future.
In addition to the above, we pursued our three-year objectives through actions
Implementing our strategic framework to allow 'Thriving Today' and 'Shaping Tomorrow'.
172022REPORTANNUALMERCURYOURWORLDOFENERGYFREEDOMMENU
• increasing the value of our business through commissioning new wind generation at Turitea
Our strategic framework maps what we will need to focus on in the near and mid-term, to continue to grow and create value over time. This framework was reviewed and reframed in FY21 focusing on: • the economic, regulatory, market and other elements of our operating environment (noted in the Chair and Chief Executive update) • internal factors to our business such as culture and safety (noted in the Chair and Chief Executive update)
CREATING VALUE IN THE FUTURE.

18MENULIVINGENERGYFREEDOMMERCURYANNUALREPORT2022LIVING ENERGY FREEDOM. TE ĀHUANOHO I TE MANAWHIRI PŪNGAO.
In this section, we seek to bring to life the five pillars of our business, and what they mean to us, through stories that are examples of material activity undertaken through the past year. We reflect on our responses to challenges and opportunities, share our successes, progress and also lessons from things that didn’t go as planned.

1. CUSTOMER. Now a leading multi-product retailer, we can add material value for customers in terms of convenience, cost efficiencies and the delivery of innovative and exciting products. VALUE FOR CUSTOMERS.
192022REPORTANNUALMERCURYMENU
ENHANCING
ENHANCED LICENCE TO OPERATE As New Zealand transitions to a low carbon economy, we want to ensure this shift is equitable for all consumers, including those experiencing hardship. We are acutely aware of the role we have to play as an essential service provider. As we continue to grow in scale, this obligation to all consumers also grows in importance. As noted in the Chair & Chief Executive Update, inflationary pressures and cost of living are now a global issue, unduly affecting those who can afford it the least. New Zealand is not immune, with inflation hitting a 30-year high and cost of living increasing across the board in the first half of 2022, creating financial pressure for many households. Our own customer research has also shown a notable increase in incidences of hardship and perception of hardship being a more significant issue. Our approach to customer care is centred on putting compassion, connection and care at the heart of all we do and delivering solutions that are practical and sustainable. We have implemented targeted solutions like payment options, a variety of pricing plans, energy monitoring tools and a customer care hub on our website. Our customer service agents are empowered to help customers who are struggling with their finances by offering those solutions and we also have a specialist ‘Here to Help’ team who are dedicated to working with customers in hardship, particularly those with high bills or in complex situations. We continue to work closely with budgeting, community and social agencies, as well as others in the sector to improve customer outcomes and deliver holistic solutions for those most in need of extra support. As an example, our Community Engagement Manager is a member of the Ministry of Business, Innovation and Employment’s Energy Hardship Reference Group which facilitates greater coordination to support efforts aimed at reducing energy hardship in communities.
FREEDOMENERGYLIVING

Targeted support for those most in need of help has been wrapped around this change, including a sector-established fund aimed at easing the impact for those affected by LFUC phase-out. We also contribute to the wellbeing of New Zealand communities through other sponsorships and partnerships. Notably, it has been a record-breaking year in our 20-year partnership with the Starship Foundation in terms of the number of customers who have made donations and the total amount of donations made. We are grateful to all Mercury customers who have donated to Starship.
202022REPORTANNUALMERCURYMENUCUSTOMER SUMMARY. STRATEGIC GOALS: OUR THREE YEAR OBJECTIVES • Enhance our licence to operate through collaborative work with our stakeholders. • Increase the value of our business to $700M $800M EBITDAF. KEY RISKS • Errors in customer data quality, billing or general communications, impacting on customer service and compliance. • Loss of customer data (both physical and digital) or a systems failure impacting on our ability to operate core systems.
the completion of this acquisition was slightly delayed, and there were challenges preparing for the completion during Covid-19 lockdowns, we remain on-track to deliver the signalled synergy benefits from combining our two retail businesses. This includes the acceleration of our retail strategy, which is centred on delivering the right product mix and enhanced value for customers; focusing on premium offerings, bundles and unique solutions. It also means we can expand our presence as a national operator. Integration of the two retail businesses will occur over time. Mercury and Trustpower customers are currently continuing to be serviced by both retail brands. Our focus as we integrate is to bring together what customers love from each brand while adding further value, delivering more as a
FREEDOMENERGYLIVING
CREATING EXECUTABLE OPTIONS FOR NEW GROWTH
This year also saw the start of a staged approach to unwinding the LFUC (Low Fixed User Charge) tariff, an Electricity Price Review recommendation largely supported by the sector.
During the year we worked with the Commerce Commission after incorrectly applying early termination fees for about 2,000 customers between 2016 and 2020, and were charged for breaching the Fair Trading Act following yearend. We have focussed on making this right with impacted customers by sincerely apologising to them, refunding the early termination fee and making a small additional payment in acknowledgment of our error (completed in early 2021). In a small number of cases in which we have been unable to locate an impacted customer, we have set aside their unclaimed credit balance, and at the same time donated the equivalent of their unclaimed credit balance to the Starship Foundation.
On 2 May Mercury became New Zealand’s leading multi-utility retailer through the acquisition of Trustpower’s retail business. The milestone event doubled our total customer connections to approximately 787,000 connections at the time of acquisition. It also accelerated entry into the telecommunications market, with Trustpower selling fixed and wireless broadband and mobile phone services together with traditional energy offerings (electricity and Whilegas).

THROUGH CUSTOMERS.OUR
• COMMERCIAL - our acquisition of Trustpower’s retail business will drive growth in our business.
FREEDOMENERGYLIVING
CREATING
Our focus on enhancing value for customers delivers shared value across other Mercury Pillars. For example:
• PARTNERSHIPS – by working with others to grow our knowledge we can work together to improve customer outcomes and deliver holistic solutions for those most in need of extra support.
• PEOPLE - the addition of Trustpower team members with experience in telecommunications and multi-product bundling has grown the capability of our team. OUR VISION FOR GROWTH IS CENTRED ON OFFERING.THEOPPORTUNITIESBUNDLINGOUTSIDETRADITIONALENERGY
KAITIAKITANGA PEOPLECOMMERCIAL CUSTOMERPARTNERSHIPS 212022REPORTANNUALMERCURYMENU
combined business than either business could have done alone. Our vision for growth is centred on bundling opportunities outside the traditional energy offering; an area Trustpower has already had great success in. Like electricity, broadband is central to people’s lives at home and at work so it was a natural first step beyond energy for Mercury. In 2021, we began a pilot of ‘Mercury Broadband’ in partnership with NOW NZ. In June, Mercury Broadband launched to the Mercury customer base, giving customers the ability to add fibre broadband to their Mercury account. Going forward, we will look to leverage and extend the products and solutions we gained via the Trustpower Finally,acquisition.inMay we ended our partnership with Airpoints™ and launched a new home of rewards which enables Mercury customers to earn points when they sign up for Mercury Rewards, pay their bill and complete Mercury App challenges. Points can be used to unlock Free Power Days and bill credits, and customers receive Anniversary Free Power Day bonuses. VALUE

SHAREDCOMMITMENT,COLLECTIVEACTIONS.ENHANCEDLICENCETOOPERATE
We listen carefully and continue to refine our approach to stakeholder engagement.
222022REPORTANNUALMERCURYMENU
Thetogether.natural environment that Mercury relies on around our generating assets is part of a complex landscape with many other groups closely intertwined with the land and water, some of whom have been here a lot longer than we have.
2. PARTNERSHIPS. FREEDOMENERGYLIVING
During the year we engaged Oceania Group to undertake a review of our relationships with iwi/Māori to understand what is working well in our relationships, and what opportunities there are to deliver additional mutual value. The review considered how things stand currently, and recommended ways in which Mercury can continue to build partnerships that foster and enhance relationships, through putting the objectives of our partners front and centre. The review consisted of 51 structured interviews across iwi/hapū groups and the Mercury team to understand current views across topics such as cultural competency, trust, quality of engagement, power dynamics, and the mood of the relationship.
There were many positive reflections from iwi and also some insights on what values are most important in the relationship, the importance of trust, and the hidden “cost” to iwi of the relationship. Based on this knowledge we are resetting our engagement methods to improve the efficiency and value to our partners, and working through a plan on how to address opportunities to enhance the cultural capacity within Mercury. Wherever possible Mercury staff participate directly in iwi relationships rather While the electricity sector is well-placed to support the country through the transition, no one sector will be able to create a low carbon future for New Zealand on its own.
We continue to recognise our longterm commitment to our communities and stakeholders, and to recognise our interdependence with them in many areas. This year we sought independently facilitated feedback from key groups to understand how we might continue to grow and work
We work with others where Mercury’s values align and where we are in pursuit of shared outcomes (commercial, societal and environmental) to create solutions that will make a difference.

A separate review spoke to public and private stakeholders who have potential to impact on our strategic objectives such as policy makers, local and central Government, economists, media and other industry participants. This acknowledges the importance of this group to understand and re-tell the Mercury ‘story’, and their influence on the policy settings that support our existing and future business. The review’s purpose was to understand key issues for our stakeholders, the health of our relationship with them and their view of the sector. We were pleased to learn that the reputation and standing of Mercury was strong with this group. We are working to address areas where it was identified that we could be doing more. We now understand that this group believes that Mercury could be making a greater contribution to national conversations about decarbonisation, as a key participant in the energy sector, and that the sector itself lacks a coherent narrative on this key issue. Another key theme to emerge from this survey was the belief that the sector needs to collaborate more to address climate change to support best outcomes for Aotearoa. We have taken this insight on board. We continue to work with our large commercial customers around the commercial arrangements to offer them wholesale power. PPAs (Power Purchase Agreements to supply electricity) and sleeving arrangements (where a third party is added between generation and retailer to mitigate the intermittent nature of wind or MERCURY IS HIGHLY MOTIVATED TO TAKE A COLLABORATIVE ROLE WITH OUR SECTOR AND INDUSTRY. solar power) make it easier for new renewable electricity generation to be built, and for customers to be able to access a reliable supply.
The electricity sector has a pivotal role to achieve New Zealand’s decarbonisation goals, and Mercury is highly motivated to take a collaborative role with our sector and industry, and to engage closely with policy makers. We believe that a constructive, collective effort is required. The issues are complex and cannot be addressed in isolation. Along with the overarching challenges of addressing climate change, and inter-connected with the outcomes of this issue, is the need to ensure equitable access to electricity for all in a time of growing economic uncertainty. The Government’s Emissions Reduction Plan (ERP), released in May, was an important step towards decarbonising our economy. It sent signals for where our collective effort as a sector needs to be directed. Our electricity generation is already low emissions and our renewability
STRATEGICSUMMARY.PARTNERSHIPSGOALS:OURTHREE
• Regulatory changes that could affect how we manage our integrated business model.
YEAR OBJECTIVES
Mercury is firmly focussed on doing our part for New Zealand’s lower-carbon future.
FREEDOMENERGYLIVING
PLAYING A LEADING ROLE IN NZ’S LOW-CARBON TRANSITION
• Enhance our licence to operate through collaborative work with our stakeholders.
Mercury has a PPA with Genesis for energy generated at our Waipipi wind farm.
232022REPORTANNUALMERCURYMENU
• Play a leading role in New Zealand’s successful transition to a low-carbon economy. KEY RISKS
• Short and long-term changes in supply and demand impacting on the wholesale electricity market.
than using external consultants as we believe this demonstrates a genuine commitment to partnering with Māori. It also upskills our staff and enhances their understanding and appreciation of this world view.

• KAITIAKITANGA – working collectively and sharing our insights is key to supporting New Zealand’s decarbonisation goals.
• PEOPLE – we work in complex interconnected communities and we are actively seeking feedback to build out and develop this capability in our people.
FREEDOMENERGYLIVING
CREATING VALUE THROUGH PARTNERSHIPS.OUR
At a sector level, Mercury is one of the partners who has contributed to the thinking behind the Aotearoa Circle’s Low Carbon Energy Roadmap (LCER). The Aotearoa Circle is a partnership of public and private sector leaders unified and committed to the pursuit of sustainable prosperity and reversing the decline of New Zealand’s natural resources. The Roadmap incorporates significant insights and expertise from across the sector, and was designed to inform Government thinking and decisions regarding emissions reductions, energy policy and the National Energy Strategy (NES), targeted for completion by 2024. We will continue to engage with the teams working on the NES to champion a collaborative process to leverage the insights and expertise from across the sector. Decarbonisation is a complex and multifaceted goal and progress will depend on recognising the interconnected nature of the systems at play. To design and implement policy across multiple sectors is an immense task, but achievable if we work together. Data, insights and recommendations from the cross-sector work may also inform the allocation of capital investment into the New Zealand energy sector.
KAITIAKITANGA PEOPLECOMMERCIAL CUSTOMERPARTNERSHIPS 242022REPORTANNUALMERCURYMENUis growing, with the country's total electricity supply expected to reach over 90% renewable in the next 3-5 years. We are in a great place to support other sectors like transportation and industry in their own decarbonisation efforts. All Kiwis should have equitable access to low carbon transportation and lifestyle options.
Our focus on working with others in the sector and our communities involves integrated thinking and delivers shared value across other Mercury Pillars. For example:
• COMMERCIAL – commercial arrangements with other generators supports decarbonisation of the New Zealand economy and addresses climate change.

This year we have continued the stewardship of our generating assets and the environments we share, including our ongoing investment in the generation of renewable electricity. This long run capital expenditure platform underpins sustainable performance of our generating assets. Investment includes ‘big ticket’ greenfield builds and significant investment in upgrading and maintaining our current power stations, contributing to the longterm performance and security of key generation assets important to New Zealand and its energy freedom.
252022REPORTANNUALMERCURYMENU
ENHANCED LICENCE TO OPERATE Mercury’s focus on enhancing its existing generation includes the six-year $75 million modernisation project of the Karāpiro power station, announced in 2019. Installation of updated technology means that generation will be more efficient, achieving more power from the same water. Increased output from the station after the first unit outage should be seen from May 2023. The full programme will increase overall peak station capacity by 17% (16.5MW) to 112.5MW and average energy production by 32GWh to 537GWh per annum, an increase enough to power approximately 4,500 New Zealand homes.
A commitment to the te ao Māori concept of kaitiakitanga (guardianship and protection) guides the ways in which we work with natural resources and the power stations that were built by earlier generations of New Zealanders. A wider application of this principle extends to Mercury’s support and commitment to the decarbonisation of New Zealand’s economy.
TOCOMMITMENTCARING.3.KAITIAKITANGA.
FREEDOMENERGYLIVING

262022REPORTANNUALMERCURYMENU
STRATEGICSUMMARY.KAITIAKITANGAGOALS:OURTHREE OBJECTIVES Enhance our licence to operate through collaborative work with our stakeholders. Increase the value of our business to $700M $800M EBITDAF. Create executable options for new growth.
INVESTMENT
•
•
FREEDOMENERGYLIVING
• Availability of water for hydro generation and geothermal fluid for geothermal generation.
•
The project delivered on the plant efficiency improvements, however an issue resulted in a 'water hammer' event that led to a loss of containment of steam during commissioning.
CREATING EXECUTABLE OPTIONS FOR NEW GROWTH At the Rotokawa geothermal field, working with our joint venture partner Tauhara North No.2 Trust, we have completed $30 million of rebalancing works, projected to increase capacity by an additional 7MW on average each year. This was a challenging and complex project to combine two plants (Nga Awa Pūrua and Rotokawa) on the field. Rotokawa Power Station was upgraded to process more of the hot geothermal fluid and a separation plant was installed to route high enthalpy fuel (steam) to Nga Awa Pūrua and low enthalpy fuel (brine) to Rotokawa. The new technology has increased the output of each station because they are using the resource more efficiently and producing more electricity.
Mercury notified and cooperated with WorkSafe following the incident, and three of the four improvement notices WorkSafe issued have been resolved. Following year-end Mercury has been charged for breaches of health and safety legislation arising from the incident. Since the incident, Mercury has been collaborating with external and internal experts to progress design enhancements to maximise long-term safety and efficiency. This will be completed in FY23. INCLUDES ‘BIG TICKET’ GREENFIELD BUILDS AND CURRENTANDINVESTMENTSIGNIFICANTINUPGRADINGMAINTAININGOURPOWERSTATIONS.
Since the project was announced, substantial enabling works have taken place including undertaking spillway and diversion tunnel maintenance, 400V distribution upgrades and necessary powerhouse crane maintenance. The first unit outage will take place from August 2022 to May 2023 (with programmed outages for the other two units commencing August 2023 and 2024). Looking forward, we’ve been talking with the community around the dam as the dam road will need to be closed for four months in each of the coming three years to safely and efficiently carry out the works. Procurement and manufacture of parts is well underway, with delivery to site of major componentry. The Karāpiro works are part of an extensive programme on the Hydro System, with around a quarter of a billion dollars invested so far. Planning has commenced for two more stations, Maraetai and Ātiamuri, for future significant works.
•
• Play a leading role in New Zealand’s successful transition to a low-carbon economy. RISKS An event that impacts on the viability, efficiency or operability of our power stations.
KEY
YEAR
• Ability to secure future development opportunities for geothermal and wind generation.

Our commitment to stewardship of our generating assets and environment as well as the broader decarbonisation of the New Zealand economy involves integrated thinking and delivers shared value across other Mercury Pillars. For example:
This is the fourth year we have reported on our climate-change disclosures in accordance with the recommendations of the Task Force on Climaterelated Financial Disclosures (TCFD). Please see our comprehensive TCFD Report for more detail.
More broadly, transport is New Zealand’s biggest opportunity to decarbonise. Mercury supports the Government’s transport decarbonisation hierarchy of “avoid” (reduce travel), “shift” (to active and/or shared modes of travel) and “improve” (decarbonise our vehicles). To support improving the carbon footprint of New Zealand’s vehicle fleet through the uptake of electric vehicles (EVs), we have agreed a partnership with start-up Hikotron in its rollout of a New Zealandmade smart AC charging network. To shift more travel to active or shared modes, the government’s Emissions Reduction Plan (ERP) targets for transport by 2035 include reducing vehicle kilometres travelled by cars by 20% through providing better travel alternatives. Given Mercury’s holistic commitment to decarbonising transport, we have been supporting Big Street Bikers since 2019 to build a nationwide network of secure e-bike docking and charging sites (“Locky Docks”) to encourage e-bike use in our cities. The agreement supported the construction of sites in Christchurch, Auckland and Wellington.
• PARTNERSHIPS – we are actively collaborating and learning through initiatives to accelerate New Zealand’s transition to a low-carbon future.
FREEDOMENERGYLIVING
• PEOPLE – the trial of reinjecting carbon at Ngā Tamariki reflects Mercury's commitment to science and research, enabled by a culture of innovation.
• COMMERCIAL – we are taking a leading approach to decarbonisation: building new renewables, refurbishing our current power stations, and carefully managing our portfolio.
KAITIAKITANGA PEOPLE PARTNERSHIPS COMMERCIAL CUSTOMER 272022REPORTANNUALMERCURYMENU
CREATING VALUE KAITIAKITANGA.THROUGH
The purpose of the trial is to determine the viability of reinjecting CO2 back into the geothermal reservoir without affecting its sustainability, or the operation of the power station. If successful, Mercury will evaluate extending the technology to Ngā Tamariki's three other units. The cumulative emissions reduced from all four units at Ngā Tamariki would be approximately 30,000 tonnes of carbon dioxide per annum. This research and development takes place at the same time as Aotearoa New Zealand’s other significant geothermal generators, Contact Energy, Ngāwhā Generation and Eastland Generation (who, together with Mercury, represent 96% of the country’s total geothermal energy supply), are also trialling carbon capture and reinjection. Across all operators, cutting geothermal emissions has the potential to reduce this country's carbon emissions by 568,000 tonnes per year, equivalent to taking over 236,000 cars off the road. Despite emissions from geothermal power production making up a relatively small component of the country’s emissions profile, it’s still of significant benefit.
PLAYING A LEADING ROLE IN NZ’S LOW-CARBON TRANSITION Mercury’s commitment to the country’s decarbonisation includes significant research and development in how we decarbonise our own operations at source, along with exploring ways to help other industries decarbonise by harnessing the power of renewable electricity. Addressing emissions from our geothermal facilities is our single biggest opportunity to address our Scope 1 emissions. Carbon reinjection returns naturally occurring geothermal carbon dioxide to the underground reservoirs from where it has been drawn, rather than being emitted during power generation. A pilot project this year was the result of significant research and development towards re-injecting carbon to the geothermal reservoir at Ngā Tamariki. Mercury’s trial on one of the four units at Ngā Tamariki Power Station is the first use of the technology in the Southern Hemisphere, and comes after two years of process and safety study, geochemistry and reservoir modelling, laboratory testings and collaborative engineering work with geothermal technology provider, Ormat.

UNLEASHIING THE FULL POTENTIAL OF OUR PEOPLE We are continuing to progress our Thrive programme, which is centred on delivering initiatives to enhance performance. Examples of initiatives which are already providing value for Mercury are covered in the Commercial pillar story. The next stage of the programme, starting in FY23, will have an increased focus on building capability and identifying initiatives which support changes to our ways of working.
We recognise the important role culture plays in Mercury’s ability to thrive into the future. We have launched a culture programme called Whakapuāwai (meaning to evolve, prosper or thrive), which has helped us to identify where our culture is, where we want it to be and what we need to do to get there. In essence, we want to continue to cultivate a culture that is adaptive, resilient, collaborative and improvement focussed. We have held Whakapuāwai sessions with our people to encourage thinking about culture, 4. PEOPLE. As we head into a major period of growth, we are focussed on evolving our culture, taking an inclusive approach that fosters diversity and growing our internal capability to set ourselves up for long-term success.
OUREVOLVINGCULTURE.
what role it plays in an organisation and how every employee contributes to forming and sustaining that culture. We paused some Whakapuāwai activity so we could also include our new team members from Trustpower in these sessions, which we are now progressing. We have also identified opportunities for improvements we can make at an enterprise level to evolve our culture and further enhance our business performance.
FREEDOMENERGYLIVING
282022REPORTANNUALMERCURYMENU

292022REPORTANNUALMERCURYMENU
PEOPLE SUMMARY.
A simple, but very empowering statement that shows the important part we all play in creating a great culture.”
- Jo Christie "Culture is always there, even when you don’t think about it. It can have positive and/or negative aspects. By becoming aware of what we can do as individuals to reinforce or change our culture, we are empowering people to thrive collectively."
• Increase the value of our business to $700M $800M EBITDAF.
• Enhance our licence to operate through collaborative work with our stakeholders.
- Jason Parker
• Be an adaptive and resilient organisation through collaborative work with our stakeholders.
• Unleash the full potential of our people through transforming culture.
• Failing to recognise the importance of employee wellbeing for growing a culture that embraces learning, challenges mindsets, lifts capability and celebrates curiosity. “People love turning up to work in a good, strong happy culture, and, of course, the inverse applies so it's in all our interests to have a good, fun culture that makes us want to get out of bed in the morning to come to work.”
KEY RISKS
MERCURY TEAM MEMBERS’ REFLECTIONS ON CULTURE
“It has been fascinating to understand and learn what culture actually is and how much it impacts the employee experience, performance and achieving strategic objectives at work. If everyone can be made aware of this, and what it takes to achieve a succeeding culture, then it’s win-win all round.”
- Michelle Jacobs “Culture can be a challenging, shape-shifting construct; hard to define, but pivotal to what we do and who we are as an organisation. So, it’s refreshing that we get the space to understand and think deeply about it.”
We have launched a Diversity and Inclusion strategy which builds on our belief that having a team of individuals from different backgrounds, views, experience and capabilities working together makes us stronger and better as an organisation. We have been engaging with our people leaders so they understand the importance of diversity and inclusion and can make decisions every day that help us to achieve our targets. Our reporting on our gender pay gap saw us become one of the first 50 companies to be included in New Zealand's first Public Pay Gap Registry when it launched in March. We acknowledge we still have a way to go to meet the targets, which are covered in Governance at Mercury. We have two Employee Network Groups underway to grow awareness, celebrate uniqueness and promote inclusiveness. The Pride Network aims to create a more safe, supportive and equitable Mercury for our rainbow people and customers, while Te Ao Māori ki Mercury aims to uplift te reo me ona tikanga and te ao Māori within the Allorganisation.Mercurypeople leaders have participated in unconscious bias training, and we have introduced a Diverse Emerging Leaders programme to support career progression for employees from diverse backgrounds and contribute to creating a more inclusive work environment. We have also committed to a Support Partner relationship with the not-for-profit TupuToa, which will see us take on nine Māori and Pasifika interns/graduates over a three-year period, supporting their entry into professional careers and growing our young Māori and Pasifika employee base. We have refreshed our Flexible Working Guidelines to better reflect and support different ways of working for individuals and teams. The new guidelines allow for increased flexibility, provided an individual’s needs are balanced with the needs of the team and organisation. Providing increased flexibility is also a key employee attraction and retention tool. The talent of our people was recognised in multiple forums over the year, and we extend our congratulations to those individuals and teams. This included recognition for our team involved in the Tilt acquisition (INFINZ M&A transaction of the year) and our Treasury and Finance teams for capital structure management (Excellence in Treasury). Our Chief Financial Officer, William Meek was also recognised as CFO of the Year by Deloitte, and our marketing team received golds in the Consumer Services and Most Effective categories of the 2022 Beacon Awards for the ‘Move with Mercury’ campaign.
• An incident occurring that causes a fatality or serious injury to our employees, a contractor, a customer or the public.
- Glen Brown
FREEDOMENERGYLIVING
• Failing to develop, engage and retain our growing talent.
STRATEGIC GOALS: OUR THREE YEAR OBJECTIVES
- Daniel Chaparro “What really resonates with me is ‘we all own the culture; it is not something the company owns’.

BEING ADAPTIVE AND RESILIENT, RESPONDING TO FUTURE NEEDS We recognise building and retaining our internal capability is key to our success and are focussed on developing our people so we can build talent pipelines from within. We have a Capability Uplift Programme that gives people opportunities to learn and develop new skills outside their core role to help increase their career development opportunities at Mercury. We also have an internal online platform called SkillShare that enables people to develop skills in different areas by offering their support on projects within Mercury.
• PARTNERSHIPS – our Support Partner relationship with TupuToa will help us build the number of Māori and Pasifika in our team, to better represent the communities that we serve. To keep ourselves accountable, we have set a target of 60% of vacancies to be filled by internal candidates. This year 51% were filled by internal candidates (excluding Trustpower). We have also replaced our annual employee engagement survey with shorter quarterly surveys to get feedback more regularly from employees on what is going well and what opportunities there are for us to improve the employee experience. There has been over 70% participation in these surveys, giving us valuable insight and feedback to support our decision making. Feedback has been largely positive, with employees rating learning opportunities and enterprise communications particularly highly. We have also run an employee wellbeing survey as part of a wider Wellbeing Review by external consultants and are now using these insights to help us be even more purposeful in the ways we support employee wellbeing.
TRAINING AREA TRAINING HOURS IN FY21 TRAINING HOURS IN FY22 developmentCapability 7,358 3,976* Health & safety 4,035 5,628 complianceBusiness 1,367 2,045 *Due to Covid-19 restrictions fewer courses were able to be held this year than previously.OF8277%%PEOPLESAY TEAM MEMBERS READILY SHARE THEIR KNOWLEDGE AND LESSONS LEARNED. OF PEOPLE SAY THAT WHEN SOMETHING DOESN’T GO QUITE RIGHT, IT IS TREATED AS AN OPPORTUNITY TO LEARN. OF73%PEOPLESAY THAT THEY HAVE THE OPPORTUNITY TO BE INVOLVED IN THINGS THAT HELP THEM LEARN AND DEVELOP. FREEDOMENERGYLIVING
Lastly, we have made changes to the Generation and Customer areas of our business to best position Mercury for the future. The Generation changes were made following the creation of a Generation business unit in which our hydro, geothermal and wind assets were brought together to foster greater collaboration and support more joined up decision making across our generation fleet. The Customer changes were made ahead of Mercury becoming a multiproduct utility retailer.
CREATING VALUE THROUGH OUR PEOPLE.
KAITIAKITANGA PEOPLE CUSTOMERPARTNERSHIPSCOMMERCIAL 302022REPORTANNUALMERCURYMENU
• COMMERCIAL – evolving our culture will help to enhance our business performance.
OUR SKILLS PLEDGE. We remain supportive of the Aotearoa New Zealand Skills Pledge, established by the Prime Minister’s Business Advisory Council in 2019. We aim to offer our people the opportunity to be trained and to learn new skills needed for the changing nature of work. Our focus during FY22 has involved offering varied learning experiences. For example, unconscious bias for leaders, safety culture training for employees and leaders and mental health awareness for leaders. Workshops, webinars and e.learning has been on topics such as commercial capability, finance for nonfinancial managers, influencing skills, recruitment, understanding remuneration and leading teams during a pandemic.
• CUSTOMER – in an adaptive, resilient, collaborative and improvement focussed culture people are more energised and accountable, making them positive ambassadors of our brand.
Our focus on evolving our culture, taking an inclusive approach that fosters diversity and growing our internal capability delivers shared value across other Mercury Pillars. For example:
DELIVERING MORE FOR CUSTOMERS AND COUNTRY.
While wind has a great degree of predictability to its output over the course of a year, it generates only when it is blowing, and requires ‘firming’ with another generation source in order to provide reliable power to customers.
INCREASED VALUE OF OUR BUSINESS
An 8-well geothermal drilling campaign breaks ground later this year, with new wells and connecting pipelines across Rotokawa, Kawerau and Ngā Tamariki fields. This is our largest drilling campaign in several years and is part of a long-term drilling strategy to ensure high quality fuel supply and fuel security for our geothermal power stations. The larger campaign allows for better economies of scale with procurement. It also creates opportunities to further upskill and grow our technical drilling capability to support future activity and maintain our valuable well assets for the long term.
ENHANCED LICENCE TO OPERATE
5. COMMERCIAL. FREEDOMENERGYLIVING
312022REPORTANNUALMERCURYMENU
Mercury’s Waikato Hydro System is an especially good counter-balance because the hydro lakes act as a storage facility and electricity output can be quickly ramped up and down to meet demand. As wind becomes a greater proportion of our portfolio mix this will become more challenging. This will be added to as the residential customers we serve (with their typical morning and evening demand peaks) have increased with the acquisition of Trustpower’s retail customers, and as Mercury transitions off the supply arrangements with Manawa that were part of that deal.
In August 2021 the acquisition of Tilt Renewables’ New Zealand operations added five wind farms to our portfolio, and with the Turitea North wind farm becoming operational in the last quarter of calendar 2021, we became New Zealand’s largest wind generator. This has significantly diversified our revenue streams, and has come with challenges as well as opportunities.
Mercury is in the early phases of a period of growth in renewable generation output, fuelled by a need to rapidly decarbonise the economy – with renewable electricity underpinning the decarbonisation of many other sectors in Aotearoa New Zealand.

• Create executable options for new growth.
We are actively pursuing new generation projects to add to our diverse portfolio, with one of the best pipelines of future generation in the country. Our development pipeline focuses on wind, including sites in Manawatū, Northland, Otago and Southland. Wind is a natural fit to our renewable hydro and geothermal generation portfolio. We stand ready to support the country’s decarbonisation goals including through significant investment into new projects, and maintaining and enhancing our current assets. We have a pathway to deliver over 2,000 GWh per annum of new renewable energy by the end of the decade, and are engaging with the communities where our potential new generation is located to understand the impacts this might have on them. This includes a future wind farm at Puketoi (230MW) where we're actively considering constructability, and have extended the consent period to 2031. We are continuing to work towards potential new generation
CREATING EXECUTABLE OPTIONS FOR NEW GROWTH
STRATEGIC GOALS: OUR THREE YEAR OBJECTIVES
322022REPORTANNUALMERCURYMENU
The Digital River, a digital simulation of the Waikato Hydro System, is an example of Thriving Today that is forecast to deliver over $7m of extra value in FY23. It uses new data platforms to provide a layer of real-time analytics to our Hydro Control desk. Acting as a co-pilot, it assists in fine-tuning generation efficiency and integrating forecasts by planning then simulating days ahead. The Digital River supports a systems thinking approach to evaluating the impact of outages, tactics, weather, and market conditions on our trading operations.
• Play a leading role in New Zealand's successful transition to a low-carbon economy.
• Unleash the full potential of our people through transforming culture.
The Thrive focus was also applied to the “Class 3” maintenance program that ensures the ongoing reliability and availability of Mercury’s hydro power stations. Class 3 works include accessing the wet areas of the machine such as the turbine and penstock and headgate to assess the condition of the asset, along with cleaning and inspection of other componentry, and are carried out every 3 to 4 years on each unit. With 39 hydro units across our fleet, the generation team execute 13 Class 3s each year. The time taken to complete this maintenance had grown in recent years by an additional 10 days (from 15 to around 25 days) as more tasks were included in the programme. However, using the Thrive mindset, the team identified opportunities to create value through streamlining planning processes, focusing on tasks that are critical to the ongoing reliable operation of the unit, and ensuring that the right tools, equipment and people were available at the right time to complete the activity. By taking this approach, Class 3 outage durations have reduced to 15 days. Achieving clarity of purpose behind this maintenance programme led to reduction in project management, and an uplift in focus and teamwork.
• Plant failures and national fuel constraints impacting on short and medium term generation.
• Be an adaptive and resilient organisation, responsive to future needs.
FREEDOMENERGYLIVING
• Failing to successfully execute on new growth opportunities or significant development projects.
• Enhance our licence to operate through collaborative work with our stakeholders.
• Failing to recognise and plan for the impact of climate change on long term financial sustainability.
THIS HAS SIGNIFICANTLY DIVERSIFIED OUR REVENUE STREAMS, AND HAS COME WITH CHALLENGES AS WELL AS OPPORTUNITIES.
COMMERCIAL SUMMARY. KEY RISKS
Our experienced market managers were tested again this year by the third consecutive ‘dry year’. January to May is the seasonal period of low inflows to the Hydro System, and generation can exceed inflows during that time. The team are disciplined and careful to maintain storage in Lake Taupō through summer to ensure we have maximum flexibility in winter when demand is highest. Early in the year there was an additional challenge with the Kawerau outage leading to increased pressure on our hydro generation, but this was managed well by our team.
• Increase the value of our business to $700M $800M EBITDAF.
UNLEASHING THE FULL POTENTIAL OF OUR PEOPLE

KAITIAKITANGA PEOPLE CUSTOMERPARTNERSHIPSCOMMERCIAL 332022REPORTANNUALMERCURYMENU
FREEDOMENERGYLIVING
opportunities at wind sites at Kaiwera Downs (40MW), Kaiwaikawe where a consent was recently granted (75MW) and Mahinerangi stage 2 (160MW).
• PEOPLE – resilience is being built through our programme of culture change, to empower (Whakapuāwai) and enable (Thrive).
CREATING VALUE COMMERCIAL.THROUGH
We are also conducting initial feasibility work to add a fifth unit to our Ngā Tamariki geothermal power station (that would generate an additional 35MW). Beyond this phase, further options are being explored. We continue to actively consider the role emerging technologies like grid solar and batteries will play in New Zealand’s energy system and how Mercury might play a part in that. While New Zealand has poor solar intensity on average, some parts of the country offer potential for grid-scale solar generation where areas with the right level of solar radiation coincide with suitable access to transmission.
PLAYING A LEADING ROLE IN NZ’S LOW-CARBON TRANSITION Work continues at Turitea Wind Farm on the Manawatū hillside, with civil works well advanced towards construction of the final 27 turbines in the southern zone of the site. The 33 turbines in the north are now on stream and generating. We remain on track for mid-FY23 for full completion of what will be New Zealand’s largest wind farm. At the same time as we continue to build out our fleet of renewable generation, the demolition of the decommissioned Southdown thermal station is also underway. The 140MW thermal-powered station was closed in 2015 (when it was generating less than 5% of the company’s output), and Mercury has generated 100% renewable energy since that time. Sale of the South Auckland site will release capital to be redeployed more effectively in the business, supporting broader strategic objectives including our commitment to new renewable generation.
Our focus on growth in renewable generation integrates thinking and delivers shared value across other Mercury Pillars. For example:
• PARTNERSHIPS – working with others helps build our knowledge and deepen our connections with communities around our new renewables pipeline.
• KAITIAKITANGA – the significant addition of wind generation from Turitea wind farm will enable increased decarbonisation of New Zealand’s economy, to address climate change.

342022REPORTANNUALMERCURYNUMBERSINFREEDOMENERGYMENUENERGY FREEDOM IN NUMBERS. NGĀ NAMA O TE MANAWHIRI PŪNGAO.
This section explains how our integrated thinking, our decisions and our actions play out in financial results. We provide commentary on our financial performance for the year to the end of June 2022 compared with prior years, as well as our auditor’s report and our financial statements. Segment reporting has been set out so that you can clearly see the financial dynamics of our generation operations as distinct from our retail energy sales operations. We also feature our approach to assessing and managing climate change risk with our Task Force on Climate-related Financial Disclosures - TCFD Report.

OPERATIONAL ACTIVITY At 3,662GWh, Mercury’s hydro generation was down for the second year running, by approximately ~400GWh compared to the group’s long-term average of 4,050GWh, although production was up slightly on the dry prior year (51GWh). La Nina weather patterns over the last two years saw Lake Taupō start the financial year close to empty. Hydro generation was managed over the first half of the financial year to lift Lake Taupō storage ahead of the seasonally drier weather over summer and autumn. Heavy rainfall in June 2022 restored the Lake Taupō level to well above the historic average and 70% full, positioning hydro generation well for the start of GeothermalFY2023. generation efficiencies were achieved through steam optimisation and fine-tuning plant performance, which helped mitigate the impact of the unplanned 6-week outage at the Kawerau geothermal station in early June 2021, which returned to service on 20 July 2021. As a result, geothermal generation was down 26GWh on the prior year to 2,568GWh.
The acquisition of five wind farms generating on average 1,100GWh p.a. from the Tilt acquisition in August 2021 added 961GWh of production to FY2022. Production at these wind farms is pre-sold under long term agreements with Genesis and Manawa. Turitea North was fully commissioned in December 2021, contributing 308GWh to FY2022 and is managed within Mercury’s overall generation portfolio, hedging sales to our electricity customers. In contrast to the prior financial year, when significantly low generation in June 2021 due to low water levels at Lake Taupō and the outage at Kawerau forced costly hedging contracts, efficient management of lake levels, with no unplanned outages, resulted in materially lower ($43 million benefit from ~210GWh less buying at VWAP of ~$200/MWh) hedging costs compared with the prior year. Average spot prices dropped ~$30/MWh on average with little impact to the portfolio given net position was neutral to slightly short in both years.
M&A ACTIVITY FY2022 was a year marked by significant acquisitions for Mercury, through the successful completion of transactions with both Tilt Renewables for the purchase of New Zealand wind farms and development options, and with Trustpower (now named Manawa) in respect of its mass market retail business. Mercury is now New Zealand’s largest wind generator and biggest electricity retailer by customer market Inshare.August 2021, a scheme of arrangement between Mercury and Powering Australian Renewables (PowAR) to acquire Tilt Renewables Limited (Tilt) was concluded. Under that scheme of arrangement, Mercury acquired all of Tilt’s New Zealand operations, including development options, for an enterprise valuation of approximately NZ$797 million. This acquisition was funded from the sale of Mercury’s 19.9% Tilt shareholding, worth NZ$608 million, and net debt of NZ$189 million. The purchase price allocation has been finalised and is detailed in Note 1 of the financial statements. Mercury realised a net gain on sale of its shares in Tilt of $367 million. After normalising for the accounting treatment of the unwind of the contract for difference, the acquired operations contributed $47 million in FY2022. This transaction was recognised at the 2022 INFINZ awards as the M&A transaction of the year.
FY2022 saw the addition of significant wind generation to the group’s generation portfolio, although less windy weather during FY2022 constrained the performance of these assets.
The group’s focus of ‘Thriving Today, Shaping Tomorrow’ was underpinned in FY2022 by our continuous improvement and resilience programme, ‘Thrive’. Thrive delivered $47 million of EBITDAF uplift, through enduring savings in operating expenses ($12 million), improvements in trading margin ($7 million) and significant carbon unit trading gains ($27 million) as the price of NZ emissions units almost doubled over the Inyear.our customer business, we again saw lifts in customer yields across all customer segments. Yields in the commercial and industrial segment (physical and financial) increased by $10/MWh, or 13.9%, over the period. Average mass market yields increased $5/MWh, or 3.2%. Mercury brand market share declined slightly, with ICP numbers falling by 7,000 as mass-market customer losses exceeded customer acquisitions. The acquisition of Trustpower’s retail business added 253,000 mass-market electricity customers, 117,000 broadband customers, 48,000 gas customers and 13,000 mobile customers and accelerated Mercury’s transition to a truly multi-product utility provider. Electricity sold to customers (physical and financial) dropped by just over 200GWh to 5,878GWh. Sales to commercial/ industrial customers grew by 367GWh, offset by declines in mass market of 117GWh and end-user CFDs of 453GWh, mainly due to the termination of the 80MW Norske Skog CFD in July 2021.
TRADING MARGIN With our transition to a multi-product utility provider, what was previously reported as energy margin is now referred to as trading margin. Mercury’s trading margin of $745 million was up $129 million from the previous year’s energy margin, primarily driven by new wind generation. OTHER INCOME Other net income of $66 million is higher than the prior year, primarily due to $26 million received from insurers as an interim payment in relation to the Kawerau geothermal station outage in June/July 2021, and a dividend received of $4 million from Tilt Renewables prior to the sale of Mercury’s 20% shareholding.
In May 2022, Mercury acquired Trustpower’s retail business for $470 million. The provisional purchase price allocation is also included in Note 1. As part of the Trustpower retail acquisition, a 10-year contract for difference (CFD) was agreed with Manawa, which provides a fixed CPI escalating price for the first five years of the contract and then resets to an ASX futures-based pricing methodology. The unwind of this CFD, valued at $488 million under purchase price accounting, resulted in a reduction to trading margin of $46 million across May and June 2022 and is expected to impact FY2023 trading margin by $200 million, with the remaining balance unwinding on a declining basis over the first five years of the CFD. After normalising for the accounting treatment of the CFD, the Trustpower retail business contributed $12 million in FY2022.
352022REPORTANNUALMERCURYENERGYFREEDOMINNUMBERSMENUFINANCIAL COMMENTARY.
Mercury’s FY2022 financial performance set a record high at $581 million EBITDAF, 25% higher than the prior year of $463 million EBITDAF. While inflows into the Waikato catchment were dry like the previous year (30th percentile on average), Mercury’s financial performance was positively impacted by the acquisition of the New Zealand wind operations from Tilt Renewables in August 2021, the commissioning of the northern section of the Turitea wind farm in December 2021 and performance improvements in the core business including Mercury’s continuous improvement programme, “Thrive”.
UNDERLYING EARNINGS
Underlying earnings after tax increased by $1 million for the year, reflecting an uplift from the impact of the activity that has taken place largely offset by lower hydrology.
Underlying earnings is provided to enable our stakeholders to make an assessment and comparison of earnings after removing one-off and/or infrequently occurring events (exceeding $10 million of profit before tax), impairments, any changes in the fair value of derivative financial instruments and gain/loss on disposal.
Under the terms of Mercury’s DRP, dated 22 February 2022, shareholders may elect to receive the dividend either wholly or partially by receiving Mercury ordinary shares in lieu of cash. The Board has determined that shares issued under the DRP in respect of the 2022 final ordinary dividend will be issued at a discount of 2.0% to the daily volume weighted average share price calculated in accordance with the DRP terms and conditions.
Mercury’s net profit after tax of $469 million was up significantly from the prior year, primarily due to the $367 million non-taxable gain on disposal of shares in Tilt. Other contributors of note outside the increase in trading margin, noted above, were the gains generated by carbon unit sales ($27 million) and insurance proceeds ($26 million), offset by increases in depreciation ($72 million), interest costs ($17 million) and fair value movements ($35 million).
OPERATING EXPENSES
CAPITAL STRUCTURE AND DIVIDENDS Net debt rose to $1,961 million as at 30 June 2022, with financing required to support the completion of Turitea North, continued construction of Turitea South, acquisition and refinancing of the Tilt New Zealand business and acquisition of the Trustpower retail business. Mercury’s $300 million wholesale / credit wrapper bond was repaid in September 2021. AU$200 million of green bonds were issued in November, adding to the $550 million of green bonds issued the year before, and tracked in accordance with Mercury’s Green Financing Framework. A further $250 million of capital bonds were also issued during the year. A dividend reinvestment plan (DRP) was established during the year. Treasury stock of $109 million was re-issued in relation to the DRP and underwrite for the HY2022 interim dividend. The company’s gearing level is calculated at 2.7 times debt/EBITDAF after adjusting for Mercury’s subordinated debt and unwind of the Trustpower CFD. Gearing is up on the previous year due to increased debt, partially offset by higher EBITDAF. The gearing ratio remains in the middle of Mercury’s target range of 2.0x to 3.0x debt/ EBITDAF supporting our S&P credit rating of BBB+. At year end, Mercury held 18 million shares as treasury stock, has available debt headroom of $525 million and held cash and cash equivalents of $65 million. This continues to provide balance sheet flexibility for growth over and above current Acommitments.fullyimputed
Net cash provided by operating activities represents cash flows from the sale of electricity, gas, broadband, and telecommunication services, along with the costs associated with their sale and the cash costs of interest and taxes.
362022REPORTANNUALMERCURYENERGYFREEDOMINNUMBERSMENU
ordinary dividend of 12.0 cents per share (cps) final dividend has been declared. This brings the full-year ordinary dividend to 20.0 cps, up from 17.0 cents per share, or 17.6%, a material increase, marking our fourteenth consecutive year of ordinary dividend growth.
Cash flows from operating activities were up $14 million this year, largely due to increased EBITDAF and lower cash tax paid, offset by the impact of low June 2021 EBITDAF, which impacts July 2021 cash flows.
BALANCE SHEET
CASH FLOWS FROM OPERATING ACTIVITIES
Total assets of the company increased by $1,682 million, due to a $293 million upward revaluation of Mercury’s generation assets, and the construction and acquisition of wind generation assets. Stay in business capital expenditure (CAPEX) was relatively flat compared with the prior year at $68 million, with a small uplift due to preparatory drilling costs and work at Kawerau following the outage in June/July 2021. Leaving aside the Tilt and Trustpower retail acquisitions, growth CAPEX was down $109 million on the prior year to $85 million with lower construction costs at Turitea with a total $76 million (including capitalised interest) spend in FY2022 in this financial year.
Operating costs represent the company’s indirect costs of sales, including salaries and wages, maintenance costs and all other Operatingoverheads.costsincreased by $40 million on the prior year, primarily due to an increase in operational activity resulting from acquisitions. Trustpower’s retail business increased operating costs over May and June by $13 million, and the ex-Tilt and Turitea wind assets added a further $18 million. Changes in the accounting treatment of Software as a Service costs adopted in FY2021 resulted in $9 million of expenditure. Normalising for these costs, Mercury’s disciplined approach to operating costs in combination with its operational agility and resilience programme, ‘Thrive’, resulted in the group keeping its operating base relatively flat for its ninth year in a row. Growth in Mercury’s generation and retail businesses means going forward, operating costs are expected to increase and a new base level set.
OPERATING EARNINGS (EBITDAF) Mercury’s EBITDAF of $581 million rose $118 million from the previous year, as previously explained. PROFIT FOR THE YEAR
372022REPORTANNUALMERCURYENERGYFREEDOMINNUMBERSMENUFINANCIAL PERFORMANCE TRENDS For the year ended 30 June ($ million) 2022 2021 20201 2019 2 20182 Income statement Trading margin 745 616 652 667 730 EBITDAF 581 463 490 506 566 Net profit for the year 469 141 209 357 234 Balance sheet Total shareholders’ equity 4,752 4,186 3,733 3,537 3,305 Total assets 9,660 7,978 6,877 6,484 6,106 Total liabilities 4,908 3,792 3,144 2,947 2,801 Cash flow Operating cash flow 352 338 352 361 370 Investing cash flow (534) (296) (194) 63 (254) Financing cash flow 84 42 (173) (335) (141) Capital expenditure Total capital expenditure 1,420 250 275 115 118 Growth capital expenditure 1,352 194 165 26 6 Stay-in-business capital expenditure 68 56 110 89 112 Other financial measures Underlying earnings after tax 146 145 166 161 198 Free cash flow 284 282 242 272 258 Ordinary and special declared dividends 275 231 215 211 207 Ordinary dividends per share (cents) 20.0 17.0 15.8 15.5 15.1 Basic and diluted earnings per share 34.32 10.36 15.36 26.23 17.00 Net debt 1,961 1,329 1,149 1,096 1,264 Gearing (net debt/net debt + equity, %) 29.2 24.1 23.5 23.7 27.7 Debt/EBITDAF (x) 3 2.7 2.5 2.0 1.9 1.9 FINANCIAL TRACK RECORD. For the year ended 30 June ($ million) 2022 2021 20201 2019 2 20182 Operational measures Total recordable injury frequency rate (TRIFR) 4 0.60 0.64 1.26 0.72 0.87 Sales to customers (FPVV, GWh) 5,105 4,522 4,361 4,500 4,477 Electricity customers (‘000) 574 328 348 373 388 Electricity generation (GWh) 7,499 6,205 6,331 6,703 7,511 1. Restated for change in accounting policy in relation to configuration and customisation costs incurred in implementing SaaS arrangements. 2. Financial results for the period 30 June 2017, 2018 and 2019 include Metrix which the Group sold on 1 March 2019. 3. Adjusted for S&P treatment of subordinated debt and unwind of the Manawa CFD. 4. Per 200,000 hours; includes on-site employees and contractors.
KEY AUDIT MATTERS
OPINION We have audited the consolidated financial statements of the Group on pages 41 to 65 of the Annual Report, that comprise the consolidated balance sheet as at 30 June 2022, the consolidated income statement, consolidated statement of comprehensive income, consolidated statement of changes in equity and the consolidated cash flow statement for the year then ended on that date, and notes to the consolidated financial statements that include accounting policies and other explanatory information. In our opinion, the consolidated financial statements of the Group present fairly, in all material respects, the consolidated financial position of the Group as at 30 June 2022, and its consolidated financial performance and cash flows for the year then ended in accordance with New Zealand Equivalents to International Financial Reporting Standards and International Financial Reporting Standards.
IndependenceEthicsforAssurancePractitioners(includingInternationalStandards)(NewZealand)issuedbytheNewZealandAuditingandAssuranceStandardsBoard,andwehavefulfilledourotherethicalresponsibilitiesinaccordancewiththeserequirements.
382022REPORTANNUALMERCURYENERGYFREEDOMINNUMBERSMENU
In addition to the audit, we have carried out assignments including a review of the Group’s consolidated financial statements for the six months ended 31 December 2021, agreed upon procedures and limited assurance engagements, provision of remuneration market survey data and tax related services in the United States of America, all of which are compatible with independence requirements. These services have not impaired our independence as auditor of the Group.
BASIS FOR OPINION We carried out our audit in accordance with the AuditorGeneral’s Auditing Standards, which incorporate the Professional and Ethical Standards and the International Standards on Auditing (New Zealand) issued by the New Zealand Auditing and Assurance Standards Board. Our responsibilities under those standards are further described in the Auditor’sResponsibilities for the Audit of the Financial Statements section of our report. We believe that the audit evidence we have obtained is sufficient and appropriate to provide a basis for our opinion. We are independent of the Group in accordance with the Auditor-General’s Auditing Standards, which incorporate Professional and Ethical Standard 1 International Code of
INDEPENDENT AUDITOR’S REPORT.
Partners and employees of our firm may deal with the Group on normal terms within the ordinary course of trading activities of the business of the Group. Other than the audit and the other assignments described above, we have no relationship with, or interests in, the Group.
The Auditor-General is the auditor of Mercury NZ Limited (‘the Company’). The Auditor-General has appointed me, Lloyd Bunyan, using the staff and resources of Ernst & Young, to carry out the audit of the consolidated financial statements of the Group (comprising the Company, its subsidiaries and other controlled entities) on his behalf.
Key audit matters are those matters that, in our professional judgement, were of most significance in our audit of the consolidated financial statements of the current period. These matters were addressed in the context of our audit of the consolidated financial statements as a whole, and in forming our opinion thereon, and we do not provide a separate opinion on these matters. We have fulfilled the responsibilities described in the Auditor’s Responsibilities for the Audit of the Financial Statements section of the audit report, including in relation to these matters. Accordingly, our audit included the performance of procedures designed to respond to our assessment of the risks of material misstatement of the consolidated financial statements. The results of our audit procedures, including the procedures performed to address the matters below, provide the basis for our audit opinion on the accompanying consolidated financial statements.
TO THE SHAREHOLDERS OF MERCURY NZ LIMITED REPORT ON THE AUDIT OF THE FINANCIAL STATEMENTS FOR THE YEAR ENDED 30 JUNE 2022
In obtaining sufficient appropriate audit evidence we:
• together with our internal valuation specialists, challenged key assumptions and inputs;
As set out in note 1 of the consolidated financial statements, the Group acquired the New Zealand operations of Tilt Renewables Limited (‘Tilt’) on 3 August 2021, which included its generation assets. The fair value of the acquired generation assets was assessed as $1,026 million at acquisition date. The Group engaged its external valuation specialist to determine the fair value of acquired generation assets at the acquisition date. The external valuation specialist used a discounted cashflow model to assess this Wevalue.consider the valuation of generation assets to be a key audit matter given the significance of the assets to the Group and because the inputs to the valuation models are inherently subjective.
• compared forecast generation volumes to historical generation volumes; • involved our own valuation specialists to:
• assessed the professional competence and objectivity of the Group’s external valuation specialist;
392022REPORTANNUALMERCURYENERGYFREEDOMINNUMBERSMENU
• assessed the adequacy of the related financial statement disclosures in note 7. As a result of the above procedures, we considered the valuation techniques and key assumptions reasonable in forming our opinion on the financial statements as a whole. Why significant How our audit addressed the key audit matter
The Group’s activities expose it to certain risks which are managed using derivative financial instruments. At 30 June 2022, the fair value of derivative assets total $699 million and derivative liabilities total $692 million as set out in note 14 of the consolidated financial statements.
• assessed the Group’s estimated wholesale electricity price path by comparing it to other price path estimates obtained in performing the generation asset valuation procedures detailed in the previous key audit matter.
• evaluated the appropriateness of the valuation methodologies; and
Why significant How our audit addressed the key audit matter Generation assets were revalued to $7,723 million at 30 June 2022 as set out in note 7 of the consolidated financial statements. The generation assets represent approximately 80% of the Group’s total assets.
The Group engages an external valuation specialist to estimate the fair value of generation assets using a discounted cash flow model. The most significant inputs used to calculate the fair value of the generation assets include the wholesale electricity price path, generation volumes and the discount rate as described in note 7 of the consolidated financial statements.
The wholesale electricity price path and discount rate assumptions are estimated by the Group’s external valuation specialist. Forecast generation volumes are determined by the Group’s external valuation specialist based on the Group’s own forecast average generation volumes.
• assessed the adequacy of the related financial statement disclosures as described in notes 13 and 14. As a result of the above procedures, we considered the valuation techniques and key assumptions reasonable in forming our opinion on the financial statements as a whole. VALUATION OF LEVEL 3 DERIVATIVE FINANCIAL INSTRUMENTS
• assessed whether the valuation adjustments were made in accordance with the Group’s accounting policy; and
• agreed key contract terms, including contract start and maturity dates and electricity strike prices, to the relevant contract on a sample basis;
• met with the Group’s external valuation specialist to understand the valuation methods adopted and assessed the significant inputs to the model used to estimate the fair value of the generation assets, including the assets acquired from Tilt both at the acquisition date and 30 June 2022;
These balances include certain electricity price derivatives for which the valuation inputs are not readily observable in active primary or secondary markets and require the use of more complex valuation assumptions including the Group’s internal wholesale electricity price path forecast. Derivatives for which the valuation inputs are not readily observable are referred to as ‘level 3’ derivatives as disclosed in note 13 of the consolidated financial Asstatements.setoutin note 1 of the consolidated financial statements, on 1 May 2022 the Group acquired the mass market retail business of Trustpower Limited (now Manawa Energy Limited), which included an electricity price contract for difference. The fair value of the acquired electricity price contract for difference was assessed by the Group as being an asset with a fair value of $488 million at acquisition date. We consider the valuation of level 3 derivatives to be a key audit matter as the inputs to the valuation models are inherently subjective.
• consider the process used to determine the forward wholesale electricity price path estimated by the Group’s external valuation specialist; and • assess the appropriateness of the discount rate.
VALUATION OF GENERATION ASSETS
• involved our valuation specialists to assess the models used to estimate the fair value of the Level 3 derivatives, including the acquired electricity price contract for difference, on a sample basis. Our valuation specialists:
In obtaining sufficient appropriate audit evidence we:
402022REPORTANNUALMERCURYENERGYFREEDOMINNUMBERSMENU
In preparing the consolidated financial statements, the directors are responsible, on behalf of the entity, for assessing the Group’s ability to continue as a going concern, disclosing, as applicable, matters related to going concern and using the going concern basis of accounting unless the Directors either intend to liquidate the Group or to cease operations, or have no realistic alternative but to do so.
The directors’ responsibilities arise from the Financial Markets Conduct Act 2013. The directors are also responsible for such internal control as they determine is necessary to enable the preparation of consolidated financial statements that are free from material misstatement, whether due to fraud or error and for the publication of the consolidated financial statements, whether in printed or electronic form.
• Evaluate the overall presentation, structure and content of the consolidated financial statements, including the disclosures, and whether the consolidated financial statements represent the underlying transactions and events in a manner that achieves fair presentation;
DIRECTORS’ RESPONSIBILITIES FOR THE FINANCIAL STATEMENTS
Reasonable assurance is a high level of assurance but is not a guarantee that an audit conducted in accordance with the Auditor-General’s Auditing Standards will always detect a material misstatement when it exists. Misstatements can arise from fraud or error and are considered material if, individually or in the aggregate, they could reasonably be expected to influence the economic decisions of users taken on the basis of these consolidated financial statements.
• Evaluate the appropriateness of accounting policies used and the reasonableness of accounting estimates and related disclosures made by management;
LLOYD BUNYAN // ERNST & YOUNG ON BEHALF OF THE AUDITOR-GENERAL AUCKLAND, NEW ZEALAND 16 AUGUST 2022
The Board of Directors is responsible on behalf of the entity for the Annual Report, which includes information other than the consolidated financial statements and our auditor’s report. Our opinion on the consolidated financial statements does not cover the other information and we do not express any form of assurance conclusion thereon. In connection with our audit of the consolidated financial statements, our responsibility is to read the other information and, in doing so, consider whether the other information is materially inconsistent with the consolidated financial statements or our knowledge obtained in the audit or otherwise appears to be materially misstated. If, based on the work we have performed, we conclude that there is a material misstatement of this other information, we are required to report that fact. We have nothing to report in this regard.
We also provide the directors with a statement that we have complied with relevant ethical requirements regarding independence, and to communicate with them all relationships and other matters that may reasonably be thought to bear on our independence, and where applicable, actions taken to eliminate threats or safeguards applied.
• Obtain an understanding of internal control relevant to the audit in order to design audit procedures that are appropriate in the circumstances, but not for the purpose of expressing an opinion on the effectiveness of the Group’s internal control;
The directors are responsible on behalf of the entity for the preparation and fair presentation of the consolidated financial statements for the Group that comply with New Zealand Equivalents to International Financial Reporting Standards and International Financial Reporting Standards.
From the matters communicated with the directors, we determine those matters that were of most significance in the audit of the consolidated financial statements of the current period and are therefore the key audit matters. We describe these matters in our auditor’s report unless law or regulation precludes public disclosure about the matter or when, in extremely rare circumstances, we determine that a matter should not be communicated in our report because the adverse consequences of doing so would reasonably be expected to outweigh the public interest benefits of such communication.
• Obtain suf ficient appropriate audit evidence regarding the financial information of the entities or business activities within the Group to express an opinion on the consolidated financial statements. We are responsible for the direction, supervision and performance of the Group audit. We remain solely responsible for our audit opinion; and
• Conclude on the appropriateness of the use of the going concern basis of accounting by the directors and, based on the audit evidence obtained, whether a material uncertainty exists related to events or conditions that may cast significant doubt on the Group’s ability to continue as a going concern. If we conclude that a material uncertainty exists, we are required to draw attention in our auditor’s report to the related disclosures in the consolidated financial statements or, if such disclosures are inadequate, to modify our opinion. Our conclusions are based on the audit evidence obtained up to the date of our auditor’s report. However, future events or conditions may cause the Group to cease to continue as a going concern;
INFORMATION OTHER THAN IN THE FINANCIAL STATEMENTS & AUDITOR’S REPORT
AUDITOR’S RESPONSIBILITIES FOR THE AUDIT OF THE FINANCIAL STATEMENTS
As part of an audit in accordance with the Auditor-General’s Auditing Standards, we exercise professional judgement and maintain professional scepticism throughout the audit. We also:
• Identify and assess the risks of material misstatement of the consolidated financial statements, whether due to fraud or error, design and perform audit procedures responsive to those risks, and obtain audit evidence that is suf ficient and appropriate to provide a basis for our opinion. The risk of not detecting a material misstatement resulting from fraud is higher than for one resulting from error, as fraud may involve collusion, forgery, intentional omissions, misrepresentations, or the override of internal control;
• Did not examine every transaction, nor do we guarantee complete accuracy of the consolidated financial statements. Also, we did not evaluate the security and controls over the electronic publication of the consolidated financial statements.
Our objectives are to obtain reasonable assurance about whether the consolidated financial statements as a whole are free from material misstatement, whether due to fraud or error, and to issue an auditor’s report that includes our opinion. Our responsibilities arise from the Public Audit Act 2001.
We communicate with the directors regarding, among other matters, the planned scope and timing of the audit and significant audit findings, including any significant deficiencies in internal control that we identify during our audit.

412022REPORTANNUALMERCURYENERGYFREEDOMINNUMBERSMENUCONSOLIDATED INCOME STATEMENT. For the year ended 30 June 2022 Note 2022$M 2021$M Total revenue 2 2,188 2,045 Total expenses 2 (1,607) (1,582) EBITDAF 581 463 Depreciation and amortisation 7, 8 (293) (221) Change in the fair value of financial instruments 14 (82) (47) Gain/(loss) on disposal 2 366 23 Net interest expense 2 (62) (45) Profit before tax 510 173 Tax expense 5 (41) (32) Profit for the year attributable to owners of the parent 469 141 Basic and diluted earnings per share (cents) 34.32 10.36 1. EBITDAF: Earnings before net interest expense, tax expense, depreciation and amortisation, change in the fair value of financial instruments, gain/(loss) on disposal and impairments. CONSOLIDATED STATEMENT OF COMPREHENSIVE INCOME. For the year ended 30 June 2022 Note 2022$M 2021$M Profit for the year 469 141 Other comprehensive income Items that will not be reclassified subsequently to profit or loss Movement in asset revaluation reserve 298 924 Movement in cash flow hedge reserve transferred to balance sheet 14 (1) (15) Share of movements in associates’ and joint ventures’ reserves 14 1 28 Tax effect (83) (259) Items that may be reclassified subsequently to profit or loss Movement in cash flow hedge reserve 14 59 (208) Transfer of share of associate's reserves to profit or loss upon disposal of investment in associate (21) Tax effect (16) 63 Other comprehensive income for the year, net of taxation 237 533 Total comprehensive income for the year attributable to owners of the parent 706 674 The accompanying notes form an integral part of these financial statements. FINANCIAL STATEMENTS.
422022REPORTANNUALMERCURYENERGYFREEDOMINNUMBERSMENUCONSOLIDATED BALANCE SHEET. As at 30 June 2022 Note 2022$M 2021$M SHAREHOLDERS’ EQUITY Issued capital 378 378 Treasury shares 4 (50) (100) Reserves 4,424 3,908 Total shareholders’ equity 4,752 4,186 CurrentASSETSassets Cash and cash equivalents 65 163 Receivables 10 489 318 Contract assets and costs 10 20 2 Inventories 6 94 24 Derivative financial instruments 14 328 120 Investment in associate held for sale 9 – 248 Total current assets 996 875 Non-current assets Property, plant and equipment 7 8,080 6,828 Intangible assets 8 123 107 Investment in and advances to associates and joint ventures 9 73 86 Advances to joint operations 9 4 5 Receivables 10 3 3 Contract assets and costs 10 10 Derivative financial instruments 14 371 74 Total non-current assets 8,664 7,103 Total assets 9,660 7,978 Note 2022$M 2021$M CurrentLIABILITIESliabilities Payables and accruals 10 400 318 Borrowings 12 561 471 Derivative financial instruments 14 292 267 Taxation payable 5 14 1 Total current liabilities 1,267 1,057 Non-current liabilities Payables and accruals 10 12 3 Provisions 11 81 86 Derivative financial instruments 14 400 263 Borrowings 12 1,395 1,020 Deferred tax 5 1,753 1,363 Total non-current liabilities 3,641 2,735 Total liabilities 4,908 3,792 Net assets 4,752 4,186 For and on behalf of the Board of Directors who authorised the issue of the Financial Statements on 16 August 2022. The accompanying notes form an integral part of these financial statements. PRUE FLACKS // CHAIR 16 August 2022 JAMES MILLER // DIRECTOR 16 August 2022


BALANCE AS AT 1 JULY (268) (97) (2) (1) joint ventures’ reserves 21 21 Other comprehensive income 23 194 23 (3) 237 Net profit for the year 469 469 Total comprehensive income for the year 492 194 23 (3) 706 Dividend (248) (248)
Balance as at 30 June 2022 378 516 4,153 (245) (50) 4,752 ended June 2022
Proceeds from the disposal of investment in Tilt Renewables Limited 1 603
93
124
Proceeds from borrowings 777 546
CONSOLIDATED CASH FLOW STATEMENT. For the year
Principal repayment of lease liabilities (6) (5) Net proceeds from the disposal of treasury shares Dividends paid (232) (221) Net cash received in financing activities 84 Net (decrease)/increase in cash and cash equivalents held (98) Cash and cash equivalents at the beginning of the period 163 Cash and cash equivalents at the end of the period
79
CASH
Repayment of borrowings (548) (278)
42
30
65 163
352
Payments for acquisition of property, plant and equipment (114) (254) Payments for acquisition of intangibles (25) (54)
4,186 Recycling of share of associates' reserves to retained earnings upon disposal 23 (21)
Lodgements of prudential deposits (33) (70) Net cash used in investing activities (534) (296)
(21) Movement in asset revaluation reserve, net of taxation 215 215 Movement in cash flow hedge reserve, net of taxation 22 22 Share of movements in associates’ and
41
CASH FLOWS FROM FINANCING ACTIVITIES
Cash balance comprises: Cash balance at the end of the period
10 61
2021 378 214 3,959
65 163 The accompanying notes form an integral part of these financial statements.
Payments to suppliers and employees (1,526) (1,468) Interest received 2 1 Interest paid (61) (51) Taxes paid (74) (96) Net cash provided by operating activities 338 FLOWS FROM INVESTING ACTIVITIES
84
432022REPORTANNUALMERCURYENERGYFREEDOMINNUMBERSMENUCONSOLIDATED STATEMENT OF CHANGES IN EQUITY. For the year ended 30 June 2022 Note capitalIssued$M Retainedearnings$M revaluationAssetreserve$M Cashreservehedgeflow$M reservesOther$M equityTotal$M BALANCE AS AT 1 JULY 2020 378 286 3,281 (122) (90) 3,733 Movement in asset revaluation reserve, net of taxation 8 658 666 Movement in cash flow hedge reserve, net of taxation (161) (161) Share of movements in associates’ and joint ventures’ reserves 20 15 (7) 28 Other comprehensive income 8 678 (146) (7) 533 Net profit for the year 141 141 Total comprehensive income for the year 149 678 (146) (7) 674 Dividend (221) (221) Balance as at 30 June 2021 378 214 3,959 (268) (97) 4,186
Note 2022$M 2021$M CASH FLOWS FROM OPERATING ACTIVITIES Receipts from customers 2,011 1,952
Disposal of treasury shares 4 58 50 108
Transfer of share of associates' reserves to profit or loss upon disposal (20)
Proceeds from receivables recognised from acquisitions Proceeds from the sale of Hudson Ranch Payments associated with business combinations, net of cash acquired (1,099) (20) Distributions received from and advances repaid to associates and joint ventures
Mercury NZ Limited (“the Company”) is incorporated in New Zealand, registered under the Companies Act 1993, is an FMC reporting entity under the Financial Markets Conduct Act 2013, and is listed on the NZX Main Board and on the ASX, with foreign exempt listed status. The consolidated financial statements (“Group financial statements”) are for Mercury NZ Limited Group (“the Group”).
The preparation of financial statements requires judgements and estimates that impact the application of policies and the reported amounts of assets and liabilities, income and expenses. Actual results may differ from these estimates.
The assets and liabilities of entities whose functional currency is not the New Zealand Dollar are translated at the exchange rates at balance date. Revenue and expense items are translated at the spot rate at the transaction date or a rate approximating that rate. Exchange differences are taken to the foreign currency translation reserve.
In the Group's financial statements for the year ended 30 June 2021, the Group classified its 19.9% investment in Tilt as held-for-sale. On 3 August 2021, the disposal was completed and the Group realised a net gain on sale of $367 million, which is made up of $603 million from the sale of 75 million shares at $8.035 per share, less the carrying value of the investment of $248 million, plus reclassified accumulated other comprehensive income attributable to Tilt of $21 million. The net gain on sale is disclosed in the Consolidated Income Statement as a Gain/(loss) on disposal.
• Valuation of financial instruments (refer note 13 and note 14)
The Group financial statements are prepared on the basis of historical cost, with the exception of certain financial instruments, the swap rate component of issued bond (Green Bonds, wholesale bonds and retail bonds), the US Private Placement, the Australian Medium Term Note, generation assets and carbon units identified for trading, which are measured at fair value. The Group financial statements have been prepared so that all components are stated exclusive of GST, with the exception of receivables and payables that include GST invoiced.
• Retail revenue accruals (refer note 10)
Disposal of Investment in Tilt Renewables Limited ("Tilt") and Acquisition of Tilt New Zealand Assets
The areas of significant estimates and judgements are as •follows:Purchase price allocation as a result of the acquisition of Tilt Renewables' New Zealand assets and Trustpower's retail business (refer note 1)
Theincurred.Group has completed its purchase price allocation in accordance with the requirements of NZ IFRS 3 Business Combinations. The fair value allocated to the assets and liabilities classes upon acquisition are disclosed below. The final allocation differs from the interim financial statements by $6 million as a result of additional cash received during the completion process. The Group has adjusted the generation assets value and working capital accordingly.
442022REPORTANNUALMERCURYENERGYFREEDOMINNUMBERSMENU NOTES TO THE CONSOLIDATED FINANCIAL STATEMENTS.
For the year ended 30 June 2022
(1) REPORTING ENTITY
The majority shareholder of Mercury NZ Limited is Her Majesty the Queen in Right of New Zealand (“the Government”), providing it with potential influence over the Group. The liabilities of the Group are not guaranteed in any way by the Government or by any other shareholder.
The Group financial statements comprise the Company and its subsidiaries, including its investments in associates and interests in joint arrangements.
• Fair value of generation plant and equipment (refer note 7)
Estimates & Judgements
These financial statements are presented in New Zealand Dollars ($) which is the Group's functional currency. Unless otherwise stated, financial information has been rounded to the nearest million dollars ($M).
Trading Scheme ("ETS"). This has led to the adoption of a new accounting policy in relation to the treatment of carbon units held for trading ("trading units"). From the balance of carbon units held as at 30 June 2021, Management identified 685,000 carbon units (carrying value of $26.4 million) as trading units, and reclassified them from Intangible Assets to Inventories on 1 July 2021. The Group applies the brokertrader measurement exemption, trading units are classified as inventories and are initially recorded at cost, with any fair value movement at the end of each reporting period recognised in profit or loss.
• Provision for restoration and environmental rehabilitation costs (refer note 11) Carbon Units identified for trading In the current financial year, the Group began trading carbon units ("NZUs") issued under the New Zealand Emissions
The Group financial statements have been prepared in accordance with the Financial Markets Conduct Act 2013 and in accordance with New Zealand Generally Accepted Accounting Practice (“NZ GAAP”). They comply with New Zealand equivalents to International Financial Reporting Standards (“NZ IFRS”) as appropriate for profit-oriented entities. These financial statements also comply with International Financial Reporting Standards (“IFRS”).
On 3 August 2021, the Group also acquired 100% of the New Zealand operations of Tilt, including the New Zealand subsidiaries Tararua Wind Power Limited, Waverly Wind Farm (NZ) Holding Limited, Waverly Wind Farm Limited, Tilt Renewables Insurance Limited and all contracts and rights held in Tilt that relate to the New Zealand business for a consideration of $634 million. This includes Tilt's Tararua, Mahinerangi and Waipipi wind farms with an average annual generation of approximately 1,100 GWh, associated contract for difference and asset management agreements, wind development options in New Zealand and debt relating to the Waipipi wind farm. Transaction costs of $9 million were Functional & Presentation Currency
(2) BASIS OF PREPARATION
NOTE 1. ACCOUNTING POLICIES
Net assets acquired 471
Following the Group's subsequent events disclosure in the financial statements to 30 June 2021, on 1 May 2022 the Group fulfilled all conditions precedent in the binding agreements with Trustpower Limited and completed its acquisition of Trustpower Limited's retail business. Transaction costs of $5 million were incurred and are included in total expenses within the Consolidated Income TheStatement.Group has completed its provisional purchase price allocation in accordance with the requirements of NZ IFRS 3 Business Combinations. The fair value allocated to the assets and liabilities classes upon acquisition are disclosed below against the consideration paid of $467 million cash and a further $3 million expected payment pending final completion.
Derivative financial instruments 488 Intangible assets 32 Property, plant and equipment 19 Right-of-use assets 22 Lease liabilities (22) Contract assets 29 Inventories 3 Receivables 50 Payables and accruals (3) Deferred tax liabilities (146)
For
THE CONSOLIDATED
Acquisition consideration - by way of cash ($M)
Due to the proximity of the acquisition date to the Group’s financial year end, the Group considers it impracticable to disclose total revenue and profit or loss that the Trustpower retail business would have derived had the acquisition occurred on 1 July 2021. TO FINANCIAL STATEMENTS. the year ended 30 June 2022
470 allocatedvalueon1May2022($M)
NOTES
Fair
The Group has recognised a bargain purchase gain of $1 million from the transaction which has been included in the Consolidated Income Statement as Gain/(loss) on disposal. From the acquisition date to the end of the financial year, the newly acquired business has generated revenue of $125 million (including telecommunications revenue of $21,443,036 and associated telecommunications deductions of $12,120,568, derivatives losses of $46 million), operating expenses of $17 million, EBITDAF loss of $38 million, and a net loss before tax of $42 million.
452022REPORTANNUALMERCURYENERGYFREEDOMINNUMBERSMENUNOTE 1. ACCOUNTING POLICIES (CONTINUED) Acquisition consideration - by way of cash ($M) 634 Fair allocatedvalueon 3 August 2021($M) Property, plant and equipment (Generation assets) 1,026 Derivative financial instruments (43) Intangible assets 1 Right-of-use assets 16 Lease liabilities (16) Deferred tax liabilities (192) Receivables 79 Payables and accruals (1) Net borrowings (net of cash and cash equivalents and borrowings) (236) Net assets acquired 634 The Group did not recognise any goodwill or bargain purchase from the transaction. Subsequent to the acquisition, the Group repaid the debt relating to the Waipipi wind farm. From the acquisition date to the end of the financial year, the newly acquired entities generated total revenue of $79 million (including realised derivatives gains of $15 million), total expenses of $17 million, EBITDAF of $62 million, and a loss before tax of $40 million, mainly due to depreciation and change in the fair value movement of financial instruments. If the acquisition had occurred on 1 July 2021, pro-forma revenue and loss before tax for the year would have been $88 million (including realised derivatives gains of $17 million) and $36 million respectively. Acquisition of Trustpower Limited's Retail Business ("Trustpower transaction")
and other related products and services to mass market customers in New Zealand. Other Segments Represents corporate support services which are not directly attributable to the generation/wholesale or retail segments. Inter-segment Transactions between segments represent transfer charges by generation/wholesale to retail for the purchase of electricity. SEGMENT RESULTS YEAR ENDED 30 JUNE 2022 Generation/Wholesale$M Retail$M SegmentsOther$M segmentInter–$M Total$M Sales – Electricity generation 1,014 1,014 Sales to customers, net of hedging 591 781 (264) 1,108 Earnings of associates and joint ventures 3 (7) (4) Other revenue 63 2 5 70 Total revenue 1,671 783 (2) (264) 2,188 Energy costs (852) (277) 264 (865) Line charges (101) (306) (407) Other direct cost of sales, excluding third party metering (30) (27) (57) Metering costs (4) (44) (48) Employee compensation and benefits (41) (37) (16) (94) Maintenance expenses (41) (10) (51) Other expenses (43) (30) (12) (85) Allocation or corporate overheads (14) (14) 28 Total expenses (1,126) (745) 264 (1,607) Segment EBITDAF 545 38 (2) 581 Interest expense (15) (53) (68) Lease interest expense (3) (3) Interest income 1 1 2 Interest capitalised to capital work in progress 7 7 Net interest expense (7) (55) (62) Gain on sale 369 369 Loss on disposal (3) (3) Gain/(loss) on disposal 366 366 NOTES TO THE CONSOLIDATED FINANCIAL STATEMENTS. For the year ended 30 June 2022
TYPES OF PRODUCTS & SERVICES
Generation/Wholesale
462022REPORTANNUALMERCURYENERGYFREEDOMINNUMBERSMENUNOTE 2. SEGMENT REPORTING IDENTIFICATION OF REPORTABLE SEGMENTS
The operating segments are identified by management based on the nature of the products and services provided. Discrete financial information about each of these operating segments is reported to the Chief Executive, being the chief operating decision-maker, on a monthly basis, who assesses the performance of the operating segments on a measure of EBITDAF. Segment EBITDAF represents earnings before net interest expense, tax expense, depreciation, amortisation, change in the fair value of financial instruments, gain/(loss) on disposal and impairments by each segment inclusive of an allocation of central operating revenue and costs. Operating segments are aggregated into reportable segments only if they share similar economic characteristics. Following the acquisition of the Trustpower retail business, management have included the performance of the business within the retail segment. As the integration of the Trustpower retail business into the Group's retail business progresses, management will continue to assess the identification of the Group's operating segments.
The generation/wholesale market segment encompasses activity associated with the electricity production, electricity trading, generation development activities and the company's share of associates earnings (see Note 9). It also includes revenue from the sale of electricity to both commercial & industrial customers and the retail segment. Retail The retail market segment encompasses activity associated with sale of energy, telecommunication products/services
472022REPORTANNUALMERCURYENERGYFREEDOMINNUMBERSMENUNOTE 2. SEGMENT REPORTING (CONTINUED) YEAR ENDED 30 JUNE 2021 Generation/Wholesale$M Retail$M SegmentsOther$M segmentInter–$M Total$M Sales – Electricity generation 1,133 1,133 Sales to customers, net of hedging 454 696 (277) 873 Earnings of associates and joint ventures 22 22 Other revenue 12 5 17 Total revenue 1,621 701 (277) 2,045 Energy costs (946) (284) 277 (953) Line charges (85) (270) (355) Other direct cost of sales, excluding third party metering (34) (4) (38) Direct costs of other revenue (2) (2) Metering costs (3) (41) (44) Employee compensation and benefits (37) (31) (15) (83) Maintenance expenses (30) (6) (36) Other expenses (33) (31) (7) (71) Allocation or corporate overheads (11) (11) 22 –Total expenses (1,179) (680) 277 (1,582) Segment EBITDAF 442 21 463 Interest expense (15) (38) (53) Lease interest expense (3) (3) Interest capitalised to capital work in progress 11 11 Net interest expense (4) (41) (45) Gain on sale 38 38 Loss on disposal (15) (15) Gain/(loss) on disposal 23 23 Audit Fees Mercury NZ Limited (the Company) is a public entity as defined in the Public Audit Act 2001 and the Auditor-General is the auditor of every public entity. The Auditor-General has appointed Lloyd Bunyan of EY to carry out the audit on his behalf. NZX listing rules and Mercury's Audit Independence Policy requires that the signing partner performing the audit to rotate every five Feesyears.payable for the audit and review of the financial statements were $823,000 (2021: $599,000). Non-audit services in relation to provision of remuneration market survey data were $4,000 (2021: $15,000). EY (US) also provided US tax compliance services in the amount of $28,000 (2021: $178,000), these services have transitioned to a different service provider. NOTES TO THE CONSOLIDATED FINANCIAL STATEMENTS.
For the year ended 30 June 2022
On 7 June 2021, the Kawerau geothermal power station experienced an unplanned outage as a result of a mechanical failure. In January 2022, insurers accepted the loss was covered, and agreed to a partial payment totalling $25.8 million, which was received by the Group by 31 March 2022. A further outage is planned in the 2023 financial year to install new equipment. The Group expects to receive additional insurance proceeds in the 2024 financial year once the total loss to the Group as a result of the incident has been confirmed. Due to the uncertainty regarding the cost of the future outage, it is not currently practicable to estimate the value of additional insurance receipts, therefore no additional revenue is recognised.
NOTE 3. NON-STATUTORY MEASURE – UNDERLYING EARNINGS
NOTES TO THE CONSOLIDATED FINANCIAL STATEMENTS. For
Underlying earnings after tax 146 145 Tax has been calculated at 28% for all taxable adjustments. Kawerau loss on disposal and insurance receipts
93 Final
482022REPORTANNUALMERCURYENERGYFREEDOMINNUMBERSMENU
Dividends
2022$M
NOTE 4. SHARE CAPITAL & DISTRIBUTION
No imputation credits are available at 30 June 2022 (2021: $nil) as the imputation credit account has a deficit of $39 million (2021: deficit of $21 million). The imputation credit account is required to have a surplus balance at 31 March each year. the year ended 30 June 2022
2022$M 2021$M PROFIT FOR THE YEAR 469 141 Change in the fair value of financial instruments 82 47 Fixed asset loss on disposal 15 Kawerau insurance receipts (26) Hudson Ranch Sale (41) Gain on sale of share in Tilt Renewables Limited (367) Adjustments before tax effect (311) 21 Tax effect (12) (17) Adjustments after tax effect (323) 4
Final
2022ofNumbershares(M) 2022$M 2021ofNumbershares(M) 2021$M
The share capital of the Company is represented by 1,400,012,517 ordinary shares (30 June 2021: 1,400,012,517) issued and fully paid. The weighted average number of shares on issue during the year, on both a basic and diluted basis, was 1,366,520,442 (2021: 1,361,269,425). These shares do not have a par value, have equal voting rights and share equally in dividends and any surplus on winding up.
for
Treasury shares Balance at the beginning of the year 39 100 39 101 Disposal of treasury shares (20) (50) (1) Balance at the end of the year 19 50 39 100 Cents per share 2021$M declared and paid dividend 2020 9.4 –dividend 2021 6.8 –dividend for 2021 10.2 139 Interim dividend for 2022 8.0 248109 February 2022, the Company announced a Dividend Reinvestment Plan ("DRP") that applied for the first time to the 2022 interim dividend. The DRP resulted in the transfer of 2,805,568 treasury shares to shareholders that elected to reinvest the net proceeds of cash dividends payable, and a further transfer of 16,737,813 treasury shares to an underwriter.
221 In
for
128 Interim
Underlying earnings after tax is presented to enable stakeholders to make an assessment and comparison of earnings after removing one-off and/or infrequently occurring events (exceeding $10 million of profit before tax, which represents material items), impairments, any change in the fair value of derivative financial instruments and gain/(loss) on disposal expense. Changes in the fair value of financial instruments are excluded from underlying earnings in order to align their impact when they mature with the underlying hedged items.
The income tax expense charged to the income statement includes both the current year’s provision and the income tax effect of:
For
(ii) Movement in deferred tax Balance as at 1 July 2020 (1,261) 27 3 31 (1,200) Charged/(credited) to the income statement 26 8 34 Charged/(credited) to other comprehensive income (263) 62 4 (197) Other movements Balance as at 30 June 2021 (1,498) 97 3 35 (1,363) Balance as at 1 July 2021 (1,498) 97 3 35 (1,363) Charged/(credited) to the income statement 25 28 (3) 50 Charged/(credited) to other comprehensive income (80) (16) (3) (99) Deferred tax associated with the acquisition of Tilt and Trustpower (206) (125) (7) (338) Other movements (3) (3) Balance as at 30 June 2022 (1,759) (16) 3 19 (1,753) TO THE CONSOLIDATED FINANCIAL STATEMENTS. the year ended 30 June 2022
NOTES
Property,
• capital gain 106 11
(i)
492022REPORTANNUALMERCURYENERGYFREEDOMINNUMBERSMENUNOTE 5. TAXATION 2022$M 2021$M Income Tax (i) Tax expense Profit before tax 510 173 Prima facie tax expense at 28% on the profit before tax (143) (48) Adjusted for the tax effect of the following items: • share of associates’ and joint ventures’ tax paid earnings 1 6
2022Assets$M
• other differences (5) (1) Tax expense attributable to profit from ordinary activities (41) (32) Represented by: Current tax expense (91) (66) Deferred tax recognised in the income statement 50 34
• taxable temporary differences, except those arising from initial recognition of goodwill; and
Deferred Tax Deferred tax is provided in full, using the liability method, on temporary differences arising between the tax and accounting bases of the assets and liabilities. A deferred tax asset is only recognised to the extent that there will be future taxable profit to utilise the temporary difference. Property, plant and equipment is held on capital account for income tax purposes. Where assets are revalued, with no similar adjustment to the tax base, a taxable temporary difference is created that is recognised in deferred tax. 2021Assets$M Liabilities2022$M Net 2022 $M Net 2021 $M Recognised deferred tax assets and liabilities plant and equipment (1,759) (1,498) (1,759) (1,498) Financial instruments 97 (16) (16) 97 Employee benefits and provisions 3 3 3 3 Other 19 35 19 35 22 135 (1,775) (1,498) (1,753) (1,363) instrumentsFinancial$M entitlementsEmployee$M Other$M Total$M
Liabilities2021$M
• deductible temporary differences to the extent that it is probable that they will be utilised.
The effective tax rate for the financial year is 8% (30 June 2021: 18%), however after adjustment to the profit before tax for the non-taxable gain on disposal of shares in Tilt Renewables Limited, the effective tax rate is 29% (30 June 2021: 24% after adjustment for non-taxable gain on sale of Hudson Ranch).
equipmentplantProperty,and$M
NOTE 6. INVENTORIES Cost of consumable stores is determined on a weighted average basis and includes expenditure incurred in acquiring consumable stores and bringing them to their final condition and location. Consumable stores of $29 million (2021: $24 million) include consumables held to service and repair operating plants and finished goods relating to the retail business. also include carbon units (NZUs) which management has identified as held for sale, the Group applies the brokertrader measurement exemption in NZ IAS 2. These are initially recognised at cost, then subsequently revalued and measured at fair value less cost to sell. When there is a change in fair value, the gain or loss on revaluation is recognised in profit or loss in the period of the change. Carbon units worth $65 million relating to 854k units (2021: $nil) are held for sale. During the year, the Group recognised total revenue of $27 million from the sale of carbon units.
2022$M 2021$M Consumable Stores 29 24 Carbon Units - at fair value less cost to sell 65 Inventories 94 24 Trading Goods - at fair value less cost to sell Units'000 Value$M Opening Balance - 1 July 2021 Transferred from Intangibles Assets 685 26 Purchases 1,284 88 Amounts recognised in profit or loss (1,115) (52) Revaluation movement 3 Closing Balance - 30 June 2022 854 65 NOTE 7. PROPERTY, PLANT & EQUIPMENTGenerationassetsatfairvalue$M Other atassetscost$M Right-of-useassets$M Capital work in progress at cost$M Total$M YEAR ENDED 30 JUNE 2021 Opening net book value 5,575 48 44 231 5,898 Additions 209 209 Transfers 50 3 (53) Disposals (15) (15) Net revaluation movement 938 938 Depreciation charge for the year (186) (12) (4) (202) Closing net book value 6,362 39 40 387 6,828 Balance at 30 June 2021 Cost or valuation 6,362 116 56 387 6,921 Accumulated depreciation (77) (16) (93) Net book value 6,362 39 40 387 6,828 NOTES TO THE CONSOLIDATED FINANCIAL STATEMENTS. For the year ended 30 June 2022
Inventories
502022REPORTANNUALMERCURYENERGYFREEDOMINNUMBERSMENU
NOTES TO THE CONSOLIDATED FINANCIAL STATEMENTS.
512022REPORTANNUALMERCURYENERGYFREEDOMINNUMBERSMENUassetsGenerationatfairvalue$M Other assets at cost $M Right-of-useassets$M Capital work in progress at cost$M Total $M YEAR ENDED 30 JUNE 2022 Opening net book value 6,362 39 40 387 6,828 Additions 26 128 154 Additions in relation to the acquisition of Tilt New Zealand assets 1,026 16 1,042 Additions in relation to the acquisition of Trustpower retail business 18 22 1 41 Transfers 302 5 (307) Disposals (5) (2) (7) Net revaluation movement 293 293 Depreciation charge for the year (255) (9) (7) (271) Closing net book value 7,723 51 97 209 8,080 Balance at 30 June 2022 Cost or valuation 7,723 137 120 209 8,189 Accumulated depreciation (86) (23) – (109) Net book value 7,723 51 97 209 8,080
NOTE 7. PROPERTY, PLANT & EQUIPMENT (CONTINUED)
The cost of property, plant and equipment constructed by the Group, including capital work in progress, includes the cost of all materials used in construction, associated direct labour and an appropriate proportion of variable and fixed overheads. Costs incurred in obtaining resource consents are capitalised and recognised as a non-current asset where it is probable they will give rise to future economic benefits. These costs are depreciated over the life of the consent on a straight-line basis. Financing costs attributable to a project are capitalised at the Group’s specific project finance interest rate where these meet certain time and monetary materiality limits. Costs of testing whether the assets are functioning properly are also capitalised. Costs cease to be capitalised as soon as an asset is ready for productive use.
Right-of-use assets constitute properties, land royalties, office equipment and transmission equipment and represents the Group's right to use those underlying assets as a lessee under lease agreements. In line with IFRS 16, all leases are recognised on the balance sheet. Lease payments are recorded as a repayment of the lease obligation and interest expense. Lease assets are depreciated on a straight line basis over the current lease term. The Group has recognised lease assets and lease liabilities at the present value of future lease payments for existing lease terms and all lease renewal options that are reasonably certain to be exercised. The weighted average incremental borrowing rate applied to lease liabilities recognised in the statement of financial position was 5.27% (2021: 5.01%). The group's lease interest and lease liability are disclosed in note 2 and note 12, respectively.
ASSETS CARRYING VALUES
ASSETS CARRIED AT FAIR VALUE
The cost of property, plant and equipment purchased comprises the consideration given to acquire the assets plus other directly attributable costs incurred in bringing the assets to the location and condition necessary for their intended use.
All generation assets shown at valuation (except Resource Management Act consents) were revalued using a net present value methodology by PricewaterhouseCoopers, an independent valuer, as at 30 June 2022. This resulted in an increase to the carrying value of the Group’s hydro, geothermal and wind generation assets of $139 million, $1 million and $153 million respectively in the current year. This is in addition to the $938 million revaluation increase recognised across the Group’s hydro and geothermal generation assets in 2021. As a consequence of the revaluation, accumulated depreciation on these generation assets has been reset to nil.
The north section of the windfarm commenced its operations in December 2021 and the south section is expected to be commissioned in June 2023.
As at 30 June 2022, the capital work in progress balance is elevated due to the Group's construction of its Turitea windfarm.
Generation plant and equipment is measured at fair value less accumulated depreciation. Any surplus on revaluation is transferred directly to the asset revaluation reserve unless it offsets a previous decrease in value recognised in the income statement, in which case it is recognised in the income statement. A deficit on revaluation is recognised in the income statement in the period it arises where it exceeds any surplus previously transferred to the asset revaluation reserve. Any accumulated depreciation and impairment at the date of the revaluation is eliminated against the gross carrying amount of the asset and the net amount is restated to the revalued amount of the asset. Additions to property, plant and equipment stated at valuation subsequent to the most recent valuation are recorded at cost. All other items of property, plant and equipment are recorded at cost less depreciation and impairments.
The key assumptions used in the valuation include the forecast of the future wholesale electricity price path, generation volume, projected operational and capital expenditure, and asset life assumptions and discount rates. In all cases there is an element of judgement required as valuations make use of unobservable inputs including wholesale electricity prices over time of between $74/MWh and $145/MWh (2021: $74/MWh and $180/MWh), average operational expenditure of $204 million p.a. (2021: $171 million p.a.), net average production volumes of 8,362 GWh p.a. (2021: 6,703 GWh p.a.), a post-tax discount rate of between 5.6% and 6.0% for wind assets backed by long-term Power Purchase Agreements and between 6.5% and 6.9% for other assets (2021: 6.2% to 6.6%). The valuation also assumes the on-going operation of New Zealand Aluminium Smelter Limited at Tiwai Point, no material changes to the wholesale market regulatory regime, hydro and geothermal fuel supply being sustained over the modelled horizon and no material changes to generation consent conditions. The discounted cash flow valuation approach assumes 100% control and consequently a control premium should be applied if using an equity valuation technique to derive comparative asset values.
For the year ended 30 June 2022
522022REPORTANNUALMERCURYENERGYFREEDOMINNUMBERSMENU NOTES TO THE CONSOLIDATED FINANCIAL STATEMENTS. For the year ended 30 June 2022 NOTE 8. INTANGIBLE ASSETS Intangiblesoftware$M Acquiredbrand$M Rights$M Emissionsunits$M Work progressin$M Total$M YEAR ENDED 30 JUNE 2021 Opening net book value 25 18 23 4 70 Additions 37 19 56 Transfers 16 (16) AmortisationDisposals for the year (17) (2) (19) Closing net book amount 24 16 60 7 107 BALANCE AT 30 JUNE 2021 Cost 135 34 60 7 236 Accumulated amortisation (111) (18) (129) Net book value 24 16 60 7 107 YEAR ENDED 30 JUNE 2022 Opening net book value 24 16 60 7 107 Additions 9 26 35 Additions in relation to the Trustpower retail acquisition 11 18 2 31 Transfers 17 (27) (17) (27) SurrenderedDisposals Units (1) (1) Amortisation for the year (20) (1) (1) (22) Closing net book amount 32 17 15 41 18 123 BALANCE AT 30 JUNE 2022 Cost 163 18 34 41 18 274 Accumulated amortisation (131) (1) (19) – – (151) Net book value 32 17 15 41 18 123 NOTE 7. PROPERTY, PLANT & EQUIPMENT (CONTINUED) The following table outlines the valuation impact of changes to assumptions, keeping all other valuation inputs constant, that the valuation is most sensitive to. Sensitivity Valuation impact 2022 $M 2021 $M Future wholesale electricity price path +/- 10% $1,201 / ($1,201) $1,044 / ($1,044) Discount rate +/- 0.5% ($733) / $894 ($711) / $892 Operational expenditure +/- 10% ($341) / $341 ($289) / $289 The carrying amount of revalued generation assets, had they been recognised at cost, would have been $2,514 million (2021: $1,911 million). Depreciation Depreciation is calculated on a straight-line basis on all property, plant and equipment other than freehold land, capital work in progress and exploration assets, so as to write down the assets to their estimated residual value over their expected useful lives. The annual depreciation rates are as follows: 2022 2021 Office fixture and fittings, including fit-out 2-33% 2-50% Generation assets 1-20% 1-33% Computer hardware and tangible software 5-33% 5-50% Other plant and equipment 2-33% 2-50% Vehicles 5-33% 5-33% Right of use assets 2-50% 2-33%
NOTE 8. INTANGIBLE ASSETS (CONTINUED) Software
Carbon units that have been allocated by the Government under the Projects to Reduce Emissions scheme are recorded at nominal value (nil value). Purchased carbon units are recorded at cost (purchase price). At 30 June 2022, the Group held a total of 1,676,497 units within intangible assets. Carbon units, when allocated or purchased for purposes other than trading units, are recorded as intangible assets and are not revalued subsequent to initial recognition.
532022REPORTANNUALMERCURYENERGYFREEDOMINNUMBERSMENU
Carbon Units & Emissions Obligations
Acquired Brand
6 Share
6 9 At
NOTES TO THE CONSOLIDATED FINANCIAL STATEMENTS. For
Ngā Awa Pūrua Electricity generation Joint operation 65.00% 65.00% New Zealand LLC Investment holding Joint venture 20.86% 20.86% United States Minerals LLC Mineral extraction Joint venture 18.99% 20.84% United States Associates Joint ventures 2022 $M 2021 $M 2022 $M 2021 $M at the beginning of the year the year of earnings (2) 16 (3) of movement in other comprehensive income and reserves (2) received during the year (6) (58) (3) Reclassification to held for sale (248) Balance at the end of the year 67 77 the end of the year the Group had outstanding advances to its Rotokawa joint venture partner in the amount of $4 million (2021: $5 million) and its associate TPC Holdings Limited of $4 million (2021: $4 million). related party receivables refer to note 16. accounts for its interest in EnergySource LLC and EnergySource Minerals LLC as joint ventures and applies the equity method under NZ IAS 28 Investments in Associates and Joint Ventures
77 328 9 –Additions during
2022
28 Distributions
Mercury
NOTE 9. INVESTMENT IN AND ADVANCES TO ASSOCIATES AND JOINT ARRANGEMENTS (JOINT VENTURES AND JOINT OPERATIONS) The Group financial statements include the following: Interest held Name of entity Principal activity Type 2022 2021 Country TPC Holdings Limited Investment holding Associate 25.00% 25.00% New Zealand Tilt Renewables Limited Electricity generation and development Associate 19.96% New Zealand NOW New Zealand Limited Broadband ISP Associate 48.46% 48.46% New Zealand Rotokawa Steamfield operation Joint operation 64.80%
Subsequent to the reclassification of the investment holding in Tilt Renewables to held for sale in the last financial year, the disposal was completed on 2 August 2021. the year ended 30 June
Carbon units that are surrendered to creditors in compensation for their emissions obligations are recognised as an expense in the income statement and a reduction to intangible assets in the balance sheet, based on the weighted average cost of the units Emissionssurrendered.obligations are recognised as a current liability as the obligation is incurred. Up to the level of units held, the liability is recorded at the carrying value of those units intended to settle the liability. Forward contracts for the purchase of carbon units are recognised when the contracts are settled. The Group also began trading in carbon units, which led to the transfer of units identified as trading units to inventories. Please refer to note 1 for the accounting policy for carbon units identified for trading. 64.80% New Zealand
For terms and conditions of these
As part of the acquisition of the Trustpower retail business, the Group allocated part of the purchase price to the Trustpower brand acquired. Rights Rights, of which land access rights are the most significant, acquired to further the Group's generation development programme are stated at cost less accumulated amortisation and any accumulated impairment losses. Rights, which have a finite life, are amortised over the life of the rights, which range from 5 to 60 years (2021: 3 to 60 years). Testing for impairment will only arise when there is an indication that the asset may be impaired.
Balance
Acquired computer software licenses are capitalised on the basis of the costs incurred to acquire and bring to use. These costs are amortised over their estimated useful lives of 1 - 15 years (2021: 2 - 15 years). If costs incurred to configure or customise softwareas-a-service arrangements result in the creation of a resource which is identifiable, and where the Group has the power to obtain the future economic benefits flowing from the underlying resource and to restrict the access of others to those benefits, such costs are recognised as a separate intangible software asset and amortised over the useful life of the software on a straight-line basis. If costs do not meet the recognition criteria, they are expensed when incurred. As these assets are deemed to have a finite life, impairment testing will only be performed when there is an indication that the intangible asset may be impaired.
EnergySource
EnergySource
11 6 Share
542022REPORTANNUALMERCURYENERGYFREEDOMINNUMBERSMENUNOTE 10. RECEIVABLES, PAYABLES & ACCRUALS 2022 $M 2021 $M RECEIVABLES Trade receivables and accruals 476 312 Allowance for credit loss (5) (1) Net trade receivables and accruals 471 311 Prepayments 21 10 492 321 Trade receivables are measured at amortised cost using the effective interest method. Customers are typically invoiced on a monthly basis. Large commercial and industrial customers are billed on a calendar month basis, while for most mass market customers billing occurs on a rolling cycle each month and over the year. Revenue accruals for unbilled telecommunication services, unread gas and electricity meters at balance date involves an estimate of consumption for each unread meter based on past consumption history. Generation revenue is derived mostly from generation sales to the New Zealand wholesale market at the prevailing spot price at the grid injection point. Revenue is invoiced by the Wholesale Market Clearing Manager on a calendar month basis reflecting actual metered generation at the stations. Trade receivables are non-interest bearing and are generally on 30 day terms for large commercial and industrial customers and mass market customers are on 20 day terms. For terms and conditions of related party receivables refer to note 16.
The
1-30pastdaysdue 31-60pastdaysdue >60pastdaysdue Total Expected loss rate % 4% 28% 69% Gross carrying amount – trade receivables $M 14 1 6 21 Expected credit loss $M 5 5 2022 $M 2021 $M Movements in the allowance for credit loss were as follows: Balance at the beginning of the year 1 2 Allowance recognised on acquisition of Trustpower retail business 4 Charge for the year 1 1 Amounts written off (1) (2) Balance at the end of the year 5 1 2022 $M 2021 $M Payables and accruals Trade payables and accruals 372 293 Employee entitlements 8 7 Sundry creditors 32 21 412 321 Trade payables are non-interest bearing and are normally settled on 30 to 60 day terms. Customer Assets and Costs Mercury currently offer customers incentives such as appliances and modems to enter into contracts for electricity and telecommunication services. Under NZ IFRS 15 theses incentives are considered performance obligations and a proportion of the revenue expected to be received over the contract period is allocated to these goods based on their stand alone selling price. The revenue allocated to these goods is recognised immediately in the income statement with corresponding contract assets recorded on the balance sheet, reflecting Mercury’s right to future revenue not yet billed. Contract assets are then amortised to the income statement over the contract period as the future consideration is billed. Customer incentives such as credits and discounts provided to customers for entering contracts are also recognised initially on the balance sheet as contract assets. The cost associated with the provision of these incentives is then amortised to the income statement over the contract period. NOTES TO THE CONSOLIDATED FINANCIAL STATEMENTS. For the year ended 30 June 2022
The Company applies the simplified approach to measuring expected credit losses, which uses a lifetime expected loss allowance for all trade receivables, with impairment being recognised in the income statement and a corresponding provision on the balance Tosheet.measure the expected credit losses, trade receivables have been grouped based on days past due. The expected loss rates are based on the historical credit losses in prior periods, adjusted for any significant known amounts that are not receivable. Separate loss rate models are maintained in relation to customers on Mercury contracts from those on Trustpower contract and the table below is a combined hybrid to show combined losses. following table details the loss allowance at 30 June 2022:
The Group recognises an allowance for impairment loss when there is objective evidence that the Group will not be able to collect amounts due according to the original terms of the receivable. An allowance charge of $1 million (2021: $1 million) was recognised during the year. Receivables of $1 million (2021: $2 million) which were deemed uncollectable were written off.
552022REPORTANNUALMERCURYENERGYFREEDOMINNUMBERSMENUNOTE 10. RECEIVABLES, PAYABLES & ACCRUALS (CONTINUED) Contract costs are primarily costs incurred to obtain and retain customer contracts (such as sales commission costs) . These costs are recognised on the balance sheet as contract costs and are amortised on a straight-line basis over the expected average mass market customer tenure. The following summarises significant changes in contract asset and contract costs balances: CONTRACT ASSETS 2022 $M 2021 $M Opening AdditionsBalance 4 Additions recognised on acquisition of Trustpower retail business 29 Amortisation to profit or loss (6) Closing balance 27 Current portion 18 Non-current portion 279 CONTRACT COSTS 2022 $M 2021 $M Opening Balance 2 2 Additions 3 2 Amortised to operating expenses (2) (2) Closing balance 3 2 Current portion 2 2 Non-current portion 31 2 NOTE 11. PROVISIONS 2022 $M 2021 $M Balance at the beginning of the year 86 74 Provisions made during the year 13 Provisions used during the year (4) Provisions reversed during the year (8) Discounting movement 3 3 Balance at the end of the year 81 86 Current – –Non-current 81 86 81 86 Provisions have been recognised for the abandonment and subsequent restoration of areas from which geothermal resources have been utilised. The provision is calculated based on the present value of management's best estimate of the expenditure required, and the likely timing of settlement. Changes in these estimates made during the year are reported as an increase in provisions and a reduction in revaluation reserves. The increase in provision resulting from the passage of time (the discount effect) is recognised as an interest expense. The wells are estimated to have an average useful life of 19 years. NOTES TO THE CONSOLIDATED FINANCIAL STATEMENTS. For the year ended 30 June 2022
The Group has $750 million of committed and unsecured bank loan facilities as at 30 June 2022 (30 June 2021: $500 million).
Current borrowings include all drawn bank facilities, borrowings with a contractual maturity of less than one year, accrued interest of $7 million (30 June 2021: $4 million) and current lease liabilities of $9 million (30 June 2021: $5 million).
NOTES TO THE CONSOLIDATED FINANCIAL STATEMENTS. For the year ended 30 June 2022
Following the establishment of the Green Financing Framework in August 2020 and the issuance of $550 million of green bonds in FY21, on 17 November 2021 Mercury issued AU$200 million (NZ$207 million) of 7-year unsecured, unsubordinated fixed rate (2.918%) green bonds. Mercury has tracked the $757 million of green bond proceeds in accordance with the Green Financing Framework. On 13 May 2022 Mercury issued $250 million of new unsecured, subordinated, redeemable 30-year capital bonds (MCY050). The MCY050 bonds are due to expire on 13 May 2052 and have an initial fixed interest rate of 5.73% per annum. The interest rate resets on 13 May 2027 and every 5 years thereafter.
Borrowings are recognised initially at fair value, net of transaction costs incurred. Borrowings are subsequently measured at amortised cost, with the exception of the USPP, capital bonds (MCY050) and Green bonds, a portion of which is measured at fair value through profit or loss.
The Group has entered into a negative pledge deed in favour of its bank financiers in which the Group has agreed, subject to certain exceptions, not to create or permit to exist a security interest over or affecting its assets to secure its indebtedness, and to maintain certain financial ratios in relation to the Group. These undertakings and covenants also apply to the US Private Placement terms and conditions. There was no breach of the terms of this deed or the terms and conditions of the US Private ThePlacement.Grouphas entered into various lease contracts for the right to use land & buildings and office equipment and is also deemed to be a lessee of transmission equipment.
Subsequent to 30 June 2022, Mercury has executed a new $25 million bank facility and amended an existing bank facility. Total committed facilities available remain unchanged at $750 million.
The Group has entered into a Master Trust Deed and Supplementary Trust Deeds for all its NZD denominated Senior Fixed and Floating Rate Bonds with the New Zealand Guardian Trust Group Limited, acting as trustee for the holders. The Group has agreed, subject to certain exceptions, not to create or permit to exist a security interest over or affecting its assets to secure indebtedness, and to maintain certain financial covenants. There has been no breach of the terms of these deeds.
562022REPORTANNUALMERCURYENERGYFREEDOMINNUMBERSMENUNOTE 12. BORROWINGS Borrowing denominationcurrency Maturity Coupon 2022 $M 2021 $M Bank facilities NZD Dec-2022Aug-2025 Floating 226 Commercial paper programme NZD < 3 months Floating 255 160 Wholesale / credit wrapper NZD Sep-2021 Floating 300 USPP – US$30m USD Dec-2022 4.35% 39 39 Wholesale bonds NZD Mar-2023 5.79% 25 26 USPP – US$45m USD Dec-2025 4.60% 59 59 Green retail bonds NZD Sep-2026 2.16% 201 201 Green retail bonds NZD Sep-2027 1.56% 201 201 Green wholesale bonds AUD Nov-2028 2.92% 208 Green wholesale bonds NZD Oct-2030 1.92% 147 146 Capital bonds NZD Jul-2049 3.60% 302 302 Capital bonds NZD May-2052 5.73% 252 Lease liabilities 120 64 Deferred financing costs (9) (6) Fair value adjustments (70) (1) Carrying value of loans 1,956 1,491 Current 561 471 Non-current 1,395 1,020 1,956 1,491
A $440 million bank facility agreement was entered into to fund the acquisition of Trustpower’s retail business as detailed in Note 1, the facility limit was reduced to $100 million and was fully drawn as at 30 June 2022.
The Company has a $400 million Commercial Paper programme which is fully backed by committed and undrawn bank facilities. Notes issued under the programme are short-term money market instruments, unsecured and unsubordinated and targeted at professional investors. The programme is rated A2 by S&P Global.
The Group's overall risk management programme focuses on the unpredictability of financial markets and seeks to proactively manage these risks with the aim of protecting shareholder wealth. Exposure to price, credit, foreign exchange, liquidity and interest rate risks arise in the normal course of the Group's business. The Group's principal financial instruments comprise cash and cash equivalents, trade receivables and accruals (not prepayments), advances, payables and accruals, borrowings and derivative financial instruments.
(A) MARKET RISK Price Risk – Electricity Contracts
Interest Rate Risk
The following summarises the potential impact of increases or decreases in the relevant market risk exposures of the Group on post tax profit and on other components of equity. The analysis does not take into account dynamic market response over time, which could be material. Price Risk Sensitivity analysis is based on an assessment of the reasonably possible movements in forward price. Impact on post tax profit Impact on equity 2022 $M 2021 $M 2022 $M 2021 $M Group Electricity forward price increased by 10% 45 3 (69) (56) Electricity forward price decreased by 10% (40) (3) 70 56
Sensitivity Analysis
For the year ended 30 June 2022
The Group is exposed to foreign exchange risk as a result of transactions denominated in a currency other than the Group's functional currency. The currencies giving rise to this risk are primarily US Dollar, Japanese Yen, Euro, Yuan and AU Dollar. Foreign exchange risk arises from future commercial transactions (including the purchase of capital equipment and maintenance services), recognised assets and liabilities (including borrowings) and net investments in foreign operations. It is the Group's policy to enter into forward exchange contracts to hedge its committed foreign denominated expenditure programme. At balance date the notional or contract amounts of foreign currency forward exchange contracts were $49 million (2021: $17 million).
The Group has exposure to interest rate risk to the extent that it borrows for fixed terms at floating interest rates. The Group uses interest rate swaps and interest rate options to manage this exposure. At balance date, the contract notional amount of interest rate swaps outstanding (including forward starts) was $2,067 million (2021: $1,865 million).
The Group enters into electricity contracts that establish a fixed price at which future quantities of electricity are purchased and sold. The electricity contracts are periodically settled with any difference between the contract price and the electricity spot price settled between the parties. At balance date, the notional value of electricity contracts, including both buy and sell contracts, with remaining terms of up to 31 years (2021: 4 years), were $3,367 million (2021: $1,561 million). The increase in number of years and notional values are associated with contracts entered into as part of the Tilt New Zealand operations and Trustpower retail business acquisitions. Foreign Exchange Risk
572022REPORTANNUALMERCURYENERGYFREEDOMINNUMBERSMENU
Foreign Exchange Risk Sensitivity analysis is based on the impact of the New Zealand Dollar weakening or strengthening against the most significant currencies for which the Group has foreign exchange exposure, allowing for reasonably possible movements in foreign exchange rates over a one year period based on the average actual movements experienced over the prior 10 years. All known foreign exchange exposures are hedged in accordance with Mercury’s Treasury Policy. As such, Mercury expects no material impact on post tax profit from movement in foreign exchange rates. Impact on equity 2022 $M 2021 $M
NOTE 13. FINANCIAL RISK MANAGEMENT
New Zealand Dollar – Euro Currency strengthens by 10% (1) Currency weakens by 10% 1 1 New Zealand Dollar – USD Currency strengthens by 10% (2) Currency weakens by 10% 2 New Zealand Dollar – JPY Currency strengthens by 10% (1) Currency weakens by 10% 1 New Zealand Dollar – AUD Currency strengthens by 10% 17 Currency weakens by 10% (20) Interest Rate Risk It is the Group's policy to apply hedge accounting to seek to reduce profit or loss volatility. For floating rate borrowings, a portion is fixed using interest rate swaps and hedge accounted with changes in fair value of swaps going through other comprehensive income. For fixed rate borrowings, the Group enters into interest rate swaps to move a portion equivalent to the swap rate to floating. Wholesale and capital bonds are measured at amortised cost, with fair value movement of interest rate swaps recognised in the income statement. The swap rate component of the Green bonds, USPP and AMTN is measured at fair value, and hedge accounted with changes in fair value of both debt and interest rate swaps recognised in the income statement. TO THE CONSOLIDATED FINANCIAL STATEMENTS.
NOTES
It is the Group's policy to only enter into derivative transactions with banks that it has signed an ISDA master agreement with, and which have a minimum long-term S&P Global's (or Moody's equivalent) credit rating of A- or higher.
With respect to energy contracts, the Group has potential credit risk exposure to the counterparty dependent on the current market price relative to contracted price until maturity.
Less
Impact on post tax profit Impact on equity 2022 $M 2021 $M 2022 $M 2021 $M Interest rates higher by 100 bps (31) (33) 11 14 Interest rates lower by 100 bps 33 35 (11) (15)
(B) CREDIT RISK
While the tables below give the impression of a liquidity shortfall, the analysis does not take into account expected future operating cash flows or committed and undrawn debt facilities that will provide additional liquidity support. than 6 months$M 6 to months12$M 1 to years5$M Later than 5 years$M Total$M year ended 30 June 2022
The Group manages its exposure to credit risk under policies approved by the Board of Directors. The Group performs credit assessments on all mass market customers and normally requires a bond from commercial customers who have yet to establish a suitable credit history. Customer bonds are held in a separate bank account.
The carrying amounts of financial assets recognised in the balance sheet best represent the Group's maximum exposure to credit risk at the reporting date without taking account of any collateral held by way of customer bonds.
(C) LIQUIDITY RISK
NOTE 13. FINANCIAL RISK MANAGEMENT (CONTINUED)
582022REPORTANNUALMERCURYENERGYFREEDOMINNUMBERSMENU
In the event of a failure by a retailer to settle its obligations to the Energy Clearing House, following the exhaustion of its prudential security, a proportionate share of the shortfall will be assumed by all generator class market participants. The Group would be impacted in the event that this occurs.
30 JUNE 2022 Liquid financial assets Cash and cash equivalents 65 – – – 65 Receivables 489 – 3 – 492 554 – 3 – 557 Financial liabilities Payables and accruals (400) – (12) – (412) Loans (545) (49) (454) (1,918) (2,966) Lease liabilities (7) (7) (58) (99) (171) (952) (56) (524) (2,017) (3,549) Net outflow (398) (56) (521) (2,017) (2,992) NOTES TO THE CONSOLIDATED FINANCIAL STATEMENTS. For the
Sensitivity analysis is based on an assessment of the reasonably possible movement in the 10 year swap rate over a one year period based on actual movements over the last 10 years. The movement in post tax profits are due to higher/lower interest costs from variable rate debt and cash balances combined with the result of fair value changes in interest rate swaps and options that are valid economic hedges but which do not qualify for hedge accounting under NZ IFRS 9. The movements in other components of equity result from fair value changes in interest rate swaps and options that have qualified for hedge accounting.
The Group manages its exposure to liquidity risk under policies approved by the Board of Directors. Policies require that prescribed headroom is available in undrawn and committed facilities to cover unplanned needs and that a limited amount of facilities mature over the immediate 12 month forward-looking period. The Group's objective is to maintain a balance between continuity of funding and flexibility through the use of various funding sources. Non-derivative Financial Liabilities
The following liquidity risk disclosures reflect all contractually fixed payoffs, repayments and interest from recognised nonderivative financial liabilities. The timing of cash flows for non-derivative financial liabilities is based on the contractual terms of the underlying contract. It should be noted that the amounts presented are contractual undiscounted cash flows, consequently the totals will not reconcile with the amounts recognised in the balance sheet.
on
not
• Level 3 - the fair value is estimated using inputs that are not based on observable market
• Level 1 - the
NOTES TO THE CONSOLIDATED FINANCIAL STATEMENTS. For the year
Financial instruments that are measured using a valuation technique with only observable market inputs, or unobservable inputs that are not significant to the overall valuation, include interest rate derivatives and foreign exchange derivatives traded a recognised exchange. ended 2022
data.
fair value is calculated using quoted prices in active markets;
value is estimated using inputs
• Level 2 - the fair other than quoted prices included in Level 1 that are observable for the asset liability, either directly (as prices) or indirectly (derived from and
prices);
or
592022REPORTANNUALMERCURYENERGYFREEDOMINNUMBERSMENUNOTE 13. FINANCIAL RISK MANAGEMENT Less(CONTINUED)than6months$M6 to months12$M 1 to years5$M Later than 5 years$M Total$M 30 JUNE 2021 Liquid financial assets Cash and cash equivalents 163 – – – 163 Receivables 318 – 3 – 321 481 – 3 – 484 Financial liabilities Payables and accruals (318) – (3) – (321) Loans (475) (14) (223) (1,251) (1,963) Lease liabilities (4) (4) (33) (41) (82) (797) (18) (259) (1,292) (2,366) Net outflow (316) (18) (256) (1,292) (1,882) Derivative Financial Liabilities The table below details the liquidity risk arising from derivative liabilities held by the Group at balance date. Net settled derivatives include interest rate derivatives and electricity price derivatives. Gross settled derivatives relate to foreign exchange derivatives that are used to hedge future purchase commitments. Foreign exchange derivatives may be rolled on an instalment basis until the underlying transaction occurs. While the maturity of these derivatives are short-term the underlying expenditure is forecast to occur over different time periods. The table also summarises the payments that are expected to be made in relation to derivative liabilities. The Group also expects to receive funds relating to derivative asset settlements. The expectation of cash receipts in relation to derivative assets should also be considered when assessing the ability of the Group to meet its obligations. Less than 6 months$M 6 to months12$M 1 to years5$M Later than 5 years$M Total$M 30 JUNE 2022 Derivative liabilities – net settled (135) (139) (388) (6) (668) Derivative liabilities – gross settled • Inflows 51 51 • Outflows (49) (49) Net maturity (133) (139) (388) (6) (666) Less than 6 months$M 6 to months12$M 1 to years5$M Later than 5 years$M Total$M 30 JUNE 2021 Derivative liabilities – net settled (172) (90) (232) (16) (510) Derivative liabilities – gross settled • Inflows 18 18 • Outflows (17) (17) Net maturity (171) (90) (232) (16) (509) (D) FAIR VALUE ESTIMATION Fair Values The carrying amount of financial assets and liabilities recorded in the financial statements approximates their fair values at 30 June 2022 except for those detailed in the table below. Fair values are based on quoted market prices and inputs for each bond issue. 2022 $M 2021 $M Fixed Rate Wholesale Bond 26 27 Fixed Rate Wholesale Green Bond 115 137 Fixed Rate Retail Bond 349 393 Floating Rate Bonds 300 Capital Bonds 542 307 US Private Placement (USPP) 122 118 Australian Medium Term Note (AMTN) 192 Valuation Techniques The Group uses various methods in estimating the fair value of a financial instrument. The methods comprise:
30 June
As at 30 June 2022 all of the Group's financial instruments carried at fair value were categorised as level 2, except for some electricity price derivatives. Electricity price derivative assets of $48 million were categorised as level 1 (2021: $49 million) and $592 million were categorised as level 3 (2021: $111 million). Electricity price derivative liabilities of $46 million were categorised as level 1 (2021: $54 million) and $498 million were categorised as level 3 (2021: $370 million).
Acquired contracts 345 New contracts (76) (52) (12) (4) Matured contracts 30 2 6 8 Gains and losses
NOTES
For the year ended 30 June 2022
There is a presumption that when derivative contracts are entered into on an arm's length basis that the fair value at inception is zero. The contract price of non exchange traded electricity derivative contracts are agreed on a bilateral basis, the pricing for which may differ from the prevailing derived market price curve for a variety of reasons. In these circumstances an inception adjustment is made to bring the initial fair value of the contract to zero at inception. This inception adjustment is amortised over the life of the contract by adjusting the future price path used to determine the fair value of the derivatives by a constant amount to return the initial fair value to zero.
The following summarises the potential impact of increases or decreases in price risk exposures of the Group on post tax profit. Sensitivity analysis is based on an assessment of the reasonably possible movements in forward price. Impact on post tax profit 2022 $M 2021 $M Group Electricity forward price increased by 10% 50 3 Electricity forward price decreased by 10% (45) (3) Fair value through other comprehensive income Fair value throughorprofitloss 2022 $M 2021 $M 2022 $M 2021 $M
Deferred ‘inception’ gains/(losses)
Level 3 Sensitivity Analysis
Opening balance (284) (55) 25 26
Electricity price derivatives
The table below details the movements in inception value gains/(losses) included in the fair value of derivative financial assets and liabilities as at 30 June.
Management's internal view of forward prices incorporates a minimum price of $76/MWh and a maximum price of $194/MWh (2021: minimum price of $89/MWh and a maximum price of $172/MWh) over the period in question (in real terms) and is determined by a demand supply based fundamental model which takes account of current hydrological conditions, future inflows, an assessment of thermal fuel costs, anticipated demand and supply conditions and future committed generation capacity. Where the fair value of a derivative is calculated as the present value of the estimated future cash flows of the instrument there are two key inputs being used: the forward price curve and the discount rate. Where the derivative is an option, then the volatility of the forward price is another key input. The selection of inputs requires significant judgement, and therefore there is a range of reasonably possible assumptions in respect of these inputs that could be used in estimating the fair values of these derivatives.
Opening deferred inception gains / (losses) 27 (7) Deferred inception gains on new hedges 10 22
• Through the income statement (13) (5)
• Through other comprehensive income 73 (179) Closing balance (257) (284) 351 25 Level 3 fair value movements recognised within the income statement of the Group are recognised within 'change in the fair value of financial instruments'.
2022 $M 2021 $M
Deferred inception (losses)/gains realised during the year (11) 12 Closing inception gains 26 27 (E) CAPITAL RISK MANAGEMENT Management seeks to maintain a sustainable financial structure for the Group having regard to the risks from predicted short and medium-term economic, market and hydrological conditions along with estimated financial performance. Capital is managed to provide sufficient funds to undertake required asset reinvestment as well as to finance new generation development projects and other growth opportunities to increase shareholder value.
In order to maintain or adjust the capital structure, changes can be made to the amount paid as dividends to shareholders, capital can be returned or injected or assets sold to reduce borrowings.
Reconciliation of level 3 fair value movements
Financial instruments that use a valuation technique which includes non-market observable data include non-exchange traded electricity contracts which are valued using a discounted cash flow methodology using a combination of ASX market prices for the first three years, combined with Management's internal view of forward prices for the remainder of the contract's term.
602022REPORTANNUALMERCURYENERGYFREEDOMINNUMBERSMENUNOTE 13. FINANCIAL RISK MANAGEMENT (CONTINUED)
Maximum use is made of observable market data when selecting inputs and developing assumptions for the valuation technique.
Consistent with other companies in the industry, the Group monitors capital on the basis of its gearing ratio. This ratio is calculated as net debt divided by total capital. Net debt is calculated as total borrowings (both current and non-current) less cash and cash equivalents. Total capital is calculated as shareholders' equity plus net debt. The gearing ratio is calculated below: TO THE CONSOLIDATED FINANCIAL STATEMENTS.
612022REPORTANNUALMERCURYENERGYFREEDOMINNUMBERSMENUNOTE 13. FINANCIAL RISK MANAGEMENT (CONTINUED) 2022 $M 2021 $M Borrowings at carrying value 1,956 1,491 Fair value adjustments 70 1 Less cash and cash equivalents (65) (163) Net debt 1,961 1,329 Total equity 4,752 4,186 Total capital 6,713 5,515 Gearing ratio 29.2% 24.1% Under the negative pledge deed in favour of its bank financiers the Group must, in addition to not exceeding its maximum gearing ratio, exceed minimum interest cover ratios and a minimum shareholder equity threshold. The Group seeks to maintain a debt to EBITDAF ratio of less than 3.0 times, on average through time, to maintain credit metrics sufficient to support its credit rating on an on-going basis. For the purpose of calculating this ratio and consistent with the rating agency treatment, adjustments are made to net debt and EBITDAF based on the definitions provided by the rating agency. For the year ended 30 June 2022, the Group had a debt to EBITDAF ratio of 2.7 times (2021: 2.5 times). NOTE 14. DERIVATIVE FINANCIAL INSTRUMENTS The fair values of derivative financial instruments together with the designation of their hedging relationship are summarised below, based on maturity date: 2022 $M 2021 $M CURRENT ASSETS Interest rate derivative 23 15 Electricity price derivative 293 103 Foreign exchange derivative 3 Cross currency interest rate derivative 9 2 328 120 CURRENT LIABILITIES Interest rate derivative 28 24 Electricity price derivative 259 243 Foreign exchange derivative 1 Cross currency interest rate derivative 2924 267 NON-CURRENT ASSETS Interest rate derivative 11 2 Electricity price derivative 347 58 Cross currency interest rate derivative 13 14 371 74 NON-CURRENT LIABILITIES Interest rate derivative 104 81 Electricity price derivative 285 182 Cross currency interest rate derivative 40011 263 It is the Group's policy to apply hedge accounting to reduce volatility in profit, and where possible, derivatives are hedge accounted under NZ IFRS 9 as either cash flow or fair value hedges. NOTES TO THE CONSOLIDATED FINANCIAL STATEMENTS. For the year ended 30 June 2022
• Manawa and Waipipi hedges: although these swaps are considered to be effective economic hedges we are unable to demonstrate their eligibility for hedge accounting as they include price reset mechanisms that refer to future prices and so changes in fair value are being recorded in profit and loss.
interest
622022REPORTANNUALMERCURYENERGYFREEDOMINNUMBERSMENU
Interest rate and cross currency interest rate derivatives
•as:Tuaropaki Power Company hedge contract that settles against a moving hedge index rather than wholesale electricity prices and the Meridian Energy virtual asset swap which hedges wholesale electricity price risk between North and South Island.
Foreign exchange forward contracts are designated as cash flow hedges in a relationship with forecast purchases of inventory and capital equipment, mainly for maintenance and construction of generation assets. Electricity contracts not designated as hedges for accounting purposes Where possible electricity price derivatives are designated as cash flow hedges in a relationship with forecast electricity sales and purchases. Exceptions are swaps and options used for trading (electricity futures, options and financial transmission rights) as well
Pay-fixed receive-floating interest rate swaps are designated as cash flow hedges in a relationship with a portion of floating rate debt exposure. Receive-fixed pay-floating interest rate swaps are designated as fair value hedges in a relationship with the swap rate on fixed rate bonds. Cross currency swaps are designated as both fair value and cash flow hedge relationships with the USPP and AMTN debt (refer note 12), depending on the component of the debt being hedged: risk free (swap) rate as a fair value hedge; credit margin as cash flow hedge. Foreign exchange derivatives
Income
Other
2022
Cross
• Certain contracts for difference novated to the Company as part of the transaction with Norske Skog which are not considered to be effective hedges. changes in fair values of financial instruments recognised in the income statement and other comprehensive income are summarised below: statement comprehensiveincome $M 2021 $M 2022 $M 2021 $M currency rate derivatives (8) (47) –
–USPP Borrowings – fair value change 8 47 – –– –Interest rate derivatives (including Green bond fair value change) (15) (21) 66 41 Cross currency interest rate derivatives – margin (1) Electricity price derivatives (65) (17) (8) (265) Foreign exchange rate derivatives 1 1 16 Ineffectiveness of cash flow hedges recognised in the income statement (3) (6) Total change in fair value of derivative financial instruments (82) (45) 59 (208) MOVEMENT IN CASH FLOW HEDGE RESERVE 2022 $M 2021 $M Opening balance (268) (122) Effective portion of cash flow hedges recognised in the reserve 59 (208) Amount transferred to balance sheet (1) (15) Equity accounted share of associates’ movement in other comprehensive income 1 15 Transfer of share of associates' reserves to profit or loss upon disposal (20) Tax effect of movements (16) 62 Closing balance (245) (268) NOTES TO THE CONSOLIDATED FINANCIAL STATEMENTS. For the year ended 30 June 2022
The
NOTE 14. DERIVATIVE FINANCIAL INSTRUMENTS (CONTINUED)
Consequently, only those transactions between entities which have some owners external to the Group have been reported below: Transaction value 2022 $M 2021 $M Management Energy contract Management Energy contract settlements received 10 36
fees and service agreements received and paid 18 22 •
Majority Shareholder
The Group entered into a number of contracts with other Crown-controlled entities to hedge against wholesale electricity price risk, the most significant being a virtual asset swap with Meridian Energy Limited which has a remaining life of 3.5 years and a contract for difference with Genesis Energy Limited for generation produced at the Waipipi wind farm.
Mercury NZ Limited also has investments in subsidiaries, associates and joint arrangements, all of which are considered related Asparties.these are consolidated financial statements, transactions between related parties within the Group have been eliminated.
settlements received 21 26 • Service fees paid 4 1 Joint operations •
Transactions with Related Parties
Associates •
632022REPORTANNUALMERCURYENERGYFREEDOMINNUMBERSMENUNOTE 15. RECONCILIATION OF PROFIT FOR THE YEAR TO NET CASH FLOWS FROM OPERATING ACTIVITIES 2022 $M 2021 $M Profit for the year 469 141 Items classified as investing or financing activities: • Net interest accrual 1 (8) • Prudential payment recognised within total revenue 6 • Proceeds from the sale of Hudson Ranch (41) • Dividend income from Tilt Renewables Limited (5) • Gain on disposal of shares in Tilt Renewables Limited (367) Adjustments for: Depreciation and amortisation 293 221 Amortisation of contract assets and costs to profit or loss 8 Net loss on sale of property, plant and equipment 2 15 Change in the fair value of financial instruments 82 47 Movement in effect of discounting on long-term provisions 5 3 Share of earnings of associate and joint venture companies 5 (22) Close-out of electricity swap and non-cash amortisation of acquired swap value 43 Net cash provided by operating activities before change in assets and liabilities 536 362 Change in assets and liabilities during the year: • Increase in trade receivables and prepayments (141) (32) • Increase in inventories (67) (2) • Increase in trade payables and accruals 61 76 • Increase/(decrease) in provision for tax 13 (32) • Increase in deferred tax (50) (34) Net cash inflow from operating activities 352 338 NOTE 16. RELATED PARTY TRANSACTIONS
fees and service fees received 13 15 •
NOTES TO THE CONSOLIDATED FINANCIAL STATEMENTS. For the year ended 30 June 2022
The majority shareholder of Mercury NZ Limited is the Government, providing it with potential influence over the Group.
Transactions cover a variety of services including energy, postal, travel and tax.
An advance to TPC Holdings Limited of $4 million (2021: $4 million) is interest free and repayable on demand subject to certain conditions being met. The long-term advance to our Rotokawa Joint Venture partner of $4 million (2021: $5 million) carries a floating interest rate.
Repayments under the advance are linked to the level of receipts under the geothermal energy supply agreement. There is no fixed repayment date, the agreement will terminate on receipt of any outstanding balances. No related party debts have been written off, forgiven, or any impairment charge booked.
for
and
the activities
A number of Directors also provide directorship to other third party entities.
and officers insurance for
A number of key management personnel provide directorship to subsidiaries and other third party entities as part of their employment without receiving any additional remuneration, with exception to the Group's Chief Executive who was a member of the Board of Directors of Tilt Renewables Limited and directly received remuneration for his directorship services until Tilt Renewables Limited was no longer an associate of the Company and his directorship ceased. Several of these entities transacted with the Group. Group purchases directors the benefit of key management personnel in relation to the they provide to the Group. & Commitments 2022 $M 2021 $M one year 157 106 One to five years 85 134 Later than five years 3 7 245 247
NOTES TO THE CONSOLIDATED FINANCIAL STATEMENTS. For the year ended 30 June 2022
The Group holds land and has interests in fresh water and geothermal resources that are subject to claims that have been brought against the Government.
The
and
Capital commitments include purchases of both property, plant and equipment (PP&E) and intangibles. PP&E commitments include contracts for construction of wind generation assets at Turitea and refurbishment of hydro generation assets at Karāpiro. Intangible commitments are contracts to purchase New Zealand emissions trading scheme (NZ ETS) units. In the event the NZ ETS is terminated the existing forward purchase agreements, which cover the seven year period from the end of the reporting period, will also terminate. Contingencies
services
The Group holds land at Maraetai, Waikato that is subject to a remedies hearing brought against the Government in the Waitangi Tribunal. The remedies hearing relates to an application seeking binding recommendations for the resumption of land at Pouakani, including the Group’s land at Maraetai. A Crown Treaty settlement has been offered to Ngāti Kahungunu ki Wairarapa Tāmaki nui-ā-Rua Settlement Trust, which the Tribunal had indicated in a preliminary finding may be an appropriate recipient for the land (although that preliminary finding was set aside following a judicial review decision in the High Court, which remains subject to further appeal). The Crown and Ngāti Kahungunu ki Wairarapa Tāmaki nui-ā-Rua Settlement Trust have signed a settlement deed addressing the resumption claim. Legislation giving effect to the settlement deed has been introduced to Parliament, but the settlement has not yet been enacted. It is not yet known whether that settlement deed will result in the Trust and other Māori groups abandoning their claims to resumption of the land. The Group has received advice that a Tribunal decision on the matter, should the matter be remitted to the Tribunal for reconsideration, is unlikely to impair the Group’s ability to operate its hydro assets.
642022REPORTANNUALMERCURYENERGYFREEDOMINNUMBERSMENUNOTE 16. RELATED PARTY TRANSACTIONS (CONTINUED) Transaction value $0002022 $0002021 Key management personnel compensation (paid and payable) comprised: • Directors’ fees 1,030 991 • Benefits for the Chief Executive and Senior Management: Salary and other short-term benefits 6,564 6,233 Termination benefits 353 Share-based payments 561 712 8,155 8,289 At the Annual Shareholders' Meeting held on 23 September 2021, the shareholders approved an increase of annual directors' fees. Other transactions with key management personnel
services
CONTINGENCIES Capital
The Pouakani Claims Trust No 2 and a group of kaumatua have filed a claim in the Māori Land Court seeking a declaration that certain parts of the Waikato riverbed are Māori customary land, including the riverbed beneath the Whakamaru, Maraetai I and II and Waipapa dams. The claim has been amended to include interests in the water flowing over the riverbed. Mercury holds the fee simple or beneficial title to those parts of Waikato riverbed beneath the Whakamaru, Maraetai I and II and Waipapa dams and has received advice that the applicants are unlikely to succeed with a claim to customary title in that land. Mercury sought orders striking out the claim in relation to the parts of the riverbed to which Mercury holds fee simple or beneficial title, and water. The Court recently dismissed Mercury’s strike out application, on the basis that the matters Mercury raised should be dealt with at trial. Mercury has challenged this decision by issuing a judicial review claim. The applicants have also filed a related claim in the Waitangi Tribunal pursuant to the Treaty of Waitangi Act 1975, but have not yet taken any further steps in relation to that claim.
Key management personnel are those people with responsibility authority planning, directing controlling of the Group. Key management personnel for the Group are considered to be the Directors and Senior Management.
services
Within
NOTE 17. COMMITMENTS
652022REPORTANNUALMERCURYENERGYFREEDOMINNUMBERSMENU
A separate claim by the New Zealand Māori Council relating to fresh water and geothermal resources was lodged in 2012 with the Waitangi Tribunal. The Tribunal concluded that Māori have residual (but as yet undefined) proprietary rights in fresh water and geothermal resources and it will be for the Government to determine how any such rights and interests may best be addressed. The Tribunal has recently indicated its intention to progress to stage three of that inquiry, albeit the scope of stage three is still being considered in light of the Government’s draft Natural and Built Environments Bill. The impact of this claim on the Group’s operations is unknown at this time. From time to time the Group will issue letters of credit and guarantees to various suppliers in the normal course of business. However, there is no expectation that any outflow of resource relating to these letters of credit or guarantees will be required as a Theconsequence.Grouphas no other material contingent assets or liabilities.
The board of directors has approved a fully imputed final dividend of 12.0 cents per share to be paid on 30 September 2022, the Company plans to continue with the DRP announced in the current financial year. The DRP strike price is to be determined by the average of daily volume weighted average sale price for a share, calculated on all price setting trades of shares that took place through the NZX Main Board over a period of five trading days starting on 19 September 2022, less a 2% discount.
The Group operates an equity-settled share based long-term incentive (LTI) plan for senior executives. The plan is designed to enhance the alignment between shareholders and those executives most able to influence the performance of the Group. Under the plan executives are granted the shares at nil cost if certain total shareholder return targets are met. Performance is measured against a combination of: i) other electricity generators who are listed on the NZX; and (ii) out performance against the Group's internal return on capital hurdles. The plan is due to vest in July 2023 and July 2024. Each LTI plan provides the board with a level of discretion and represents the grant of in-substance nil-price options to executives. During the year the Group expensed $561,274 in relation to equity-settled share based payment transactions (2021: $711,827). Movements in the number of share options are as follows: 2022 2021 Balance at the beginning of the year 709,603 631,434 Options granted 256,152 382,997 Options expired (34,579) Options exercised (101,876) (270,249) Balance at the end of the year 863,879 709,603 224,730 options were exercisable at the end of the year (2021: 101,876) with the remaining options under the plan having a weighted average life of 1.0 years (2021: 1.4 years).
NOTE 18. SHARE-BASED PAYMENTS
NOTE 19. SUBSEQUENT EVENTS & OTHER MATTERS
Long-term Incentive Plan
During the year, the Group worked with the Commerce Commission after incorrectly applying early termination fees for about 2,000 customers between 2016 and 2020. The Group completed remediation in early 2021 and were charged for breaching the Fair Trading Act following year-end. In July 2021, during the commissioning of the rebalancing works at the Rotokawa geothermal field, a ‘water hammer’ event occurred which resulted in a loss of containment of steam. The event did not lead to any injuries. The Group notified WorkSafe of the incident and co-operated with their investigation. Following year end Mercury was charged by WorkSafe for breaches of health and safety legislation. The financial impact of these charges is assessed to be immaterial.
There are no other material events subsequent to balance date that would affect the fair presentation of these financial statements.
For the year ended 30 June 2022
NOTE 17. COMMITMENTS & CONTINGENCIES (CONTINUED)
NOTES TO THE CONSOLIDATED FINANCIAL STATEMENTS.
Climate change, actions to reduce emissions and the transition to a low carbon economy are shaping the world around us. Our strategy anticipates that our business will encounter both climate-related opportunities and risks. We want to play a leading role in New Zealand's successful transition. Many of the actions we are taking to play this leading role are featured throughout this report, such as: • our ongoing investment in development of renewable generation at Turitea and our broader wind pipeline, as part of the material contribution our sector will make to support decarbonisation across the economy; and • supporting our vulnerable customers, helping to ensure that the transition is equitable for all consumers, including those experiencing hardship. This specific disclosure statement provides further information on the climaterelated opportunities and risks for Mercury. It is titled a ‘TCFD report’ and we have used that framework to guide our disclosure. For future reports, we anticipate using the Aotearoa New Zealand Climate Standards as our framework for disclosure.
662022REPORTANNUALMERCURYTCFDREPORTMENUTCFD REPORT. 67CONTENTS. INTRODUCTION 68 GOVERNANCE 70 STRATEGY 78 RISK MANAGEMENT 80 METRICS & TARGETS PREPARED ACCORDANCEIN WITH DISCLOSURESRELATEDTASKRECOMMENDATIONSTHEOFTHEFORCEONCLIMATE-FINANCIAL(TCFD).MERCURY AND CLIMATE CHANGE.

Over the past five years we have improved our capability to identify, assess and manage climate-related risks and opportunities. Our governance approach and disclosure of these risks and opportunities has evolved over this period. Our integrated strategy considers climate-related risks and opportunities, and we have made changes to our governance frameworks and remuneration models to ensure that the Executive Management Team (EMT) have appropriate oversight of, and are actively assessing and managing, these climate-related risks and opportunities. A summary of the key findings in this report are:
• We have broadened our disclosure on how our strategy remains resilient to these risks and supportive of capturing these opportunities.
This section of the report contains several forward-looking statements. We have prepared the information in this section, including statements as to the financial impacts of climate change, with due care and attention. This information is based on numerous current assumptions about Mercury’s present and future strategies and the environment in which Mercury will operate in the future. The risks and opportunities described in this section of the report may not eventuate. If they do, there are many factors that could cause Mercury’s actual results or performance to differ materially from that described. No representation is made as to the accuracy, completeness or reliability of this information. Given the nature of this information, Mercury shall not be required to update or revise any forward-looking statement. Nothing in this section of the report should be interpreted as capital growth, earnings or any other advice or guidance.
REPORTTCFD
• Climate-related risks in our ‘top 5’ include regulation that does not balance the energy trilemma, extreme weather events and increased temperature.
672022REPORTANNUALMERCURYMENU
• We are currently considering the further actions we can take to reduce our own emissions to ensure we are doing our part to mitigate climate change. Further details of these actions, and the related investment required, are likely to form the basis of our transition plan in future years.
• Scenario analysis completed in FY21 was revised in FY22, with two scenarios created based on: (1) a 1.5-degree future; and (2) a 3-degree (‘lack of meaningful intervention’) future. We plan to participate in development of energy sector scenarios to support future scenario analysis.
INTRODUCTION.
• Climate-related opportunities in our ‘top 5’ include the increase in electricity demand and consumer / investor desire for renewable generation.
• Based on these scenarios, we have updated our view of climate-related opportunities and risks that could affect our business.
• Material climate-related risks and opportunities have been the subject of regular discussion by our Board and EMT since 2018.

a) Describe the Board’s oversight of climate-related risks and opportunities. Our Board has responsibility for the strategic direction and operation of Mercury. Responsibilities are set out in the Board Charter, and in relation to climate change
682022REPORTANNUALMERCURYMENU
The RAAC is responsible for overseeing, reviewing and advising the Board on our risk management policy and processes, including climate-related risks and opportunities. It is made up of five independent directors and meets at least four times per year. Our risk management framework meets New Zealand standard AS/NZS ISO 31000 Risk Management – Principles and guidelines. Our risk management framework helps us to identify different categories of risk – compliance risks, operational risks, reputational risks, financial risks and people risks. Climate-related risks show up across many of these categories and are treated in the same way as other risks across these categories. More information on our risk management framework can be found in the Governance Statement. to day
TCFD recommendation: Disclose the organisation’s governance around climate-related risks and opportunities. The risk management framework at Mercury supports a comprehensive approach to risk. It encompasses financial, strategic, environmental, operational, regulatory, reputational, social and governance risks. This includes identifying, assessing, and managing climate-related risks and opportunities. The governance structure for risk management at Mercury is captured in the diagram below. The responsibilities of the key elements of this structure are summarised in the following paragraphs, and more detail is available in the Corporate Governance Statement. Our GM Sustainability plays a key role in providing advice and coordinating Mercury’s cross-functional approach to identifying climate-related risks and opportunities.
GOVERNANCE. FUNCTIONSBUSINESSGOVERNANCE communicatesEstablishes,andimplementsriskmanagementOversees ofimplementationframeworktheMonitorsframeworkandtestscontrols Manages day
•include:establishing clear strategic goals with appropriate supporting business plans and resources
• monitoring strategy implementation, financial performance and the integrity of reporting • ensuring that effective audit, risk management and compliance systems are in place and monitored Climate change risks and opportunities are currently managed, at a governance level, through the Risk Assurance and Audit Committee (RAAC) of the Board.
risks and controls All ManagementBusinessUnitsRiskCommitteeRiskCommittee&AssuranceAuditRiskAssuranceOfficer REPORTTCFD

692022REPORTANNUALMERCURYMENU
The remuneration of the Chief Executive and the EMT is linked to Mercury’s strategic pillars. In FY22, 15% of their short-term performance incentive is tied to the threeyear objective to ‘play a leading role in New Zealand’s successful transition to a low carbon economy’, of which climate change is a key focus.
b) Describe management’s role in assessing and managing climate-related risks and opportunities. One of the responsibilities of the Chief Executive and the EMT is to develop, and recommend to the Board, strategies to identify, assess and manage climate-related risks and opportunities and to foster improved reporting and disclosure of these risks and opportunities. This is done at least annually. Climate risks and opportunities are also considered in the development and review of our strategy. They form a key element of the market context when setting goals on a three-yearly basis, and reviewing these each quarter by management and the Board.
More information on the responsibilities and remuneration of the Chief Executive and the Executive Management Team can be found in our Governance Statement and Remuneration Report. In FY22, the EMT delivered a revised and more detailed climate change scenario analysis, including the annual review of climate-related risks and opportunities. Our management operates a Risk Management Committee (RMC) whose mandate is (1) to promote risk awareness and appropriate risk management to all Mercury people; and (2) to monitor and review risk activities as required. Membership of the RMC is made up of representatives from the EMT and is chaired by the Chief Executive. The RMC meets at least quarterly, and reviews Mercury’s risks, including its approach to climate-related risks and opportunities, at least annually. The day-to-day management of climaterelated risks and opportunities occurs across multiple business functions, namely Sustainability, Regulatory Affairs, Environmental Resources, Finance, Legal, Communications, Risk Assurance, Generation, Portfolio and Customer. We sought external expertise to assist with our scenario analysis and development. We also sought external expertise to review our existing TCFD reporting processes and inform future improvements, as well as legal expertise to assist us with our submission on the development of the XRB climate-related disclosure standards.
In FY20, the Board updated its skills matrix to specifically include climate change. The Board also reviewed whether our risk management framework supported our integrated business planning process and whether climate-related risks were adequately captured within this risk management framework. Given the potential impact of climate change across Mercury, the Board amplified climate-related risks within our consolidated risk register. In FY21, the Board held an externally facilitated deep dive into regulatory, economic and legal aspects of climate-related risks and opportunities. In May 2021, management presented its first climate change scenario analysis report and the outcome of its review of climate-related risks and opportunities to the RAAC. In FY22, a cross-functional team from across the business conducted more in-depth scenario analysis to highlight emerging risks and opportunities. The Board seeks internal and external expertise and advice relating to climate change as required to ensure that it has up to date information and can provide appropriate oversight of climate-related issues. As this area continues to evolve, the Board and management will seek access to the necessary expertise.
REPORTTCFD

energy sector reform has enabled reduction in emissions and a prohibition of thermal Therefuels. has been a significant increase in the adoption of distributed energy resources (DERs), household solar, batteries, electric vehicles and smart charging infrastructure. This, along with increased conversion of process heat, is driving strong electricity demand Thegrowth.changing climate has led to slightly warmer winters and hotter drier summers, but this has had minimal impact on annual demand. North Island inflows remain relatively unchanged, while South Island inflows rise in the winter. Drought and water scarcity issues have been addressed. However, higher temperatures have increased the likelihood of fire risks leading to increased outages.
a) Describe the climate-related risks and opportunities the organisation has identified over the short, medium, and long-term.
&METHODOLOGYASSUMPTIONS.
REPORTTCFD
TCFD recommends considering a scenario based on an optimistic view of the future, where global greenhouse gas emissions are reduced, and temperature increases are limited to below 2˚C. In FY22, we undertook detailed scenario analysis around the focal question: “What climate-related issues could plausibly affect Mercury by 2050?”
Storm events increase in intensity. The policy focus on reducing emissions has resulted in increased challenges relating to energy affordability.
702022REPORTANNUALMERCURYMENU
SCENARIO 2: 3˚C IN 2050 Global response to climate change has lacked co-ordination resulting in warming being limited to 3˚C in 2050. Limited energy sector reform has resulted in ineffective decarbonisation activity. Dry-year security of supply is still dependent on gas. The uptake of solar, batteries, and smart charging infrastructure is lagging and lacks a consistent approach. There has been limited demand growth with limited incentives to adopt electric vehicles or convert more challenging process heat – much of which remains dependent on thermal fuels. The changing climate has led to warmer winters and hotter drier summers. This has resulted in higher summer demand with a potential shift to a summer peak. However, this has only had a slight impact on annual demand. Higher temperatures have increased the likelihood of fire risks leading to increased outages. There is also a greater risk of longer, intense periods of both drought and increased rainfall. Higher dew point temperature further intensifies storm intensity. Policy has prioritised addressing energy affordability over emissions reduction.
STRATEGY.
SCENARIO 1: 1.5˚C IN 2050 Global response to climate change has been coordinated and effective at limiting warming to 1.5˚C in Significant2050.
TCFD recommendation: Disclose the actual and potential impacts of climate-related risks and opportunities on the organisation’s businesses, strategy, and financial planning where such information is material.
b) Describe the impact of climate-related risks and opportunities on the organisation’s businesses, strategy, and financial planning. To help improve our understanding of climaterelated risks and opportunities over the short, medium and long-term and to test the resilience of our strategy, we undertake scenario analysis on a regular basis, and will continue to refine and adapt our process as things continue to change. Our first scenario analysis was completed in FY21, and in FY22 a cross-functional team from across the business conducted scenario analysis with the resulting scenarios described on the next pages.
The boundary for this analysis was the whole of the organisation, including our subsidiaries. We also considered the impacts on the upstream and downstream phases of our value chain, that is, on our key suppliers and partners, as well as our customers. At this stage we have used two scenarios, anchored as a 1.5 degree future and a 3 degree future where there is a lack of meaningful intervention. These act just as ‘bookend’ scenarios across physical and regulatory risks. We are cognisant that a four scenario approach is good practice for scenario development and will work towards this as we refine our approach. As part of this refinement, we will participate in the development of a set of sector scenarios that can be used consistently across the energy sector.
REPORTTCFD
The physical impacts of a changing climate on geothermal generation have been modelled using NIWA national climate change models, observed temperature data and in-house modelling software.
TIMEFRAMES
The focus of the scenario analysis was on the next 30 years, to 2050. A 30-year time horizon reflects the long life of our assets, and while this is by no means the lifetime of our assets, it is an important timeframe in terms of asset refurbishment cycles. This timeframe also aligns with New Zealand’s regulatory aspirations for NetZero by 2050. Risk and opportunities have been discussed across the short (1-5 years), medium (5-10 years) and long-term (10+ years). This aligns with Mercury’s business planning timeframes and those required in ESG (Environmental, Social and Governance) reporting and disclosures.
Modelling has been undertaken by the National Institute of Water and Atmospheric Research (NIWA) for many of the physical risks associated with a changing climate. This modelling, and other specific studies related to impacts on the electricity sector, have informed this report.
In particular, the Commission’s modelling of its “demonstration path” has influenced our expectations of future electricity demand.
We have drawn on the Climate Change Commission's final advice to the government and the government’s Emissions Reduction Plan to better understand how the economy, the broader energy system and the electricity sector will likely evolve towards net zero carbon.
712022REPORTANNUALMERCURYMENU
DATA SETS & MODELS USED

Maintain engagement with government, regulators and other key stakeholders. Contribute to the narrative on the positive contributions of renewable electricity to New Zealand. Continue to make submissions on legislation, regulation and planning instruments. Continue to conduct scenario modelling and review outcomes to inform operating plans and any changes required to resource consent conditions and high flow management plans.
722022REPORTANNUALMERCURYMENU THE TOP FIVE CLIMATE-RELATED RISKS & OPPORTUNITIES FOR MERCURY A comprehensive list of risks and opportunities were identified through the scenario analysis process. In the following table, these have been broken into the top five risks and opportunities for Mercury. A second table (on the next pages) provides details of the other risks also identified against the TCFD categories. This is not a complete list of the climate-related risks and opportunities, however, it captures the key risks and opportunities identified through our scenario analysis process. As things change, these risks and opportunities will also continue to evolve. RISKS OPPORTUNITIES REGULATION THAT DOES NOT BALANCE THE ENERGY TRILEMMA EXTREME WEATHER EVENTS INCREASE IN ELECTRICITY DEMAND RISK RATING Scenario 1: 1.5˚C IN 2050 Scenario 2: 3˚C IN 2050 Scenario 1: 1.5˚C IN 2050 Scenario 2: 3˚C IN 2050 Scenario 1: 1.5˚C IN 2050 Scenario 2: 3˚C IN 2050 DESCRIPTION Regulation that does not consider the management of New Zealand’s energy trilemma, with significant reforms focusing narrowly on decarbonisation, negatively impacting security and affordability. Physical damage to generation assets caused by flood or other extreme weather events. Increase in electricity demand from significant electrification of transport, industrial process heat conversions to electricity and green hydrogen production. LIKELIHOOD Highly Likely Possible Possible Likely Likely Possible IMPACTS Increased costs and/or decreased revenue. Reduced ongoing investment. Reduced ability to attract investment. Decreased revenue and/or increased SIB capex. Increased revenues.
RESPONSEMANAGEMENT
RISKS OPPORTUNITIES.& L
IMPLICATIONSFINANCIAL
Complete hydrology review to clarify the return periods impacting dams and incorporate climate change impacts in our dam safety work programme to ensure safe flow management. We are working with other global hydro operators to commission further advice on how climate impacts can be considered for managing hydro assets. Continue maintenance work on geothermal sites, with a focus on operational changes related to heat.
TIME PERIOD S M L M L
High Low High Medium to High Medium to High
METHODOLOGY
Consider the potential impacts on wind generation at times of repowering. Support government initiatives to encourage electrification, including by continuing to deploy new renewable generation through our existing prospects in wind, geothermal and batteries. Continue to provide propositions for our customers as they adopt new technologies or are otherwise impacted by the transition. H H H S M L H M S M L
REPORTTCFD
Current high levels of regulatory reform present a broad range of outcomes. We have assumed the worst-case scenario of regulation that stops or slows ongoing investment in renewables in determining the potential financial impact. We continue to increase the granularity of information we have on extreme weather events. This will help inform refinement of this estimate of the investment required to mitigate physical asset risk. Using Climate Change Commission demonstration path modelling and our current 15% generation market share. Using Climate Change Commission current policy reference modelling and our current 15% generation market share.
MM MM
The combination of impact and likelihood to determine risk ratings is shown in the table to the right. Note this is a simplified version of the more detailed internal risk matrix used by Mercury to classify risk. L IMPACT Low Medium High
LIKELIHOOD: Likely: Will probably, or is expected, to occur within a 3-10 year timeframe Possible: Has the potential to occur Unlikely: Unlikely to occur
TIME PERIOD: Short-term 1-5 yearsS Mid-term 5-10 yearsM Long-term 10+ yearsL
RISKMH RATING: LowMediumHigh
FINANCIAL IMPACT: High: Greater than $75m Medium: Greater than $750k Low: Less than $750k
LIKELIHOOD
Continue overarching portfolio management to manage drought as it impacts the catchment over time - including through using contracts or length of the portfolio. Geothermal station impacts will be managed through considering station modification options and cooling. Continue to communicate key ESG factors in our communications and Investor Relations programmes. Further develop our green debt portfolio.
732022REPORTANNUALMERCURYMENURISKS OPPORTUNITIES CHANGES IN TEMPERATURE CONSUMER / INVESTOR DESIRE FOR RENEWABLE GENERATION RISK RATING Scenario 1: 1.5˚C IN 2050 Scenario 2: 3˚C IN 2050 Scenario 1: 1.5˚C IN 2050 Scenario 2: 3˚C IN 2050 DESCRIPTION Periods of drought reduce catchment inflows. Increasing average temperatures and the incidence of hot days may reduce geothermal plant output and/or the reliability of air-cooled plant and equipment increasing output variability, and potentially reducing geothermal generation capacity. The increased differential in terms of access to debt between high performing ESG companies and low performing ESG companies results in savings on debt instruments such as sustainability linked loans / green bonds and improved credit ratings. Potential uplift of share price valuation. LIKELIHOOD Likely Likely Likely Possible IMPACTS Reduction in inflows and increased ambient temperature leading to decreased generation and revenue. Reduced costs. TIME IMPLICATIONSFINANCIALPERIOD Medium Medium METHODOLOGY Drought impact calculated through increasing prior worst observed drought with price impacts assumed based on market prices observed during drought periods. Impacts on geothermal stations assessed through existing observed temperature impacts on generation. From a debt perspective, we have considered possible savings from preferential debt rates on sustainability-linked loans and bonds, as well as the impact a potential downgrade of our credit rating due to poor ESG performance could have on our debt costs. RESPONSEMANAGEMENT
UnlikelyPossibleLikely HHM MMM MLL S M LS M L
RISKS OPPORTUNITIES.& REPORTTCFD
REPORTTCFD
In scenario 1 increasing renewable wind and solar generation pose challenges due to their inherent intermittency. The resultant market volatility increases the premium of dispatchable demand. However, this volatility is somewhat mitigated by the development of grid storage projects and new technology, as well as increased industrial and consumer demand flexibility. Our existing carbon forest credit surplus could deliver ETS compliance at below market prices, reducing compliance costs. Similar risks and opportunities are present in scenario 2, however, the development of alternative technology and industrial and consumer demand flexibility are partially crowded out by thermal generation. There is a reduced opportunity to develop new renewable generation as the most economical projects have been executed, and renewable generation development is complemented by fast-start thermal generation and gas storage development. In scenario 1, the increase in distributed and embedded generation, particularly rooftop and large-scale solar, could reduce demand for other renewable generation development. However, ‘dry year’ and short-term security is delivered through a portfolio of renewable options, such as biomass/biofuel thermal generation, renewables “overbuild,” and North and South Island pumped hydro options. Increased rooftop solar generation could provide both a risk (reduce demand) and an opportunity As(development).aportionof our customers remain financially vulnerable, there remains a risk that some of our customers are unable to pay their energy bills. Similar risks and opportunities are present in scenario 2 however, there is a reduced opportunity to develop new renewable generation, as the market continues to be supported by thermal generation and other technologies.
The TCFD framework suggests dividing climate change risks into the categories of: Market and Technology Shifts; Reputation; Policy and Legal; and Physical Risks. For this analysis, additional granularity has been introduced in the market and technology shift category. This is because we operate in both the electricity and carbon markets. Technological shifts also have the potential to provide both risks and opportunities for Mercury.
742022REPORTANNUALMERCURYMENUOTHER CLIMATE-RELATED RISKS ALSO IDENTIFIED AGAINST THE TCFD OPPORTUNITIES.RISKSCATEGORIES&
Physical and transitional climate-related risks could have significant impacts on our markets. Decarbonisation is likely to impact the relationship between supply and demand – the electrification of transport and the conversion of industrial process heat from thermal fuel sources to electricity will increase demand and present financial risks and opportunities. Technological disruption may create several risks and opportunities. In scenario 1 the increasing development of renewable generation has the potential to reduce electricity prices in the spot market. However, price volatility may increase as thermal generation is incrementally shut down, and wind generation, which is inherently intermittent, is increasingly relied on to firm generation. Our existing carbon forest credit surplus could deliver Emissions Trading Scheme (ETS) compliance at below market prices, reducing compliance costs. Similar risks and opportunities are present in scenario 2 however the gradual increase in renewable generation is supported where necessary by thermal generation, and there remains a long-term role for the gas industry resulting in lower wholesale market volatility.
SHORT-TERM 1-5 MID-TERM 5-10 YEARS LONG-TERM
YEARS
10-20 YEARS MARKETS (ELECTRICITY & CARBON) & TECHNOLOGY
In scenario 1 our reputation could be further enhanced as low carbon projects are developed and outcomes from geothermal emissions capture/use pilot projects prove positive.
752022REPORTANNUALMERCURYMENU RISKS OPPORTUNITIES.&
In scenario 1, as emissions from thermal generation are removed and replaced by renewables there could be an increased focus on geothermal emissions. However, growing activism towards carbon intensive sectors still brings capital inflow to Mercury. This is similar in scenario 2, however, the risk of reputational harm from operating geothermal generation is lower as activism is focussed towards carbon intensive sectors. This may create more of an opportunity for capital inflow to Mercury.
Reputational risks and opportunities arise at an organisational and sectoral level.
REPUTATION
In scenario 1 and 2 recognition that renewable electricity is the key to a just transition to NetZero for New Zealand could benefit the reputation of the electricity generation sector and Mercury. Our reputation could be enhanced through recognition as a thought leader on renewable energy and the electrification of transport, through partnerships for action on climate change in the Waikato catchment, as well as through successful carbon capture pilots. On the flip side, the reputation of the energy sector could be negatively impacted if consumers increasingly struggle to pay their energy bills.
REPORTTCFD
SHORT-TERM 1-5 YEARS MID-TERM 5-10 YEARS LONG-TERM 10-20 YEARS
There is a potential countervailing factor arising from an increasing focus on geothermal power station emissions, as higher carbon-emitting activities are reduced or retired. This is similar in scenario 2 however, the opportunity to increase market share through a 100% renewable brand could be higher.
• generation assets
Class actions against organisations and directors of organisations failing to act on climate change may start to emerge.
There are several risks and opportunities that may arise either from policy responses or from the absence of policy responses. Legal risks also arise in the context of proceedings against companies and directors arising from climate-related activity or inactivity, or related representative actions, including as a result of social movements. In scenario 1 the transition between the Resource Management Act (RMA) and the Natural and Built Environments Act could create investment uncertainty for generation development and heavy industry in New Zealand, with consent pathways remaining unclear. These risks are moderated in scenario 2 as less decarbonisation is sought.
In both scenarios 1 and 2 stressors pose a risk to national and international supply chains and could impact generation and development. Increasing average temperatures and the incidence of hot days may reduce geothermal plant output and/ or the reliability of air-cooled plant and equipment increasing output variability. These risks are greater in scenario 2 In both scenarios 1 and 2, storms, fire weather and lightning could increase in frequency and intensity increasing the risk to major hazard facilities, generation assets and connected network infrastructure. Stressors pose a risk to national and international supply chains and could impact generation and development. These risks are greater in scenario 2
PHYSICAL Physical risks may take the form of acute, generally shorter-term events, such as fire or flood, or longer-term chronic impacts, for example the less efficient operation of geothermal power stations arising from sustained increases in temperature. These may lead to financial risks and opportunities as a result of the impact on our assets, on how our business operates, or more broadly as a result of the impacts on the markets in which we operate. Insurance may also become more difficult or costly to procure. We continue to refine our view on physical risks, in particular how they might impact the wider electricity system.
RISKS OPPORTUNITIES.& REPORTTCFD
• national and international supply chains impacting generation repairs and maintenance and Thesedevelopment.risksaregreater in scenario 2
762022REPORTANNUALMERCURYMENU
SHORT-TERM 1-5 YEARS MID-TERM 5-10 YEARS LONG-TERM 10-20 YEARS
POLICY & LEGAL
• major hazard facilities
• connected network infrastructure • carbon forest investments
In both scenarios 1 and 2, stressors such as storms, fire weather and lightning pose a risk to:
In scenarios 1 and 2, class actions against organisations failing to act on climate change increase. In scenarios 1 and 2, class actions against organisations and directors of organisations failing to act on climate change are very likely to increase.
c) Describe the resilience of the organisation’s strategy, taking into consideration different climate-related scenarios, including a 2°C or lower scenario. We test the resilience of our strategy through the lens of these risks and opportunities. This leads to better planning and management of these risks and opportunities. In turn, our current and future climate change disclosures become more meaningful.
SECURITY OF SUPPLY
ENERGY AFFORDABILITY Access to energy is an essential service for consumers. However, the broader economic environment and rising inflation is impacting the cost of living in New Zealand, making it more challenging for an increasing number of customers to afford their energy bills. The way Aotearoa manages the transition to a low carbon energy sector will have impacts on energy affordability. We will continue our work to support vulnerable customers, which is of strategic importance to Mercury. We are partnering with industry to further understand energy hardship, and will continue to engage with, and support, government initiatives to meaningfully address this issue.
Underpinning our strategy is a long-term approach to the management of our physical assets. One element of this is that our management of dam safety risks assumes a value for Probable Maximum Flood (PMF). This is a measure of the possible volume and flow rate of the Waikato River in the event of an extreme flood. Our PMF values are prudently conservative. We are mindful that it is possible that in a changing climate PMF values may need to be increased over time. Based on currently available data and analysis, our risk management practices and mitigants are appropriate. Through our ongoing dam safety work programme and hydrological studies, we continue to seek out additional information to ensure resilience of our strategy.
PHYSICAL ASSETS
772022REPORTANNUALMERCURYMENU
In relation to scenario 1 – we anticipate growth from the adoption of electric vehicles, development of energy-intensive industries, as well as efforts to decarbonise process heat. In relation to scenario 2 – demand growth is limited as the regulatory settings do not incentivise electric vehicle adoption and decarbonisation of process heat. We improve the resilience of our strategy by ensuring that we are positioned for a range of different outcomes related to demand and taking action to attract new sources of demand to New Zealand.
Maintaining security of electricity supply will continue to be an issue for New Zealand as we increase our proportion of supply from renewable sources. Fossil fuel-backed thermal generation currently plays a significant role in responding to periods of reduced renewable supply such as ‘dry years’ (when inflows in hydro catchments are low for long periods of time). This is likely to continue through the transition, particularly through to 2030. During this transition period, as the share of renewable generation increases, it is also likely that this will lead to higher levels of electricity spot price volatility.
TRANSITION TO A LOW CARBON ECONOMY As the Climate Change Commission recognised in its final advice to the government, Aotearoa has one of the lowest emissions electricity sectors in the world. This electricity can be used to reduce emissions economy-wide through electrifying transport, process and space heating. The Commission recommended setting a target so that 50% of all energy consumed comes from renewable sources by 2035, and this has now been adopted by the government in its Emissions Reduction Plan. For context, in 2020, Aotearoa’s renewable share of final energy consumption was 28%. As a fundamental element of our strategy, we consider the role that we can play in supporting this decarbonisation of New Zealand. In addition to significant investments made in renewable generation development (to help reduce emissions from the electricity sector itself and other sectors), we also consider the role we can play in supporting the decarbonisation of other sectors. DEMAND Electricity demand is a fundamental element of our business model. Ensuring ongoing resilience requires an approach to strategy that takes into account an increasingly uncertain future. Our two scenarios capture different outcomes:
There are several conversations occurring related to security of supply. The Government’s New Zealand Battery Project is underway and set to advise on potential solutions to the challenge of achieving energy security in dry years without relying on carbon emitting thermal generation. The Commission has noted that, while finding a solution to this challenge could enable a 100% renewable electricity sector, a greater priority should be the wider use of renewable electricity economy-wide, as per its recommendation for 50% of all energy consumption to be renewable by 2035. The Commission further suggests that the government’s aspirational goal of 100% renewable electricity by 2030 could be replaced with a 95%+ target. The government Emissions Reduction Plan has in turn committed to reviewing the 100% renewable electricity target in 2024, as part of the next Plan. The Emissions Reduction Plan also includes work to develop a Gas Transition Plan by mid-2023 to drive emission reductions from natural gas in line with Aotearoa’s emissions budgets to 2035. Developing this plan should provide greater certainty for the role of thermal generation as a ‘dry year’ reserve in the electricity sector over the coming decade. We consider resilience to our strategy by considering implications of increasing electricity spot price volatility, managing our generation portfolio, and participating in these ongoing conversations and processes related to security of supply.
(1) the transition to decarbonisation is rapid, with a significant uptick in demand and (2) the transition to decarbonisation is slow and piece-meal.
RESILIENCE OF STRATEGY. REPORTTCFD
RISK
MANAGEMENT. REPORTTCFD
782022REPORTANNUALMERCURYMENU
These risks and opportunities are classified using a common methodology (the risk matrix) and recorded in the risk register systems. The RMC reviews climate-related risks every year under this management framework. For the purposes of this TCFD Report, we have provided simplified risk ratings as outlined in the table of risks and Theopportunities.climate-related risks and opportunities included in this year’s TCFD report have been identified by considering our two climate change scenarios over a 30-year time horizon. In doing so, we considered both the upstream and downstream phases of our value chain. However, we currently consider upstream phases of our value chain at a macro-level, so will continue to develop our maturity in this area. Day-to-day risk management is done by the relevant business function, with cascading responsibilities up to the RMC and the RAAC. The RAAC provides an assessment of whether the business is managing our climate change risks and responsibilities appropriately and ensures that there are effective policies and procedures in Asplace.an example, when the dam safety team considers the risks faced by their business function, the potential impacts from climate change is one of the factors that they take into account. The dam safety team work with the GM Generation to build an approach to manage these risks and develop their forward plans. Where material, issues are updated to the RMC, the RAAC and the Board. The responsibilities of business functions, the RMC, and the RAAC are described in more detail in the governance section on page 68.
a) Describe the organisation’s processes for identifying and assessing climate-related risks. Risk management is an integral part of Mercury’s business. We have an overarching Risk Management Policy supported by a suite of risk management policies appropriate for our business. The purpose of the Risk Management Policy is to embed a comprehensive capability in risk management which provides a consistent method for identification, assessment, control, monitoring and reporting of existing and potential risks to our business and to the achievement of its plans. Our risk management framework meets New Zealand standard AS/NZS ISO 31000 Risk Management – Principles and guidelines and applies to all risks at Mercury and is used across the organisation. This framework provides for the integration of risk across our material value drivers (strategic pillars) – including financial, nonfinancial, social, environmental and climate-related Climate-relatedrisks. risks are identified by a crossfunctional group consisting of representatives from the relevant business functions. This group seeks out information and data to understand whether potential risks are real, and to inform our view of the likelihood and impact of these risks.
TCFD recommendation: Disclose how the organisation identifies, assesses, and manages climate-related risks.
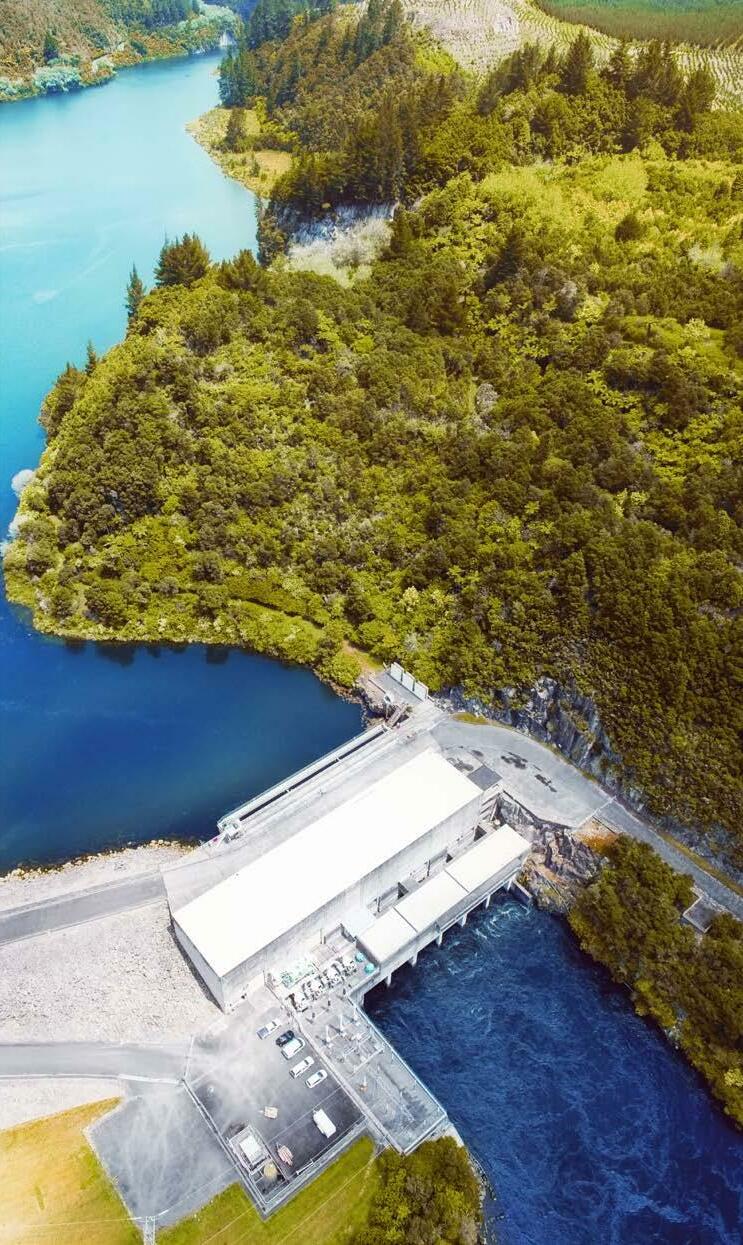
In relation to technology, we continue to develop our customer offering in relation to e.transport. Physical risks and opportunities from climate change fall into acute (already impacting the business, e.g. extended periods of drought and likely to increase in the medium term) and chronic (not currently impacting the business but likely to impact over the medium to long-term). We have continued to monitor proposed methodologies for climate change risk assessment and adaptation planning, both nationally and internationally.
b) Describe the organisation’s processes for managing climate-related risks. The day-to-day management of climaterelated risks and opportunities occurs across Sustainability, Regulatory Affairs, Environmental Resources, Finance, Legal, Communications, Risk Assurance, Generation, Portfolio and Customer.
We have models of storm events experienced within the Waikato catchment and have worked in partnership with Waikato and Bay of Plenty Regional Councils in training exercises to educate and inform council staff on the management of storms and flood risks.
REPORTTCFD
In relation to markets, our Portfolio and Finance teams manage risks and opportunities presented •by:the electricity market – we continually model scenarios of resource availability, electricity market supply and demand and adjust our approach accordingly • the carbon market – we are involved in forest carbon investments and have long-term contracts in place Regulatory risks and opportunities are managed by our Government and Industry Relations team in conjunction with external communications.
We continue to advocate for improved access to climate science research conducted by government owned research organisations (e.g. NIWA) to enable higher quality climate change risk assessments and have made a submission to the government’s Ministry for the Environment draft National Adaptation Plan which considers how Aotearoa New Zealand will adapt to the unavoidable impacts of climate change.
RISK MANAGEMENT.
792022REPORTANNUALMERCURYMENU
We continue to investigate scenario modelling for climate change adaptation which has revealed currently available regional level datasets are potentially too high level to provide the robust and detailed outputs required for long-term investment decisions for hydro assets. We are seeking to participate in the development of sector-based scenarios sometime in the near future, which may produce more granular relevant information.
Submissions have been made recently on the Climate Change Commission’s final advice, the development of the Emissions Reduction Plan, and ongoing changes to the New Zealand Emissions Trading Scheme. We continue to engage with the New Zealand Battery Project to encourage consideration of diverse approaches to achieving ‘dry year’ security through both renewable and non-renewable technologies, and the Electricity Authority on its investigation into how the electricity market would operate under very high renewable electricity supply.

Our
a) Disclose the metrics used by the organisation to assess climate-related risks and opportunities in line with its strategy and risk management process.
to
in
emissions reinjection.
new build and acquisition. We
adjustments have been
b) Disclose Scope 1, Scope 2, and, if appropriate, Scope 3 greenhouse gas (GHG) emissions, and the related risks.
to
credits and trading conducted under
c) Describe the targets used by the organisation to manage climate-related risks and opportunities and performance against targets. We produce an annual emissions inventory report following international standards and methodologies. As can be seen from the table and graphics that follow, our emissions profile is dominated by Scope 1 emissions, namely fugitive emissions from geothermal electricity generation, which account for 68% of the entire profile. Thermal emissions from the operation of a gas-fired power station reduced to zero in FY16 as the facility was decommissioned. Given the predominance of fugitive Scope 1 emissions, emissions from other scopes are considered immaterial except for downstream Scope 3 emissions from the sale of gas to our domestic dual fuel customers and emissions from the purchase of capital goods measured through stay-in-business (SIB) capex spend. Our Scope 3 emissions from the sale of gas to our domestic dual fuel customers have increased by ~75% (on an annual basis) due to the acquisition of Trustpower’s customer base. intensity an eight-year period The intensity calculation Scope 1 no made relation carbon the New Zealand Emissions Trading Scheme. Scope 1 emissions have reduced over this period by ~60% due decommissioning Southdown (gas-fired a reduction in geothermal investment geothermal Further, our wind generation base grown due to are also developing our draft transition that
for
uses
TCFD recommendation: Disclose the metrics and targets used to assess and manage relevant climate-related risks and opportunities where such information is material.
METRICS & TARGETS. OUR SCOPE 1 EMISSIONS HAVE REDUCED BY ~60% SINCE 2015. 2,000,0001,000,000500,00001,500,0002,500,000OCTonnes2e FY15 FY16 FY17 FY18 FY19 FY20 Net carbon position (tonnes)Emissions from generation and gas sales FY21 FY22 NET CARBON POSITION FY15 TO FY22 400,000300,000200,000100,0000500,000600,000OCTonnes2e FY15 FY16 FY17 FY18 FY19 FY20 FY21 FY22 Scope 1 Scope 2 Scope 3 Scope 3 (new methodology) CARBON FOOTPRINT FY15 TO FY22 Direct emissions –predominantly fugitive emissions from geothermal facilities. Scope 1 Scope 2 Indirect emissions –from electricity used at generation sites and in offices. Scope 3 * Other indirect emissions –56% downstream from gas sales to dual fuel customers. *From FY20, we have amended our methodology for calculating Scope 3 emissions. The grey area represents Scope 3 emissions such as SIB capex and general maintenance which were not previously calculated. **NZ Grid Average as per MfE data. FY15 FY16 FY17 FY18 FY19 FY20 /MWhOCkgEmissionsintensity2e 108420006000120 (GWh)Generation9,0008,0007,0006,0005,0001,0002,0003,0004,0000 FY21 FY22 Em ss ons nte ns ty kg C O e /MWh NZ Grid Average**Generation (RHS) EMISSIONS INTENSITY OF GENERATION FY15 TO FY22 Our emissions
power plant),
emissions over time and
we are acting consistently with a 1.5 degree future. REPORTTCFD
has
in
emissions only,
802022REPORTANNUALMERCURYMENU
plan to identify all of the actions that we need to take to ensure
is shown in the graph below.
81THETEAMBEHINDENERGYFREEDOMMENUMERCURYANNUALREPORT2022THE TEAM BEHIND ENERGY FREEDOM. TE TĪMA MANAWHIRI PŪNGAO. A big team contributes to our Energy Freedom mission: more than 1,300 people, around 74,000 owners, our partners and our customers. Here we introduce you to our Executive Management Team and present our corporate governance statement including our Board of Directors. We also share our remuneration policy and report, directors’ disclosures and other disclosures, information for security holders, sustainability index, a directory to help you contact us and a glossary of industry and financial terms.
822022REPORTANNUALMERCURYTHETEAMBEHINDENERGYFREEDOMMENUTEAM.MANAGEMENTEXECUTIVEYOUR GENERALSUSTAINABILITYMANAGER JULIA JACK // CHIEF MARKETING OFFICER PHIL GIBSON // GENERALPORTFOLIOMANAGER FIONA SMITH // GENERAL MANAGER CUSTOMER OPERATIONS* MARLENE STRAWSON // GENERAL MANAGER PEOPLE & PERFORMANCE STEWART HAMILTON // GENERAL MANAGER GENERATION WILLIAM MEEK // CHIEF FINANCIAL OFFICER *title changes occurred after FY22 year end. CRAIG NEUSTROSKI // GENERAL MANAGER COMMERCIAL OPERATIONS* The Executive Management Team leads our business to ensure its continued success and to position us for the future opportunities and challenges. The team all bring deep subject knowledge, and they lead their business areas focusing on working together in a changing environment.


BOARD CHANGES AND SUCCESSION PLANNING
DIVIDEND REINVESTMENT PLAN
The Board supported Mercury’s first Dividend Reinvestment Plan for the FY22 Interim Dividend, providing shareholders the opportunity to reinvest the net proceeds of the Interim Dividend in additional shares. The Board approved this Plan, which was fully underwritten and funded from existing treasury stock, allowing Mercury to free up capital to fund existing corporate expenditure and future development projects.
832022REPORTANNUALMERCURYTHETEAMBEHINDENERGYFREEDOMMENU
Planning for director succession, to ensure that over time the Board as a whole has the capability and experience to oversee Mercury’s complex business, is one of the most important aspects of my role as Chair. If Mercury is to achieve its strategic objectives, and deliver long-term value for shareholders and other stakeholders including the communities in which we operate, it requires directors with appropriate skills and experience and who represent diverse backgrounds and Successionperspectives.planning must balance current and future governance needs. Over the next few years, it is likely that several of the longestserving and most experienced Mercury directors will retire from the Board. Through the Nominations Committee, we have reviewed the Board’s collective skills and experience, matched against our refreshed skills matrix, likely tenures and diversity. Following that review, we have determined there is a need for additional directors with deep commercial and governance skills to ensure that capability is maintained and institutional knowledge and experience is retained within the Board as longer-serving directors retire. We have commenced this process with the appointment of Lorraine Witten as director with effect from 1 September 2022. Lorraine’s strong commercial acumen and extensive governance experience including audit and risk management will be a valuable addition to your Board. Kim Gordon, our current “future director” under the Future Directors programme established by the Institute of Directors will end her tenure later this year. We thank her for being a valuable contributor to Board and Committee discussions. The process for appointing the next “Future Director” will be underway in due course.
EXECUTIVE MANAGEMENT TEAM
Please see further detail about the EMT in ‘Your Executive Management Team’.
With the acquisition of Trustpower and the need to support a much larger retail business, we have supported a minor restructure of our Executive Management Team (EMT) during FY22. Mercury has made one permanent addition to the EMT, with Fiona Smith (formerly of Trustpower) stepping into the newly created role of GM Customer Operations. Craig Neustroski, previously GM Customer, will move into the role of GM Commercial Operations. These changes took effect on 1 July 2022, and will help contribute to the success of Mercury’s expanded retail business.
Last year the Board, through the People and Performance Committee, determined that we were not making as much progress as we should on our diversity and inclusion objectives. Consequently, during FY22 there has been a renewed focus on identifying the barriers to increasing diversity in our workforce, particularly at senior levels. Initiatives such as our Diverse Emerging Leaders Programme have been implemented to help us understand and reduce barriers to greater diversity within Mercury.
LETTER FROM OUR GOVERNANCECHAIR.ATMERCURY.
This year, the Board approved the issuance of a $250m capital bond to assist in financing the acquisition of Trustpower’s retail business, and for general corporate purposes. The bond issue was fully subscribed, and the strong response from the market demonstrates continued confidence in Mercury’s business performance and long term outlook.
It is likely the pay gap and pay equity ratio will change as we improve the quality of our ethnicity data and include data from Trustpower employees. Notwithstanding, the Board considers transparency will drive improvement so reporting is an important step.
Mercury has also registered on the 'Mind the Gap' Register
I look forward to engaging with our shareholders at our upcoming ASM. This year, we will finally be able to hold our first ASM in a hybrid format - with shareholders being able to join in person or remotely via video link. Mercury is aligned with the New Zealand Shareholders' Association’s principles of maximising meaningful shareholder participation and quality engagement, and I look forward to seeing you there.
Dear Shareholder It is my pleasure to present our corporate governance statement for the year ended 30 June 2022. This corporate governance statement outlines Mercury’s Corporate Governance Framework, including information about the composition, characteristics and function of Mercury’s Board, the ways in which we ensure that we act ethically and responsibly at Mercury, our approach to risk, and inclusion and diversity.
BOARD SKILLS MATRIX
ANNUAL SHAREHOLDERS' MEETING
PRUE FLACKS CHAIR
DIVERSITY AND INCLUSION
Andy Lark will retire at the Annual Shareholders' Meeting (ASM) this year after over 8 years of service. Andy has generously contributed his extensive experience in different jurisdictions and across a range of industries to Mercury - in particular, his inputs into the evolution of Mercury’s retail business and marketing and digital identity have been invaluable. On behalf of the Board, would like to thank Andy for his significant contribution to the Board and to Mercury.
PAY EQUITY Since 2019, Mercury has reported our gender pay equity ratio as part of our Diversity and Inclusion reporting. This year we are also reporting our gender pay gap, and our pay gap and pay equity ratio by ethnicity. The gender pay gap and the ethnicity pay gap reinforce the need for greater diversity at senior levels in the organisation, which is one of the primary objectives of our diversity strategy.
The Board skills matrix provides our assessment of the key outputs required from directors and how those needs are met by the current Board composition, which is important in our succession planning. Our approach is to balance specialist expertise with extensive commercial experience so that the Board as a whole has the capability to guide Mercury in achieving its strategic objectives and delivering long-term value for shareholders. FY23 and beyond will be a period of generation growth and development, coupled with the expansion and integration of our retail businesses following the completion of the Trustpower retail acquisition. Board capability will need to reflect these priorities. Skills are assessed at the level of the Board as a collective, as opposed to each individual director, as this is a better indicator of overall Board capability. However, the key skills which individual directors contribute to the Mercury Board are highlighted under each director's profile. Again, this is important for our succession planning.
FY22 has been a transformational year for Mercury, and one of significant activity for Mercury’s Board as a result. As has been discussed elsewhere in this report, the Board considered and approved actions necessary to complete Mercury’s acquisition of Tilt’s New Zealand operations and development options, and Trustpower’s retail business. Mercury also continued to diversify its capital structure, with the successful issue of a new Capital Bond and implementation of a Dividend Reinvestment Plan within the period. Mercury is committed to progressing renewable generation options so that we are well positioned to move forward with developments when market conditions make it Jamespossible.Miller has succeeded Keith Smith as chair of the Risk Assurance and Audit Committee, following Keith’s retirement from the Board. During FY22 we have continued to evolve our approach to identifying, analysing, managing and reporting climate change related risks and opportunities, which are closely linked to both strategy and the business planning process. A cross-functional team from across the business conducted more in-depth scenario analysis.
CAPITAL BOND ISSUANCE

Andy Lark joined the Mercury Board in July 2014. He has a background in entrepreneurship, marketing and digital technologies. Andy is currently the Chair of Group Lark, an accelerant for brand and digital transformations, and Chief Marketing and Strategy Officer for Dubber, a provider of cloud-based call recording and voice AI. Prior roles include Chief Marketing & Online Officer for the Commonwealth Bank of Australia, Chief Marketing Officer for Dell’s Large Enterprise & Public Group, Chief Marketing and Digital Officer for Foxtel, and Chief Business Officer for Xero. Andy is a member of our People & Performance Committee.
Key Skills*: M&A and capital structure; investment analysis; audit and risk management; energy industry.
First Appointed // 2 May 2012
GOVERNANCE AT MERCURY.
Last Elected // 27 September 2019
842022REPORTANNUALMERCURYTHETEAMBEHINDENERGYFREEDOMMENU
First Appointed // 10 July 2014
Key Skills*: Digitisation, disruption and innovation; broad experience in customer facing businesses.
James Miller was appointed a director of Mercury in May 2012. He is Chair of NZX and a director of The New Zealand Refining Company. James was recently appointed as a director of Vista Group International, with effect from 31 August 2021. He has specialist expertise in utility economics and 15 years’ experience in capital markets. James’ prior roles included director and Head of NZ Wholesale Equities with Craigs Investment Partners, and Head of Equities and Head of Research at ABN AMRO. James is a Fellow of the Institute of Finance Professionals and the New Zealand Institute of Chartered Accountants. James is the Chair of our Risk Assurance & Audit Committee, and a member of our Nominations Committee.
First Appointed // 1 September 2021 Last Elected // 23 September 2021 Key Skills*: Energy industry; people leadership; major project investment. Dennis was appointed to the Board with effect from 1 September 2021. He was most recently Chief Executive of Contact Energy, a nine year role during which he led Contact Energy’s investment in renewable energy and flexible generation (including construction of the Te Mihi geothermal power station, the development of the Tauhara field and the introduction in 2011 of the Ahuroa gas storage facility and Stratford peaking plant). Prior to Contact, Dennis held several senior roles at Origin Energy, and guided Origin’s significant and expanding operations in wholesale markets building on the experience in international energy markets he gained from commercial roles at Scottish Power and Scottish and Southern Energy. Dennis holds a BSc(Hons), GradDip (Marketing) and MBA. Dennis is a member of our Risk Assurance & Audit Committee. people leadership. Prue was appointed a Director of Mercury in May 2010 and Chair of the Board in September 2019. Prue is a professional director with experience across a range of industries. She was formerly a commercial lawyer and a partner in the national law firm Russell McVeagh for 20 years. Her expertise included corporate and regulatory matters, corporate finance, capital markets and business restructuring. Prue is a chartered member of the Institute of Directors, and was formerly a director of Chorus Limited, Bank of New Zealand and chair of Queenstown Airport Corporation. Prue is the Chair of our Nominations Committee, and a member of our People and Performance Committee and Risk Assurance & Audit Committee by virtue of her position as Board Chair.
JAMES MILLER // DIRECTOR
*Key Skills are defined as the particular skills each director brings to the Mercury Board, and what we would need to consider replacing when that director retires.
Last Elected // 24 September 2020
ANDY LARK // DIRECTOR
Andy will retire from the Board on 22 September 2022 after over 8 years' service. in February 2020. She is an environmental scientist with a particular interest in sustainable development and resilience. Until January 2020, she was President of the Asia Pacific Region and Global Sustainable Development Leader for Golder, a Canadian global ground engineering and environmental science company. Prior to joining Golder, Hannah was Managing Director of New Zealand environmental consultancy firm Kingett Mitchell. Hannah has extensive background in consulting, management and board roles across various sectors including electricity, construction and water management. Hannah is a member of our Risk Assurance & Audit Committee.
DENNIS BARNES // DIRECTOR
YOUR BOARD OF DIRECTORS.


MIKE TAITOKO // DIRECTOR
First Appointed // 1 February 2014
Last Elected // 24 September 2020 Key Skills*: Energy industry; major project investment; health and safety. Patrick Strange joined the Mercury Board in February 2014. He was previously a director of our company in 2006-2007 before being appointed Chief Executive of New Zealand’s transmission owner and operator, Transpower New Zealand Limited, a position he held for more than six years. Patrick currently chairs Chorus and Auckland International Airport and was previously a Director of NZX Limited and Essential Energy, Australia. Patrick is a member of our Risk Assurance & Audit Committee and Nominations Committee.
First Appointed // 1 May 2021 Key Skills*: Digitisation; experience in customer businesses. Kim is a partner at MinterEllison, specialising in technology consulting. She has a wide range of experience with public and private organisations, across legal, energy and finance sectors, and an extensive background in technology and technology-centric transformation. As a Future Director, Kim is invited to attend Mercury Board meetings and Committee meetings, although she does not participate in decision making.
previous appointments include as an Advisory Board Member and Audit Committee Chair of the Department of Corrections, Board member WREDA, and director and chair of Kordia Group for several years.
First Appointed // 1 September 2017
First Appointed // 28 August 2015 Last Elected // 23 September 2021 Key Skills*: Iwi and other stakeholder relationships; natural resource management (including water and climate change); digitisation. Mike Taitoko was appointed to the Board in August 2015. He is a leading advisor on Māori economic development and has well-established networks in Māoridom. Mike has strong commercial skills in the application of digital technologies and is the co-founder and CEO of Takiwa Limited, a technology company commercialising cloud-based geospatial analytics services. He was formerly a Director of Auckland Tourism Events and Economic Development (ATEED). Mike is a member of our People & Performance Committee.
First Appointed // With effect from 1 September 2022 Key Skills*: Governance; commercial experience; audit and risk management; innovation. Lorraine is an experienced director and business leader with an extensive background in the telco, technology and ICT sectors. Lorraine currently chairs MOVe Logistics Group and Rakon, and is an independent director of Pushpay Holdings. Lorraine has energy sector experience, having been a director of Horizon Energy Lorraine’sGroup.
Last Elected // 24 September 2020
Key Skills*: M&A and capital structure; stakeholder relationships; commercial experience; people leadership. Scott St John joined the Mercury Board in September 2017. He has an extensive background in investment advisory and capital markets. Scott is Chair of Fisher & Paykel Healthcare Corporation and a director of Fonterra Cooperative Group, ANZ New Zealand, and Next Foundation. He was formerly a member of the Capital Markets Development Taskforce and the Financial Markets Authority Establishment Board, and was Chancellor of the University of Auckland. He was the Chief Executive of First NZ Capital from 2002 to 2017. Scott is the Chair of our People & Performance
*Committee.KeySkillsare defined as the particular skills each director brings to the Mercury Board, and what we would need to consider replacing when that director retires.
GOVERNANCE AT MERCURY. 852022REPORTANNUALMERCURYTHETEAMBEHINDENERGYFREEDOMMENU
1. Lorraine was not a director during the reporting period. Lorraine joins the Board on 1 September 2022 and will stand for election at the 2022 ASM in September. KIM GORDON // FUTURE DIRECTOR
LORRAINE WITTEN // DIRECTOR


862022REPORTANNUALMERCURYTHETEAMBEHINDENERGYFREEDOMMENU
Risk Assurance and Audit Committee People and CommitteePerformance NominationsCommittee
This corporate governance statement (comprising pages 83 to 99 of this report) has been prepared in accordance with NZX Listing Rule 3.8.1(a) and was approved by the Board of Mercury NZ Limited on 15 August 2022. The information contained in this corporate governance statement is current as at that date. Some information in the corporate governance statement is expressed to be current at another date, for example the FY22 balance date of 30 June 2022.
Team
CORPORATE GOVERNANCE FRAMEWORK.
GOVERNANCE AT MERCURY. At Mercury, we are committed to the highest standards of corporate governance. Our corporate governance framework includes robust policies and processes which are fundamental to all of Mercury’s foundational pillars. At the heart of this framework is our commitment to protect and enhance the interests of our owners through the highest standards of governance, business behaviour and transparency. Our corporate governance framework underpins the maintenance of strong relationships with our stakeholders and our ability to create long-term value. It also ensures Board accountability to our shareholders and provides for an appropriate delegation of responsibilities to our people. The Board regularly reviews our corporate governance policies and practices to ensure compliance with NZX and ASX standards (Mercury is an ASX Foreign Exempt Listed company) as well as reflecting positive contemporary corporate governance trends in New Zealand and Australia. Over the reporting period, our corporate governance practices were in substantial compliance with the NZX Corporate Governance Code. The only exceptions relate to Recommendation 3.3 (Remuneration Committee), where the governance of remuneration at Mercury is split between the People and Performance Committee for executive and general remuneration, and the Nominations Committee for director remuneration (this exception is fully explained later in this statement); and Recommendation 8.5 (Notice of Meeting), where our 2021 Notice of Meeting was posted on our website later than anticipated in order to allow time to consult with stakeholders on the subject matter of the Notice of Meeting. While not required due to our ASX foreign-exempt listing status, we also endeavour to comply with ASX Corporate Governance Principles and Recommendations (fourth edition). We consider that governance at Mercury generally aligns with the BlackRock Investment Stewardship Global Principles published in January 2022 and we disclose against the framework set out by the Financial Stability Board Taskforce on Climate Related Financial Disclosures (see the TCFD Report). We consider our practices and procedures substantially reflect the guidelines and principles from the International Corporate Governance Network (ICGN) Global Governance Principles and the Organisation for Economic Cooperation and Development (OECD).
MERCURY PEOPLE MERCURY BOARD
ExecutiveChiefShareholdersExecutiveManagement
• managing business risk
Risk and Audit • ensuring that effective audit, risk management and compliance systems are in place and monitored to protect Mercury’s assets and to minimise the possibility of Mercury operating beyond legal or regulatory requirements or beyond acceptable risk parameters as determined by the Board
• establishing clear strategic goals with appropriate supporting business plans and resources
Future Directors are invited to attend Mercury Board meetings and Committee meetings, although they do not participate in decision making. Structure The Board is structured to ensure that as a collective group it has the skills, experience, knowledge, diversity and perspective to fulfil its purpose and responsibilities. The Board’s responsibilities are set out in Mercury’s Board Charter.
Chief Executive and EMT performance are reviewed regularly against objectives and measures set by the Board in annual performance scorecards. The Chief Executive’s and each EMT member’s performance were evaluated during the reporting period on this basis. Further details are contained in the Remuneration Report. AT MERCURY.
• the day-to-day management of Mercury
The Board’s responsibilities are set out in the Board Charter, which is reviewed at least every two years, and include:
GOVERNANCE
• ensuring Mercury adheres to high standards of corporate behaviour, responsibility and ethics
• developing and making recommendations to the Board on Mercury strategies and associated initiatives
RESPONSIBILITIES
The Board is responsible for Mercury’s strategic direction and operation and has delegated certain responsibilities to the Chief Executive and the Executive Management Team (EMT). Our Board is committed to the highest standards of governance, corporate behaviour and accountability, and creating long-term value for investors. BOARD.
All of Mercury’s directors are considered by the Board to be “independent” directors, in that they are non-executive directors who are not substantial shareholders and who are free of any interest, business or other relationship that would materially interfere with, or could reasonably be seen to materially interfere with, the independent exercise of their judgement. No director has been employed or retained, within the last three years, to provide material professional services to Mercury. Within the last 12 months, no director was a partner, director, senior executive or material shareholder of a firm that provided material professional services to Mercury or any of its subsidiaries. No director has been, within the last three years, a material supplier to Mercury or has any other material contractual relationship with Mercury or another group member other than as a director of Mercury. No director receives performance-based remuneration from, or participates in, an employee incentive share scheme of Mercury. No director controls, or is an executive or other representative of an entity which controls, 5% or more of Mercury’s voting securities. The Chief Executive is not a director of Mercury.
The Chief Executive and EMT have appropriate employment agreements setting out their roles and conditions of employment.
TheCHARACTERISTICSBoard
872022REPORTANNUALMERCURYTHETEAMBEHINDENERGYFREEDOMMENU
• decision making compatible with Mercury’s Delegations Policy
Financial Performance and Integrity
• formulating and implementing policies and reporting procedures for management
Ethics and Corporate Behaviour
• monitoring financial performance and the integrity of reporting Executive Authority • setting delegated authority levels for the Chief Executive and EMT
• managing and implementing strategies approved by the Board
MERCURY’S
INDEPENDENCE & CONFLICTS
• monitoring strategy implementation
The Chief Executive and EMT are responsible for:
Environmental and Health & Safety
BOARD COMPOSITION &
• ensuring Mercury’s environmental and health and safety culture and practices comply with all legal requirements, reflect best practice in New Zealand and are recognised by employees and other stakeholders as key priorities
Strategy and Planning
The Board comprises eight directors: Prue Flacks (Chair), Dennis Barnes, Hannah Hamling, Andy Lark, James Miller, Scott St John, Patrick Strange and Mike Taitoko. Kim Gordon is Mercury’s current Future Director. Lorraine Witten will be joining the Board as a director from 1 September 2022. Andy Lark steps down from the Board on 22 September 2022 after 8 years' service. A brief profile of each director is available here Chair Prue Flacks is the Chair of the Board. First appointed as a director in 2010, she was appointed as Chair in 2019. Prue is an independent, non-executive director. The Chair’s overarching responsibilities are to provide leadership to the Board and to ensure the Board is well informed and effective. More information about the role of the Chair is contained in the Mercury Board Charter (found on the Corporate Governance section of our website). Future Director The Institute of Directors’ Future Directors Programme provides people with governance potential and ambition with mentorship and the opportunity to participate on a board. It aims to increase the next generation of boardready directors in New Zealand. The Mercury Board is a supporter and active participant in the programme, with Kim Gordon (the current Future Director) the fourth such appointee to the Mercury Board.
It is essential to Mercury that directors commit sufficient time to prepare and perform their duties properly and effectively. The Board has considered this issue during the reporting period and is satisfied that, taking into account all of their commitments, each director had sufficient time to perform their duties for Mercury.
The Board receives regular briefings on Mercury’s business operations from senior managers. Regular Board strategy days are held to consider matters of strategic importance to Mercury, and Board and management run scenario thinking sessions for key issues. Visits to Mercury’s facilities keep the Board informed of Mercury’s assets and operations and in particular with respect to health and safety and wellness matters.
All new directors participate in a comprehensive induction programme to familiarise them with Mercury’s business and the electricity industry.
INDUCTION & DEVELOPMENT
GOVERNANCE AT MERCURY.
882022REPORTANNUALMERCURYTHETEAMBEHINDENERGYFREEDOMMENU
SELECTION, NOMINATION & APPOINTMENT
The Board and Nominations Committee carry out appropriate due diligence before appointing a director or nominating a candidate for election as a director in accordance with our governance processes. Mercury has a written agreement with each director set out in a letter of appointment containing the terms and conditions of their appointment. A copy of the standard form of this letter is available in the Corporate Governance section of our website. In addition, Mercury also enters into deeds of indemnity and insurance with each director, in terms of which Mercury indemnifies and provides insurance to, directors in accordance with the Companies Act 1993.
All directors are elected by Mercury’s shareholders (other than directors appointed by the Board to fill casual vacancies, who must retire and stand for election at the next meeting of shareholders) with rotation and retirement determined in line with the NZX Listing Rules. The Board is responsible for considering and appointing directors to the Board after candidates have been identified by the Nominations Committee (see Board Committees).
The Board effectiveness enhancement programme, introduced during FY21, continued during this reporting period. The programme involves both deep-dives into aspects of Mercury’s business, and sessions focusing on the broader environment including future trends and innovation. Directors are also encouraged and supported to continue their own professional development through individual learning opportunities.
Governance & risk management
committeeFinance/accounting/auditexperience
Significant commercial experience across different industries and economic cycles
Strategy & risk settings Stakeholders
In order to enable Mercury to achieve its strategic goals, the Board strives to include an effective combination and diversity of skills, backgrounds and experiences of the individual directors. The Board also focuses on ensuring that its culture reflects Mercury’s values, to foster alignment with the wider business. Through the Nominations Committee, the Board assesses its skills and competencies in the context of key outputs required, including: • setting risk parameters for both value creation and value protection • cultural leadership to reflect our values, environmental kaitiakitanga and social licence to operate • strategy development in an environment of disruption, requiring the courage to challenge, resilience and agility to respond
M&A and capital structure experience
Iwi connectivityrelationships/ People leadership Health and safety experience
Governance experience, including listed companies
During the reporting period, the Nominations Committee has considered and reviewed the skills of the Board and updated the Board skills matrix.
Risk management process and experience, including cyber security and climate related Digitisation, disruption and innovation in energy and other sectors
Wholesale markets trading (energy and/or other commodities) KEY SubstantialSomeMedium
Customer relationships, including vulnerable customers
BOARD SKILLS MATRIX
Retail Understanding key drivers of value in a customer facing business, through governance or operational experience
892022REPORTANNUALMERCURYTHETEAMBEHINDENERGYFREEDOMMENUTHETEAMBEHINDENERGYFREEDOM GOVERNANCE AT MERCURY.
Major project investment and experience Government relationships
communityShareholder/investmentrelationships
Skill & Experience Category Combined Board Skill & Experience Category Combined Board Skill & Experience Category Combined Board
Energy industry Climate Change and natural resource (includingmanagementwater) Energy experienceindustry Large leadershiporganisationexperience
Recognising that how well the Board performs is a function of the skills and experience of individual directors and how the directors work together as a whole, it is considered that addressing the level of skills and experience collectively is a better indicator of Board capability overall. Although the Board fosters collaborative and open discussion and each director is expected to contribute broadly, the key skills which individual directors contribute to the Mercury Board are indicated in the Director Profiles. The purpose of identifying key skills at an individual level is to signal the skills which would need to be considered when a director retires. This is important for succession planning purposes.
28 August 2015 23 September 2021 GOVERNANCE AT MERCURY.
The Board has three standing committees: the Risk and Assurance & Audit Committee (RAAC), the People and Performance Committee and the Nominations Committee. Each Committee focuses on specific areas of governance. Together, they strengthen the Board’s oversight of Mercury. Committee meetings are scheduled to coordinate with the Board meeting cycle. Each Committee reports to the Board at the subsequent Board meeting and makes recommendations to the Board for consideration as appropriate.
BOARD COMMITTEES
REVIEWING PERFORMANCE
Director Originally Appointed Last ElectedReappointed/ Prue Flacks (Chair) 1 May 2010 23 September 2021 Dennis
1 September 2021 23 September 2021 Hannah Hamling 1 February 2020 24 September 2020 Andy Lark 10 July 2014 24 September 2020 James Miller 2 May 2012 27 September 2019 Scott St John 1 September 2017 24 September 2020 Patrick Strange 4 February 2014 24 September 2020
902022REPORTANNUALMERCURYTHETEAMBEHINDENERGYFREEDOMMENU
Mike Taitoko
As an exception to the NZX Corporate Governance Code, Mercury does not comply with Recommendation 3.3 because it does not have a separate remuneration committee. This exception has been approved by the Board. The functions that would ordinarily be allocated to a remuneration committee are shared between the People and Performance Committee in respect of the Chief Executive and the EMT, and the Nominations Committee in respect of the directors. An overview of the role and responsibilities, membership and meetings of the Board’s three standing Committees during the reporting period is provided in the table on the next page. Barnes
The performance of the directors (individually and collectively), and the effectiveness of Board processes and committees, are regularly evaluated using a variety of techniques including external consultants, questionnaires and Board discussion. A performance review by an external facilitator was carried out during the reporting period. A performance review led by the Chair will be carried out during the calendar year 2022. TENURE Mercury notifies shareholders of their right to nominate a candidate for election as a director by notice on the NZX and ASX. Where any director election or re-election is to occur at a shareholder meeting, the Notice of Meeting includes all information on candidates for director election or reelection that the Board considers may be useful to shareholders. Directors must retire every three years and, if desired, seek re-election. The Mercury Board takes director tenure into account in considering the independence of directors. 0-3 YEARS 3-6 YEARS 6+ YEARS
James Miller, having served for three years since his last re-election, will retire at the September 2022 ASM and stand for re-election in accordance with the NZX Listing Rules.
• recommending to the Board an annual evaluation process of the Board and its committees
• developing, maintaining and recording an assessment of the skills, experience and knowledge of directors
Members as at 30 June 2022: • Prue Flacks (Chair)
•
• recommending induction and continuing education for directors
• ensuring that appropriate checks are undertaken before recommending individuals be appointed
• James Miller • Patrick Strange
Meetings At least three times annually. During the reporting period, the Committee met four times. At least three times annually. During the reporting period, the Committee met five times. At least annually. During the reporting period, the Committee met twice.
912022REPORTANNUALMERCURYTHETEAMBEHINDENERGYFREEDOMMENUPeople & Performance Committee Risk Assurance & Audit Committee Nominations Committee Roles responsibilitiesand Assisting the Board to fulfil its People and Performance responsibilities relating to: • Mercury’s People and Performance strategy and plan • review of inclusion and diversity objectives and progress against objectives • the remuneration and performance of the Chief Executive and EMT • People and Performance policies and practices Monitoring and providing guidance to management on People and Performance related matters. Overseeing, reviewing and advising the Board on Mercury’s: • risk management policy and processes (which include oversight of Health & Safety assurance and climate-related risks and opportunities) • internal control mechanisms and internal and external audit functions • compliance with policies and processes • financial information prepared by management for publication Management retains responsibility for the implementation and operation of adequate risk assurance, internal control and audit systems. The Board has delegated to the RAAC the authority to oversee and monitor these activities. Providing assurance that the Board has the skills, experience, knowledge, diversity of thought and perspective to comply with the law, high standards of governance and achieve Mercury’s strategic
• Scott St John (Chair)
•Inobjectives.particular:identifying, for the Board to consider, people with the necessary expertise, experience, diversity and perspectives for selection as potential directors to be nominated for election at the next annual shareholder meeting or to fill a casual vacancy on the Board ensuring that succession plans are in place for the continued effective composition and expertise of the Board
Membership At least three directors, the majority of whom must be Membersindependent.asat 30 June 2022:
• Mike Taitoko Prue Flacks is also a member by virtue of her position as Board Chair. At least three directors, each of whom must be independent nonMembersexecutives.as at 30 June 2022: • James Miller (Chair) • Hannah Hamling • Patrick Strange • Dennis Barnes Prue Flacks is also a member by virtue of her position as Board Chair. The Board Chair is not eligible to Chair the Committee. At least one member must have an accounting or financial background as that term is described in the NZX Listing Rules. At least three directors, the majority of whom must be independent.
• developing and maintaining a record and assessment of the skills, experience and knowledge of directors
• reviewing director nominations from shareholders
• Andy Lark
GOVERNANCE AT MERCURY.
• recommending to the Board any proposal relating to director remuneration to be put to shareholders
Each standing Committee operates in accordance with a written Charter approved by the Board and reviewed as required and at least every two years. The Committee Charters are available in the Corporate Governance section of our website.
ACCESS TO ADVICE & COMPANY SECRETARY Directors may access such information and seek such independent advice as they consider necessary or desirable, individually or collectively, to fulfil their responsibilities and permit independent judgement in decision making. They are entitled to have access to internal and external auditors without management present and, with the Chair’s consent, seek independent professional advice at Mercury’s expense. All directors have access to the advice and services of the Company Secretary for the purposes of the Board’s affairs. The Company Secretary is appointed on the recommendation of the Chief Executive and must be approved by the Board. The Company Secretary is accountable to the Board, through the Chair, on all governance matters. As at the date of this Corporate Governance Statement, Howard Thomas is the Company Secretary.
922022REPORTANNUALMERCURYTHETEAMBEHINDENERGYFREEDOMMENU
ADDITIONAL COMMITTEES
DIRECTORS’ MERCURY SHAREHOLDINGS
Mercury assesses on a regular basis whether additional standing or ad hoc committees are required. Additional temporary committees are established from time to time, including as required to provide governance oversight on short-term projects. As at the date of this statement, Mercury has considered that no other standing committees are required.
GOVERNANCE AT MERCURY.
The Board encourages the alignment of directors’ interests with those of shareholders and with Mercury’s strategic aims. To improve this alignment, the Board encourages directors to accumulate meaningful shareholdings in Mercury. Further details of directors' shareholdings in Mercury are set out in Directors' Disclosures
COMMITTEE CHARTERS
932022REPORTANNUALMERCURYTHETEAMBEHINDENERGYFREEDOMMENUTHETEAMBEHINDENERGYFREEDOM
The Board has appointed the Company Secretary as the Disclosure Officer who is responsible for administering the Policy. The Disclosure Committee (made up of the Board Chair, RAAC Chair, Chief Executive, Chief Financial Officer and Disclosure Officer) is responsible for ensuring that Mercury complies with its disclosure obligations.
INTERNAL AUDIT & RISK ASSURANCE
The RAAC meets with the Internal Auditor at least once each year without management present. During FY22, the focus of the RAAC was compliance (regulatory), financial (growth and climate) and people, which were trending or elevated risks for the Group.
TIMELY & ShareholdersDISCLOSUREBALANCED&Markets
Operational Risks
OUR KEY RISKS Climate Change Risks
Mercury undertakes activities that potentially involve significant safety risks including electrified assets, handling of iso-pentane, steam field operations, well drilling, operating large generation equipment, dam safety, power station construction and medically dependent customer management. A key risk for Mercury is that an incident occurs causing a fatality or serious injury to our staff, a contractor, a customer or the public.
Compliance Risks
Legislative & regulatory changes
Fuel security & supply Mercury’s generation depends upon the availability of water for hydro generation, wind for wind generation, and geothermal fluid for geothermal generation. The principal risks include the inability to generate expected levels of electricity due to RISK.
GOVERNANCE AT ASSURANCEMERCURY.& MANAGING
For details of our key climate-related risks and how we are managing them – please see our TCFD Report Safety Risks
The Chief Executive and the Chief Financial Officer are required each half year and full year to provide a letter of representation to the Board confirming that the financial statements have been prepared in accordance with legal requirements, comply with generally accepted accounting practice, and present fairly, in all material respects, the financial position of Mercury and the results of its operations and its cash flows. A letter of representation confirming those matters was received by the Board with respect to the Group’s FY22 financial statements. We report on non-financial information in our Annual Report. Material environmental, social and governance matters are covered in the report, corporate governance statement and the TCFD Report. To provide this information in a format accessible to our stakeholders we use both the Global Reporting Initiative (GRI) standards and the International Integrated Reporting Council (IIRC) Integrated Reporting <IR> framework. We do not currently have a policy on assurance of nonfinancial data.
Regulatory changes imposed on the current wholesale and retail market structure and pricing regimes may affect how Mercury is managing its integrated business model of generating and retailing electricity and could adversely impact on Mercury’s ability to create value. Legislative or regulatory changes, including Treaty of Waitangi claims, changes to consent conditions, or levies on the use of natural resources, may result in Mercury facing direct or indirect restrictions, conditions or additional costs on Mercury’s access to freshwater or geothermal resources and its hydro, wind and geothermal generation activities.
Mercury has a comprehensive internal audit plan and risk assurance plan, which take a holistic view of Mercury’s culture, practices and procedures and include periodic reviews of relevant areas of Mercury’s operations. The internal audit plan is designed and approved by the RAAC each year in consultation with the Risk Assurance Officer and the Internal Auditor (currently made up of an internal team, Deloitte and other internal audit and process specialists appointed on an outsourced basis) who report on progress and the results of internal audit reviews at each RAAC meeting. The Internal Auditor has access to management and the right to seek information and explanations.
AUDIT PLAN & ROLE OF AUDITOR
The Chief Executive and EMT are responsible for providing the Disclosure Officer with all material information relating to their areas of responsibility. Information which, in the opinion of the Disclosure Officer, may require disclosure is provided to the Disclosure Committee for decision. Disclosures relating to the annual and interim financial statements must be reviewed by the RAAC before being approved by the Board. Once approved for disclosure, the Disclosure Officer is responsible for releasing material information to the Directorsmarket.consider at each Board meeting whether there is any material information which should be disclosed to the market. Integrity of Reporting
As a public entity under the Public Audit Act 2001, Mercury and each of our subsidiaries (together, the ‘Group’) have the Auditor-General as our independent auditor. The Auditor-General appointed Lloyd Bunyan of Ernst & Young to carry out the FY22 audit on his behalf. The NZX Listing Rules require rotation of the key audit partner at least every five years. The provision of external audit services is guided by the Audit Independence Policy available on the Corporate Governance section of our website. Consistent with the Stakeholder Engagement Policy, the external auditor attends the Annual Shareholders’ Meeting and is available to shareholders to answer questions relevant to the audit.
Mercury is committed to maintaining a fully informed market through effective communication with the NZX and ASX, our shareholders and investors, analysts, media and other interested parties. Mercury provides all stakeholders with equal and timely access to material information that is accurate, balanced, meaningful and consistent. Where Mercury provides a new and substantive investor or analyst presentation, it ensures the presentation materials are released to the NZX and ASX ahead of the Thepresentation.MarketDisclosure Policy is designed to ensure this occurs in compliance with Mercury’s continuous disclosure obligations under the NZX Listing Rules. The Policy is available in the Corporate Governance section of our website.
• competitor behaviour
Growth & Development
• health and safety incidents under the operational control of Mercury
Growth and development projects are subject to risks that may affect expected financial returns or •outcomes:majorgeneration development projects during construction give rise to risks including cost over-runs, commissioning delays, environmental impacts and employee/ contractor safety • political and regulatory uncertainty and poor economic conditions may limit our development choices or adversely affect the viability or costs of future developments. Other A deterioration of our financial condition or instability in capital markets could increase our cost of capital, affect our ability to raise debt, or reduce our cash liquidity thereby impacting our financial performance and pursuit of our strategic Theobjectives.Crown’s shareholding and the provisions of the Public Finance Act may limit our ability to raise equity capital. There is a risk that foreign currency or interest rate movements may impact our earnings by increasing the cost for imported goods and services and the cost of debt.
• significant reduction or ceasing of electricity consumption (for example the New Zealand Aluminium Smelter or other large industrial companies)
• short-term changes in supply and demand
• national fuel availability based on hydrological and thermal conditions (including extended national drought)
Insurance Mercury is insured through a comprehensive programme including cover for generation property, plant and equipment and business interruption with a combined limit of $1 billion. Some catastrophic events are uninsurable, or we have chosen not to insure against them as the cost of cover is prohibitive. In the event of a severe catastrophic event, it is possible that the insurance portfolio will not provide sufficient cover, impacting future operational performance and the financial condition of Mercury. We estimate that the maximum foreseeable loss to which the Group could potentially be exposed is approximately $9 billion with an assessed likelihood of occurrence of 1 in 100,000 years. We review the level and nature of our insurance cover annually. From 1 November 2020, following a third-party risk tolerance analysis which considered several key financial metrics specific to Mercury, the decision was made to retain additional financial risk in the event of an insurable loss to our generation assets.
Financial Risks
• constrained transmission and distribution of electricity In the long run, wholesale prices are determined by the level of national demand relative to supply from power generation and can be affected by levels of activity in the industrial sector, population size, economic conditions, competitor behaviour, generation build or retirement, technological changes or new sources of energy, and regulatory changes. We could also be adversely affected if a large group of customers, one or more major customers, or a New Zealand market participant were to default on payment for electricity provided or for hedge settlements.
GOVERNANCE
• errors by directors, management, contractors or related industry operators negatively reflecting on Mercury • adverse environmental impact caused by, or perceived to be caused by, Mercury’s operations
Other material business risks that could impact on the short-, medium- or long-term financial performance of Mercury (including material exposure to economic, environmental or social sustainability risks) include: political, regulatory, foreign exchange, accounting and other international jurisdiction risks; and catastrophic events (including dam failure causing inundation and significant reinstatement time). AT MERCURY.
Electricity market exposure
Power station availability
Reputational Risks
• errors in customer connections, billing or general customer communications
942022REPORTANNUALMERCURYTHETEAMBEHINDENERGYFREEDOMMENUeither temporarily or permanently reduced fuel supplies, loss of access to supply, or increased costs to secure the necessary fuel, all of which may adversely affect Mercury’s earnings.
Our ability to generate electricity depends upon the continued efficient operation of our power stations. The viability, efficiency or operability of our power stations could be adversely affected by a range of factors including: • material failure of turbines, transformers, or geothermal wells that results in unplanned power station outages which require replacement or repair • events, such as a global pandemic, impacting on key people required to operate stations, provide hydro control or trading oversight
• a reduction in standards of how we treat the communities that we operate in Other Material Risks
Our reputation with investors, stakeholders and the broader community is one of our most significant assets. In addition to the risks mentioned elsewhere in this statement, the following events could threaten that reputation and could lead to negative publicity resulting in the loss of business revenues or reduction in Mercury’s value:
Side C cover, which insures the company against liabilities arising out of securities market conduct breaches, was also removed from our directors’ and officers’ insurance policy.
In the short run, our ability to manage our electricity portfolio risk depends upon its ability to purchase and sell electricity in the wholesale electricity market which could be impacted by:
• catastrophic events such as a major earthquake, volcanic eruption, or other natural catastrophes that could cause failure of one or more of our power stations Information security We depend on several key systems for our continued operations. There is a risk that the security of critical systems will be compromised and/or information accessed, deleted or corrupted, impacting on our ability to operate critical systems. Such an event could result in costs to resolve or repair; potential downtime of operations; potential breaches of our customers’ privacy, including unauthorised access to their personal information; and reputational impacts from any loss of service, or resulting impacts on safety, our environment or community.
FUNCTIONSBUSINESSGOVERNANCE communicatesEstablishes,andimplementsriskmanagementOversees ofimplementationframeworktheMonitorsframeworkandtestscontrols Manages day to day risks and controls All ManagementBusinessUnitsRiskCommitteeRiskCommittee&AssuranceAuditRiskAssuranceOfficer
Constitution, and relevant Charters and Policies are available in the Corporate Governance section of Mercury’s website.
952022REPORTANNUALMERCURYTHETEAMBEHINDENERGYFREEDOMMENU
We have a Risk Assurance Officer who has the independence to determine the effectiveness of risk management, assurance and internal audit. The Risk Assurance Officer has a dual reporting line to the Chief Financial Officer and the RAAC Chair. The RAAC tasks the Risk Assurance Officer to ensure healthy and robust debate and interaction between management, risk assurance and audit providers. Our management operates a Risk Management Committee whose mandate is to promote risk awareness and appropriate risk management to all employees and to monitor and review risk activities as circumstances and our strategic and operational objectives change. Membership of the Risk Management Committee is made up of representatives from the Executive Management Team and is chaired by the Chief Executive. The Risk Management Committee meets at least four times each year. In addition to these risk management processes several measures are employed to manage risks, including employee awareness, incident training, due diligence, financial risk mitigation tools, active involvement in the regulatory environment and established whistle blower policy and procedures. As noted above, the RAAC is responsible for overseeing, reviewing and providing advice to the Board on Mercury’s risk management policies and processes. The Risk Assurance Officer reports regularly to the RAAC on the effectiveness of our management of material business risks. In addition, the RAAC annually reviews the risk management framework. The last review of the risk management framework took place in Mercury’sFY22.
current Risk Appetite Statement, Mercury targets a long term credit profile of bbb on a stand-alone basis from S&P Global (or its equivalent).
RISK MANAGEMENT FRAMEWORK & RAAC RESPONSIBILITIES Risk management is an integral part of our business. We have an overarching Risk Management Policy in place (available in the Corporate Governance section of our website) supported by a suite of risk management policies appropriate for our business, including Risk Appetite Statement, the Mercury Code, an Energy Markets Risk Management Policy, a Treasury Policy and a Delegations Policy. The purpose of the Risk Management Policy is to embed a comprehensive, holistic, Group-wide capability in risk management which provides a consistent method of identifying, assessing, controlling, monitoring and reporting existing and potential risks to our business and to the achievement of its plans. The Policy sets out the risk management objectives and requirements of Mercury within which management is expected to operate. The Policy applies to all business activities of the Group including Mercury-controlled joint ventures and is reviewed annually by the RAAC and approved by the Board. The risk management framework supports a comprehensive approach to risk, encompassing financial, strategic, environmental, operational, regulatory, reputational, social and governance risks. This includes assessing and managing climate-related Therisks.framework involves actively identifying and managing risk and taking measures to reduce the likelihood of risk, contain potential hazards and take mitigating action to reduce impacts in line with risk tolerances. This approach is consistent with the precautionary principle. We must accept some risks to achieve our strategic objectives and to deliver shareholder value. These are embodied in our Risk Appetite Statement which are set and regularly reviewed by the Board. As part of the GOVERNANCE AT MERCURY.
• Be Curious and Original Our Mercury Attitude aligns our direction to achieve our Purpose. THE MERCURY CODE & OUR POLICY FRAMEWORK
The Mercury Code, which was adopted and is regularly reviewed by our Board, is our version of a code of conduct and ethics. The Mercury Code underpins everything we do. It requires all Mercury people, including directors and employees, to act honestly and with integrity and fairness at all times, and to strive to foster those standards within Mercury. The Mercury Code is available in the Corporate Governance section of our website.
ENGAGING WITH INVESTORS. ACTING ETHICALLY & RESPONSIBLY.
GOVERNANCE
ANNUAL SHAREHOLDERS’ MEETINGS & WEBCASTS ASMs are held in New Zealand at a time and location which aim to maximise participation by shareholders. Mercury’s tenth ASM since listing on the NZX Main Board and ASX will be held in Auckland on 22 September 2022. As at the date of this statement, preparations are well underway for our ASM that will be held in a hybrid format (in person and on line) for the first time. This approach is considered by the New Zealand Shareholders’ Association as the most effective approach to enable meaningful shareholder participation.
At Mercury, all our people strive to do what’s right. We have put in place the Mercury Code to ensure that our people know what the ‘right thing to do’ is. The Mercury Code documents the behaviours we require to embed and sustain our culture to successfully deliver our strategy and achieve our Purpose of inspiring New Zealanders to enjoy energy in more wonderful ways.
The Mercury Code and the policy framework described below support our promises to each other and define our commitment to our customers, our people and community and our Directorsinvestors.arerequired, in the performance of their duties, to give proper attention to the matters before them and to act in the best interests of Mercury at all times. We also want to ensure that we work with suppliers who share our commitment to acting ethically and doing the right thing. Our Supplier Code of Conduct describes the way we work with our suppliers and what we expect in return. The Supplier Code of Conduct includes our commitments and our expectations in relation to social responsibility, health and safety, compliance with all applicable modern slavery laws, environmental responsibility, and business integrity.
The Supplier Code of Conduct is available in the Corporate Governance section of our website. The areas set out in the table on the next page are of fundamental importance to Mercury to ensure good governance and responsible business practices are followed.
962022REPORTANNUALMERCURYTHETEAMBEHINDENERGYFREEDOMMENU
OUR INVESTOR RELATIONS PROGRAMME We are committed to open and effective communication with our stakeholders and owners by providing comprehensive relevant information. Mercury takes the steps set out in our Stakeholder Engagement Policy to achieve Mercurythis.communicates with its investors in various ways, including the Investor section of our website, annual shareholders’ meetings (ASM) and webcasts, our annual and interim reports, regular information disclosures, and analyst and investor briefings and road shows. Mercury aims to provide clear communication of our strategic direction, including articulating our strategic priorities and how these leverage Mercury’s competitive advantages. We also run a programme to build understanding and appropriate measurement of Mercury’s performance among investors and research analysts. That programme aims to be responsive, clear, timely, consistent, evenhanded and accurate, and is designed to ensure appropriate access to management and directors. Summary records of the issues discussed at meetings with investors and analysts are kept for internal use, unless a recording or transcript of the presentation is published on our website. WEBSITE Mercury’s website contains a comprehensive set of investor- related information and data including stock exchange and media releases, interim and annual reports, investor presentations and webcasts, and shareholder meeting materials. Mercury will continue to build environmental, social and governance (ESG) website content to meet the increasing demand for transparent disclosures of its performance across these areas and the management of long-term risks and opportunities. Shareholders can direct questions and comments to Mercury through the website or contact investor@mercury.co.nz.
ELECTRONIC COMMUNICATIONS
We encourage shareholders to provide email addresses to enable them to receive shareholder materials electronically. Communicating electronically is faster and more costeffective. Most of our shareholders receive information electronically. However, we understand that this does not suit everyone and we also provide hard copy reports to shareholders who wish to receive them AT MERCURY.
MERCURY ATTITUDE A Mercury employee is expected to apply the Mercury Attitude. This attitude shapes our decisions, our actions and our interactions with each other.
• Commit and Own it • Share and Connect
The Chief Executive and EMT members are prohibited, by the Trading in Company Securities Policy, from entering into transactions in associated products which limit the economic risk of participating in unvested entitlements under Mercury’s Long-Term Incentive Plans.
Ourframework.General Counsel is Mercury’s Privacy Officer and is responsible for implementing our Privacy Policy, promoting awareness of privacy matters, monitoring matters on a day-to-day basis, and escalating matters as required to our Chief Executive, with notification to our Risk Management Committee. Privacy issues are reported to the Risk Management Committee on a quarterly basis. We also have a Group Information Security Manager who is responsible for ensuring that appropriate systems and processes are in place for the storage and security of personal information.
972022REPORTANNUALMERCURYTHETEAMBEHINDENERGYFREEDOMMENU
Mercury’s Trading in Company Securities Policy sets out the rules and restrictions relating to trading in Mercury securities by directors and employees and contractors, including the prohibition on insider trading.
Conflicts of interest must be avoided, except with the prior consent of Mercury. Mercury people are encouraged to discuss possible conflicts with their manager. Mercury takes practical, preventative action wherever possible, for example by substituting project managers in circumstances of possible conflict with contractors and suppliers. Our directors declare all potential conflicts of interest prior to appointment and if applicable, at each Board meeting in relation to specific agenda items. Bribery
Environmental Our Environmental Policy recognises that our generation activities rely on access to natural resources that we know are highly valued by our communities. We strive to maintain this trust by working with partners to deliver renewable electricity and make a long-term difference New Zealand’s environmental health.
Market Disclosures
We have adopted a Takeover Response Policy to guide the Board and management if the Company receives a takeover notice or the Company becomes aware that a takeover offer in respect of the Company (or an analogous scheme of arrangement) is, or is likely to be, proposed by another person.
Whistleblowing
We work responsibly to deliver today and sustainably for future generations and will achieve this by focussing on: Kaitiakitanga, challenging our performance, promoting awareness, complying with requirements, and setting objectives and targets.
The Mercury Code places restrictions on the use of corporate information, assets and property. All persons covered by the Mercury Code are encouraged to report any breach or suspected breach of the Code.
The Mercury Code, Modern Slavery Statement, and all Policies referred to in the table above are available on the Corporate Governance section of our website.
Our Market Disclosure Policy ensures we maintain a fully informed market through communication with the markets, investors and stakeholders and by giving them equal and timely access to material information.
Privacy We are committed to the safeguarding and proper use of personal information. We have a comprehensive Privacy Policy, which is reviewed every two years, and a robust privacy framework. Privacy is afforded significant consideration within Mercury and is managed in accordance with our risk management
Our Governance & Responsible Business Practices
The Policy is closely monitored by the Company Secretary and is overseen by the RAAC.
GOVERNANCE AT MERCURY.
Since 2018, Mercury has been developing transparent sustainability reporting in line with the framework set out by the Financial Stability Board Taskforce on Climate Related Financial Disclosures (TCFD). In this report, we have disclosed against this framework, including disclosure of Mercury’s actual and potential impacts of climate-related risks and opportunities on Mercury’s business, strategy and financial planning; and extensive reporting on Mercury’s carbon position. Refer to the TCFD Report.
We provide a framework for the protection of employees wishing to disclose serious wrongdoing. This is described in Mercury’s Whistleblowing Policy. Employees are also encouraged to voice with their manager, the HR team, the General Counsel, other managers or directors any concern over ethical or irresponsible behaviour, even if not reaching the threshold of serious wrongdoing.
Use Mercuryof Assets
Modern Slavery
SustainabilityIntegrated Our Integrated Sustainability Policy sets out the core principles and values that promote ethical and responsible decision making. We recognise that our success in creating long-term value for our shareholders (including our operational and financial results) depends on maintaining confidence in: how the Company acts and conducts its business; our approach to managing natural resources and meeting environmental standards; our health and safety culture and practices; the service we provide for our customers; the employment experience we offer our people; the relationships we have with our business partners and the communities within which we operate; and broader measures of economic, environmental and social performance.
During the reporting period we prepared and reported our Modern Slavery Statement in line with our obligations under the Australian Modern Slavery Act 2018. Our statement outlines the work undertaken during FY21 to assess and address the risk of modern slavery in our operations and supply chain and identified the following key focus areas for FY22: identifying and engaging with strategic suppliers on modern slavery risks in supply chains, utilising recently developed procurement guidelines and commercial procurement plan to encourage and improve consideration of sustainability and ethical supply, and a continued focus on improving our spend visibility.
Conflicts
TCFD and Carbon Reporting
Trading CompanyInSecurities
Under the Policy, we commit to integrating sustainability through principles relating to our five-pillar strategy: Customer, Partnerships, Kaitiakitanga, People, Commercial.
Takeover Response Policy
The acceptance of bribes, including gifts or personal benefits of material value which could reasonably be perceived as influencing decisions, is prohibited under the Mercury Code. Under Mercury’s Delegations Policy, donations to political parties are prohibited.
Our Governance & Responsible Business Practices
• pursue diversity of our workforce at all levels;
• attract and retain a talented workforce through increasing the diversity of the candidate pool and maintaining a recruitment strategy that is attractive to all candidates. Our diversity and inclusion strategic objectives are to lift the diversity of our workforce at all levels and raise awareness of diversity and inclusion across the organisation to build our inclusive leadership and culture. We aim to deliver on these objectives through activity in five focus areas:
DIVERSITY
We do everything we can to make Mercury a great and safe place to work, where all our employees feel engaged and motivated to live up to their full potential, and also the full potential of their teams. Our commitment to diversity and inclusion starts with our Inclusion and Diversity Policy and framework. A copy of this policy is available in the Corporate Governance section of our website Mercury’s approach to diversity and inclusion is aligned to the following principles:
• create a flexible and inclusive work environment that values difference and enhances business outcomes; • harness diversity of thought and capitalise on individual differences;
• Targets & Measures: implementing simplified targets for diversity and communicate and measure against these in a way that establishes clear expectations and drives change.
• Aligned Employment Practices: create and maintain a working environment which supports diversity and inclusion in all aspects of the employee experience. Our progress against diversity and inclusion goals is measured against objectives set by the Board. These objectives are made up of a mixture of targets and benchmarks. Generally, targets exist where we believe that achieving diversity in that area is aided by us working towards a specific measure. In other areas, we use benchmarks where comparison against those identified data points will help inform our view of how our work towards diversity in that area is progressing. Diversity and Inclusion is also covered in the People Pillar story, with details of specific initiatives underway.
GOVERNANCE AT MERCURY.
982022REPORTANNUALMERCURYTHETEAMBEHINDENERGYFREEDOMMENU
Mercury embraces and celebrates diversity in all its forms.
• Capability Building & Awareness: develop internal capability and increase awareness of inclusion and diversity across the business to ensure we have thriving diverse talent and an inclusive culture.
A key element of the Mercury Attitude is that we encourage our people to share and connect. & INCLUSION.
• Employee Network Groups: enable passionate employees to take ownership of initiatives, which grow awareness, celebrate uniqueness and promote inclusiveness.
• Strategic Partnerships: build our external partnerships and relationships and leverage opportunities to utilise expertise, bring in diverse opinions, and align our diversity initiatives with best practice.

992022REPORTANNUALMERCURYTHETEAMBEHINDENERGYFREEDOMMENU GOVERNANCE AT MERCURY. Objectives Future years - targets Prior years - actuals and targets Gender We have clear and simple targets for gender diversity of 40:40:20 at all levels. This means we aim for a minimum of 40% female and 40% male, with the balance being any gender. Pay Equity We ensure that everyone is rewarded fairly for their work. Employee Group FY23 FY24 FY25 JuneTarget2021 June (Female/Male)Actuals2021 JuneTarget2022 June (Female/Male)Actuals2022 All Employees 40:40:20 40:40:20 40:40:20 43% 38% / 62% 45% 39% / 61% People Leaders 40:40:20 40:40:20 40:40:20 34% 32% / 68% 35% 35% / 65% EMT 40:40:20 40:40:20 40:40:20 >36% 43% / 57% >40% 44% / 56% Board 40:40:20 40:40:20 40:40:20 >36% 25% / 75% >40% 25% / 75% Pay Equity Our target is 100% Pay Equity. 100% 97.2% 100% 94.9% Ethnicity Aligned to our goal of having clear & simple targets, we have simplified long-term targets for ethnicity of 15:15:10. This means we aim for a minimum of 15% Māori, 15% Asian and 10% Pasifika at all levels (these are closely aligned to our population demographics and are minimums). Ethnicity FY23 FY24 FY25 JuneTarget2021 JuneActuals2021 JuneTarget2022 JuneActuals2022 Māori PeopleEmployeesLeaders 15%15% 15%15% 15%15% 5%6% 4%1% 6%7% 2%4% Asian PeopleEmployeesLeaders 15%15% 15%15% 15%15% 22%11% 22%13% 23%13% 23%14% Pasifika PeopleEmployeesLeaders 10%10% 10%10% 10%10% 9%4% 2%6% 10%5% 5%1% Age To ensure our business is diverse in a range of ways, we monitor our age profile to check that we are aligned to the national median. The median age of the NZ workforce is 41.6 years (National Labour Force projections, 2020) Benchmark against national median age of the labour force in New Zealand national labour projectionsforce 44, consistent with national labour projectionsforce Benchmark against national median age of the labour force in New Zealand National Labour Force projections 41.7, consistent with national labour projectionsforce The above figures exclude Trustpower employees, except for those figures relating to the EMT. At 30 June 2022, the proportion of women on the EMT (including the Chief Executive) was 44%, or four out of nine (as at 30 June 2021 this was 43% or three out of seven). The proportion of women on the Board at balance date was 25%, or two out of eight, including the Chair (as at 30 June 2021 this was 25%, or two out of eight). Our Future Director is a woman. No Directors or EMT self-identify as gender diverse. In April 2022 we moved our banding framework to Strategic Pay. Following the reevaluation of all roles there have been adjustments to position in ranges impacting gender pay equity. At 30 June 2022, our gender pay equity was 94.9%. Gender pay equity is calculated as the average position in range (relative to the role's band midpoint) of female fixed remuneration compared with the average position in range of male fixed remuneration. Our gender pay gap which compares the median hourly rate between males and females was 21.7%.
The Board believes that for this reporting period Mercury has made progress towards achieving our inclusiveness and diversity objectives and against our Inclusion and Diversity Policy generally. However, the Board notes that continued focus is required in order for us to achieve our FY23 diversity targets.
Pay equity by ethnicity compared to "other" ethnicity was Māori 96.1%; Asian 93.9% and Pasifika 90.1%. The ethnicity pay gap which compares the median hourly rate between each ethnicity and "other" ethnicity was Māori 25.7%; Asian 18.6% and 51.6% for Pasifika.
reduced. For the people and sustainability KPIs the target was met and for the culture KPI the target was not met as the engagement score fell slightly short of target and Diversity metrics were not achieved. The result is that the Company STI was awarded at 79% of Inmaximum.FY22New Zealand faced some significant challenges with skill shortages and unprecedented pressure on salaries. This year we focussed salary movements for those employees on lower salaries. Mercury has always paid its permanent employees above the living wage. I am impressed with the way the Executive Management Team (EMT) and our employees responded to the challenges this year.
Dear Shareholder As Chair of the People and Performance Committee (PPC) of the Board, it is my pleasure to present our Remuneration Report for the year ended 30 June This2022.report outlines Mercury’s strategy and approach to remuneration, in particular for its executives. It sets out remuneration information for the Chief Executive, Chief Financial Officer and directors. Mercury’s Board is committed to a remuneration framework that promotes a high-performance culture and aligns executive reward to the achievement of strategies and objectives to create sustainable value for shareholders. The Board is committed to demonstrating transparency in its remuneration policy and practice. The Board is supported by the PPC for these activities. The role and membership of the PPC is set out in Governance at Mercury. The Board reviewed management performance against the short-term incentives (STIs) Key Performance Indicators (KPIs). The Board determined that stretch targets were met for commercial and growth KPIs. The Board agreed that the partnership stretch KPI was not fully met and therefore was SCOTT ST JOHN CHAIR, PEOPLE & PERFORMANCE COMMITTEE
Executive remuneration Mercury’s remuneration policy for the EMT is founded on three guiding principles:
Short-term performance incentives
• remuneration is aligned to long-term sustainable shareholder value
• simplicity over complexity will be reflected in the Totaldesignremuneration is made up of three components: fixed remuneration, short-term performance incentives and long-term performance incentives. Short- and long-term performance incentives are deemed ‘at-risk’ because the outcome is determined by performance against a combination of predetermined financial and non-financial objectives. Mercury’s remuneration philosophy is to pay for performance and there is an opportunity for executives to receive, where performance has been exceptional, a total remuneration package in the upper quartile for equivalent market-matched roles.
1002022REPORTANNUALMERCURYTHETEAMBEHINDENERGYFREEDOMMENU
• remuneration for individuals will reflect the level of performance and delivery of successful outcomes
The PPC reviews the annual performance appraisal outcomes for all members of the EMT and approves the outcomes for all EMT members other than the Chief Executive. The Chief Executive’s remuneration is approved by the Board on the recommendation of the PPC. The review takes into account external benchmarking to ensure competitiveness with comparable market peers, along with consideration of an individual’s performance, skills, expertise and experience. Fixed remuneration Fixed remuneration consists of base salary and benefits. Mercury’s policy is to pay fixed remuneration with reference to the fixed pay market median.
Short-term incentives (STIs) are at-risk payments designed to motivate and reward for performance fairly in that financial year. The target value of an STI payment is set annually, usually as a percentage of the executive’s base salary. For FY22 the relevant target percentage for the Chief Executive was 50% and up to 40% for other EMT Amembers.proportion (70% for the Chief Executive and 50% for other EMT members) of the STI is related to a shared set of Key Performance Indicators (KPIs) based on business priorities for the next 12 months, with the objective of aligning the EMT’s focus with the company’s priorities. For FY22 the share KPIs were aligned under six three year goals. The FY22 weighting for the commercial goal was 40% with the other five goals being worth 10 or 15%. The Commercial KPI is normalised for positive and negative annual variations in hydrology as these are beyond management’s control. The criteria were selected to closely to align with Mercury’s strategic objectives, purpose and goals. For FY22 there were two performance levels within each goal: ‘on-target’ and ‘stretch’. The stretch performance levels allowed employees to be rewarded for exceptional performance. The maximum amount of an STI payment for an EMT member for the shared KPIs was 160% of the STI on-target amount.
REPORT.REMUNERATION

REMUNERATION REPORT.
Long-term performance incentives
1012022REPORTANNUALMERCURYTHETEAMBEHINDENERGYFREEDOMMENU
The balance of the STI for the Chief Executive is related to individual performance measures set by the Board. In the case of other EMT members, the balance is related to business unit and individual performance measures. In the event all on-target KPIs are not met on the Scorecard, no STI payment will be made.
Each grant under the LTI plan has two tranches with different performance hurdles:
The Board retains discretion to ensure the final outcome of STI payments fairly reflects performance over the relevant financial Foryear.FY23 we have identified the 12 KPIs that matter most. The FY23 weighting for the commercial goal remains at 40% with the other five goals being worth 10 or 15%.
• 50% of the grant is based on Mercury’s TSR relative to the performance of an industry peer group (comprising Meridian Energy, Genesis Energy, Contact Energy and Trustpower (for FY22 vesting only)). There is no positive TSR performance gate on this tranche but Mercury’s TSR must be at the 50th percentile of the comparator group for any award to be made on this component of the LTI plan
Long-term performance incentives (LTIs) are at-risk payments designed to align the reward of executives with the enhancement of shareholder value over a multi-year period. Under the LTI plan, grants are made annually with performance measured over a three-year period. The LTI plan is a dividend protected share rights plan and executives are granted a number of share rights determined by dividing the face value of the grant by the value of one Mercury share at the date of the grant. At vesting, subject to meeting the performance hurdles, each share right is converted to one ordinary share. The executive may also receive additional shares representing the value of dividends paid over the vesting period. The executive is liable for tax on the shares received at this point.
• 50% of the grant is based on Mercury’s absolute TSR against the company’s cost of equity over the vesting period, plus 1%. For the FY22 grant period commencing 1 July 2021, the value represented 75% of the Chief Executive base salary and between 25% to 35% of base salary for other EMT members as at that date. The Board retains discretion over the final outcome of the LTI plan, to allow appropriate adjustments where unanticipated circumstances may impact performance, positively or negatively, over a three-year period.
1022022REPORTANNUALMERCURYTHETEAMBEHINDENERGYFREEDOMMENUChief Executive's remuneration (FY22 & FY21) Salary 1 $ Benefits 2 $ Subtotal $ Pay for performance $ Total remuneration$ STI LTI Subtotal Chief Executive – Vince Hawksworth FY22 1,263,976 57,543 1,321,519 750,924 N/A 750,924 2,072,443 FY21 1,212,644 48,971 1,261,615 537,900 N/A 537,900 1,799,515 Note 1: Actual salary paid includes holiday pay paid as per NZ legislation. The base salary for Vince Hawksworth for FY21 was $1,200,000 and $1,224,000 for FY22. Note 2: Benefits include KiwiSaver and insurance. For reference: On 1 April 2020 Vince Hawksworth was appointed to the Board of Tilt Renewables Ltd as a Director. For the FY22 period, he was paid $9,714 (gross) in director fees by Tilt Renewables. Five-year summary – Chief Executive's remuneration remunerationTotalpaid3$ maximumPercentageSTIagainst4% Percentage vested LTI maximumagainst% Span of performanceLTIperiod Chief Executive –Vince Hawksworth FY22 2,072,443 77 N/A N/A FY21 1,799,515 50 N/A N/A FY20 513,940 51 N/A N/A Chief Executive –Fraser Whineray FY20 1,653,476 69 87 2017 – 2020 FY19 1,975,715 65 50 2016 – 2019 FY18 1,803,283 67 0 2015 – 2018 Note 3: Total remuneration paid including Salary, Benefits, STI and LTI payments. Note 4: For FY22 the Maximum STI was 160% of ‘on-target’ performance pay. All other years the Maximum STI was 178% of ‘on-target’ performance pay. Breakdown of Chief Executive's pay for performance (FY22)5 Description Performance measures achievedPercentageby Vince Hawksworth STI 6 Set at 50% of base salary. Based on a combination of key financial and non-financial performance measures 70% based on the six Company Shared goals (weighted 10-40%) 126 20% based on individual measures 115 10% based on business KPIs (for Chief Executive only) 115 Note 5: Vince Hawksworth was not issued shares under the FY20-FY22 grant issued 1 July 2019 due to starting Mercury in 2020. Therefore, no LTI was awarded to Vince in FY22. Note 6: The above STI for FY22 will be paid in FY23. Five-year summary – TSR Performance (company vs peer group) -20-1001020305040 302018June 302019June 302020June 302021June 302022June %TSR NZXPeerMercurygroup50 CHIEF EXECUTIVE’S REMUNERATIONREMUNERATION.REPORT.
advance
1032022REPORTANNUALMERCURYTHETEAMBEHINDENERGYFREEDOMMENUKiwiSaver
performance
Chief
CHIEF FINANCIAL OFFICER’S REMUNERATION
(including short- and long-term incentives).
for
In the interests of providing greater transparency of executive remuneration, the Board has elected to provide details regarding total remuneration paid to the Chief Financial Officer. In FY22, the Chief Financial Officer received remuneration totalling $919,258. This amount included a $170,575 STI payment and a $186,719 LTI payment, both relating to FY21 but paid in FY22. The remaining $561,964 was a combination of fixed remuneration
and benefits. REMUNERATION REPORT.
FY23
The Chief Executive is a member of KiwiSaver. As a member of this scheme, the Chief Executive is eligible to contribute and receive a company contribution of 3% of gross taxable earnings For FY22, the company’s contribution for Vince Hawksworth was $54,056. CHIEF EXECUTIVE’S REMUNERATION STRUCTURE
Note 7: Benefits include KiwiSaver and insurance. Note 8:
The Board has elected, in the interests of transparency, to disclose in the structure and package that will apply for FY23. STI LTI 3,062,263 This LTI will be granted in FY23 and, if hurdles are met, paid in 2025. Executive’s remuneration pay FY23
FY23 Base Salary $ Benefits 7 $ Subtotal $ Pay for performance 'on-target' $ Total remuneration $
granted 8 Subtotal ExecutiveChief 1,285,200 42,043 1,327,243 771,120 963,900 1,735,020
$0 $5 00 $1 00 0 $1 ,5 00 $2 0 00 $2 ,5 00 $3 ,0 00 $3 ,5 00 $4,0 00 $000 Fi xed O n plan Maxi mum L ong-te rm I nce nt ive s Gr an te d (2 025 ve st i ng) Annu al V ar ia bl e Ba se Sa l ar y & Be ne fi t s
in shares
EMPLOYEE REMUNERATION The Group paid remuneration in excess of $100,000 including benefits to 425 employees (not including directors) during the FY22 year in the following bands: Remuneration band 12 Currently employed No employedlonger Total $100,001-$110,000 43 6 49 $110,001-$120,000 55 10 65 $120,001-$130,000 54 1 55 $130,001-$140,000 48 8 56 $140,001-$150,000 38 7 45 $150,001-$160,000 32 1 33 $160,001-$170,000 22 22 $170,001-$180,000 14 3 17 $180,001-$190,000 6 1 7 $190,001-$200,000 18 2 20 $200,001-$210,000 8 3 11 $210,001-$220,000 5 5 $220,001-$230,000 6 6 Remuneration band 12 Currently employed No employedlonger Total $230,001-$240,000 3 3 $250,001-$260,000 2 1 3 $260,001-$270,000 1 3 4 $270,001-$280,000 4 4 $300,001-$310,000 1 1 $310,001-$320,000 3 3 $320,001-$330,000 1 1 $330,001-$340,000 1 1 2 $360,001-$370,000 1 1 $370,001-$380,000 1 1 $380,001-$390,000 1 1 2 $390,001-$400,000 1 1 $410,001-$420,000 1 1 $470,001-$480,000 1 1 $510,001-$520,000 1 1 $620,001-$630,000 1 1 $670,001-$680,000 1 1 $790,001-$800,000 1 1 $910,001-$920,000 1 1 $1,850,001-$1,860,000 1 1 Total 376 49 425 Note 12: The remuneration bands above include 5 employees who received redundancy payments in FY22. The total remuneration ratio for FY22 between employee (median) and Chief Executive was 1:25. This is based on, for employees, actual remuneration paid in FY22 (employee median was $82,700) and for the Chief Executive, the amount specified in the table on page 102, $2,072,443. REMUNERATION REPORT.
Note 11: The Chief Financial Officer disclosed in an Ongoing Disclosure Notice to the market dated 15 September 2021 a transfer of 33,959 shares to Tracey Meek, the Chief Financial Officer's wife. The Chief Financial Officer ceased to have a relevant interest in these shares upon transfer to Tracey Meek.
1042022REPORTANNUALMERCURYTHETEAMBEHINDENERGYFREEDOMMENUSHARE OWNERSHIP The Chief Executive and Chief Financial Officer’s ownership of Mercury shares as at 30 June 2022 are: Executive Number of shares owned (excludes shares held in trust for the LTI scheme) Change in shares owned since 30 June 2021 Chief Executive 32,51110 431 Chief Financial Officer 0 33,95911 Balance of EMT 9 164,397 67,935 Note 9: Balance of shares owned by other EMT members as at 30 June 2022, excluding shares owned by the Chief Executive and Chief Financial Officer.
Note 10: Chief Executive shares include shares held in personal capacity as well as those held in trust. The Chief executive also has a beneficial interest in 100,000 MCY040 bonds held in trust.
101,750 9 9,500 4 111,250 Keith
The total pool of fees able to be paid to directors is subject to shareholder approval and currently stands at $1,085,400. Directors’ fees were last reviewed in 2021, with the increase taking effect from 1 October 2021. These fees are set following consultation with key stakeholders and having considered independent remuneration benchmarking advice. Mercury meets directors’ reasonable travel and other costs associated with Mercury business. Mercury does not pay any retirement benefits to non-executive directors. The following people held office as directors during the year to 30 June 2022 and the remuneration set out in the table below was approved during the period. The number of meetings and attendance rate by directors during the year to 30 June 2022 was as follows: Director Board Committee Taitoko Smith 917,311 meetings further held during FY22. These meetings to, usual meeting cycle relation to an M&A transaction and Mercury's
Note 14: Prue Flacks’ fees cover attendance at all Committee meetings.
meetings were
Note 17: James Miller became Chair of the Risk & Assurance Committee on Keith Smith’s retirement.
were outside of, and in addition
and were in
62,674 39,300 11,000 1,030,28513 *In addition to the
People Performance&Committee NominationsCommittee Total 15 No. of meetings 9* 518 4 2 20 Fees$ AttendedMeetings Fees$ AttendedMeetings Fees$ AttendedMeetings Fees$ AttendedMeetings Fees$ Prue Flacks 198,75014(Chair) 9 5 4 2 198,750 Dennis Barnes 85,417 8 8,667 416 216 94,083 Hannah Hamling 101,750 9 12,250 5 116 114,000 Andy Lark 101,750 9 116 9,500 4 111,250 James Miller 101,750 9 (Chair)23,50017 5 5,500 2 130,750 Scott St John 101,750 9 416 20,300(Chair) 4 122,050 Patrick Strange 101,750 9 12,250 5 5,500 2 119,500 Mike
1052022REPORTANNUALMERCURYTHETEAMBEHINDENERGYFREEDOMMENUDIRECTOR REMUNERATION
Note 13: The total pool for Directors fees of $1,085,400 in FY22 was not fully exhausted.
REMUNERATION
22,644 2 6,008 2 28,652 Total
the
Note 15: Disclosure Committee is not reported on as these occur as ad-hoc and on an as required basis.
Note 16: Dennis Barnes attended two People & Performance Committee meeting and one Risk and Assurance Committee meeting as an observer. Hannah Hamling attended one People & Performance Committee meeting as an observer. Scott St John attended four Risk and Assurance Committee meetings as an observer. Andy Lark attended one Risk and Assurance Committee meeting as an observer.
annual insurance renewal.
For reference: Future Director Kim Gordon was paid $20,000 in relation to her role as future director in FY22.
detailed above, two
REPORT.
The directors’ remuneration is paid in the form of directors’ fees. Additional fees are paid to the Chair and in respect of work carried out by directors on various Board committees to reflect the additional time involved and responsibilities of these positions.
Risk Assurance & Audit
Note 18: There was one out of cycle Risk and Assurance Committee meeting held in September. There are typically four Risk and Assurance Committee meetings in a financial year.
1062022REPORTANNUALMERCURYTHETEAMBEHINDENERGYFREEDOMMENUINTERESTS REGISTER
Andy Lark Group Lark Pty Limited Chair
Disclosure of Directors’ Interests
Keith Smith retired as a director during the period on 23 September 2021. The following are particulars included against his name in the Company’s Interest Register during the period.
Treescape Limited Director TILT Renewables Limited Shareholder
1. Entries added by notices given by the directors during the year ended 30 June 2022.
Sir John Logan Campbell Residuary Estate Trustee Healthcare Holdings Limited & subsidiaries and associates Chair
Section 140(1) of the New Zealand Companies Act 1993 requires a director of a company to disclose certain interests.
Patrick Strange Chorus Limited Chair Auckland International Airport Limited Chair Mike Taitoko Takiwā Limited ShareholderDirector/ Takiwā NZ Limited ShareholderDirector/1 Maratini Holdings Limited ShareholderDirector/ Canvasland Holdings Limited ShareholderDirector/ Waiora Consulting Limited ShareholderDirector/ Toha Foundry Limited ShareholderDirector/ Dennis Barnes Contact Energy Limited Shareholder1 Tilt Renewables (Australia) and subsidiaries Director
Dubber Pty Limited OfficerandMarketingChiefStrategy
ANZ Bank New Zealand Limited Director
Keith Smith Enterprise Motor Group Limited and subsidiaries Chair H J Asmuss & Co Limited Chair
Under subsection (2) a director can make disclosure by giving a general notice in writing to the Company of a position held by a director in another named company or entity. The following are particulars included in the Company’s Interests Register as at 30 June 2022: Prue Flacks Chorus Limited Director2 Hannah Hamling None
2. Entries removed by notices given by the directors during the year ended 30 June 2022.
Cornwall Park Trust Board Trustee
DIRECTORS’
Advisory board of Tax Traders Limited Member Anderson & O’Leary Limited Chair
Mobile Surgical Services Limited and subsidiaries Chair Goodman (NZ) Limited and subsidiaries Chair
James Miller NZX Limited Chair ACC Deputy Chair2 Channel Infrastructure NZ Limited (formerly The New Zealand Refining Company Limited) Director ACC Board Investment Committee Chair2 ACC rolesGovernance2 Vista Group International Limited Director Scott St John Fisher & Paykel Healthcare Corporation Limited ShareholderChair/ Fonterra Co-operative Group Limited Director Next Foundation (and associated vehicles) Director
Sky Network Television Limited Director DISCLOSURES.
1072022REPORTANNUALMERCURYTHETEAMBEHINDENERGYFREEDOMMENUDirectors’ & Officers’ Indemnities Indemnities have been given to and insurance has been effected for, directors and senior managers of the Group to cover acts or omissions of those persons in carrying out their duties and responsibilities as directors and senior managers. Disclosure of Directors’ Interests in Share & Bond Transactions Directors disclosed, pursuant to section 148 of the New Zealand Companies Act 1993, the following acquisitions and disposals of relevant interests in shares and bonds during the period to 30 June 2022: Name of director Date of interestdisposalacquisition/ofrelevant Nature of relevant interest (NZD)Consideration Securities in which a relevant interest acquired/(disposed)was Prue Flacks 1 April 2022 Transfer of ordinary shares as a result of participation in Mercury's Dividend Reinvestment Plan 3,349.37 601 Scott St John 1 April 2022 Transfer of ordinary shares as a result of participation in Mercury's Dividend Reinvestment Plan 3,600.16 646 Hannah Hamling 4 April 2022 On market acquisition of ordinary shares 77,480 13,000 Prue Flacks 16 May 2022 Acquisition of 120,000 MCY050 capital bonds upon allotment by Mercury NZ Limited pursuant to the offer of MCY050 capital bonds under the Term Sheet dated 5 May 2022 120,000 120,000 Prue Flacks 18 May 2022 On market acquisition of 80,000 MCY050 capital bonds 81,760.14 80,000 Disclosure of Subsidiary Directors’ Interests The following are particulars included in the Interests Register for Mercury’s subsidiary companies as at 30 June 2022: Director Interest Entity Prue Flacks Phil Gibson2 Nil Stewart Hamilton Nil Vincent Hawksworth2 Chief DirectorExecutive Mercury NZ Limited NOW New Zealand Limited Julia Jack Shareholder Power to the Pedal Limited James WilliamMiller1Meek2 Chief Financial Officer Mercury NZ Limited Mike MarleneTaitokoStrawson Nil. Howard Thomas2 Nil. 1. Refer to Disclosure of Directors’ Interests 2. This person is a Director of more than one subsidiary of Mercury NZ Limited, please refer to Company Disclosures DIRECTORS’ DISCLOSURES. Disclosure of Directors’ Interests in Shares & Bonds Directors disclosed the following relevant interests in shares and bonds as at 30 June 2022: Director Number of Shares in which a relevant interest is held Number of bonds Change since 30 June 2021 Prue Flacks 45,575 38,000 MCY020 capital bonds 69,000 MCY030 green bonds 200,000 MCY050 capital bonds 601 capital200,000sharesMCY050bonds Hannah Hamling 16,300 13,000 shares Andy Lark 3,300 James Miller 40,320 Scott St John 45,646 646 shares Patrick Strange 39,160 Mike Taitoko 2,200 Dennis Barnes 50,000 50,000 shares1 1. Disclosed as part of Initial Disclosure when Dennis Barnes joined Mercury as a Director on 1 September 2021.
shares on
included
shares. SHAREHOLDER SECURITYINFORMATION HOLDER INFORMATION.
1. This comprises (a) 716,140,528 shares held by the Crown on its own account; (b) 10,857,675 shares forming part of the New Zealand Superannuation Fund which are the property of the Crown; and (c) 68,000 shares held by Public Trust on trust for the Crown and certain iwi. As at 30 June 2022, Mercury had 1,400,012,517 ordinary issue, which 18,168,203 ordinary held treasury
2.
as
1082022REPORTANNUALMERCURYTHETEAMBEHINDENERGYFREEDOMMENUTwenty largest registered shareholders as at 30 June 20221 Name ofNumbershares % of shares 2 Her Majesty the Queen in Right of New Zealand 716,140,528 51.15 HSBC nominees (New Zealand) Limited 55,578,548 3.97 HSBC nominees (New Zealand) Limited A/C State Street 51,534,572 3.68 Citibank Nominees (New Zealand) Limited 46,005,944 3.29 JP Morgan Chase Bank N.A. NZ Branch-Segregated Clients ACCT 43,547,886 3.11 Custodial Services Limited 37,534,489 2.68 Accident Compensation Corporation 28,874,888 2.06 National Nominees Limited 24,221,371 1.73 BNP Paribas Nominees (NZ) Limited 20,140,671 1.44 Mercury NZ Limited3 18,168,203 1.30 FNZ Custodians Limited 12,641,941 0.90 JBWere (NZ) Nominees Limited 12,415,880 0.89 New Zealand Depository Nominee Limited 12,327,935 0.88 HSBC Nominees A/C NZ Superannuation Fund Nominees Limited 10,495,567 0.75 BNP Paribas Nominees (NZ) Limited 10,368,879 0.74 Generate KiwiSaver Public Trust Nominees Limited 8,626,833 0.62 Forsyth Barr Custodians Limited 7,958,172 0.57 Tea Custodians Limited Client Property Trust Account 6,809,131 0.49 ANZ Wholesale Australasian Share Fund 6,025,555 0.43 Simplicity Nominees Limited 4,825,175 0.34 Total 1,134,242,168 81.02 1. As required by the NZX Listing Rules, New Zealand Central Securities Depository (NZCSD) holdings are included above and not detailed separately. 2. Percentage calculated on the basis of Mercury having 1,400,012,517 ordinary shares on issue as at 30 June 2022, which included 18,168,203 ordinary shares held as treasury shares. 3. Held as treasury shares. Distribution of shareholders & holdings as at 30 June 2022 Size of holding Number shareholdersof % shareholdersof Numbersharesof quantityHolding%1 1 to 1,000 28,550 38.55 19,191,625 1.37 1,001 to 5,000 36,113 48.76 83,165,004 5.94 5,001 to 10,000 5,980 8.07 43,657,139 3.12 10,001 to 100,000 3,316 4.48 68,454,688 4.89 100,001 and above 107 0.14 1,185,544,061 84.68 Total 74,066 1,400,012,517 100.00 1. Rounding applied. Substantial product holders as at 30 June 2022 Class of Securities NumberSecuritiesof in SubstantialHolding Total Number of Securities in Class Her Majesty The Queen in Right of New Zealand Ordinary shares 727,066,2031 1,400,012,5172
shares
The Tindall Foundation of New Zealand
Inc 1,800,000 0.60 Bank
Hobson
JBWere (NZ) Nominees Limited
Public Trust Nominees Limited 4,057,000 1.35 Forsyth Barr Custodians Limited 3,060,000 1.02 Best
FNZ Kiwisaver Farm (New Zealand)
Wealth Custodian Limited 1,248,000 0.42 Hobson Wealth Custodian Limited 1,215,000 0.41 Masfen Securities Limited 1,200,000 0.40 Custodial Services Limited 762,000 0.25
Limited 2,815,000 0.94
Forsyth
– Treasury Support 1,544,000 0.51
JBWere (NZ)
Custodians Limited 14,643,000 4.88 Forsyth Barr Custodians Limited 7,153,000 2.38 Generate
Limited 2,900,000 0.97 Citibank Nominees
750,000 0.25 Tea Custodians Limited Client Property Trust Account 600,000 0.20 Forsyth Barr Custodians Limited 559,000 0.19 Dunedin Diocesan Trust Board3 500,000 0.17 Estate Patricia Thelma Sutton Deceased3 500,000 0.17 JBWere (NZ) Nominees Limited3 500,000 0.17 Richard Barton Adams & Allison Ruth Adams3 500,000 0.17 Total 256,833,000 85.61 1. As required by the NZX Listing Rules, New Zealand Central Securities Depository (NZCSD) holdings are included above and not detailed separately. 2. Percentage calculated on the basis of Mercury having 300,000,000 MCY020 capital bonds on issue as at 30 June 2022. 3. The report above reports the Top 23 Bond Holders as there are four holders sharing the 20th position. Distribution of MCY020 (3.60%) capital bondholders and holdings as at 30 June 2022 Size of holding Number of MCY020 capital bondholders % of MCY020bondholderscapital1 Number of capitalMCY020bonds quantityHolding%1 1,001 to 5,000 74 5.62 370,000 0.12 5,001 to 10,000 251 19.06 2,446,000 0.82 10,001 to 100,000 920 69.86 30,889,000 10.30 100,001 and above 72 5.47 266,295,000 88.77 Total 1,317 100 300,000,000 100 1. Rounding applied. BONDHOLDER INFORMATION SECURITY HOLDER INFORMATION.
1092022REPORTANNUALMERCURYTHETEAMBEHINDENERGYFREEDOMMENUTwenty largest registered holders of MCY020 capital bonds (3.60%) as at 30 June 20221 Name Number capitalMCY020ofbonds % of capitalMCY020bonds2
Barr Custodians Limited 98,342,000 32.78 Custodial Services Limited 57,775,000 19.26
Nominees Limited 34,204,000 11.40 Hobson Wealth Custodian Limited 20,206,000 6.74
1102022REPORTANNUALMERCURYTHETEAMBEHINDENERGYFREEDOMMENUTwenty largest registered holders of MCY030 green bonds (1.56%) as at 30 June 20221 Name Number greenMCY030ofbonds % of greenMCY030bonds2 Custodial Services Limited 33,540,000 16.77 Forsyth Barr Custodians Limited 13,916,000 6.96 BNP Paribas Nominees (NZ) Limited 12,890,000 6.45 ANZ Wholesale NZ Fixed Interest Fund 12,250,000 6.13 ANZ Bank of New Zealand Limited 11,859,000 5.93 Mint Nominees Limited 10,827,000 5.41 HSBC Nominees (New Zealand) Limited 8,500,000 4.25 National Nominees Limited 7,967,000 3.98 FNZ Custodians Limited 7,659,000 3.83 Tea Custodians Limited Client Property Trust Account 7,090,000 3.55 JBWere (NZ) Nominees Limited 6,574,000 3.29 NZPT Custodians (Grosvenor) Limited 6,300,000 3.15 Adminis Custodial Nominees Limited 6,000,000 3.00 BNP Paribas Nominees (NZ) Limited 5,700,000 2.85 Generate Kiwisaver Public Trust Nominees Limited 5,410,000 2.71 ANZ Fixed Interest Fund 4,500,000 2.25 MT Nominees Limited 4,448,000 2.22 HSBC Nominees (New Zealand) Limited A/C State Street 3,715,000 1.86 Citibank Nominees (New Zealand) Limited 3,500,000 1.75 Queen Street Nominees ACF Pie Funds 3,000,000 1.50 Total 175,645,000 87.82 1. As required by the NZX Listing Rules, New Zealand Central Securities Depository (NZCSD) holdings are included above and not detailed separately. 2. Percentage calculated on the basis of Mercury having 200,000,000 MCY030 green bonds on issue as at 30 June 2021. Distribution of MCY030 (1.56%) green bondholders and holdings as at 30 June 2022 Size of holding Number of MCY030 green bondholders % of MCY030bondholdersgreen1 Number of greenMCY030bonds quantityHolding%1 1,001 to 5,000 18 5.59 90,000 0.05 5,001 to 10,000 62 19.25 569,000 0.28 10,001 to 100,000 191 59.32 7,238,000 3.62 100,001 and above 51 15.84 192,103,000 96.05 Total 322 100 200,000,000 100 1. Rounding applied. SECURITY HOLDER INFORMATION.
1112022REPORTANNUALMERCURYTHETEAMBEHINDENERGYFREEDOMMENUTwenty largest registered holders of MCY040 green bonds (2.16%) as at 30 June 20221 Name Number greenMCY040ofbonds % of greenMCY040bonds2 Custodial Services Limited 42,217,000 21.11 FNZ Custodians Limited 30,253,000 15.13 Forsyth Barr Custodians Limited 16,459,000 8.23 BNP Paribas Nominees (NZ) Limited 13,209,000 6.60 Citibank Nominees (New Zealand) Limited 12,500,000 6.25 HSBC Nominees (New Zealand) Limited 11,875,000 5.94 Southland Building Society 9,250,000 4.63 PIN Twenty Limited 4,980,000 2.49 Tea Custodians Limited Client Property Trust Account 4,110,000 2.06 Westpac Banking Corporate NZ Financial Markets Group 3,930,000 1.97 Mint Nominees Limited 3,800,000 1.90 Risk Reinsurance Limited 3,800,000 1.90 NZX WT Nominees Limited 3,502,000 1.75 Dunedin City Council 3,000,000 1.50 MT Nominees Limited 3,000,000 1.50 Hobson Wealth Custodian Limited 2,580,000 1.29 BNP Paribas Nominees (NZ) Limited 2,500,000 1.25 FNZ Custodians Limited 2,234,000 1.12 Bank Of New Zealand - Treasury Support 2,225,000 1.11 Forsyth Barr Custodians Limited 1,821,000 0.91 Total 177,245,000 88.62 1. As required by the NZX Listing Rules, New Zealand Central Securities Depository (NZCSD) holdings are included above and not detailed separately. 2. Percentage calculated on the basis of Mercury having 200,000,000 MCY040 green bonds on issue as at 30 June 2022. Distribution of MCY040 (2.16%) green bondholders and holdings as at 30 June 2022 Size of holding Number of MCY040 green bondholders % of MCY040bondholdersgreen1 Number of greenMCY040bonds quantityHolding%1 1,001 to 5,000 20 6.92 100,000 0.05 5,001 to 10,000 62 21.45 592,000 0.30 10,001 to 100,000 159 55.02 6,164,000 3.08 100,001 and above 48 16.61 193,144,000 96.57 Total 289 100 200,000,000 100 1. Rounding applied. SECURITY HOLDER INFORMATION.
1122022REPORTANNUALMERCURYTHETEAMBEHINDENERGYFREEDOMMENUTwenty largest registered holders of MCY050 green bonds (5.73%) as at 30 June 20221 Name Number greenMCY040ofbonds % of greenMCY040bonds2 Forsyth Barr Custodians Limited 66,122,000 26.45 JBWere (NZ) Nominees Limited 41,159,000 16.46 National Nominees Limited 24,400,000 9.76 Custodial Services Limited 19,687,000 7.87 Hobson Wealth Custodian Limited 16,417,000 6.57 Citibank Nominees (New Zealand) Limited 11,550,000 4.62 Generate Kiwisaver Public Trust Nominees Limited 8,522,000 3.41 FNZ Custodians Limited 5,523,000 2.21 Adminis Custodial Nominees Limited 3,800,000 1.52 Forsyth Barr Custodians Limited 3,579,000 1.43 CML Shares Limited 2,600,000 1.04 Investment Custodial Services Limited 2,266,000 0.91 Masfen Securities Limited 2,000,000 0.80 Tea Custodians Limited Client Property Trust Account 1,470,000 0.59 Fletcher Building Educational Fund Limited 1,000,000 0.40 Robert William Bentley Morrison & Andrew James Stewart & Anthony James William Howard 1,000,000 0.40 RGTKMT Investments Limited 800,000 0.32 Sterling Holdings Limited 800,000 0.32 JML Capital Limited 750,000 0.30 Barry Raymond Hall 600,000 0.24 Total 214,045,000 85.62 1. As required by the NZX Listing Rules, New Zealand Central Securities Depository (NZCSD) holdings are included above and not detailed separately. 2. Percentage calculated on the basis of Mercury having 250,000,000 MCY050 capital bonds on issue as at 30 June 2022. Distribution of MCY050 (5.73%) capital bondholders and holdings as at 30 June 2022 Size of holding Number of MCY050 green bondholders % of MCY050bondholdersgreen1 Number of greenMCY040bonds quantityHolding%1 1,001 to 5,000 121 11.27 605,000 0.24 5,001 to 10,000 241 22.44 2,287,000 0.91 10,001 to 100,000 635 59.12 20,330,000 8.13 100,001 and above 77 7.17 226,778,000 90.71 Total 1074 100 250,000,000 100 1. Rounding applied. SECURITY HOLDER INFORMATION.
MERCURY NZ LIMITED
SUBSIDIARY COMPANIES
The following persons held office as Directors of Mercury NZ Limited during the 2022 financial year and as at the end of the 2022 financial year, being 30 June 2022: Prue Flacks (Chair), Hannah Hamling, Andy Lark, James Miller, Keith Smith1 Scott St John, Patrick Strange, Mike Taitoko, and Dennis Barnes2
1132022REPORTANNUALMERCURYTHETEAMBEHINDENERGYFREEDOMMENU
Mercury NZ Limited (referred to in this section as “Mercury” or “the Company”) is listed on the New Zealand stock exchange and as an ASX Foreign Exempt Listing on the Australian stock Inexchange.NewZealand, Mercury is listed with a “non-standard” (NS) designation. This is due to particular provisions of the Constitution, including the requirements regulating ownership and transfer of Ordinary Shares.
The following persons held office as directors of subsidiaries of Mercury NZ Limited during FY2022:
Company name Directors Mercury SPV Limited Vincent Hawksworth William Meek Howard Thomas Mercury Wind Limited Vincent Hawksworth2 William Meek Howard Thomas Mighty Geothermal Power International Limited Vincent Hawksworth William Meek Howard Thomas Mighty Geothermal Power Limited Vincent Hawksworth William Meek Howard Thomas Mighty River Power Limited Vincent Hawksworth William Meek Howard Thomas Ngātamariki Geothermal Limited Vincent Hawksworth William Meek Howard Thomas Rotokawa Generation Limited William Meek Phil StewartGibsonHamilton2MichaelStevens Rotokawa Geothermal Limited Vincent Hawksworth William Meek Howard Thomas Michael Stevens Special General Partner Limited Vincent Hawksworth William Meek Howard Thomas Tararua Wind Power Limited Vincent Hawksworth2 William Meek2 Howard Thomas2 Company name Directors Blockchain Energy Limited Vincent Hawksworth William Meek Howard Thomas Bosco Connect Limited Vincent Hawksworth William Meek Howard Thomas Glo-Bug Limited Vincent Hawksworth William Meek Howard Thomas Kawerau Geothermal Limited Vincent Hawksworth William Meek Howard Thomas Mercury Drive Limited Julia Jack Mercury Energy Limited Vincent Hawksworth William Meek Howard Thomas Mercury ESPP Limited William HowardMarleneMeekStrawsonThomas Mercury Geothermal Limited Vincent Hawksworth William Meek Howard Thomas Mercury Insurance Captive Limited James HowardWilliamVincentMillerHawksworthMeekThomas Mercury LTI Limited Prue Flacks Mike HowardTaitokoThomas Mercury Solar Limited Vincent Hawksworth William Meek Howard Thomas Company name Directors Waverley Wind Farm (NZ) Holding Limited Vincent Hawksworth2 William Meek2 Howard Thomas2 Waverley Wind Farm Limited Vincent Hawksworth2 William Meek2 Howard Thomas2 What Power Crisis (2016) Limited Vincent Hawksworth William Meek Howard Thomas 1. Directors who have resigned during FY2022. 2 Directors appointed during FY2022. COMPANY DISCLOSURES.
ASX approved a change in Mercury NZ Limited’s ASX admission category from an ASX Listing to an ASX Foreign Exempt Listing, effective from the commencement of trading on 19 February 2016. The Company continues to have a full listing on the NZX Main Board, and the Company’s shares are still listed on the ASX. The Company is primarily regulated by the NZX, complies with the NZX Listing Rules, and is exempt from complying with most of the ASX Listing Rules (based on the principle of substituted compliance).
STOCK EXCHANGE LISTINGS
INFORMATION ABOUT MERCURY NZ LIMITED ORDINARY SHARES
• allowing the Crown and Mercury to enforce the 10% limit; and • enabling Mercury to prevent shareholders who acquired shares under the General Offer and are not New Zealand applicants from transferring those shares and to enable Mercury to sell those shares. A summary of the restrictions on the ownership of shares under the Public Finance Act and the Constitution is set out below. If Mercury issues any other class of shares, or other securities which confer voting rights, in the future, the restrictions summarised below would also apply to those other classes of shares or voting securities.
• exercise the other rights conferred upon a shareholder by the Companies Act and the Constitution.
• attend and vote at a meeting of shareholders, including the right to cast one vote per share on a poll on any resolution, such as a resolution to: appoint or remove a director; adopt, revoke or alter the Constitution; approve a major transaction (as that term is defined in the Companies Act); approve the amalgamation of the Company under section 221 of the Companies Act; or place the Company in liquidation;
In broad terms, if:
OTHER DISCLOSURES.
No person (other than the Crown) may have a ‘relevant interest’ in more than 10% of the shares on issue (“10% TheLimit”).Company must not issue, acquire or redeem any shares if it has actual knowledge that such issue, acquisition or redemption will result in any person other than the Crown exceeding the 10% Limit. Ascertaining whether a breach has occurred If a holder of shares breaches the 10% Limit or knows or believes that a person who has a relevant interest in shares held by that holder may have a relevant interest in shares in breach of the 10% Limit, the holder must notify Mercury of the breach or potential breach. Mercury may require a holder of shares to provide it with a statutory declaration if the Board knows or believes that a
• the Crown and Mercury to enforce the 10% limit; and • Mercury to suspend dividend and voting rights attached to Mercury ordinary shares where the 10% limit is breached. ASX ASX has granted the Company waivers in respect of the ASX Listing Rules to allow the Constitution to contain provisions reflecting the ownership restrictions imposed by the New Zealand Public Finance Act 1989 (“Public Finance Act”) and to allow the Crown to cancel the sale of shares to applicants who acquire shares under the General Offer and are not New Zealand applicants. The majority of the waivers that ASX previously granted to Mercury are no longer relevant following the change of the Company’s admission category to an ASX Foreign Exempt Listing in February 2016. The waivers from ASX Listing Rules 8.10 and 8.11 continue to apply. These waivers permit the Constitution to contain provisions:
51% Holding The Crown must hold at least 51% of the shares on issue. The Company must not issue, acquire or redeem any shares if such issue, acquisition or redemption would result in the Crown falling below this 51% holding. On 10 December 2018, Mercury entered into an agreement with the Crown, under which the Crown agrees to participate in any future dividend reinvestment plan or share buyback of the Company, in each case only to the extent required to maintain the Crown’s proportionate shareholding following the dividend reinvestment plan or share buyback. A copy of the Crown Participation Agreement is available on the Treasury’s website.
NZX Mercury NZ Limited (referred to in this section as “Mercury” or “the Company”) has waivers in respect of NZX Listing Rules 8.1.5 and 8.1.6(b). These waivers permit Mercury’s Constitution (“Constitution”) to contain provisions allowing:
Restrictions on ownership and transfer
person is, or is likely to be, in breach of the 10% Limit. That statutory declaration is required to include, where applicable, details of all persons who have a relevant interest in any shares held by that holder.
• Mercury considers that a person may be in breach of the 10% Limit; or
• receive an equal share with other shareholders in the distribution of surplus assets in any liquidation of the Company;
• a holder of shares fails to lodge a statutory declaration when required to do so or lodges a declaration that has not been completed to the reasonable satisfaction of the Company, then Mercury is required to determine whether or not the 10% Limit has been breached and, if so, whether or not that breach was inadvertent. Mercury must give the affected shareholder the opportunity to make representations to the Company before it makes a determination on these matters.
• ensure that they are no longer in breach within 60 days after the date on which they became aware, or ought to have been aware, of the breach. If the breach is not remedied within that timeframe, Mercury may arrange for the sale of the relevant number of shares on behalf of the relevant holder. In those circumstances, the Company will pay the net proceeds of sale, after the deduction of any other costs incurred by the Company in connection with the sale (including brokerage and the costs of investigating the breach of the 10% Limit), to the relevant holder as soon as practicable after the sale has been completed.
10% Limit
This statement sets out information about the rights, privileges, conditions, and limitations, including restrictions on transfer, that attach to shares in Mercury.
Rights and privileges
Under the Constitution and the New Zealand Companies Act 1993 (“Companies Act”), each share gives the holder a right to:
The Public Finance Act includes restrictions on the ownership of certain types of securities issued by Mercury and consequences for breaching those restrictions. The Constitution incorporates these restrictions and mechanisms for monitoring and enforcing them.
Determining whether a breach has occurred Mercury has the power to determine whether a breach of the 10% Limit has occurred and, if so, to enforce the 10% Limit.
Effect of exceeding the 10% Limit
1142022REPORTANNUALMERCURYTHETEAMBEHINDENERGYFREEDOMMENUWAIVERS FROM THE NEW ZEALAND AND AUSTRALIAN STOCK EXCHANGES
• receive an equal share in any distribution, including dividends, if any, authorised by the Board and declared and paid by the Company in respect of that share;
• be sent certain information, including notices of meeting and the Company reports sent to shareholders generally; and
A person who is in breach of the 10% Limit must: • comply with any notice received from Mercury requiring them to dispose of shares or their relevant interest in shares, or take any other steps that are specified in the notice, for the purpose of remedying the breach; and
Trustee corporations and nominee companies
If a relevant interest is held in any shares in breach of the 10% Limit then, for so long as that breach continues:
1152022REPORTANNUALMERCURYTHETEAMBEHINDENERGYFREEDOMMENU
The Crown may cancel the sale of shares to an applicant under the offer of shares by the Crown (“the Offer”) in the Mighty River Power Share Offer Investment Statement and Prospectus if the applicant misrepresented its entitlement to be allocated shares under the Offer as a ‘New Zealand Applicant’ (as that term is defined in the Share Offer Investment Statement and Prospectus). If the Crown cancels a sale of shares on those grounds:
The proceeds of the sale of any shares sold for being less than a Minimum Holding will be applied as follows:
• the applicant will receive from the sale the lesser of: the sale price for the shares less the costs incurred by the Crown and the Company; and the aggregate price paid for the shares less those costs, with any excess amount being payable to the Crown.
• First, in payment of any reasonable sale expenses.
• Second, in satisfaction of any unpaid calls or any other amounts owing to the Company in respect of the shares.
In certain circumstances, shares could be cancelled by the Company through a reduction of capital, share buy-back or other form of capital reconstruction approved by the Board and, where applicable, the shareholders.
• Mercury must sell shares held by that applicant, up to the number of shares sold to it under the Offer, irrespective of whether or not those shares were acquired by the applicant under the Offer (unless the applicant had previously sold, transferred or disposed of all of its shares to a person who was not an associated person of the applicant); and
If an applicant who misrepresented their entitlement to shares has sold, transferred or otherwise disposed of shares to an associated person, then the power of sale will extend to shares held by that associated person, up to the number of shares transferred, sold or otherwise disposed of to the associated person by the relevant applicant.
DONATIONS Donations of $79,199 were made by the Group during the year ended 30 June 2022 ($92,333 during the year ended 30 June 2021). Under Mercury’s Delegations Policy, donations to political parties are prohibited.
Trustee corporations and nominee companies (that hold securities on behalf of a large number of separate underlying beneficial holders) are exempt from the 10% Limit provided that certain conditions are satisfied. Share cancellation
• The residue, if any, must be paid to the person who was the holder immediately before the sale or his or her executors, administrators or assigns.
Tangible Assets per Share (excluding treasury stock) as at 30 June 2022 was $3.35, compared with $3.00 at 30 June 2021.
OTHER DISCLOSURES.
The Board may refuse to register a transfer of shares if it knows or believes that the transfer will result in a breach of the 10% Limit or where the transferee has failed to lodge a statutory declaration requested from it by the Board within the prescribed timeframe. Crown directions The Crown has the power to direct the Board to exercise certain of the powers conferred on it under the Constitution (for example, where the Crown suspects that the 10% Limit has been breached but the Board has not taken steps to investigate the suspected breach).
Cancellation of sale of shares
OTHER DISCLOSURES Mercury NZ Limited is incorporated in New Zealand and is not subject to Chapters 6, 6A, 6B and 6C of the Corporations Act 2001 (Australia). Mercury will not acquire any classified assets in circumstances in which the ASX Listing Rules would require the issue of restricted securities, without the written consent of OnASX.16August 2022 the Board declared a fully imputed final dividend of 12 cents per share to all shareholders who are on the Company’s share register at 5pm on the record date of 15 September 2022. The dividends will be imputed at a corporate tax rate of 28%, which amounts to an imputation credit of 4.67 cents per share for the final dividend. Mercury will also pay a supplementary dividend of 2.12 cents per share relating to the final dividend to non-resident shareholders. The Company will receive from the New Zealand Inland Revenue Department a tax credit equivalent to supplementary Thesedividends.dividends, together with the interim dividend of $108.9 million (8.0 cents per share) paid to shareholders on 1 April 2022, brings the total declared dividends to $275 million (or 20 cents per share). As at the date of this annual report, the Company has a S&P Global BBB+ rating with a stable outlook. The Company benefits from a one-notch uplift due to the Crown’s majority Mercury’sownership.Net
An exercise of a voting right attached to a share held in breach of the 10% Limit must be disregarded in counting the votes concerned. However, a resolution passed at a meeting is not invalid where votes exercised in breach of the voting restriction were counted by the Company in good faith and without knowledge of the breach.
PUBLIC ENTITY Mercury is a public entity under the Public Audit Act 2001, and the Group's independent auditor is the Auditor-General.
• no votes may be cast in respect of any of the shares in which a relevant interest is held in excess of the 10% Limit; and • the registered holder(s) of shares in which a relevant interest is held in breach of the 10% Limit will not be entitled to receive, in respect of the shares in which a relevant interest is held in excess of the 10% Limit, any dividend or other distribution authorised by the Board in respect of the shares. However, if the Board determines that a breach of the 10% Limit was not inadvertent, or that it does not have sufficient information to determine that the breach was not inadvertent, the registered holder may not exercise the votes attached to, and will not be entitled to receive any dividends or other distributions in respect of, any of its shares.
Sale of less than a Minimum Holding Mercury may, at any time, give notice to a shareholder holding less than a Minimum Holding of shares (as that term is defined in the NZX Listing Rules) that if, at the end of three months after the date the notice is given, shares then registered in the name of the holder are less than a Minimum Holding, Mercury may sell those shares on market (including through a broker acting on Mercury’s behalf), and the holder is deemed to have authorised Mercury to act on behalf of the holder and to sign all necessary documents relating to the Forsale.the purposes of the sale and of Rule 5.12 of the ASX Settlement Operating Rules, where the Company has given a notice that complies with Rule 5.12.2 of the ASX Settlement Operating Rules, the Company may, after the end of the time specified in the notice, initiate a Holding Adjustment to move the relevant shares from that CHESS Holding to an Issuer Sponsored Holding (as those terms are defined in the ASX Settlement Operating Rules) or to take any other action the Company considers necessary or desirable to effect the sale.
102-16
102-2
GRI 103 General disclosures 2022 103-1 Explanation of the material topic and its Boundary Pulling It All Together p15
List of stakeholder groups Company website –Engaging with our stakeholders Identifying and selecting stakeholders Company website –Engaging with our stakeholders
102-10
Supply chain Governance at Mercury: Acting Ethically & Responsibly pp96-97 Significant changes to the organisation and its supply chain Governance at Mercury: Acting Ethically & Responsibly pp96-97
Location of headquarters Directory pp120
Values, principles, standards, and norms of behavior Company website – The Mercury Code 102-18 - 102-39 Governance Governance at Mercury pp83-99
102-11
Activities, brands, products and services Who We Are & Our Business Model pp4-7
102-6
Membership of associations Company website – Engaging with our stakeholders 102-14 Statement from senior decision-maker Chair & Chief Executive Update pp8-11
External initiatives Engaging With Our Stakeholders p13, Enhancing Value For Customers pp19-21, Collective Commitment, Shared Action pp22-24, Commitment To Caring pp25-27
GRI 103 Management approach Our Business Model pp5-7 Within organisationthe REPORTING INITIATIVE (GRI) INDEX.
Name of the organisation Front Cover
GRI standard Disclosure title Location Comments 102-43 to engagementstakeholder Engaging With Our Stakeholders p13, Company website –Engaging with our stakeholders 102-44 Key topics and concerns raised Company website –Engaging with our stakeholders Entities included in the Consolidated Financial statements Notes to the Consolidated Financial Statements p44 102-46 Defining report content and topic Boundaries About This Report p2, Pulling It All Together p15 102-47 List of material topics Pulling It All Together p15 102-48 Restatements of information Financial Statements pp44-65 There are restatementsno of 2021 financial statements in the 2022 reporting period. 102-49 Changes in reporting Mercury continues to use both GRI and <IR> frameworks.reporting 102-50 Reporting period Front Cover 102-51 Date of most recent report Front Cover 102-52 Reporting cycle Front Cover 102-53 Contact point for questions regarding the report About This Report p2, Directory p120 102-54 Claims of reporting in accordance with the GRI Standards About This Report p2 102-55 GRI content index GRI Content Index pp116-118 102-56 External assurance Our 2022 report has not been externally assured.
Precautionary principle or approach Governance at Mercury pp95
Information on employees and other workers Who We Are & Our Business Model pp4-7 102-9
102-12
Scale of the organisation Who We Are & Our Business Model pp4-7
102-3
Markets served Who We Are & Our Business Model pp4-7 102-7
1162022REPORTANNUALMERCURYTHETEAMBEHINDENERGYFREEDOMMENUSTANDARD CORE REPORTING GRI standard Disclosure title Location Comments GENERAL GRIORGANISATIONALDISCLOSURESPROFILE102Generaldisclosures 2022 102-1
Approach
102-42
102-8
102-40
102-13
GLOBAL
MANAGEMENT APPROACH
102-4
Location of operations Who We Are & Our Business Model pp4-7 102-5 Ownership and legal form Company Disclosures pp113
102-45
1172022REPORTANNUALMERCURYTHETEAMBEHINDENERGYFREEDOMMENUSPECIFIC STANDARD DISCLOSURES Material topics Description Location / Comments Boundaries GRI 200 Economic standard GRIseries201 Economic performance GRI 201 Management approach Our Business Model pp5-7 Within organisationthe 201-1 Direct economic value generated and distributed Our Business Model pp5-7 Within and outside the organisation 201-2 Consolidated Financial implications and other risks due to climate change TCFD Report pp66-80 Within and outside the organisation GRI 204 Procurement Practice Supplier Code of Conduct Acting Ethically & Responsibly p96 GRI 207 Tax Tax management Financial Statements Note 5 p49 GRI 300 GRIstandardsEnvironmentalseries303Water 303-1 Water withdrawal by source Mercury does not withdraw water for generation. 6,465 Mm3 were used for hydro generation in FY22. Within and outside the organisation GRI 305 Emissions 305-1 Direct (Scope 1) GHG emissions Metrics & Targets p80 Within and outside the organisation 305-2 Energy indirect (Scope 2) GHG emissions Metrics & Targets p80 Within and outside the organisation 305-3 Other indirect (Scope 3) GHG emissions Metrics & Targets p80 Within and outside the organisation 305-4 Emissions intensity Metrics & Targets p80 Within and outside the organisation GRI 307 Environmental compliance 307-1 Non-compliance with environmental laws and regulations Mercury received one infringement notice for breaches of consent conditions during FY22 Within and outside the organisation Material topics Description Location / Comments Boundaries
GRI 400 Social standards series GRI 401 Employment 401-1 New employee hires and employee turnover
GRI 403 Occupational health and safety 403-1 Workers representation in formal joint management-worker health and safety committees representatives hold a range of positions on health and safety committees, including joint chair of the generation committee. Within organisationthe 403-2 Types of injury or rate of injury, occupational diseases, lost days, and absenteeism, and number of work related fatalities
Workers'
GLOBAL REPORTING INITIATIVE
Our Business Model pp5-7, Evolving Our Culture pp28-30 Financial Track Record p37 Within organisationthe GRI 404 Training and education 404-2 Programmes for upgrading employee skills and transition assistance programmes
Mercury hired 207 new employees and the voluntary turnover rate was 21% Within organisationthe 401-2 Benefits provided to full-time employees that are not provided to temporary or part-time employees Company website – Life at Mercury Within organisationthe 401-3 Parental Leave Company website – Life at Mercury Within organisationthe
Our Skills Pledge p30 Within organisationthe GRI 405 Diversity and equal opportunities 405-1 Diversity of governance bodies and employees Diversity & Inclusion pp98-99 Within organisationthe GRI 413 Local communities 413-1 Operations with local community engagement, impact assessments and development programs Enhancing Value For Customers pp19-21 Collective Commitment, Shared Action pp22-24 Commitment To Caring pp25-27 Within and outside the organisation 413-2 Operations with significant actual and potential negative impacts on local communities Enhancing Value For Customers pp19-21 Collective Commitment, Shared Action pp22-24 Commitment To Caring pp25-27 Within and outside the organisation (GRI) INDEX.
1182022REPORTANNUALMERCURYTHETEAMBEHINDENERGYFREEDOMMENUSECTOR SPECIFIC: UTILITIES Material Topics Description Location Comments Sector Specific Generation Standard Disclosures EU1 Installed capacity Our Business Model pp5-7 Mercury owns or has interests in power stations with installed capacity of: Hydro 1,115MW, Geothermal 470MW, Wind 449MW EU2 Net energy output Our Business Model pp5-7 EU3 Number of customer connections Our Business Model pp5-7 EU5 Allocation of CO2e allowances Metrics & Targets p80 EU10 Planned capacity against projected electricity demand over the long-term Delivering More For Customers and Country pp31-33 Employment EU18 Percentage of contractor and subcontractor employees that have undergone relevant health and safety training Our Skills Pledge p30 Access EU27 Number of disconnections for non-payment Enhancing Value For Customers pp19-21 There were a total of 466 residential disconnections in FY22 due to nonpayment. EU30 Average plant availability by energy source and by regulation regime Hydro 87%, Geothermal 94%, Wind 95% GLOBAL REPORTING INITIATIVE (GRI) INDEX.
INFORMATION
Shareholder enquiries You can view your investment portfolio, change your address, supply your email, update your details or payment instructions online: www.investorcentre.com/nz You will need your CSN and FIN numbers to access this Enquiriesservice.may be addressed to the Share Registrar (see Directory for contact details). Investor information Our website at mercury.co.nz is an excellent source of information about what’s happening within the company. Our Investor Centre allows you to view all regular investor communications, information on our latest operating and financial results, dividend payments, news and share price history. Electronic shareholder communication It is quick and easy to make the change to receiving your reports electronically. This can be done either: • Online at www.investorcentre.com/nz by using your CSN and FIN numbers (when you log in for the first time). Select ‘My Profile’ and ‘Communication Preferences’ to update your details; or • By contacting Computershare Investor Services Limited (see Directory for contact details). SHAREHOLDERS.FOR
1192022REPORTANNUALMERCURYTHETEAMBEHINDENERGYFREEDOMMENU
Paper & ink information Our Annual Report is printed on Eco-100 Natural paper. This environmentally-responsible, carbon-neutral paper is produced using FSC® (Forest Stewardship Council) certified 100% Post Consumer Recycled, Process Chlorine Free (PCF) pulp from Responsible Sources - and manufactured under the strict ISO14001 Environmental Management System. It carries the internationally-recognised Blue Angel, Nordic Swan, Austrian Environmental Label and the NAPM (National Association of Paper Merchants) Recycled Mark. The inks used are mineral-oil-free and are manufactured from vegetable oils and fatty acid alkyl-esters (modified vegetable oils) which are all derived from renewable resources. They all conform to the EuPIA (European Printing Ink Association) exclusion list, so do not contain any carcinogenic, mutagenic, or toxic substances according to the Dangerous substances directive 67/548/EEC. They therefore are biodegradable and will break down when disposed of in suitable waste streams with extremely minimal effect on the environment. As you’re reading, you may notice some specks and imperfections - these are natural attributes of non-chlorinebleached, recycled paper. When you’re finished with this report, please recycle it responsibly.
1202022REPORTANNUALMERCURYTHETEAMBEHINDENERGYFREEDOMMENUBoard of Directors Prue Flacks, Chair Dennis KimLorraineMikePatrickScottJamesAndyHannahBarnesHamlingLarkMillerStJohnStrangeTaitokoWittenGordon(Future Director) Executive Management Team Vince Hawksworth, Chief Executive Lucie OperationsGeneralCraigChiefWilliamChiefJuliaGeneralStewartGeneralPhilGeneralDrummond,ManagerSustainabilityGibson,ManagerPortfolioHamilton,ManagerGenerationJack,MarketingOfficerMeek,FinancialOfficerNeustroski,ManagerCommercial2FionaSmith,GeneralManagerCustomerOperations2MarleneStrawson,GeneralManagerPeople&Performance1.Appointmentiseffective1September 2022 2. Titles effective from 1 July 2022 Company Secretary Howard Thomas, General Counsel and Company Secretary Investor Relations & Sustainability Enquiries William Meek, Chief Financial Officer Phone: +64 27 517 3470 Email: investor@mercury.co.nz Registered Office in New Zealand Mercury NZ Limited 33 Broadway, Newmarket, Auckland 1023 P O Box Auckland903991142NewZealand Registered Office in Australia c/– TMF Corporate Services (Australia) Pty Limited Suite 1, Level 11, 66 Goulburn Street, Sydney, NSW 2000 Phone: +61 2 8988 5800 Legal Advisors Chapman Tripp Level 34 PwC Tower at Commercial Bay 15 Customs Street West Auckland 1010 PO Box Phone:Auckland22061140+649357 9000 Bankers ANZ Bank ASB IndustrialCommonwealthChinaBankBankBankofChinaofNewZealandConstructionBankBankofAustraliaandCommercialBankof China MUFG WestpacMizuhoBankBank Credit Rating (re-affirmed November 2021) Long-term: BBB+ Outlook: Stable Share Registrar – New Zealand Computershare Investor Services Limited Level 2, 159 Hurstmere Road, Takapuna, Auckland 0622 Private Bag 92119 Victoria Street West Auckland 1142, New Zealand Phone: +64 9 488 8777 Email: enquiry@computershare.co.nz Web: www.investorcentre.com/nz Share Registrar – Australia Computershare Investor Services Pty Limited Yarra Falls, 452 Johnston Street, Abbotsford, VIC GPO3067Box 3329, Melbourne, VIC 3001, Australia Phone: 1 800 501 366 (within Australia) Phone: +61 3 9415 4083 (outside Australia) Email: enquiry@computershare.co.nz DIRECTORY.
CPS Cents per share. EBITDAF (or Operating Earnings) Earnings before net interest expense, tax expense, depreciation, amortisation, change in the fair value of financial instruments, gain/(loss) on disposal and impairments. Energy Margin Sales from electricity generation and sales to customers and derivatives, less energy costs, line charges, other direct costs of sales, and third-party metering.
Underlying Earnings After Tax Profit for the year after removing one-off and/or infrequently occurring events (exceeding $10 million of profit before tax, which represents material items), impairments, any change in the fair value of derivative financial instruments and gain on sale, all net of tax expense. Mercury presents certain non-GAAP (Generally Accepted Accounting Practice) financial information throughout the annual report. This is provided where we believe it will provide greater clarity to users of the information. It also provides consistency across reporting periods and comparability amongst industry peers.
Free Cash Flow
CO2E Carbon dioxide equivalents (a measure of total greenhouse gases).
1212022REPORTANNUALMERCURYTHETEAMBEHINDENERGYFREEDOMMENU
Net cash flow from operating activities less stay-in business capital expenditure. Growth Capital Expenditure (CAPEX) Capital expenditure incurred by the company to create new assets and revenue. GWh Gigawatt hour. One gigawatt hour is equal to one million kilowatt hours. MWh Megawatt hour. One megawatt hour is equal to one thousand kilowatt hours. Net Debt Total borrowings (both current and non-current) less cash and cash equivalents. Operating Costs Represents employee compensation and benefits, maintenance expenses and other expenses. Other Income Earnings of associates and other revenue, less direct costs of other revenue.
GLOSSARY.
Stay-in-Business (SIB) Capital Expenditure (CAPEX) Capital expenditure incurred by the company to maintain its assets in good working order. Total Recordable Injury Frequency Rate (TRIFR) A record of the number of reported medical treatment, restricted work, lost time and serious harm injuries per 200,000 hours, including employees and on-site contractors. Total Shareholder Return (TSR) The financial gain or loss resulting from the change in share price plus any dividends paid expressed as a percentage of the initial share price.
The name Karāpiro is ‘karā’ meaning rock, and ‘piro’ meaning putrid smell. In the 1820s the Ngāti Maru tribe from the Hauraki Gulf were driven south by Northland’s Ngāpuhi tribe. Ngāti Maru were given refuge in the Waikato by the Ngāti Haua tribe, but tensions mounted between them. This culminated in the battle of Taumatawīwī in 1830. The cremation of dead warriors took place on rocks beside the Waikato River.
The name Kawerau means "carrier of leaves" (and was the name of an ancient Māori chief). Mahinerangi Named after Lake Mahinerangi, the adjacent Manawa hydro asset lake. Maraetai The name means meeting place by the sea, from "Marae” (meeting place) and “Tai” (tide or shore). This name was possibly transplanted from somewhere on the coast. Mokai Meaning slave or captive (i.e. captured in battle). Nga Awa Pūrua The station was named after the rapids, located nearby on the Waikato River. Nga Awa Purua means "where the waters meet". Ngā Tamariki “The children”. Ōhakuri “Oha” means keepsake or relic and “kuri” means dog. This name may refer to a prized dogskin cloak.
Rotokawa From “kawa” meaning bitter and “roto” meaning lake or wetlands/swamp.
Aratiatia Aratiatia means a series of pegs stuck into a steep ascent in a zig-zag pattern to make climbing easier. It may also refer to the travels of the ancestral explorer Tia of the Arawa canoe who made his way to these rapids while exploring the Waikato River.
The name is taken from the range where the wind farm is located. The metaphorical union between people and the land, Papatūānuku, is seen in places named after parts of the human body. The Tararua Range was declared to be Te Tuarātapu-o-Te Rangihaeata (the sacred back of Te Rangihaeata) to commemorate a peace arrangement between Ngāti Toa and Ngāti Kahungunu. The range became a dividing line between Ngāti Toa on the west side and Ngāti Kahungunu on the east.
Kawerau
OUR POWER STATIONS AND WIND FARMS
1222022REPORTANNUALMERCURYTHETEAMBEHINDENERGYFREEDOMMENU
Turitea “Bright clear water." Waipāpa “Wai” means water, “papa” means flat or flat rock. The name possibly means the “stream across the plain” or “stream of the flat rock”.
The power stations and wind farms generating renewable energy for New Zealand homes and businesses have names reflecting past stories and histories.
Whakamaru Whakamaru means to give shelter to, or safeguard.
Tararua
Arapuni “Ara” means path and “puni” means either blocked up or campsite. The meaning may be either “pathway to campsite” or “blocked path”.
RĀRANGI INGOA LIST OF NAMES.
Karāpiro
Waipipi Waipipi Stream runs through the site and the Iwi land is known as Waipipi.
Ātiamuri A-Tia-Muri literally means turned back and refers to Tia of the Arawa canoe. This intrepid traveller had to turn back at the Atiamuri Rapids in his early explorations of the Waikato River. Legend also says that Tia was petrified into a large stone in the river rapids.
To learn about how we provide the energy behind the things that make your life easier, www.mercury.co.nz/why-mercuryvisit Say kia ora to the Wonders, our yellow-clad team who provide the power to everything you need at home, connect you to the world, and keep you moving.


