COMPUTER PROJECT EXERCISES
POM+ Project
Blue Zuma Project Conveyor Belt Project
The POM+ Project (POM+) is new to this edition while versions of Blue Zuma Project (BZ) and Conveyor Belt Project (CBP) computer exercises appeared in previous editions. Video tutorials have been created for BZ which detail both how to complete each part of the exercise as well as appropriate answers. These tutorials are available at the publisher’s instructor website. Each exercise is designed to help students apply the concepts and principles presented in the textbook. Moreover, students will learn how to use commercial project management software to develop their own project information system.
During the course of the exercises, students have to apply more and more of the concepts which are presented in the textbook. While each exercise introduces those features presented in the accompanying chapter, it also relies on previous work. Eventually, the system gets bigger and more complicated until the student has developed a project information system. This step-by-step method supports gradual understanding of the building blocks for successful application of an integrated project information system. We recommend that instructors use these exercises in parallel to specific chapters and not as a final examination.
Which exercise to use? The POM+ is designed to be less complicated and easier than the CBP. POM+ contains half the number of activities/summary tasks of CBP. While both exercises address similar issues, the resource allocation problems in POM+ are less complex than the CBP. Likewise, POM+ requires only two status reports instead of the four quarterly reports for the CBP.
BZ is similar to POM+ in scale and focus, except it requires only one status report and does not contain a detailed WBS. What makes BZ unique is the availability of video tutorials that detail step-by-step how to use MS Project to complete the assignment as well discusses appropriate answers. These video tutorials were developed to support online instruction. They can be used to support completion of BZ project as well as serve as a reference for completing either the POM+ or CBP exercises.
Choice depends upon how confident the instructor is in his/her command of MS Project and the experience of the students. Students with project management experience may find the POM+ or BZ too simple. Instructors who are teaching project management for the first time and/or have little experience with MS Project should probably use the ZP
Appendix C
Project Management The Managerial Process 5th Edition Larson Solutions Manual Full Download: http://testbanktip.com/download/project-management-the-managerial-process-5th-edition-larson-solutions-manual/ Download all pages and all chapters at: TestBankTip.com
exercise. Here they can privately use the video tutorials to master the exercise. The videos can also be used to provide feedback to students. We strongly recommend restricting access to these tutorials to only students registered for a specific course to prevent solutions from leaking out to other students at other universities. When using BZ, instructors should heed the advice given in the review of answers and provide students with additional guidance during the tricky Part 3 section.
POM+ presents similar resource problems as BZ and is recommended if the instructor believes solutions to the older exercises are available through informal student channels.
Another option is to use the cases that require MS Project to solve. These cases include: Nightingale Project, Greendale Stadium Case, Whistler Ski Resort Project, CyClon Project, Optical Disk Preinstallation, Advanced Energy Technology Data Center Migration and/or Whitbread World Sailboat Race.
Each major exercise is discussed in turn. The exercises themselves will not be repeated since they are contained in the textbook. Rather, we will provide hints on how to solve the problems, discuss possible “traps” or questions, and provide examples of successful solutions. Some of the managerial implications will be discussed to provide you with specific thoughts related to each exercise.
Software. Presented solutions were achieved using Microsoft Project. These exercises are, however, not software-dependent. Students should be able to use any of the major project management software programs to complete the exercises. In order to solve the exercises the software should be capable of the following:
Include up to 30 different activities (including deliverables and the project itself) with name, predecessors, duration, and resources (including hourly rates and capacity constraints)
Code the project activities
Schedule a project, using duration, predecessors, and resources
Develop and print an AON Chart of the project
Develop and print a Gantt Chart of the project
Perform a leveling option (resource constrained) for overallocated resources
Calculate the costs of different activities and resources for different times
One advantage that Microsoft Project provides is an excellent tutorial program that allows students to learn the program while working on the exercises. This tutorial is supplemented by a set of video tutorials contained in the student CD-ROM which demonstrates the major steps in using MS Project. Our experience suggests that most students are capable of mastering the program to solve the exercises on their own with minimal directions from the instructor if they follow the tutorials. Problems emerge when they deviate from the tutorial and try to use the software on their own.
Relevant copies of MS Project files pertaining to different parts of the exercises are included in the teacher’s CD-ROM and noted when relevant. In some cases documents
2 PROJECT MANAGEMENT: THE MANAGERIAL PROCESS
produced by MS Project are included in the teacher’s manual, but for the most part instructors will need to access designated files to obtain specific information. We strongly recommend that you create back-ups for all these files before accessing them just in case they get altered during use.
Check the author’s Web site for further hints and advice for using these exercises:
http://www.bus.oregonstate.edu/faculty/bio.htm?UserName=Larson
Appendix C: Computer Project Exercises
3
POM+ PROJECT COMPUTER EXERCISE
Relevant copies of MS Project files pertaining to different parts of the exercise are available from the text instructor Web site (see POM+ folder). Instructors will need to access designated files to obtain specific information and generate documents similar to those presented in the teacher’s manual. We strongly recommend that you create backups for all these files before accessing them in case they get altered when using them.

The first step is to insert the WBS into Microsoft Project. Since all of the information is provided there should be no major problems. Figure POM-1 depicts the WBS.
The next step is to enter the estimated durations and predecessor information to create a preliminary schedule for the project. POM1 contains this file. Figure POM-2 depicts the network diagram while POM-3 contains the Entry Table and Gantt Chart. Figure POM-4 contains the schedule table.
4 PROJECT MANAGEMENT: THE MANAGERIAL PROCESS
Part 1 - FILE: POM1
Figure POM-1: WBS
Hint: Students who try to use the “Network” option will be frustrated by the inability to arrange the boxes so that they clearly display the flow of activities. To rectify this problem one can select “Layout” under “Format” and click the “allow manual box positioning” box and shortening the spacing parameters. Students can then proceed to efficiently arrange the boxes and fit it to a page by adjusting % scale or fit to # desired pages in “Page Setup - page”. To further help students, it is also possible under the same option window used to “allow manual box positioning” to select a “straight” link style, which will alleviate the links between boxes from overlapping.


Appendix C: Computer Project Exercises 5
Figure POM-2: Network Diagram
Figure POM-3: Entry Table and Gantt Chart
a. When is the project estimated to be completed? How many working days will it take?
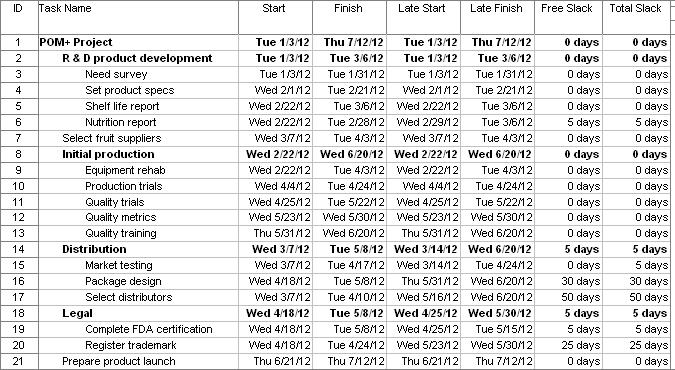
The project is expected to be completed on July 12, 2012 and will take 135 days to complete.
b. What is the critical path?
There are two interconnected critical paths:
Need survey + Set product specifications + Equipment rehab +Production trials Quality trials + Quality metrics + Quality training + Prepare product launch
Need survey + Set product specifications + Shelf life report + Select fruit suppliers + Production trials + Quality trials + Quality metrics + Quality training + Prepare product launch
c. Which activity has the most total slack?
Select distributors has 50 days total slack.
6 PROJECT
PROCESS
MANAGEMENT: THE MANAGERIAL
Figure POM-4: Schedule Table
d. How sensitive is this network?
Fairly sensitive since there are two interconnected critical paths and 3 noncritical activities have only 5 days of total slack each.
e. Identify two sensible milestones and explain your choice.
Both Set product specs and Select fruit suppliers are critical burst activities so the completion of each of these activities would be good choices. Students may need to be reminded that a milestone is not a task but an event (i.e., start or finish).
At this stage resources and their impact on the project are introduced. Since very few projects do not encounter some sort of resource constraint their consideration is a crucial part of project management.
Note: That when students assign more than one resource to an activity the software automatically divides the duration by the number of resources. They should be reminded to restore the original duration after adding resources.
1. Which if any of the resources are over-allocated?
Marketing, R&D, and Legal are over-allocated
2. Assume that the project is time constrained and try to resolve any over-allocation problems by leveling within slack. What happens?
Marketing and Legal are no longer over-allocated. R&D is still overallocated.
3. What is the impact of leveling within slack on the sensitivity of the network?
Due to the unresolved R&D allocation conflict, Nutrition report is now part of the original interconnected critical paths. Sensitivity has been furthered increased due to the total slack for Select distributors being reduced from 50 days to just 5 days and Register trademark being reduced from 25 days to 10 days. These changes illustrate how leveling within slack tends to compress the project network and increase network sensitivity.
Include a Gantt chart with the schedule table after leveling within slack (see Figure POM5 and Figure POM-6)
Appendix C: Computer Project Exercises 7
Part 2 - FILE: POM2
4. Assume the project is resource constrained and resolve any over-allocation problems by leveling outside of slack. What happens?
R&D is no longer over-allocated and project completion date has been extended by five days to July 19, 2012. The reduction in total slack in Register trademark and Select distributors remains. Notice that Shelf life report and Equipment rehab no longer appear to be marked as a critical activity. In the case, Equipment rehab the new schedule has created 5 days of “real” slack. The same is not true for Shelf life report! MS Project determines critical paths based solely on technical (predecessor) dependencies. What often emerges when


8 PROJECT MANAGEMENT: THE MANAGERIAL PROCESS
Figure POM-5: Schedule Table after Leveling within Slack
Figure POM-6: Gantt Chart after Leveling within Slack
resources are leveled are resource dependencies. In this case, there is no technical dependency between Shelf life report and Nutrition report, however, there is a resource dependency. Both activities require the only 3 R&D staff available to the project. Hence, a delay in Shelf life report would cause a delay in the start of Nutrition report and extend the critical path. This is an important example of the difference between task and resource dependency. Within the Critical Chain Project Management (CCPM), Shelf life report would be part of the critical chain of the project.


Appendix C: Computer Project Exercises 9
Figure POM-7: Schedule Table after Leveling outside of Slack
Figure POM-8: Gantt Chart after Leveling outside of Slack
Part 3 - FILE: POM3
1. How much will the project cost? What is the most expensive activity?
The project is estimated to cost $1,692,000.00. Equipment rehab is the most expensive activity accounting for roughly 31% of the total cost of the project ($528,000)
2. What does the cash flow statement tell you about how costs are distributed over the lifespan of the project?
Twenty-seven percent of the total costs are expected to occur in March while only six percent of the costs occur during the first month of January (see Figure POM-9).

10 PROJECT MANAGEMENT:
MANAGERIAL PROCESS
THE
0 50000 100000 150000 200000 250000 300000 350000 400000 450000 500000
Figure POM-9: Total Estimated Costs by Month
The monthly cash flow is displayed in Figure POM-10.


Appendix C: Computer Project Exercises 11
Figure POM-10: Monthly Cash Flow
PART 4
Students are asked to generate two status reports and interpret performance indices associated with project progress. Note: there will be a tendency to rely heavily on the earned value statistics generated by the software. While these statistics provide valuable information with regards to costs they are less useful in terms of schedule. Students should be encouraged to assess actual and planned schedule to determine in “real time” how far ahead or behind the project is. The Tracking Gantt chart and the Variance Table are very useful for doing this.
The EACf or FAC (Forecast cost at completion) can be found in the Earned Value table as simply EAC.
The CPI and TCPI can be obtained from the Earned Value Cost Indicators Table.
The PCIB and PCIC will have to be calculated by hand.
How many days ahead or behind the project can be obtained from the Variance Table.
Hint: Students should be told to enter the tracking information from the tables presented in the text from left to right. For completed activities, first enter the start date, then the finish date. For incomplete activities, first enter the start date, then the actual duration and lastly the remaining number of days. Students should double check to make sure the information in the Tracking Table is identical to what is in the text.
Students often forget to insert the correct status date in the Project Information box.
A problem that sometimes occurs is that when a file is saved the status report date is not saved and has to be re-entered!
Part 4A - FILE: POM4a
Below is a sample status report. Students should be discouraged from providing information point by point (1…2…3…) and instead submit a coherent report.
During the first three months the project is experiencing cost over-runs and is not on schedule. It is important given the priority matrix for POM+ that students focus on the need for better cost control. At the same time, bright students will identify the potential problems surrounding the delay in Market testing
12 PROJECT MANAGEMENT: THE MANAGERIAL PROCESS
To: Conner Gage
From: Percy Young
Re: March 31 status report
COST CV= -$73,831
CPI= 0.87
The project is currently 4% over budget. The most significant cost over-runs were Need survey (-$6,400) and Set product specs (-$11,520). Equipment rehab which is not completed is expected to be at least $57,831 over-budget. Shelf life report met budget while Nutrition report is the only activity to be completed under-budget (+$ 1,920).
The POM+ project is only getting 87 cents of planned work for each dollar spent. If this continues, then the EACf would be $1,943,164, and POM+ will be $251,164 over budget. The TCPI indicates that that the project will have to earn ($1.07) for each dollar spent to come within budget.
SCHEDULE SV= -$193.671 5 days behind schedule
The project is five days behind schedule and is now expected to be completed on July, 26, 2012. The Need survey took 2 days longer than planned while Set product specs took an extra 3 days. Both were on the critical path. It is expected that Equipment rehab will take 5 days longer than planned. There is $193,671 worth of work that was supposed to have been done by this time that has not been done. This is largely due to the delays in the previously mentioned activities and that Market testing has not begun yet. The delay in Market testing deserves attention since it originally 5 days of slack has been reduced to one day of slack. The delay in Market testing threatens the creation of a new critical path.
According to both the PCIB and the PCIC the project is roughly 29 percent complete.
Conclusion: The project is both behind schedule and over-budget. The latter is serious since the budget for the project is constrained. Every effort should be made to complete the remaining work more efficiently without compromising quality. Management needs to start Market testing soon to reduce further delays.
Appendix C: Computer Project Exercises 13
Below is a sample status report. Significant improvement in cost management has occurred since the last report and POM+ is now slightly under budget. Schedule performance is a bit more complex, since there has been a shift in the critical path. Bright students will focus on the consequences of delaying the start of Market testing.


14 PROJECT MANAGEMENT:
MANAGERIAL PROCESS
THE
Figure POM-11: Earned Value Table for March 31, 2012
Figure POM-12: Tracking Gantt Chart for March 31, 2012
Part 4B - FILE: POM4b
To: Conner Gage
From: Percy Young
Re: May 31 status report
COST CV= +$13,949 CPI= 1.01
The project has enjoyed significant cost savings since the March 31st report and is now $13,949 under budget. The CPI of 1.01 suggests that we are on budget. Significant savings across the board have more than made up for the cost over-runs that occurred during the first 3 months. The biggest savings occurred in Market testing ($12,800) and Quality trials ($8,640), while Package design ($6,240), and Complete FDA certification ($2,880) were also under budget. It should be noted that work on Equipment rehab was turned around and instead of the forecasted $58,000 deficit, it was only $17,600 over budget. The forecasted cost at completion is now $1,672,182 with a projected savings of $19,818. The TCPI indicates that the project will only have to earn 97 cents on each remaining dollar spent to come in on budget.
SCHEDULE SV= -$41,091 6 days behind schedule
The project is currently six days behind schedule and is now expected to be completed on July 27, 2012. Despite time savings recorded across the front, there is roughly $41,000 worth of planned work that has not been accomplished. The source of the problem can be traced to the late start of Market testing which eventually caused a delay in the start of Complete FDA certification work. Given the 25 day lag for the FDA application to be processed, this link is now predicted to cause the 6 day delay in the start of the final Prepare product launch activity. This delay has also given the once critical Quality Training activity 5 days of total slack. In essence, the critical path has shifted.
According to both the PCIB and the PCIC the project is 70% complete.
Conclusion: The project team should be commended for its efforts over the past few months to reduce costs. With two-thirds of the project completed the POM+ project stands a good chance of being completed within budget. With regards to schedule, the completion delay is tolerable given the priorities of the project. Every effort should be made to sustain the positive momentum without compromising quality.
It should be pointed out to students that both Complete FDA certification and Register trademark require governmental approval (the source of the FS lags) and is outside the direct control of the project team. Delays in processing could further extend the completion date.
Appendix C: Computer Project Exercises 15


16 PROJECT
MANAGEMENT: THE MANAGERIAL PROCESS
Figure POM-13: Earned Value Table for May 31, 2012
Figure POM-14: Tracking Gantt Chart for May 31, 2012
BLUE ZUMA PROJECT COMPUTER EXERCISE
Relevant copies of MS Project files pertaining to different parts of the exercise are available from the text instructor Web site (see BZ folder). Instructors will need to access designated files to obtain specific information and generate documents similar to those presented in the teacher’s manual. We strongly recommend that you create backups for all these files before accessing them in case they get altered when using them.
Video tutorials that provide step-by-step instructions for completing the exercise as well answers are also available at the publisher’s text instructor Web site (see Blue Zuma video folder). They can be uploaded to course websites to provide additional support and feedback.
Part 1
File: Blue_Zuma_P1
This exercise deals with using software to create a preliminary schedule of the project based on the information provided in Table A2.1 Part 1.
1. When is the project estimated to be completed? How long will the project take?
The project is scheduled to be completed on 12/22/08 and will take 250 days.
2. What is the critical path for the project?
Market analysis Product design Product design selection Detailed product design Test prototype Finalized product design Order production equipment
Install production equipment Celebrate
3. What activity has the greatest amount of slack?
Detailed marketing plan has 159 days of free slack.
4. How sensitive is this network?
Sensitivity is defined as the likelihood that the critical path(s) will remain stable during the completion of the project. It is a function of the amount of slack noncritical activities has as well as the number of different critical paths.
The network is not very sensitive. There is only one critical path and free slack ranges from 20 days to 159 days.
5. Identify two sensible milestones and explain your choices.
Appendix C: Computer Project Exercises 17
Milestones are appropriate checkpoints that provide an indication of progress on the project. All other things being equal the start of critical merge activities and the completion of critical burst activities are useful milestones. As such we recommend the finish of “Product design selection” and “Finalized product design.” Moreover the names of these activities imply importance by themselves.
18 PROJECT
MANAGEMENT: THE MANAGERIAL PROCESS
6. Compare the advantages/disadvantages of displaying the schedule as a network versus a Gantt chart.

Network schedules more clearly illustrate the relationship between different activities and the critical path. They can report precise information in each box (i.e., duration, early start, etc.). Gantt charts are easy to understand and provide a clear overview of the project schedule according to calendar dates.
Include the following printouts (see attached figures and tables):
Gantt Chart (see Figure Z-1) – Students will need to change the timescale by clicking “Format” and then “Timescale” and changing the options to quarters and months.
Appendix C: Computer Project Exercises 19
Network Diagram (see Figure Z-2) – Students will need to select the “Format” menu item and then access “Layout” to click the “Allow manual box positioning” option so that they can move the nodes around. In order to get a copy of the network on one page they will have to adjust the page by 35% when selecting the “Page Setup - Page” option. Another useful method to reducing the number of pages in MS Project documents is to go to “Page Setup – Page” and choose the “Fit to # pages” options

20 PROJECT MANAGEMENT:
THE MANAGERIAL PROCESS
5th Edition Larson Solutions Manual Full Download: http://testbanktip.com/download/project-management-the-managerial-process-5th-edition-larson-solutions-manual/ Download all pages and all chapters at: TestBankTip.com
Project Management The Managerial Process
