
CREB Monthly Statistics Presented By Jay Johnson
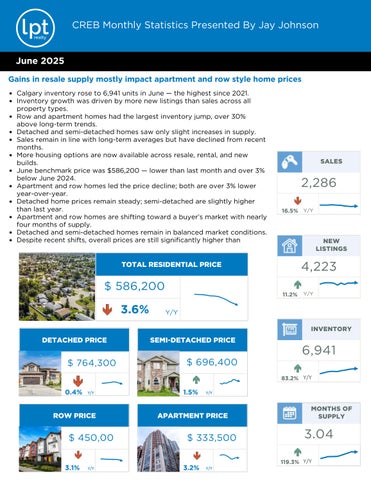
Gains in resale supply mostly impact apartment and row style home prices
Calgary inventory rose to 6,941 units in June the highest since 2021 Inventory growth was driven by more new listings than sales across all property types.
Row and apartment homes had the largest inventory jump, over 30% above long-term trends.
Detached and semi-detached homes saw only slight increases in supply. Sales remain in line with long-term averages but have declined from recent months
More housing options are now available across resale, rental, and new builds
June benchmark price was $586,200 lower than last month and over 3% below June 2024
Apartment and row homes led the price decline; both are over 3% lower year-over-year.
Detached home prices remain steady; semi-detached are slightly higher than last year.
Apartment and row homes are shifting toward a buyer’s market with nearly four months of supply
Detached and semi-detached homes remain in balanced market conditions Despite recent shifts, overall prices are still significantly higher than


SALES NEW LISTINGS INVENTORY MONTHS OF SUPPLY 3.04 2,286 4,223 6,941
CREB Monthly Statistics Presented By Jay Johnson

Detached
June sales were 1,194 units down 6% from both last month and last year
Most sales declines were in higher-priced resale homes, likely due to competition from new builds
Largest sales drops occurred in City Centre and North East (over 20%)
Year-over-year sales increased in the West and South East districts
Inventory and new listings rose across most price ranges and areas
Only the North East district is currently in a buyer’s market, with prices down 4% from last June
Calgary’s June benchmark price was $764,300 less than 1% lower than both last month and last year


Semi-Deta ched Row
Sales activity continued to slow in June, leading to a year-to-date drop of nearly 12%
New listings have increased compared to last year, boosting inventory and moving the market toward balanced conditions
Months of supply rose to 2 6 a major improvement from last year’s tight market
More supply has slowed price growth for semi-detached homes
June benchmark price for semidetached homes was $696,400 flat from last month but 1% higher than last year
Prices varied by district:
City Centre prices are over 3% higher year-over-year and at record highs
North, North East, and East districts saw prices over 2% lower than last year and 3% below their peak
Sales-to-new-listings ratio dropped to 50% in June, leading to rising inventory Inventory reached 1,167 units by month-end
Months of supply increased to over 3 months, signaling a shift in market conditions
Supply varies by district: nearly 6 months in the North East, 2 5 months in the North West
Higher supply is putting downward pressure on prices
June benchmark price was $450,300 down from last month and 3% lower than last year
Price trends vary by area: City Centre prices are stable, just 1% below last year’s peak
North East prices dropped nearly 6% year-over-year
Apartment
Both new listings (1,024) and sales (532) declined compared to last month and last year
Inventory continued to rise, pushing months of supply to nearly 4 months
Slower international migration is reducing housing demand, especially for apartment-style homes
Increased supply in both new and resale markets is putting downward pressure on prices
June benchmark price for apartment homes was $333,500 over 3% lower than last year
All districts saw price declines, with the largest drops in the North East, North, and South East


CREB Monthly Statistics Presented
$1,705,647,786
CREB Monthly Statistics Presented By Jay Johnson
Total Sales
Total Sales
Total
Sales to New Listings Ratio