
NEARLY ZERO MEGA BUILDING
This project, part of the MSc Sustainable Mega Design program, focused on optimizing a tall building into a nearly zero-energy building. The goal was to minimize operational carbon through a three-phase design process. Phase 1 analyzed an existing building's energy consumption to establish a baseline. Phase 2 focused on passive design strategies to reduce energy needs, while Phase 3 designed building services to further improve efficiency.
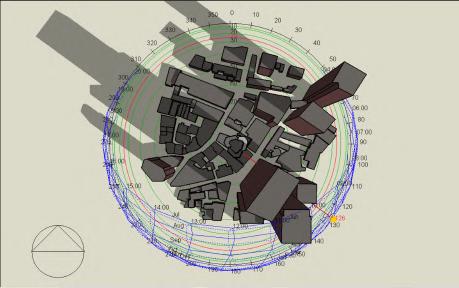
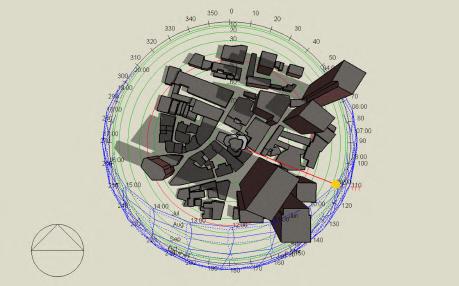
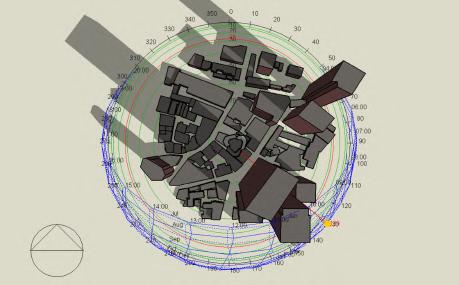
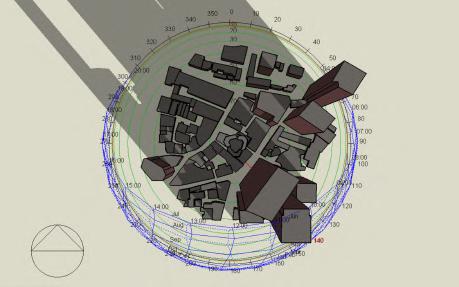
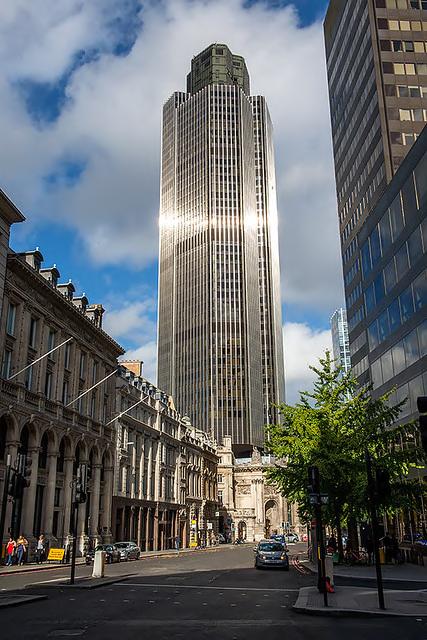

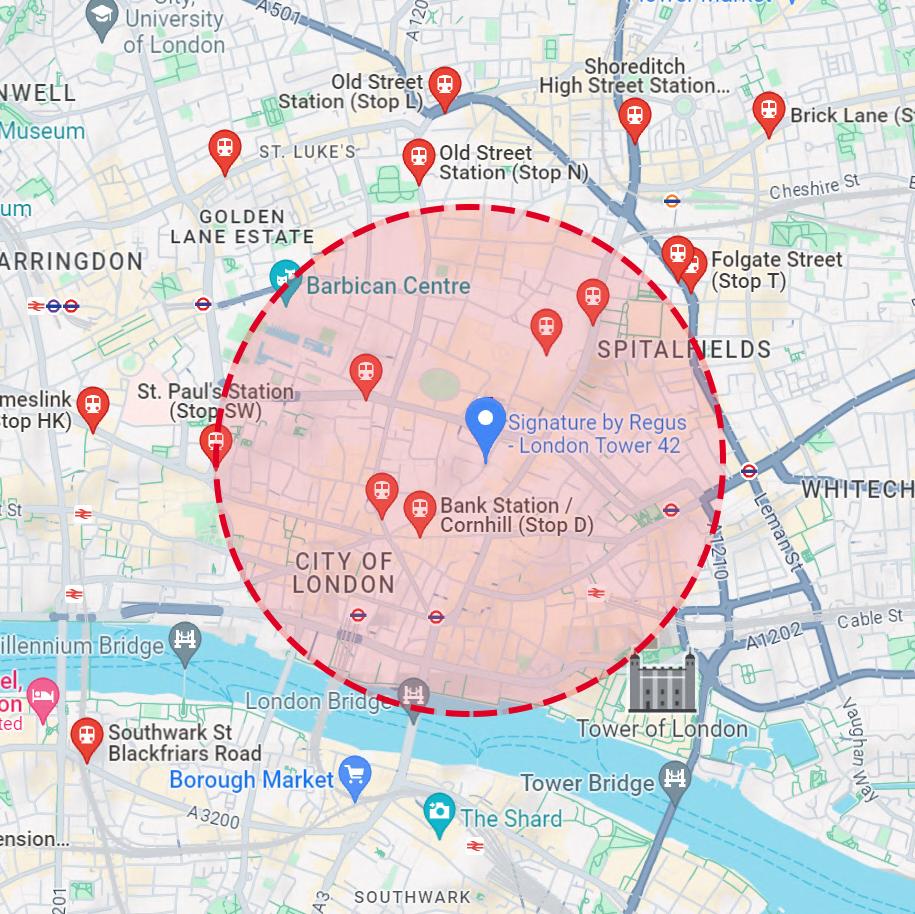
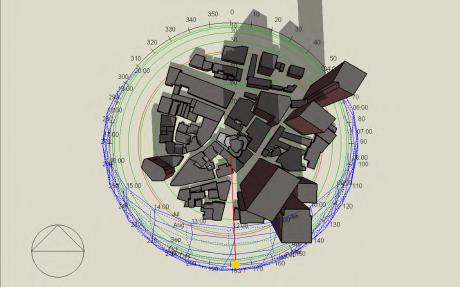
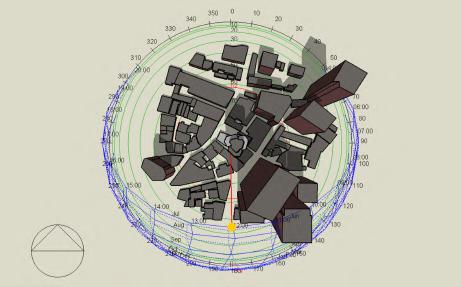
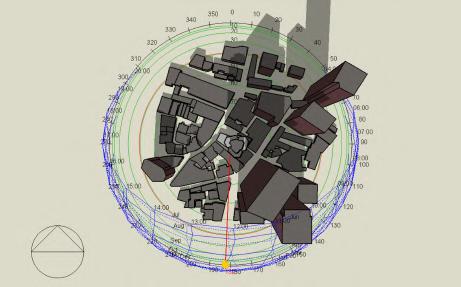
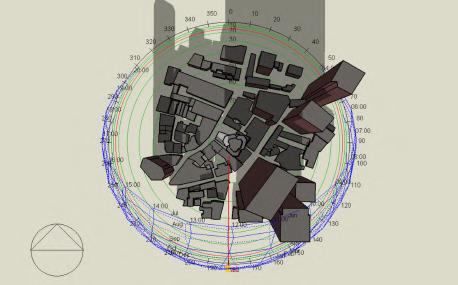
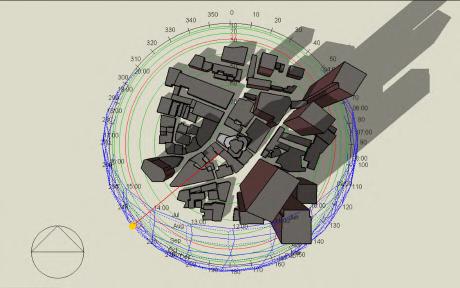
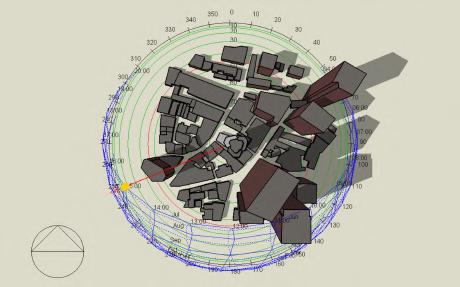
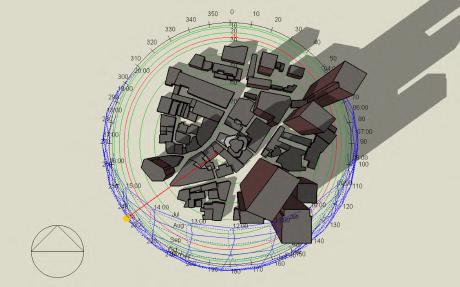
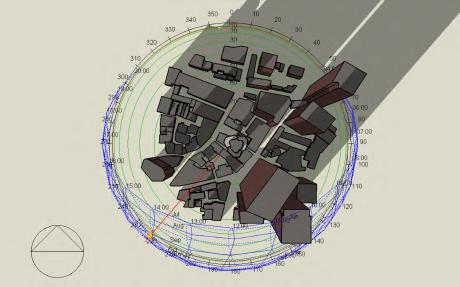


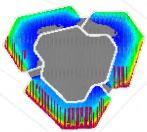
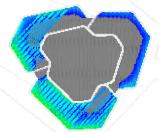


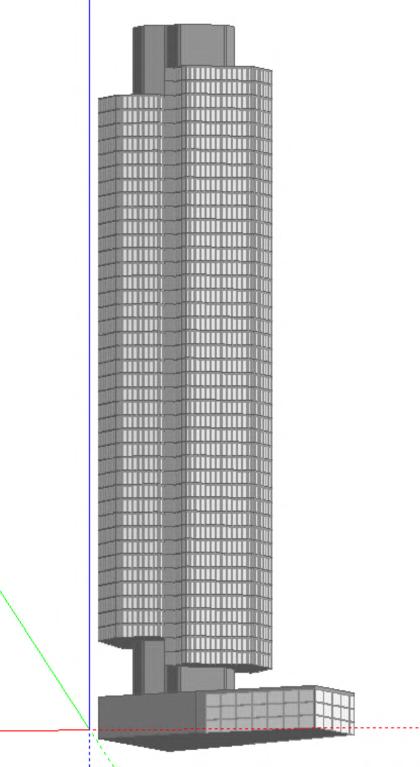
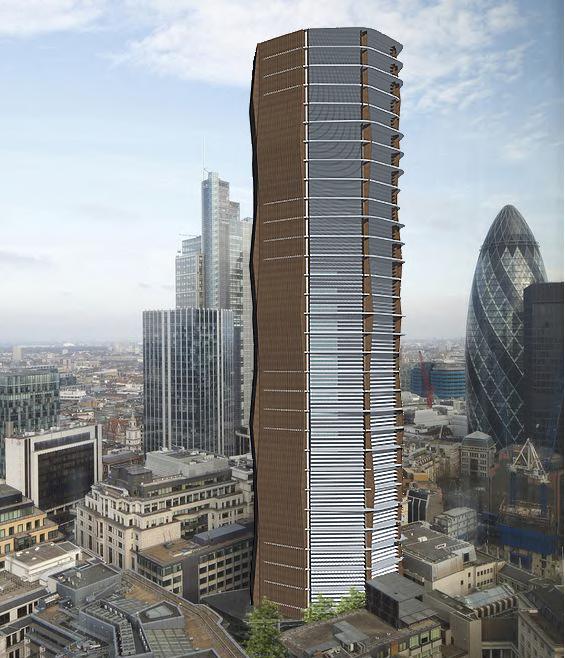
Shadow analysis is generally carried out to check the effect of the building shadow on adjacent buildings, and analyse if it effects their daylight, solar radiation etc. In case of Tower 42, the buildings around it are equally tall or taller, casting deeper shadows, which even effect the daylight and solar radiation of tower 42. The shadoow analysis through different months show us that the certain parts of souther wing and eastern wings of the office building are under the shadow of the taller building, Horizon 22.
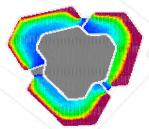
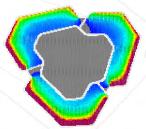
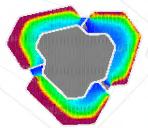
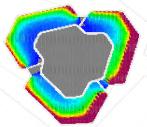
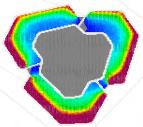
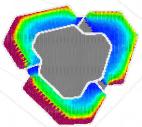
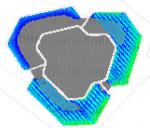
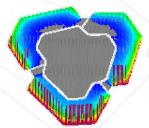
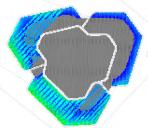
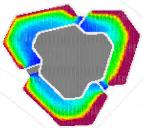
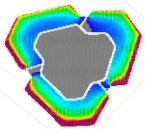
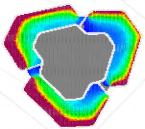
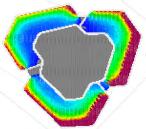
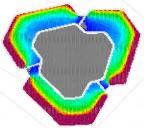
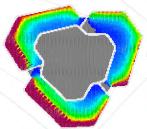
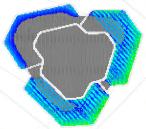
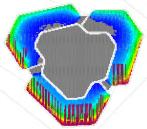
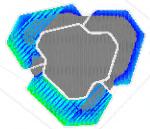
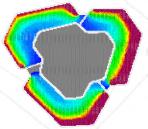
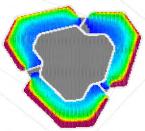
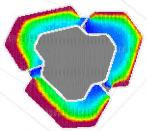
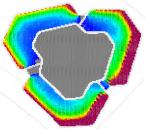
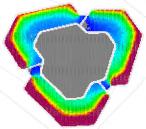
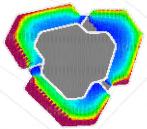
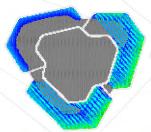
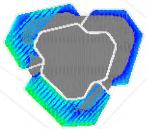
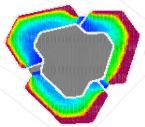
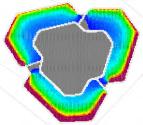
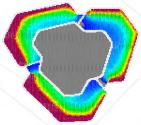
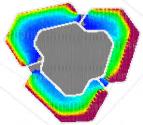
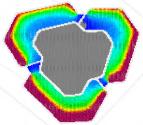
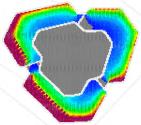
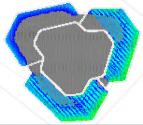
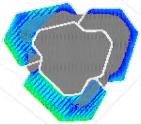
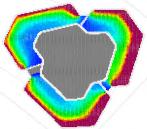
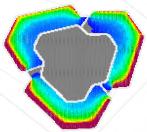
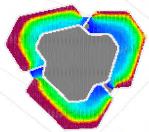
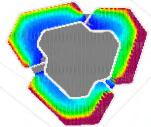
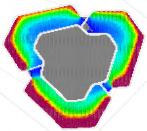
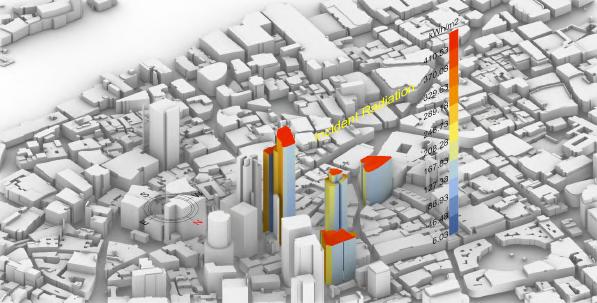
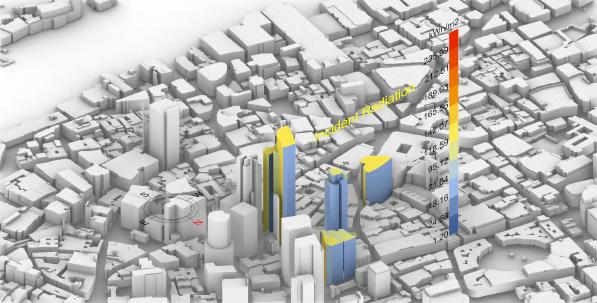
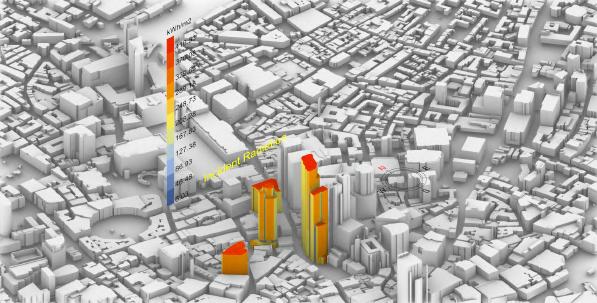
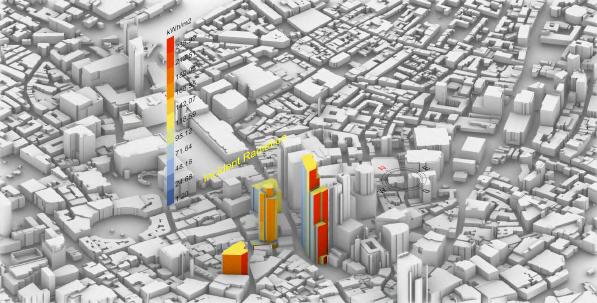
Solar Radiation analysis - In winter and autumn, the Horrison 22 next to Tower 42, blocks a large amount of thermal radiation, which leads to less heat acquisition by the building, resulting in an increase in overall heating energy consumption and lighting energy consumption.The Southern facade in months from March - Aug receive the highest solar radiation in the range of 410 KWh/sq.m. The later months see a reduced incident radiation, with the highest range of 235 KWh/sq.m.
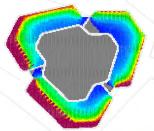
Daylighting Analysis - As the building envelope is primarily glazing, the office receives abundant light in most of the months. December sees decreased lux levels in the interior space.
The southern office wing and parts of the western office wings would require shading due to the increased amount of lux, which may cause glare. Using the right type of glazing will help access this daylight in a efficient way, and decrease the energy consumption due to lighting in the office.
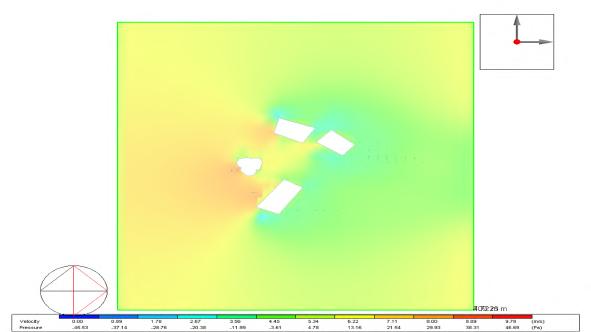
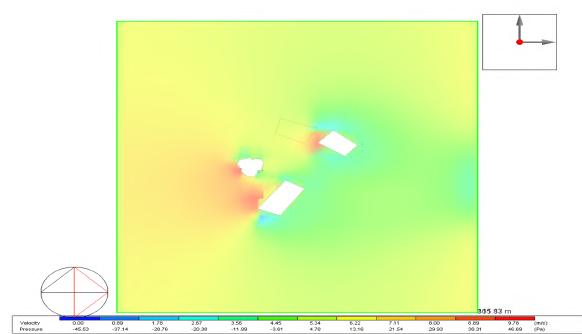
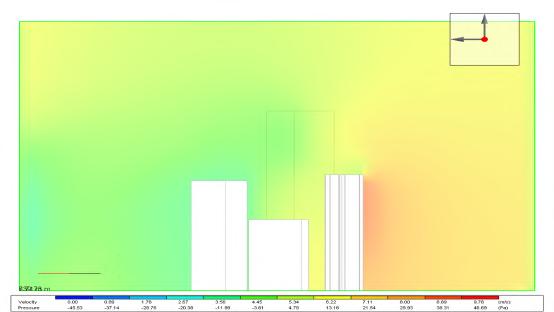
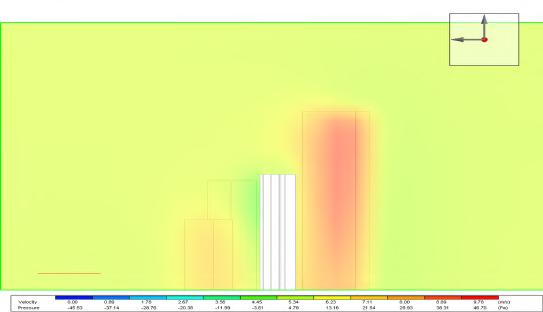
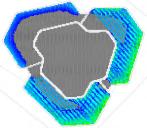
on the southern face of the building and might require to incorporate wind resistance techniques in the structure as well as the elvelope. Due to obstruction from the other tall buildings in the area, the eastern facade and certain parts of northern facade do not receive as harsh winds as the southern facade.
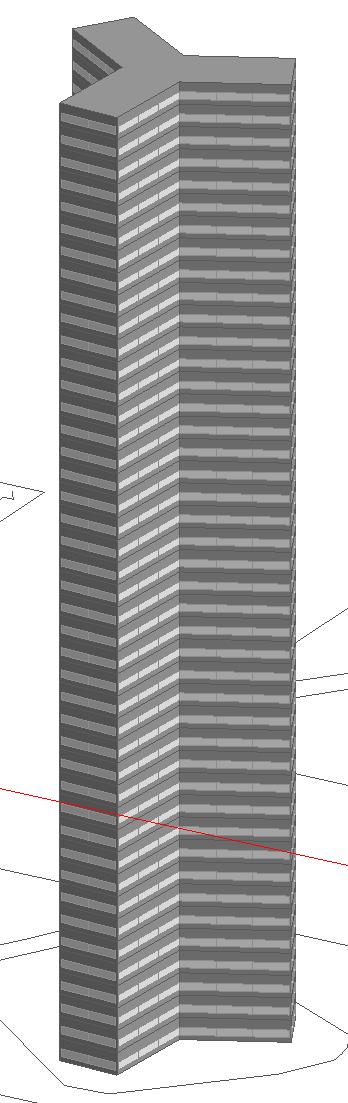
Shape: Cantilevered 3 Flank shape WWR: 95%
Shading: No External Shading
Fabric U-Value: 0.35 W/m2.k
Glazing U-Value: 5.7 W/m2.k
Glazing G-value: 0.83
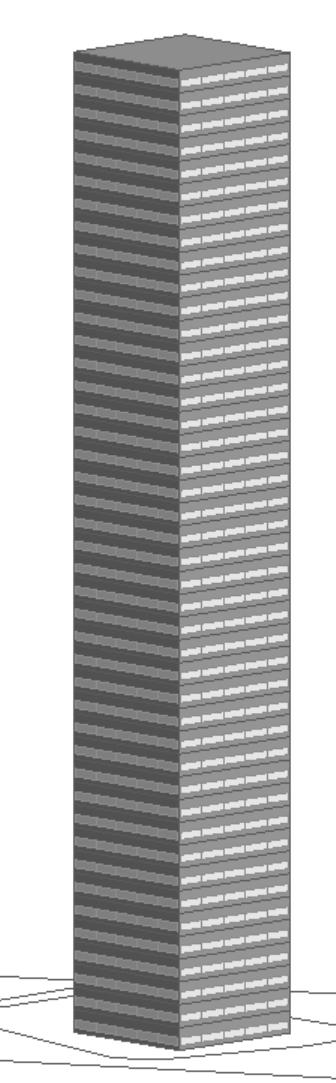
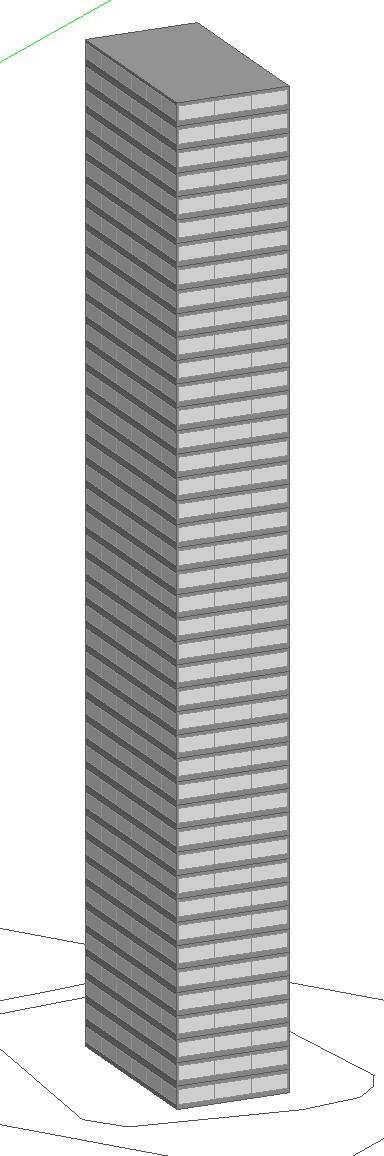
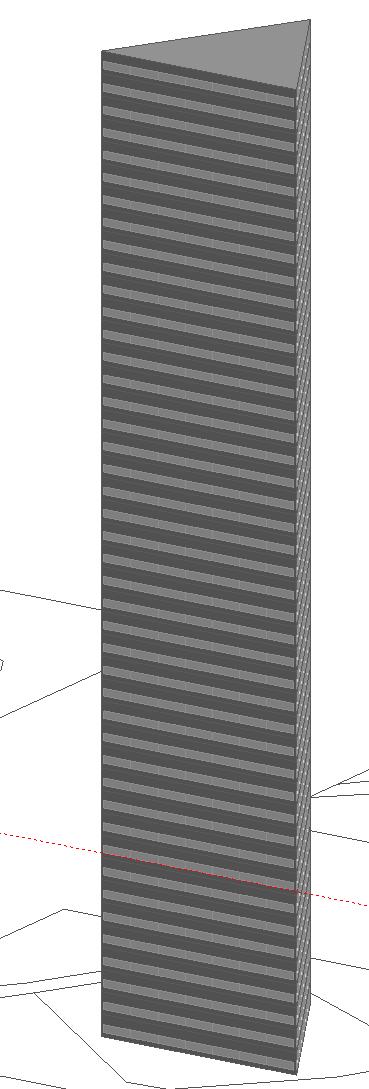
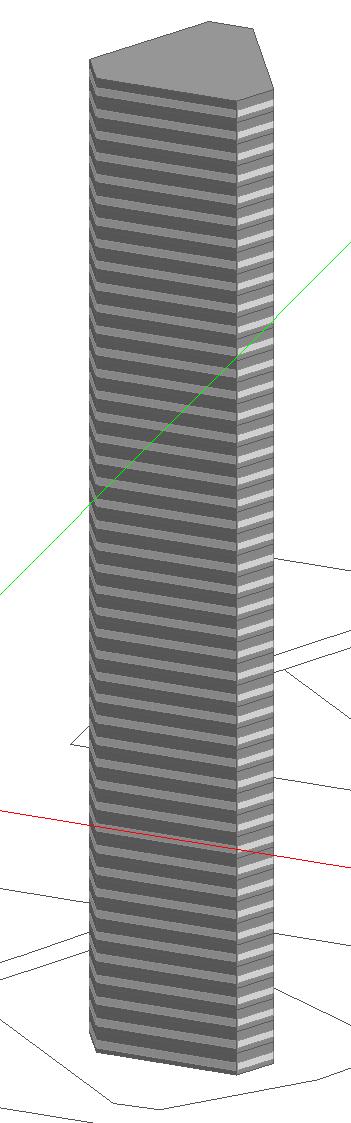
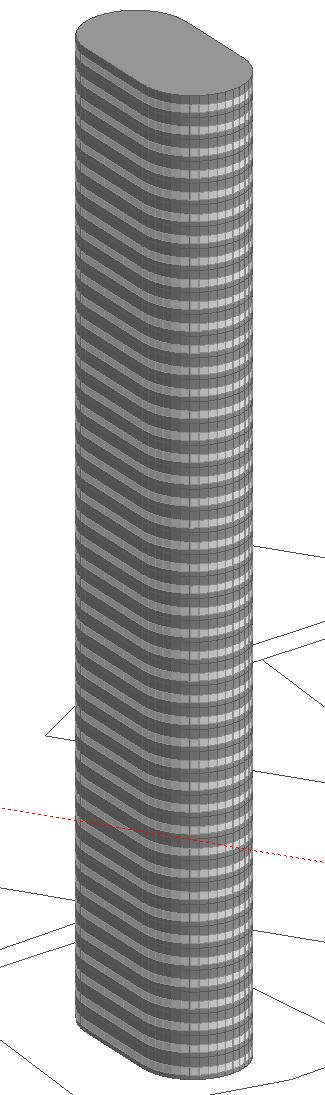
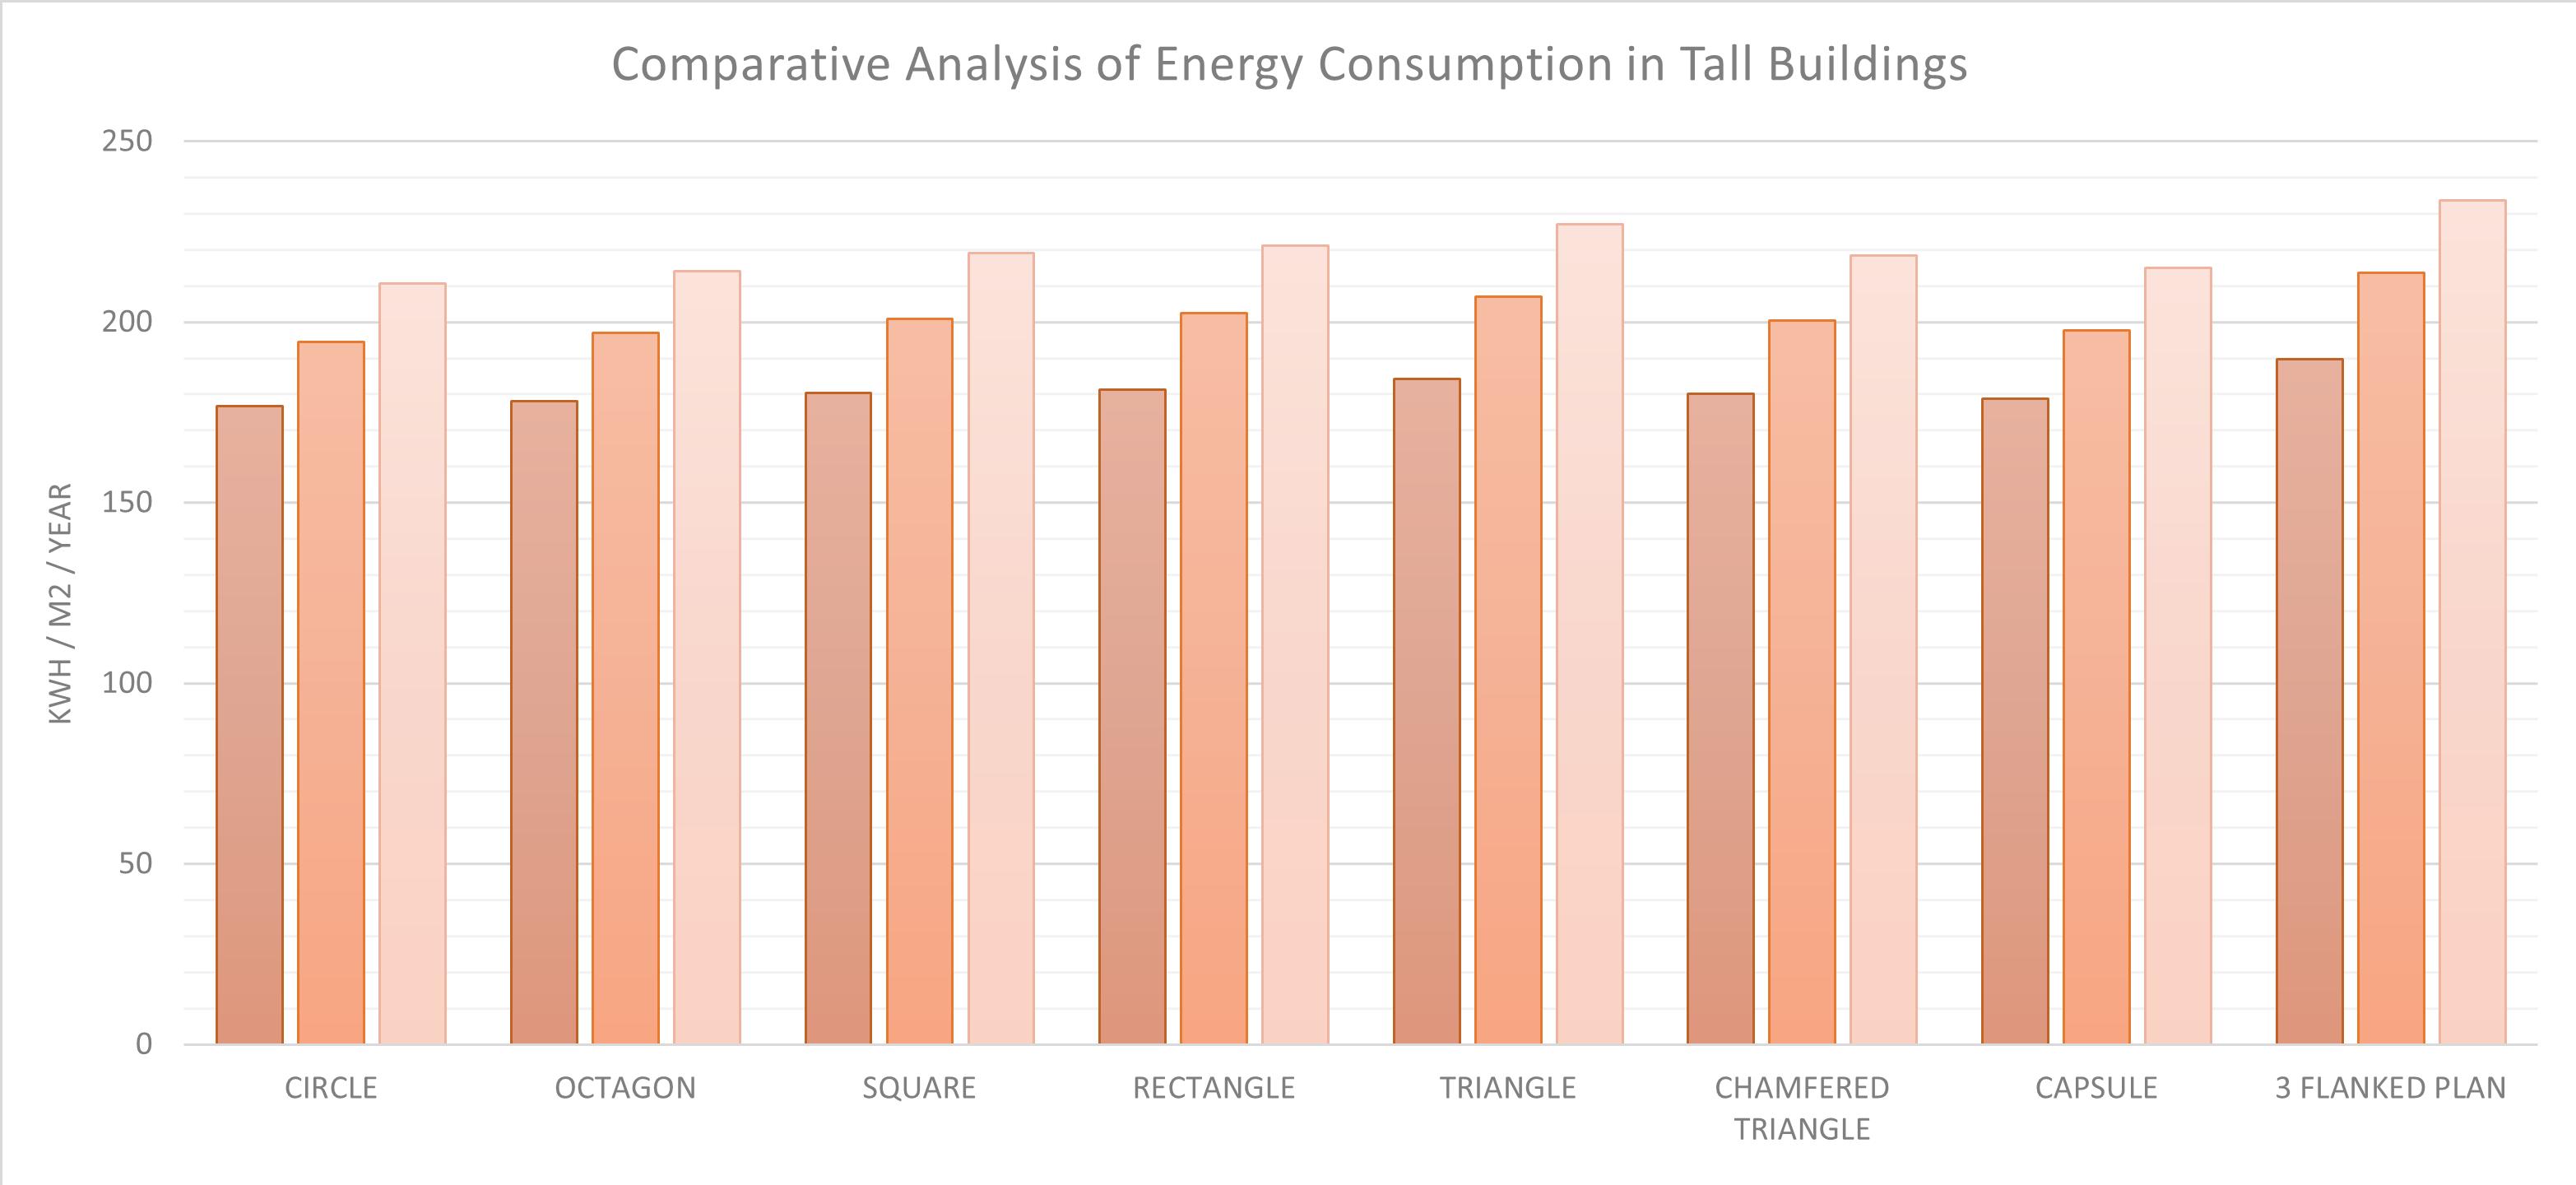
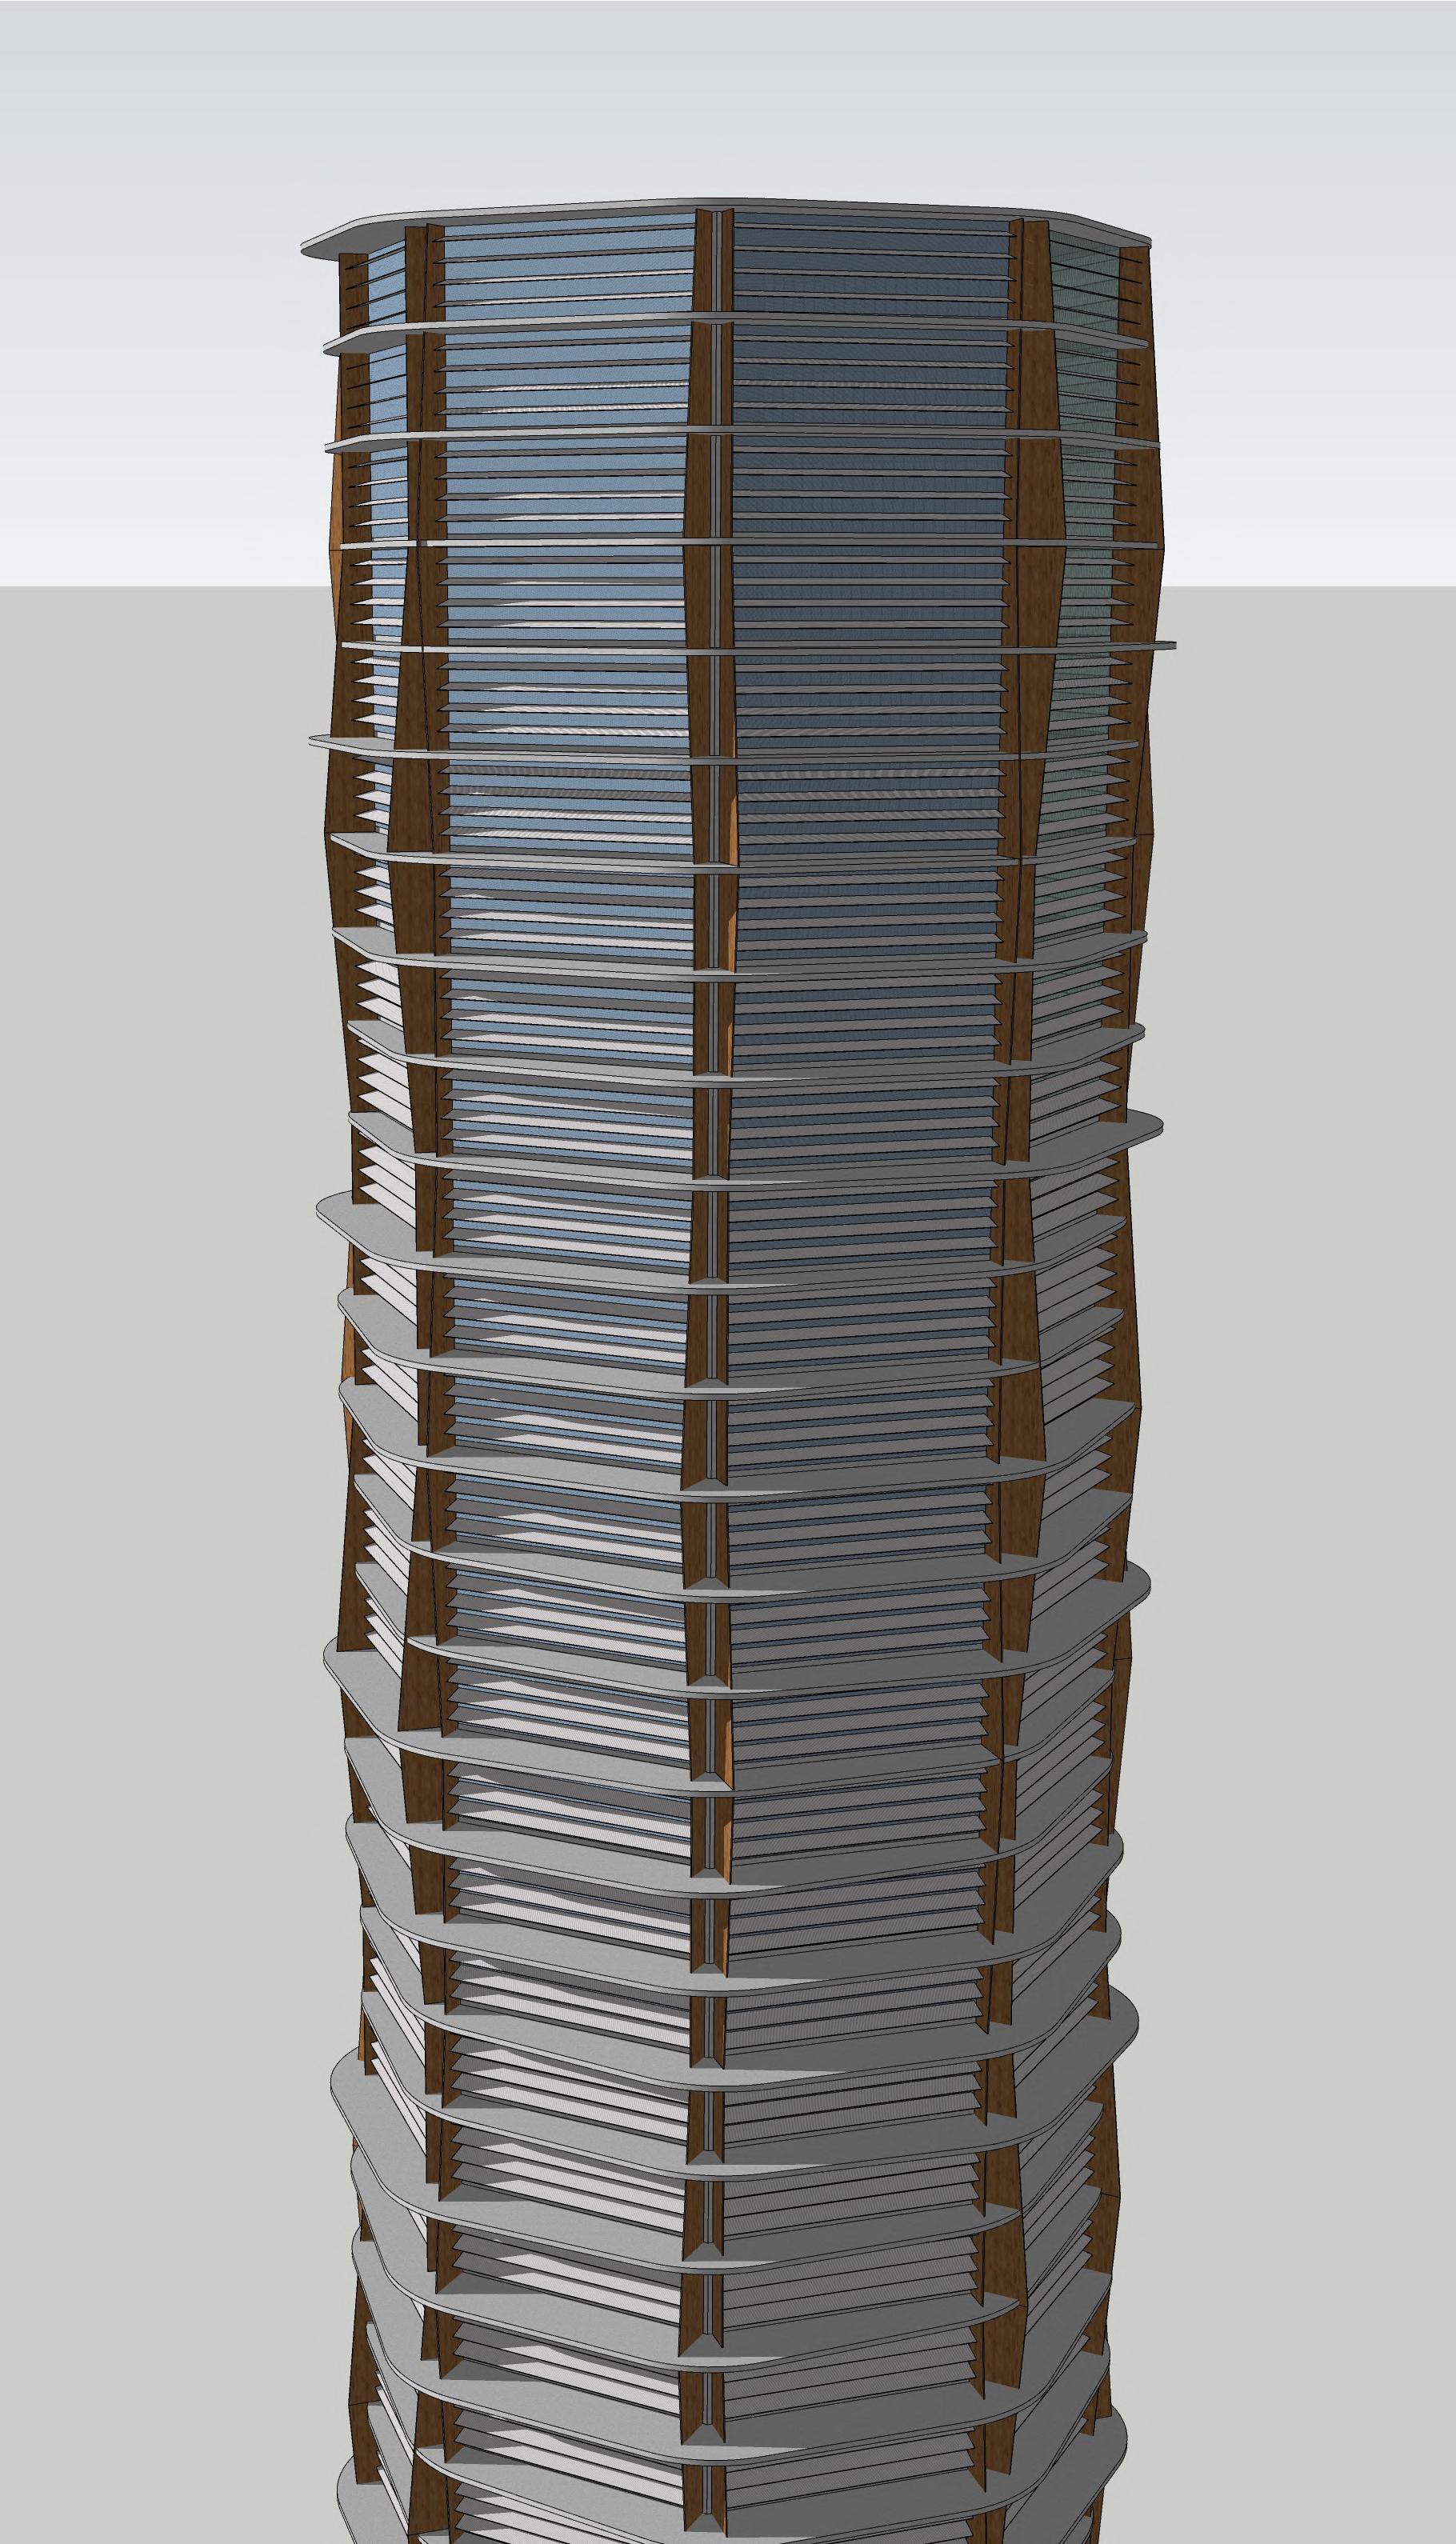
Eight building shapes, each with comparable built-up areas (approximately 30,000 sq.m), have been chosen for analysis to explore energy optimization concerning both window-to-wall ratio and building orientation. Three WWR were chosen to run the simulations in design builder - 35%, 65%, 95% SHAPE OPTIMIZATION
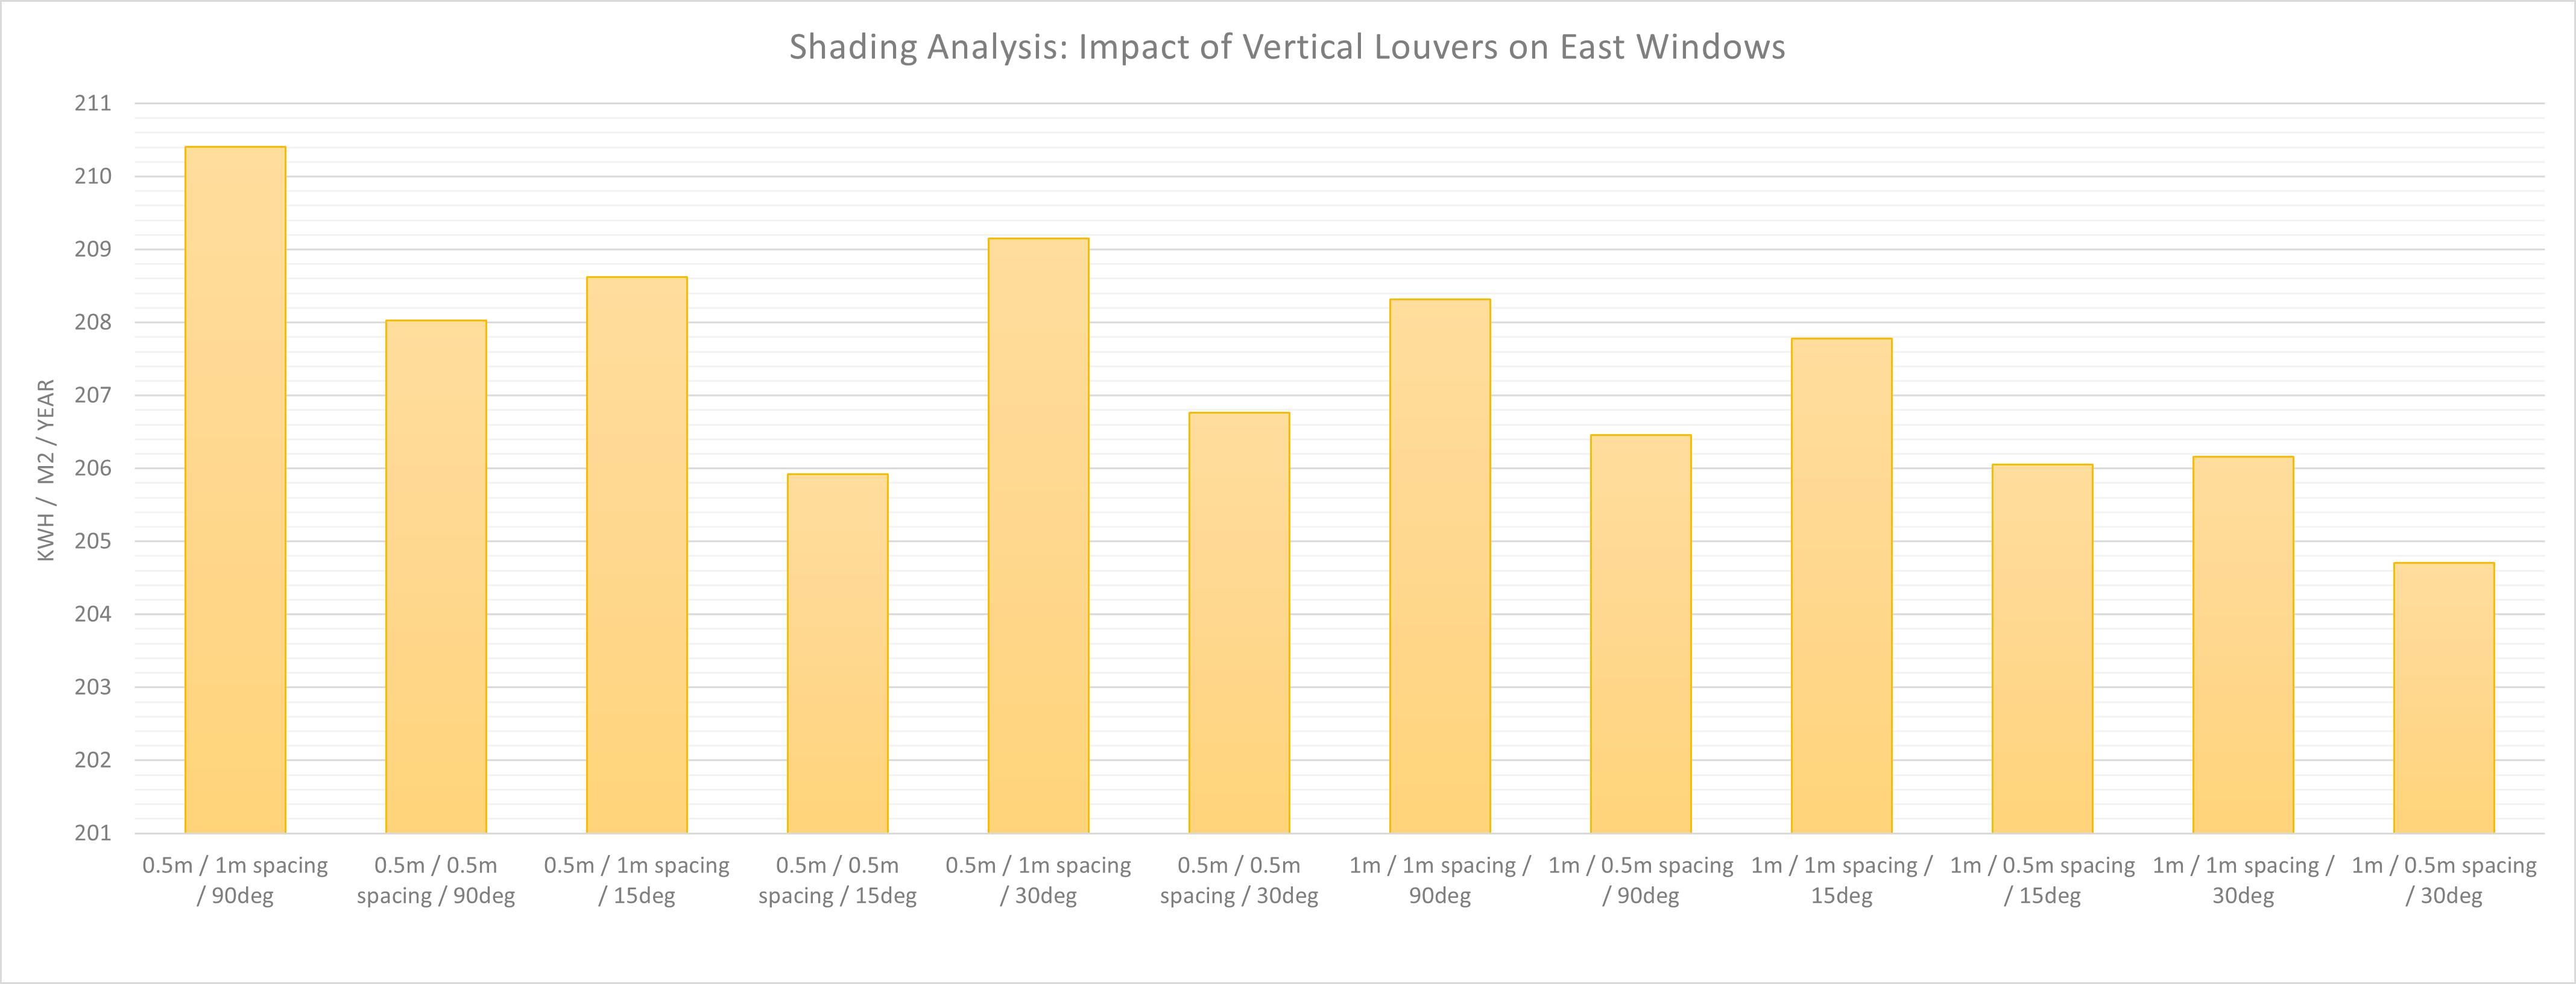
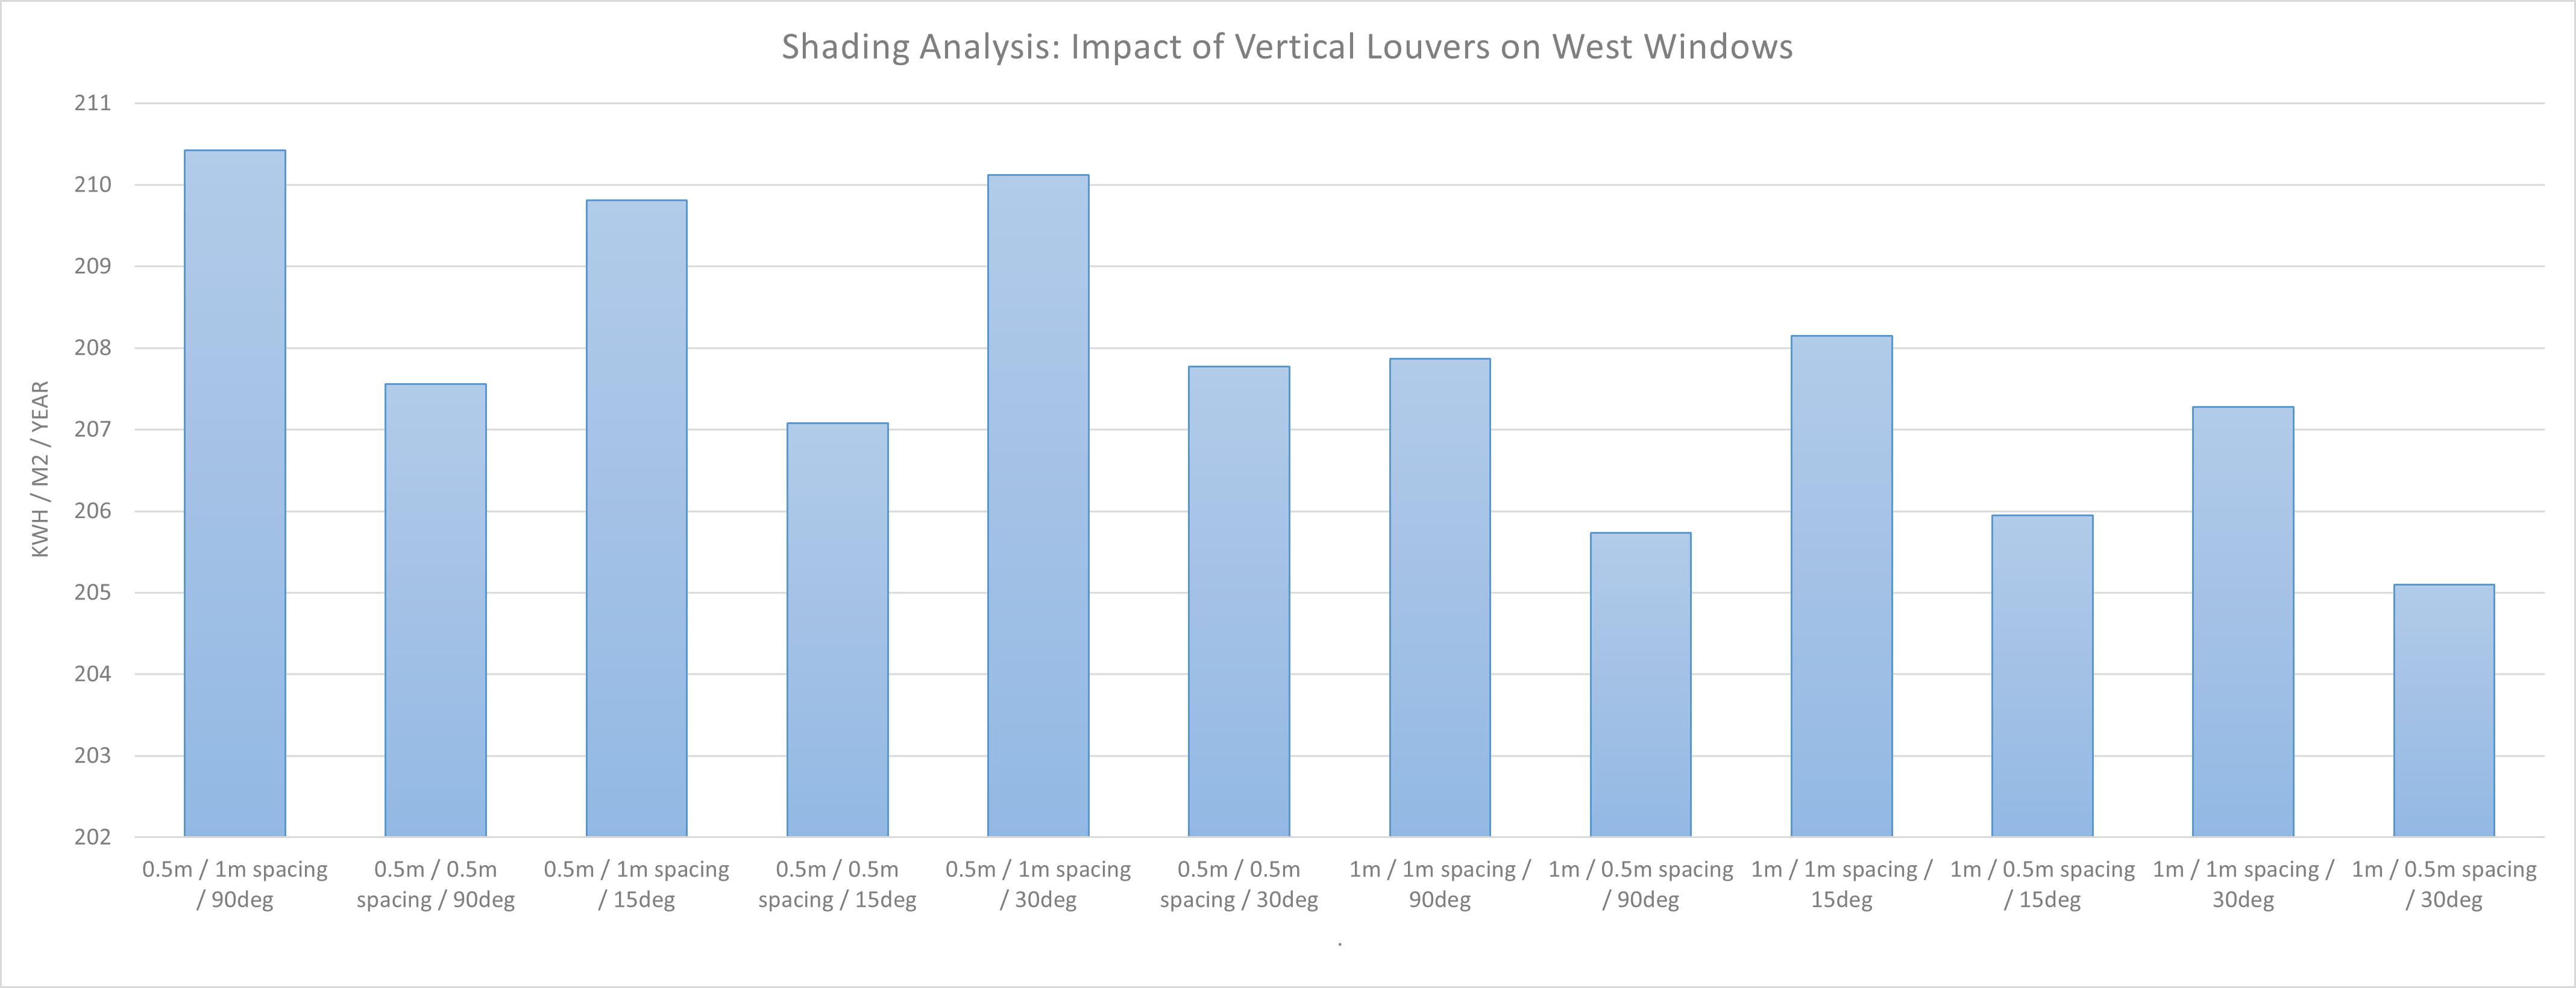
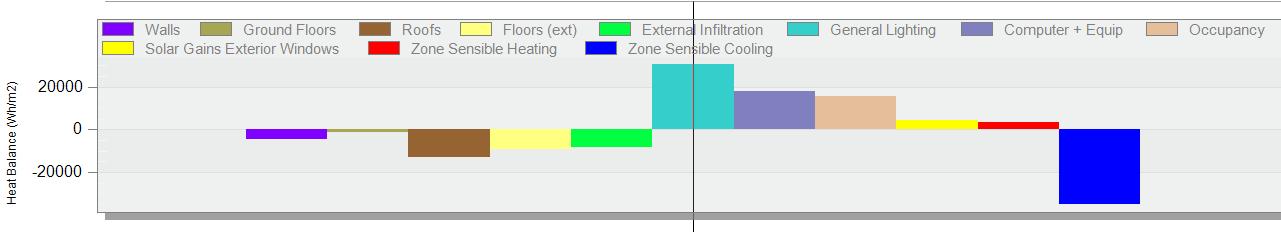
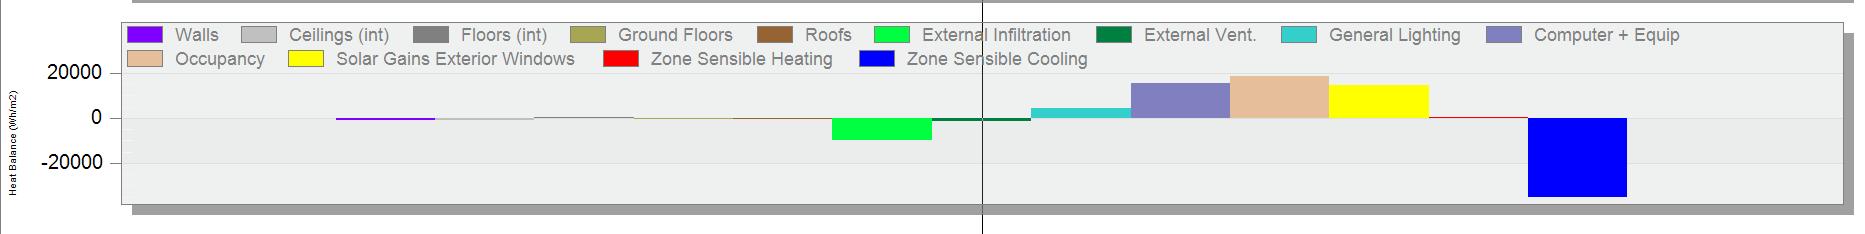
Fabric optimization - Post Shape optimization, heat balance analysis revealed that solar heat gain through windows to be one of the highest contributor to energy consumption. The next step involved evaluating the effectiveness of various shading systems, such as louvers, overhangs, and box-shaped elements, on different building facades. This analysis determined the most efficient shading solution for the each phase.
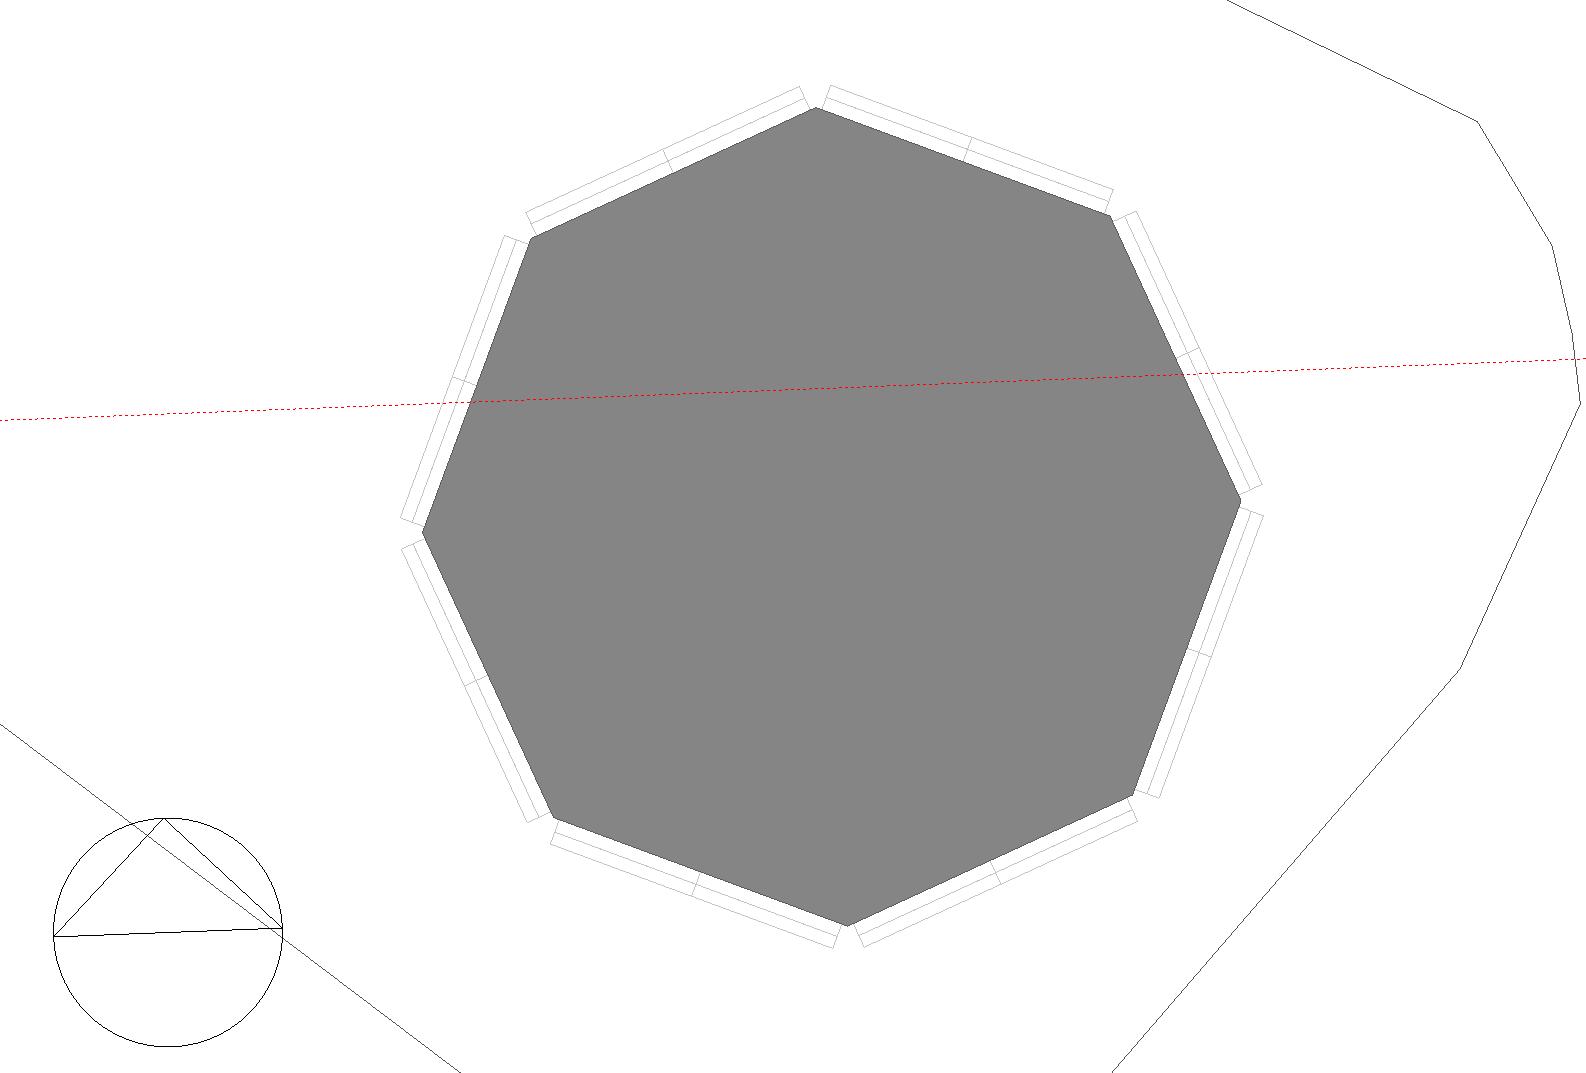
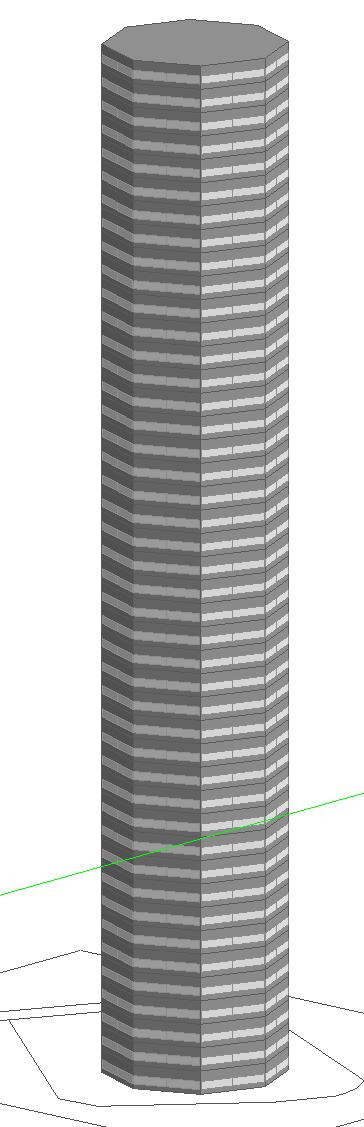
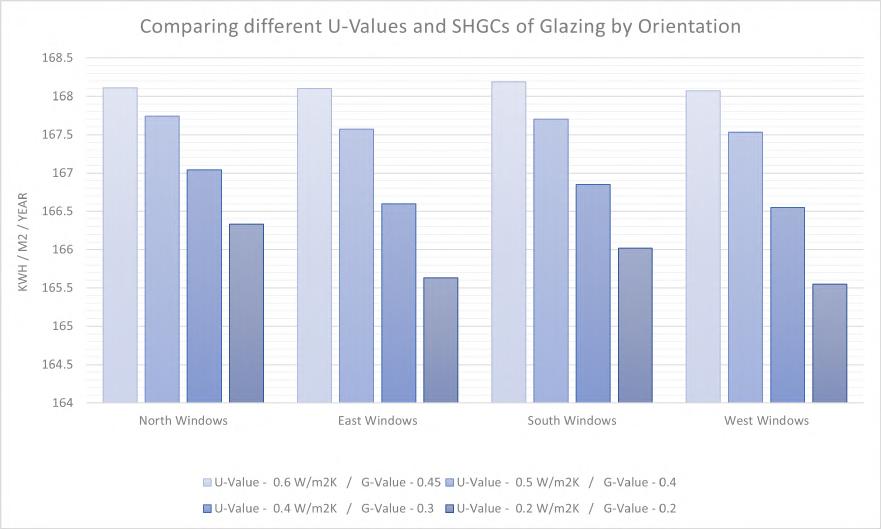
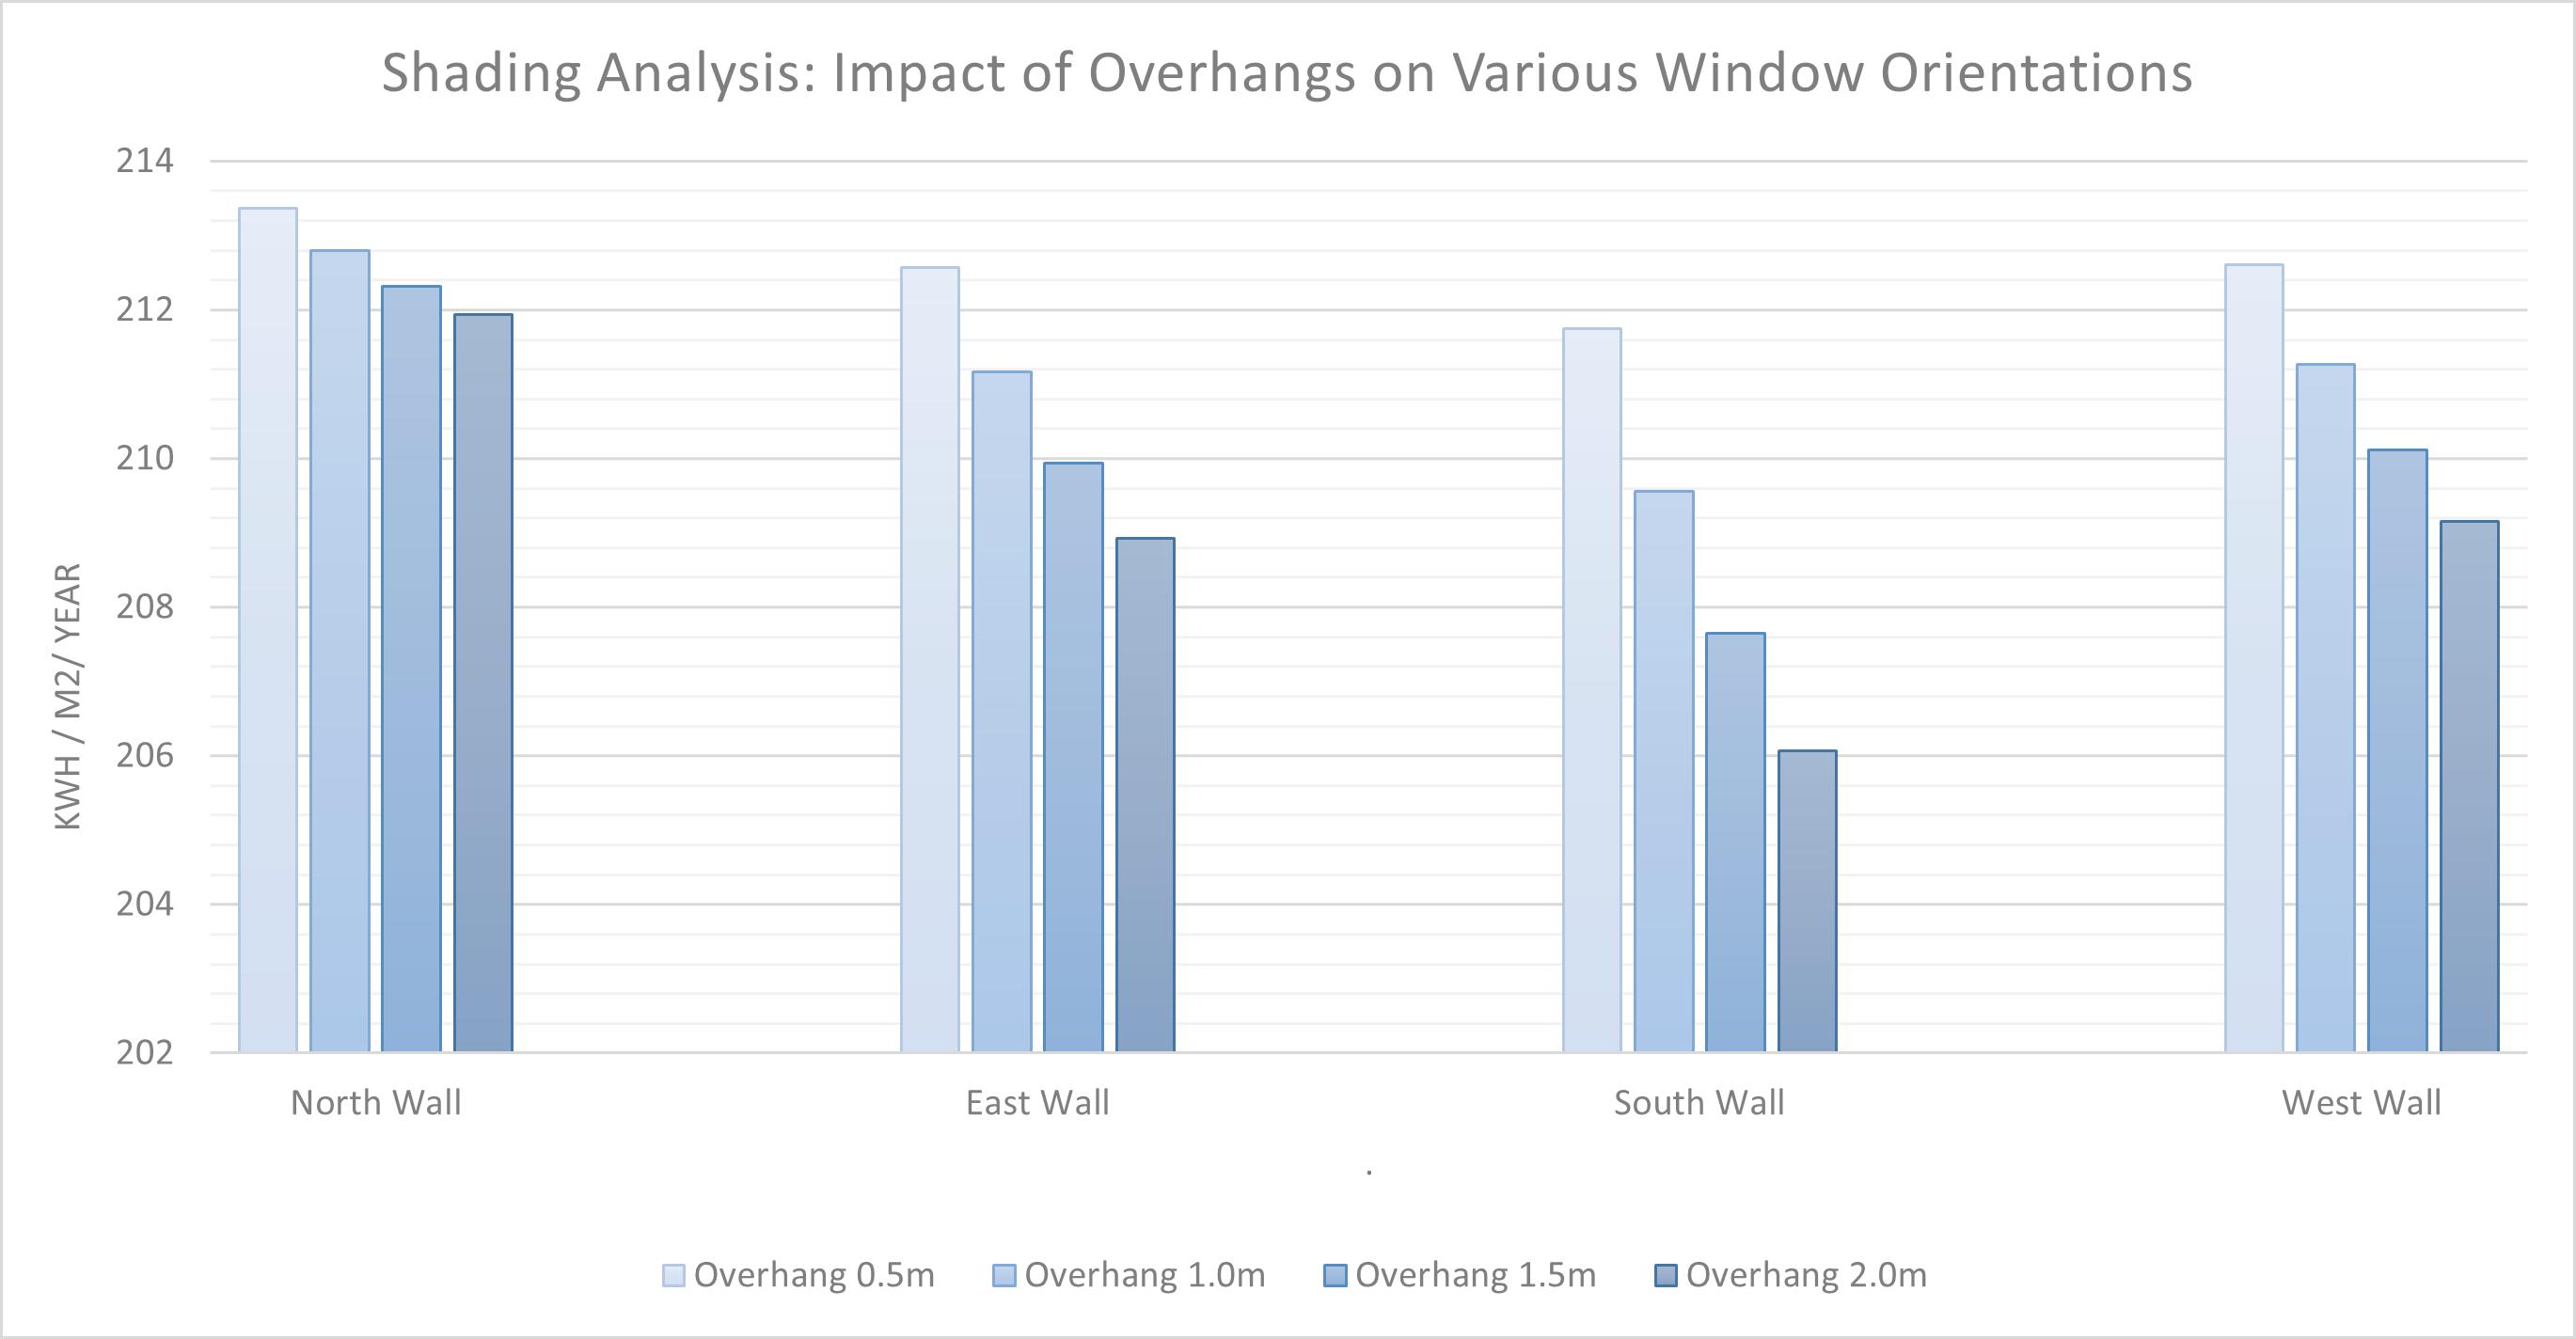
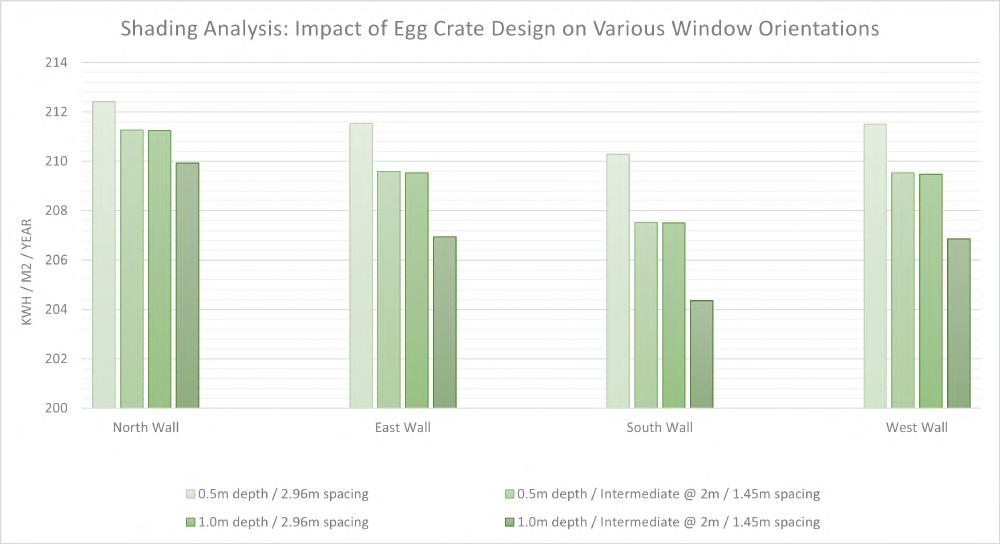
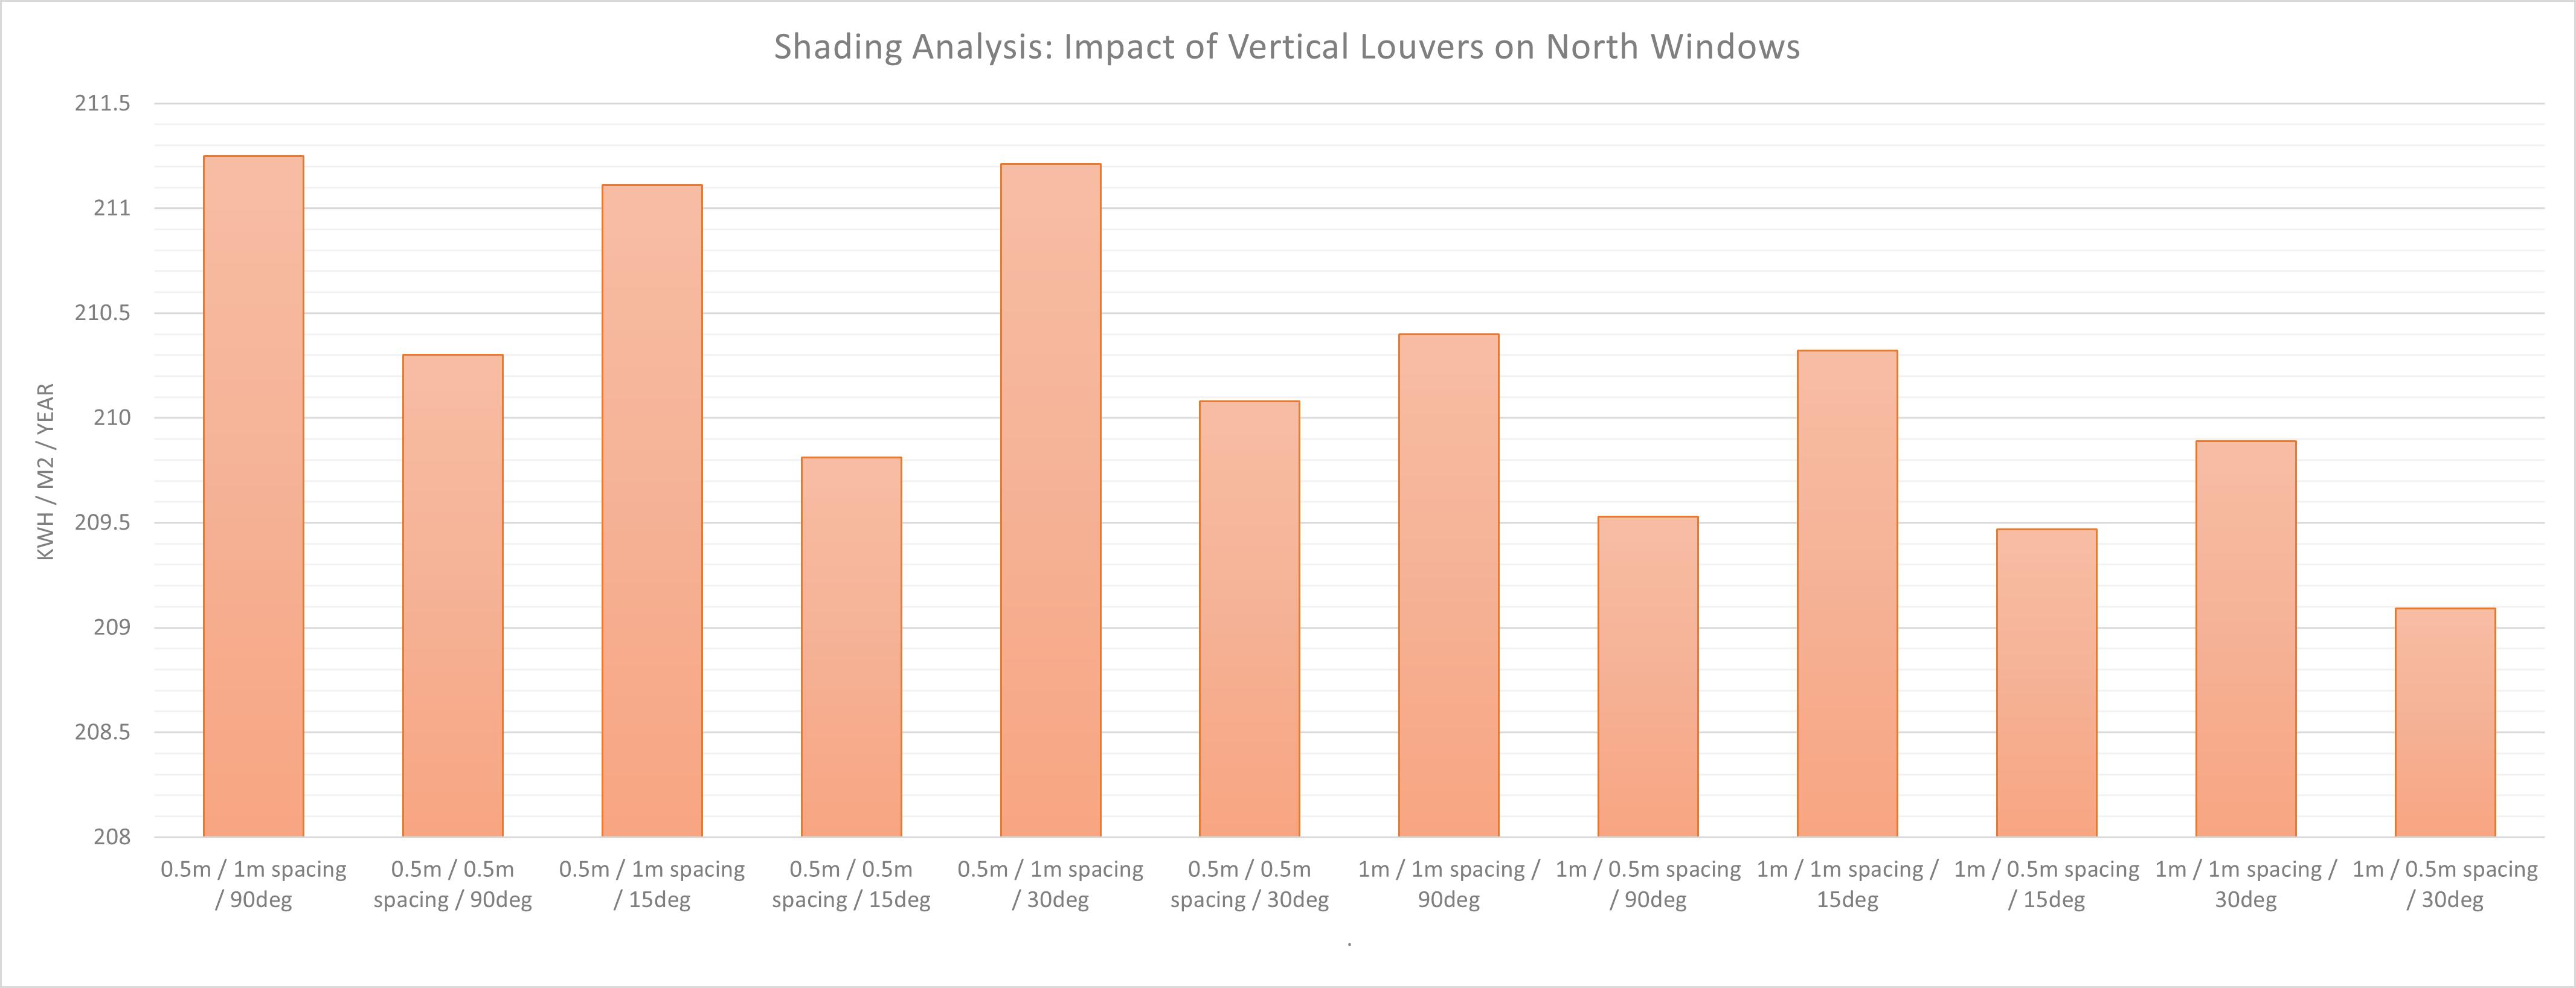
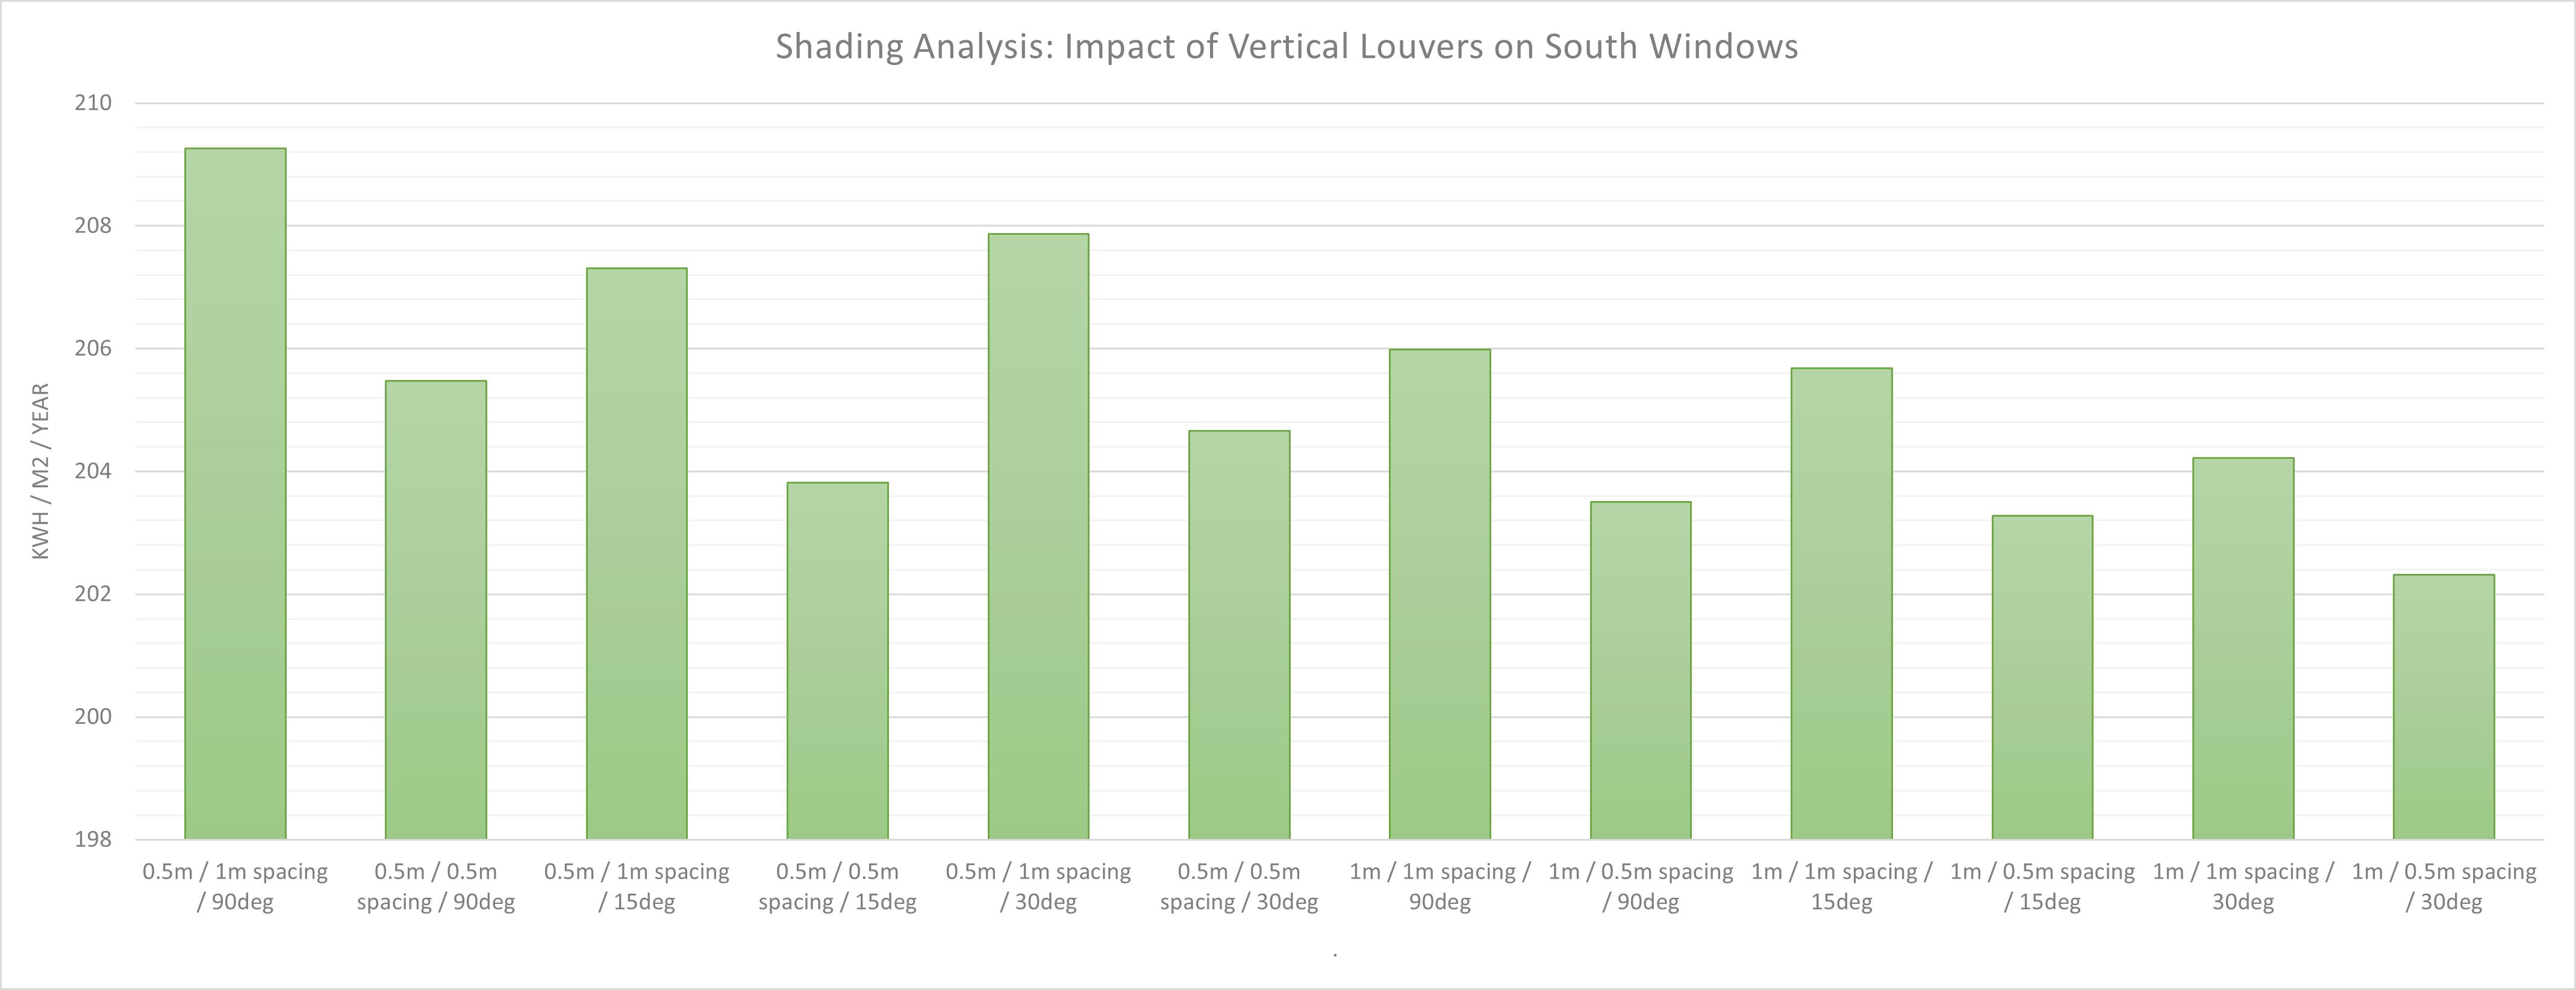
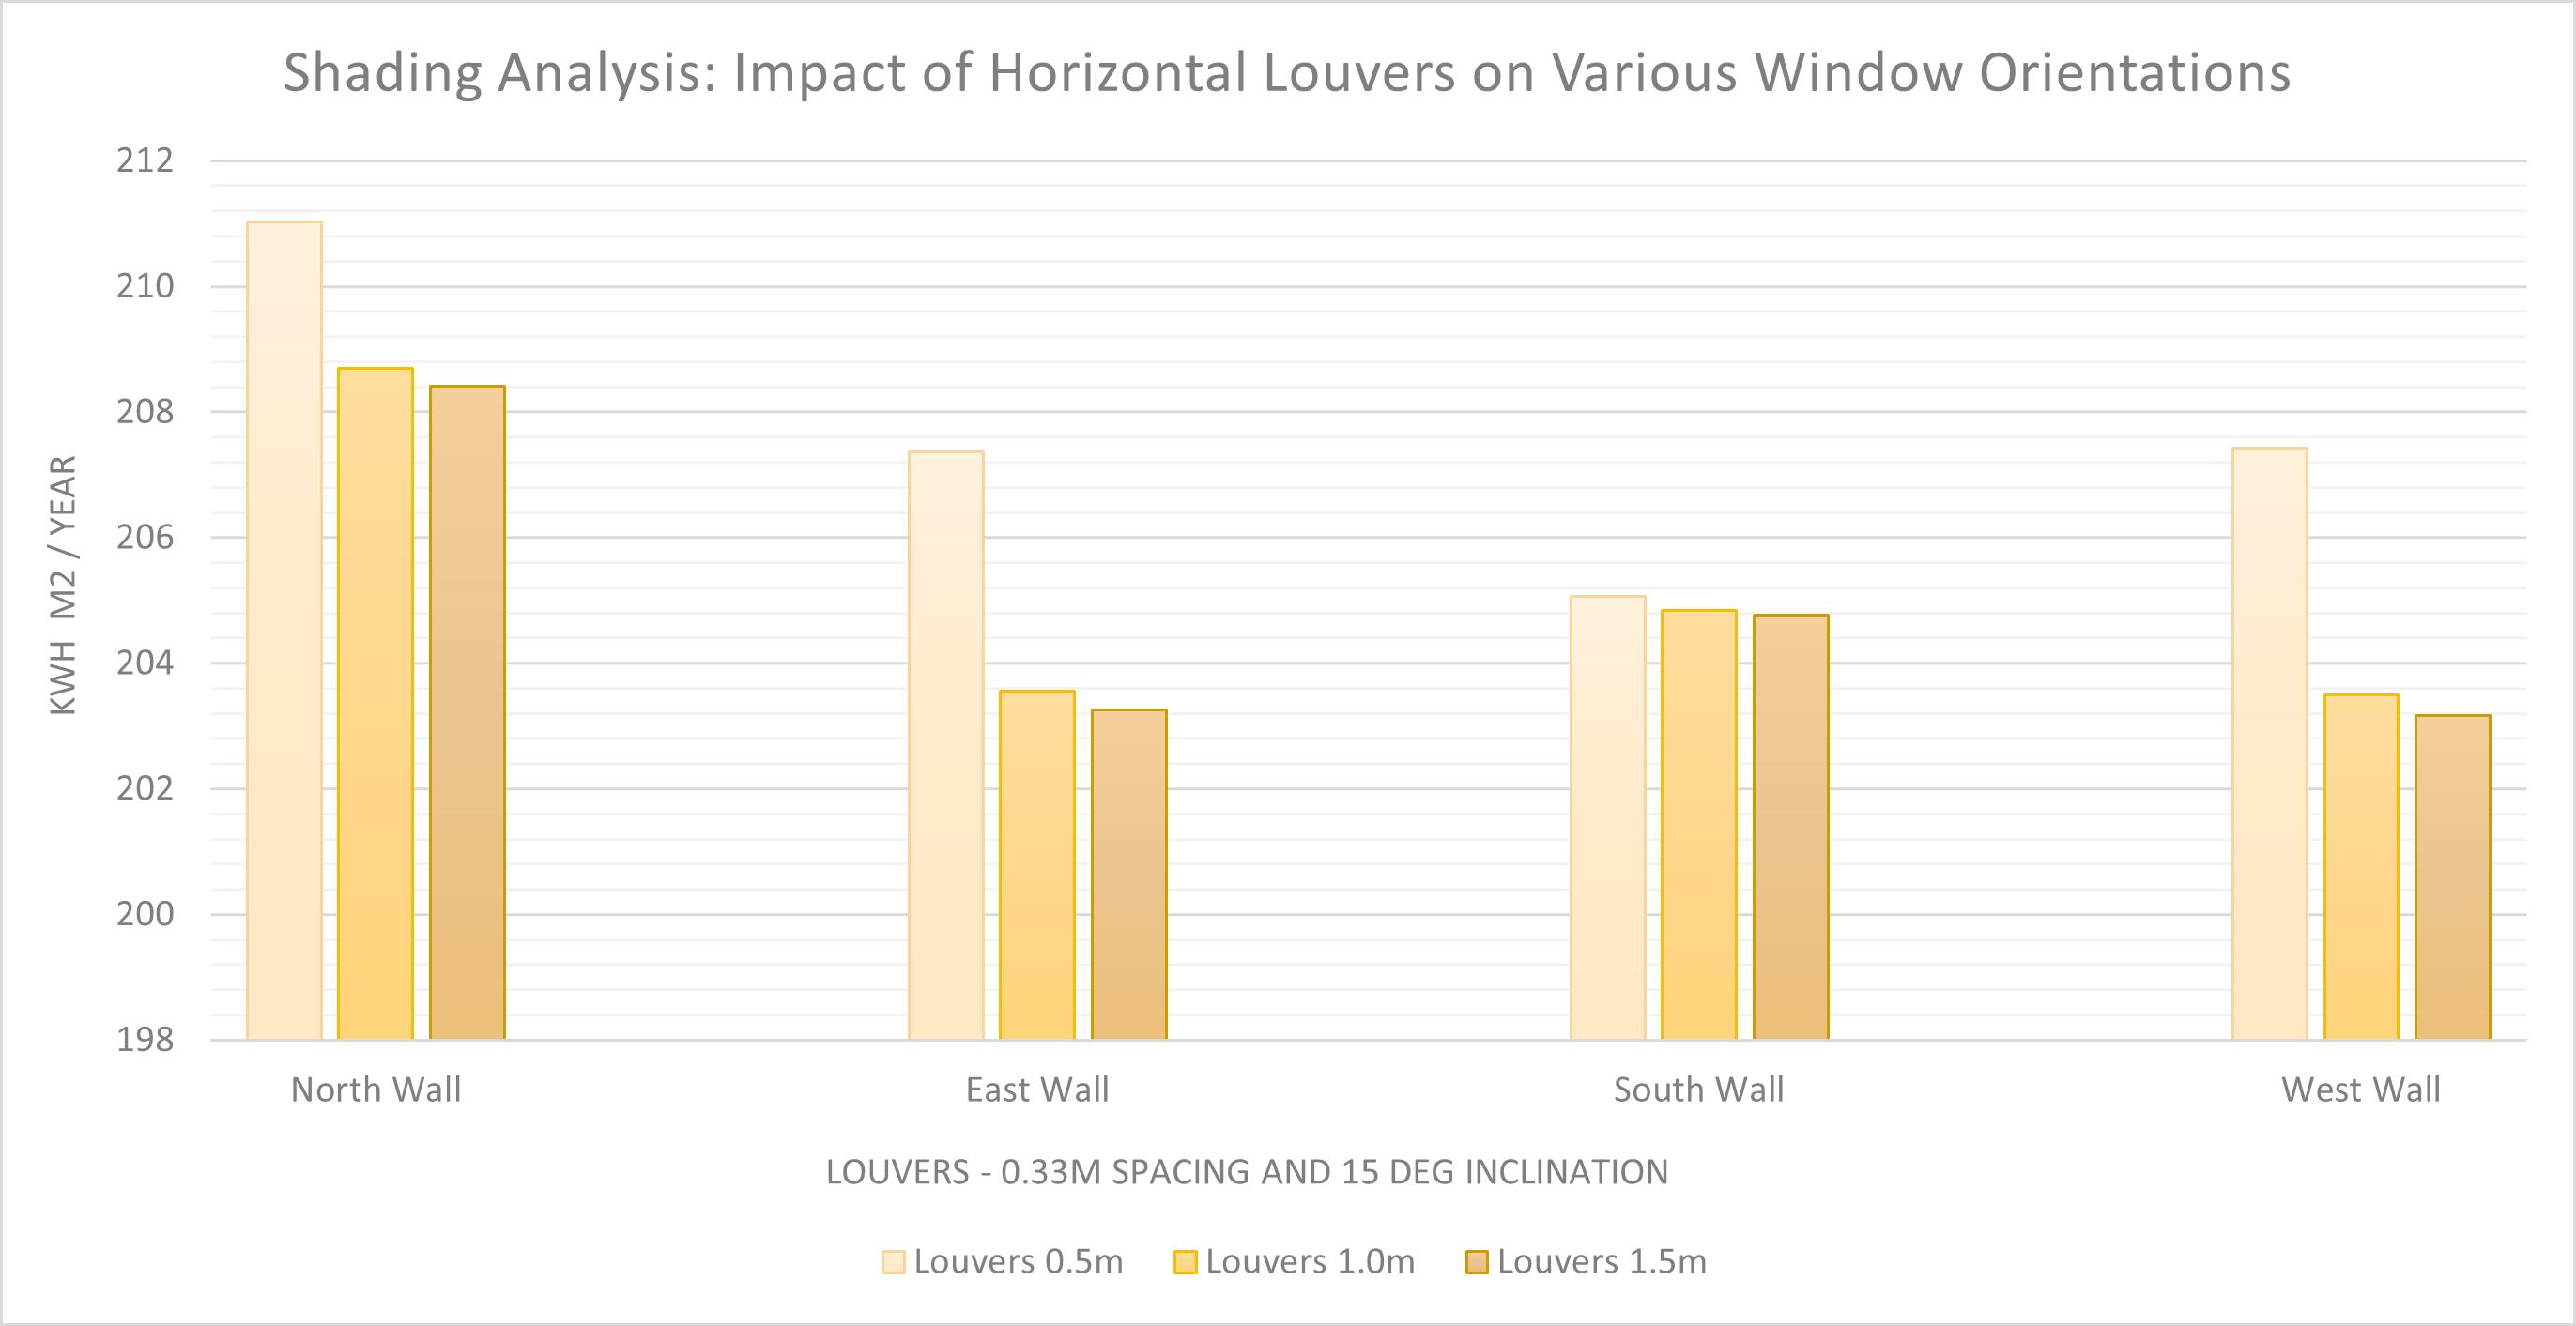
To enhance passive energy performance, various shading structures such as overhangs, horizontal louvers, vertical louvers, egg crate design are placed on the north, east, south, and west facades of the octagonal building. These structures will be tested at 95% glazing to determine the most effective shading configuration for each orientation.
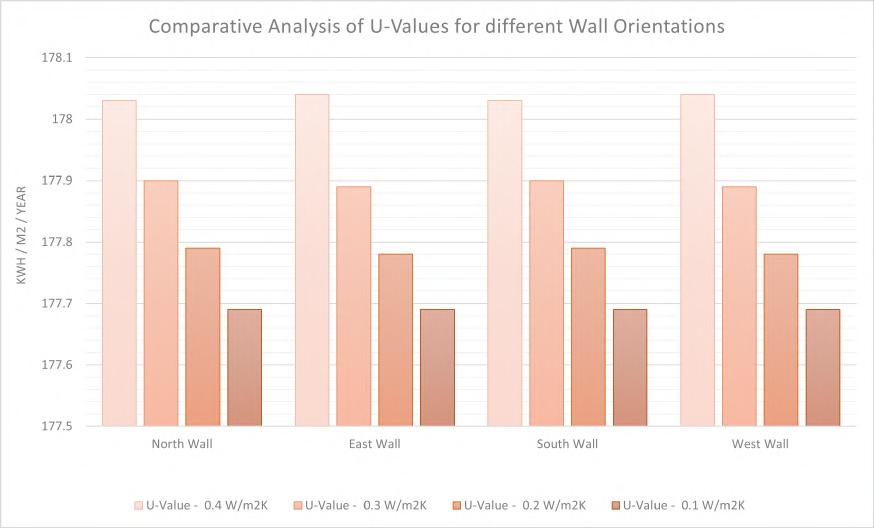
Each phase had potential 3 to 4 shading options that resulted in optimized design solutions. These options were selected, and energy simulations were conducted to analyze the most effective model. The U-value of the building fabric was systematically adjusted during each phase to ascertain the optimal value for every orientation. Similarly, the U-value and G-value of the glazing were varied to conduct the simulations.
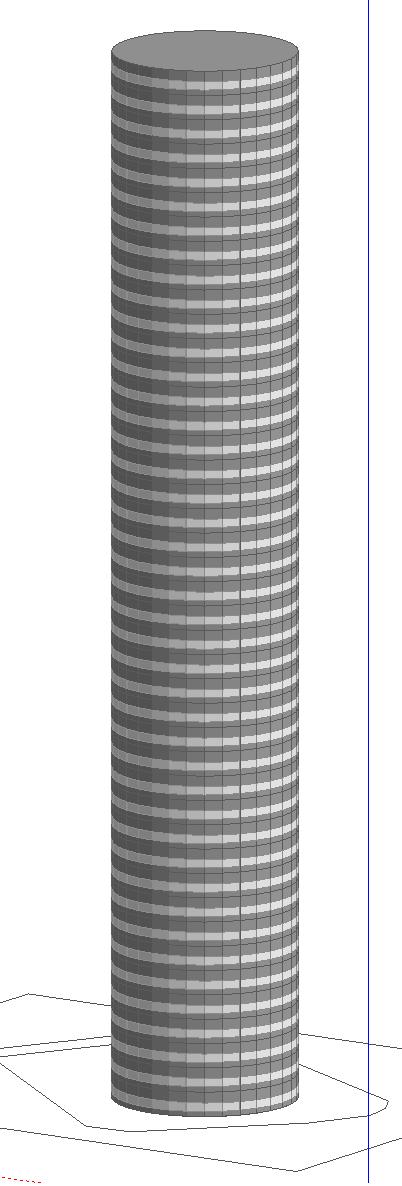
Among the evaluated building shapes, all outperformed the original design in terms of energy efficiency (at 95% WWR). The circular form achieved highest energy efficiency, followed closely by the octagonal form. For aesthetical considerations, Octagonal design at 35% was chosen for further optimization.
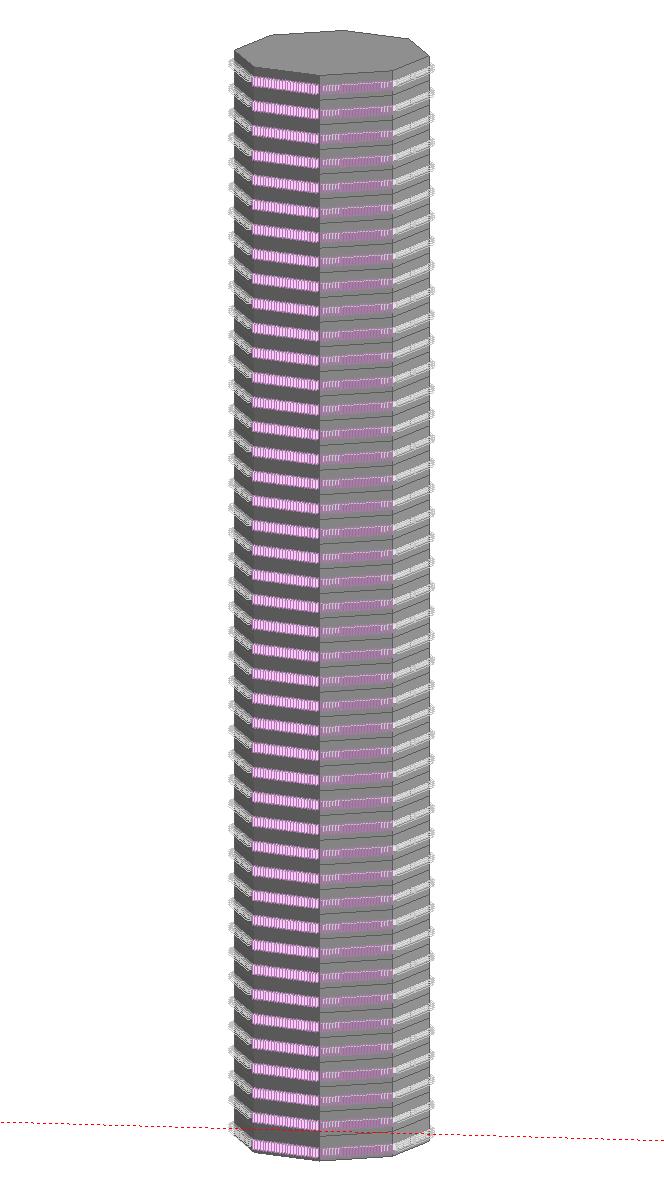
Shape: Octagonal WWR: 35%
Shading: Louvers Fabric U-Value: 0.1
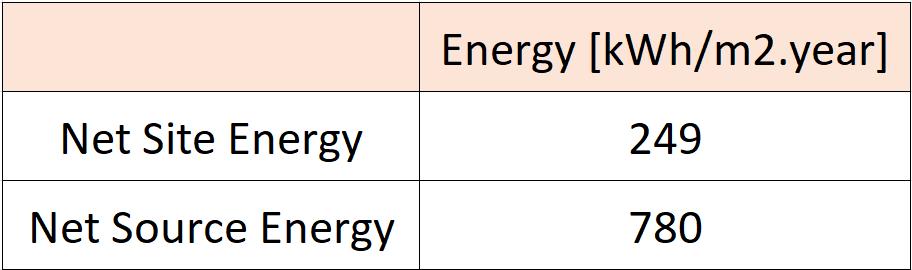
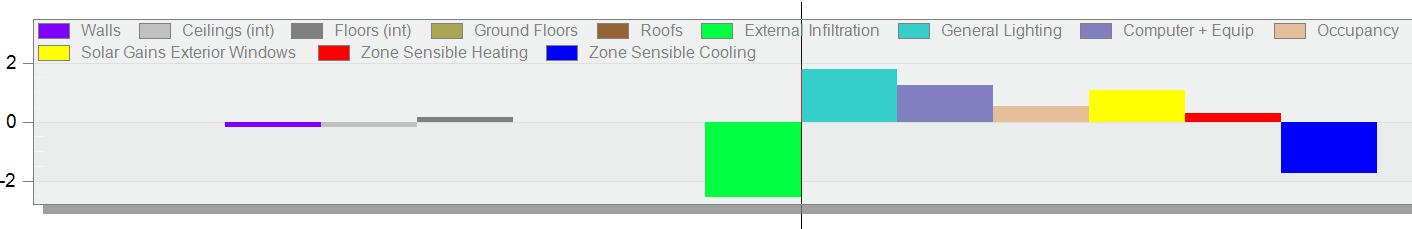
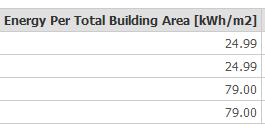
The final energy consumption post Passive Optimization is tabulated above.
FINAL FABRIC OPTIMIZATION
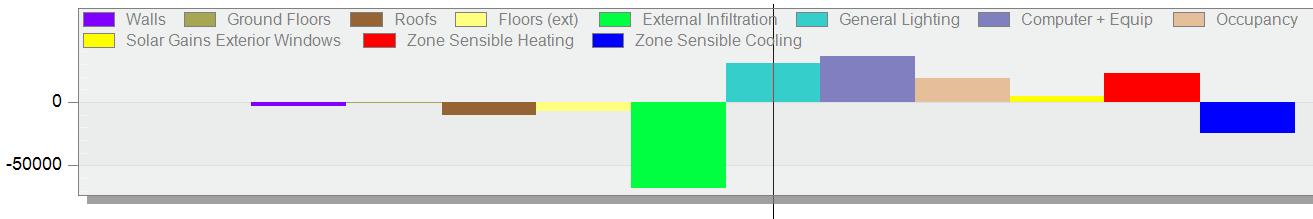
The heat balance analysis following phase 2 indicates a significant reduction in solar heat gain through windows. However, lighting loads, equipment loads, and infiltration loads remain high. An error in the infiltration settings has been identified and rectified Additionally, the Small Office Equipment power density has been recalculated using CIBSE guide F based on the building occupancy. Lighting will be optimized in later phase.
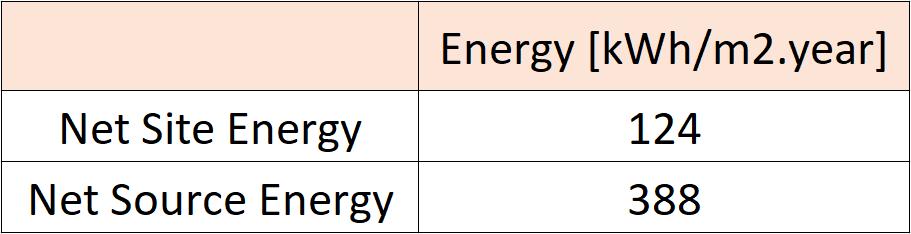
The energy consumption after rectifying the infiltration rate and chaging the power density is as follows:
This model will be used as the base for next phases of optimizations.
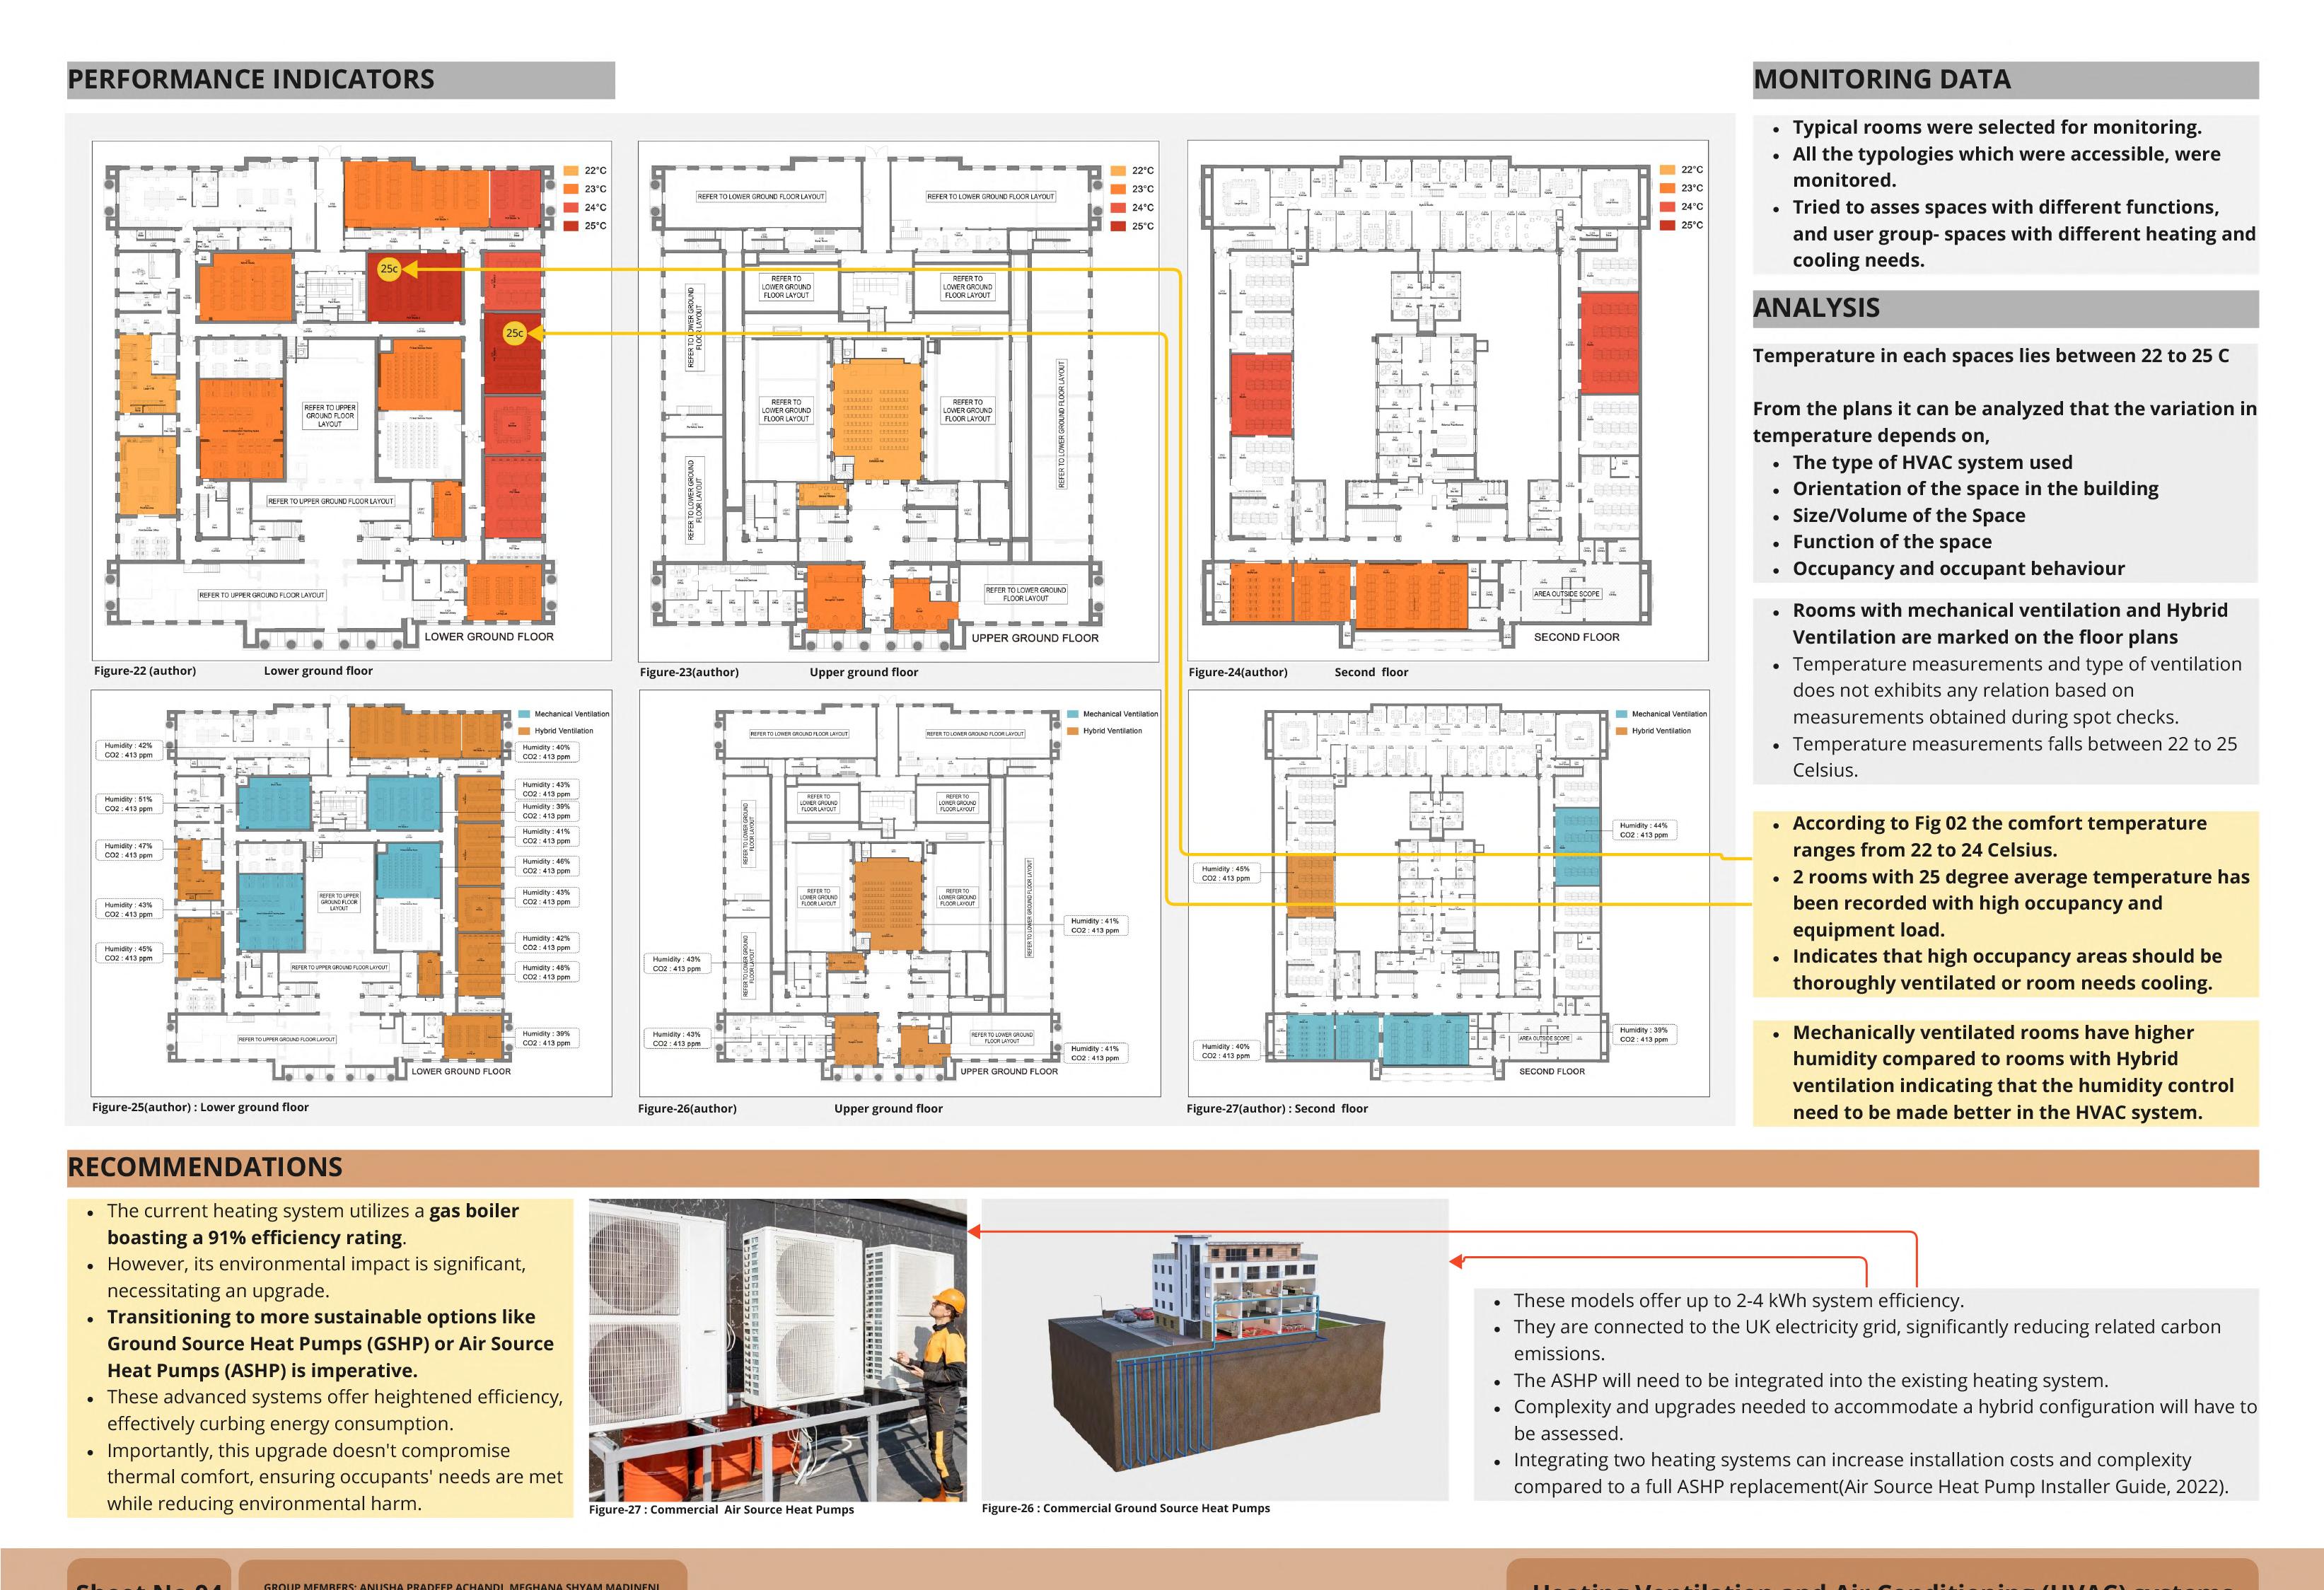
HVAC optimization
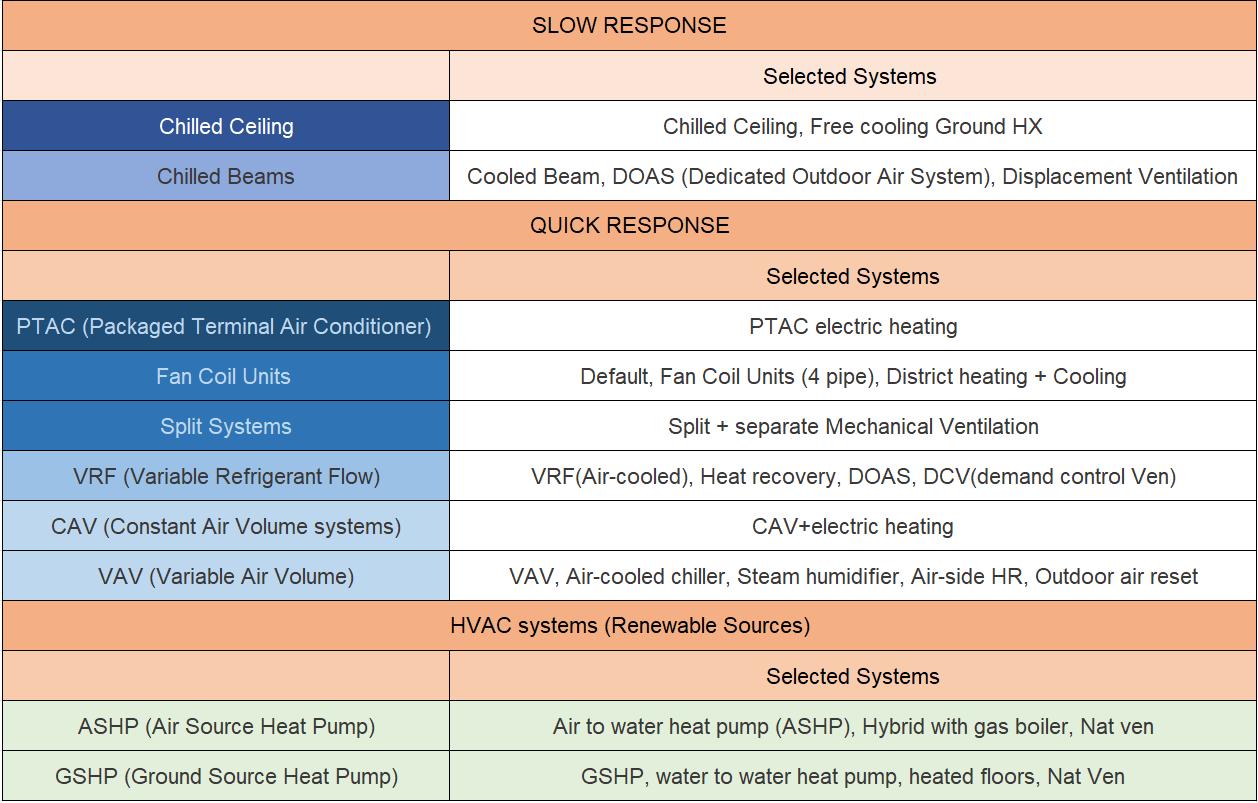
HVAC systems are broadly categorized into three main types in this context: slow response, quick response, and those utilizing renewable energy sources. Each category offers various sub-options. The most efficient and suitable option within each category was chosen. [For example, under VAV systems, there are multiple models of the VAV available., each system is tested, and most energy efficient one was selected.]
PART 01 (Entire Floor - Single Zone)
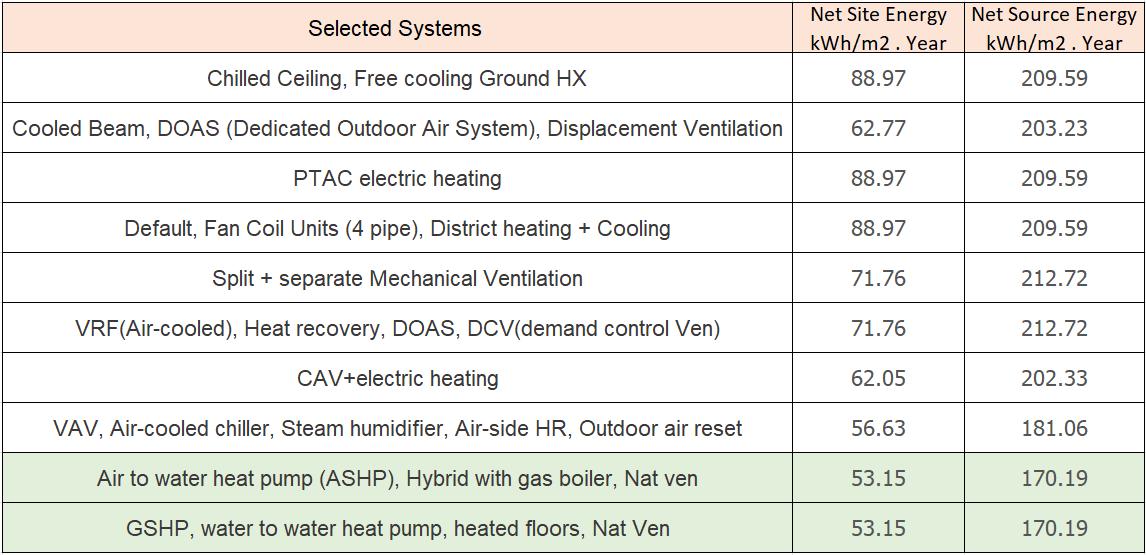
To evaluate the impact of floor level on HVAC efficiency, the chosen HVAC systems were tested on different floors (single zone) at various heights. The results of this testing, are tabulated in the table below.
RESULTS - For a single Zone HVAC, the options which are powered by renewables present the most energy efficiency, which are ASHP and GSHP. the most efficient option that is not sourced by renewables is VAV - Variable Air Volume, Air-cooled chiller, Steam humidifier, Air-side HR, Outdoor air reset.
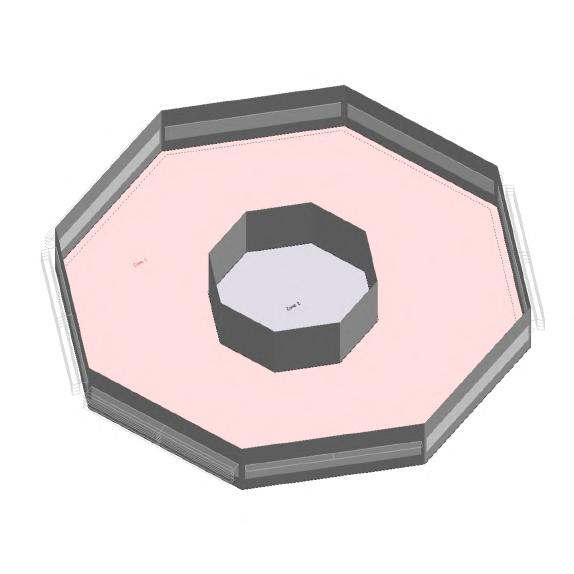
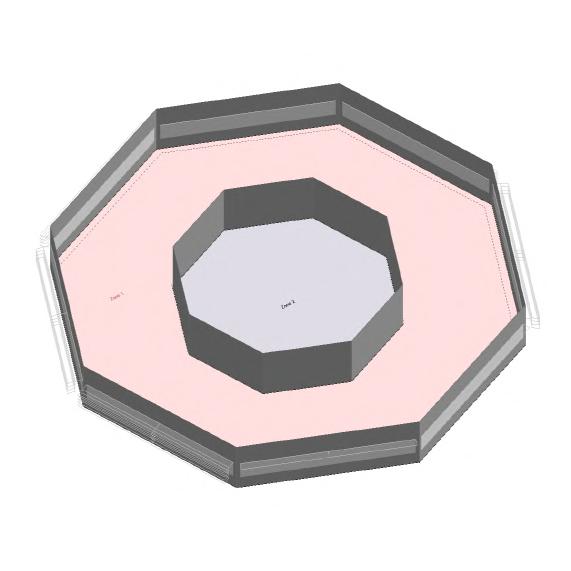
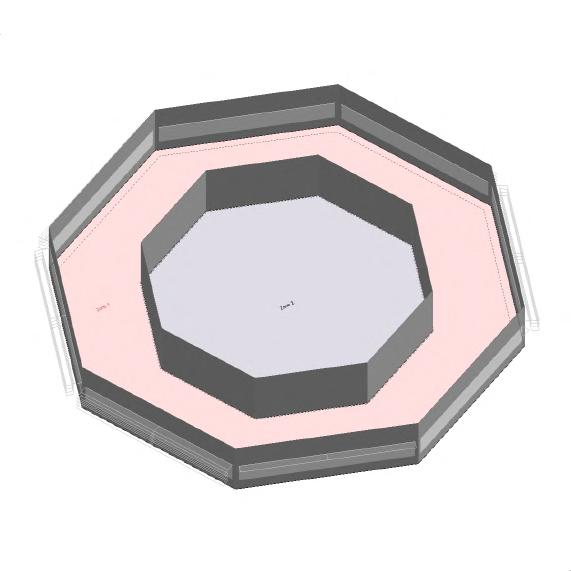
PART 02 (Entire Floor - Two Zones)
To investigate the energy efficiency of zoned HVAC systems compared to a single system for the entire floor plate, the space is divided into two zones: an outer zone (Zone 1) and an inner zone (Zone 2). Zone 1 prioritizes natural ventilation strategies combined with mechanical systems. In Zone 2, slower-responding systems like chilled beams and ceilings are favored. To identify the most efficient configuration, simulations are conducted iteratively. In one iteration, Zone 1 maintains a constant HVAC system while Zone 2's system is varied. The process is then reversed, with Zone 2 holding a constant system and Zone 1's system undergoing adjustments. This iterative approach is repeated across different floor levels to determine the most energy-efficient overall strategy.
FINDINGS
The simulations were used to compare the efficiency of using separate HVAC systems for the two zones versus a single system for the entire floor. The results consistently showed that a single HVAC system for the entire floor proved to be more efficient across different floors and regardless of zone size. This finding suggests a potential design optimization by simplifying the HVAC layout without compromising efficiency.
Based on the findings from the HVAC simulations, a simplified layout with one VAV (Variable Air Volume, Air-cooled chiller, Steam humidifier, Air-side HR, Outdoor air reset) system for each floor will be implemented for the energy analysis. While air-source heat pumps (ASHP) and ground-source heat pumps (GSHP) proved to be most energy-efficient options, due to their renewable nature, we will prioritize a VAV system at this stage. Renewables will be analysed at a later stage.
Circular ducts are generally considered more energy-efficient than rectangular ducts due to their lower airflow friction losses. Therefore, we will be utilizing circular ducts for this project to maximize energy efficiency.
The two-phase duct sizing process employs the same methodology for both the centralized ducts and the branch ducts on each floor. First, the cooling and heating loads for each zone and the entire building are analyzed. The dominant load (either heating or cooling) is then selected Based on this dominant load for the zone, the required volume air flow rate (CFM) is determined. Finally, a duct pressure loss chart is used to select the appropriate duct size that can deliver the required airflow while maintaining acceptable pressure drop within the duct system. The airflow velocity is 5m/s to meet the the high heating/cooling loads.
Figure 19 shows the Centralised Duct sizing, depending on Air flow rate, 0.45m dia duct is used for floor level branch ducting.
Identify the dominant load (heating or cooling) [kW] Use the value to find Air flow rate (CFM) [m3/s] Use Pressure loss chart for sizing
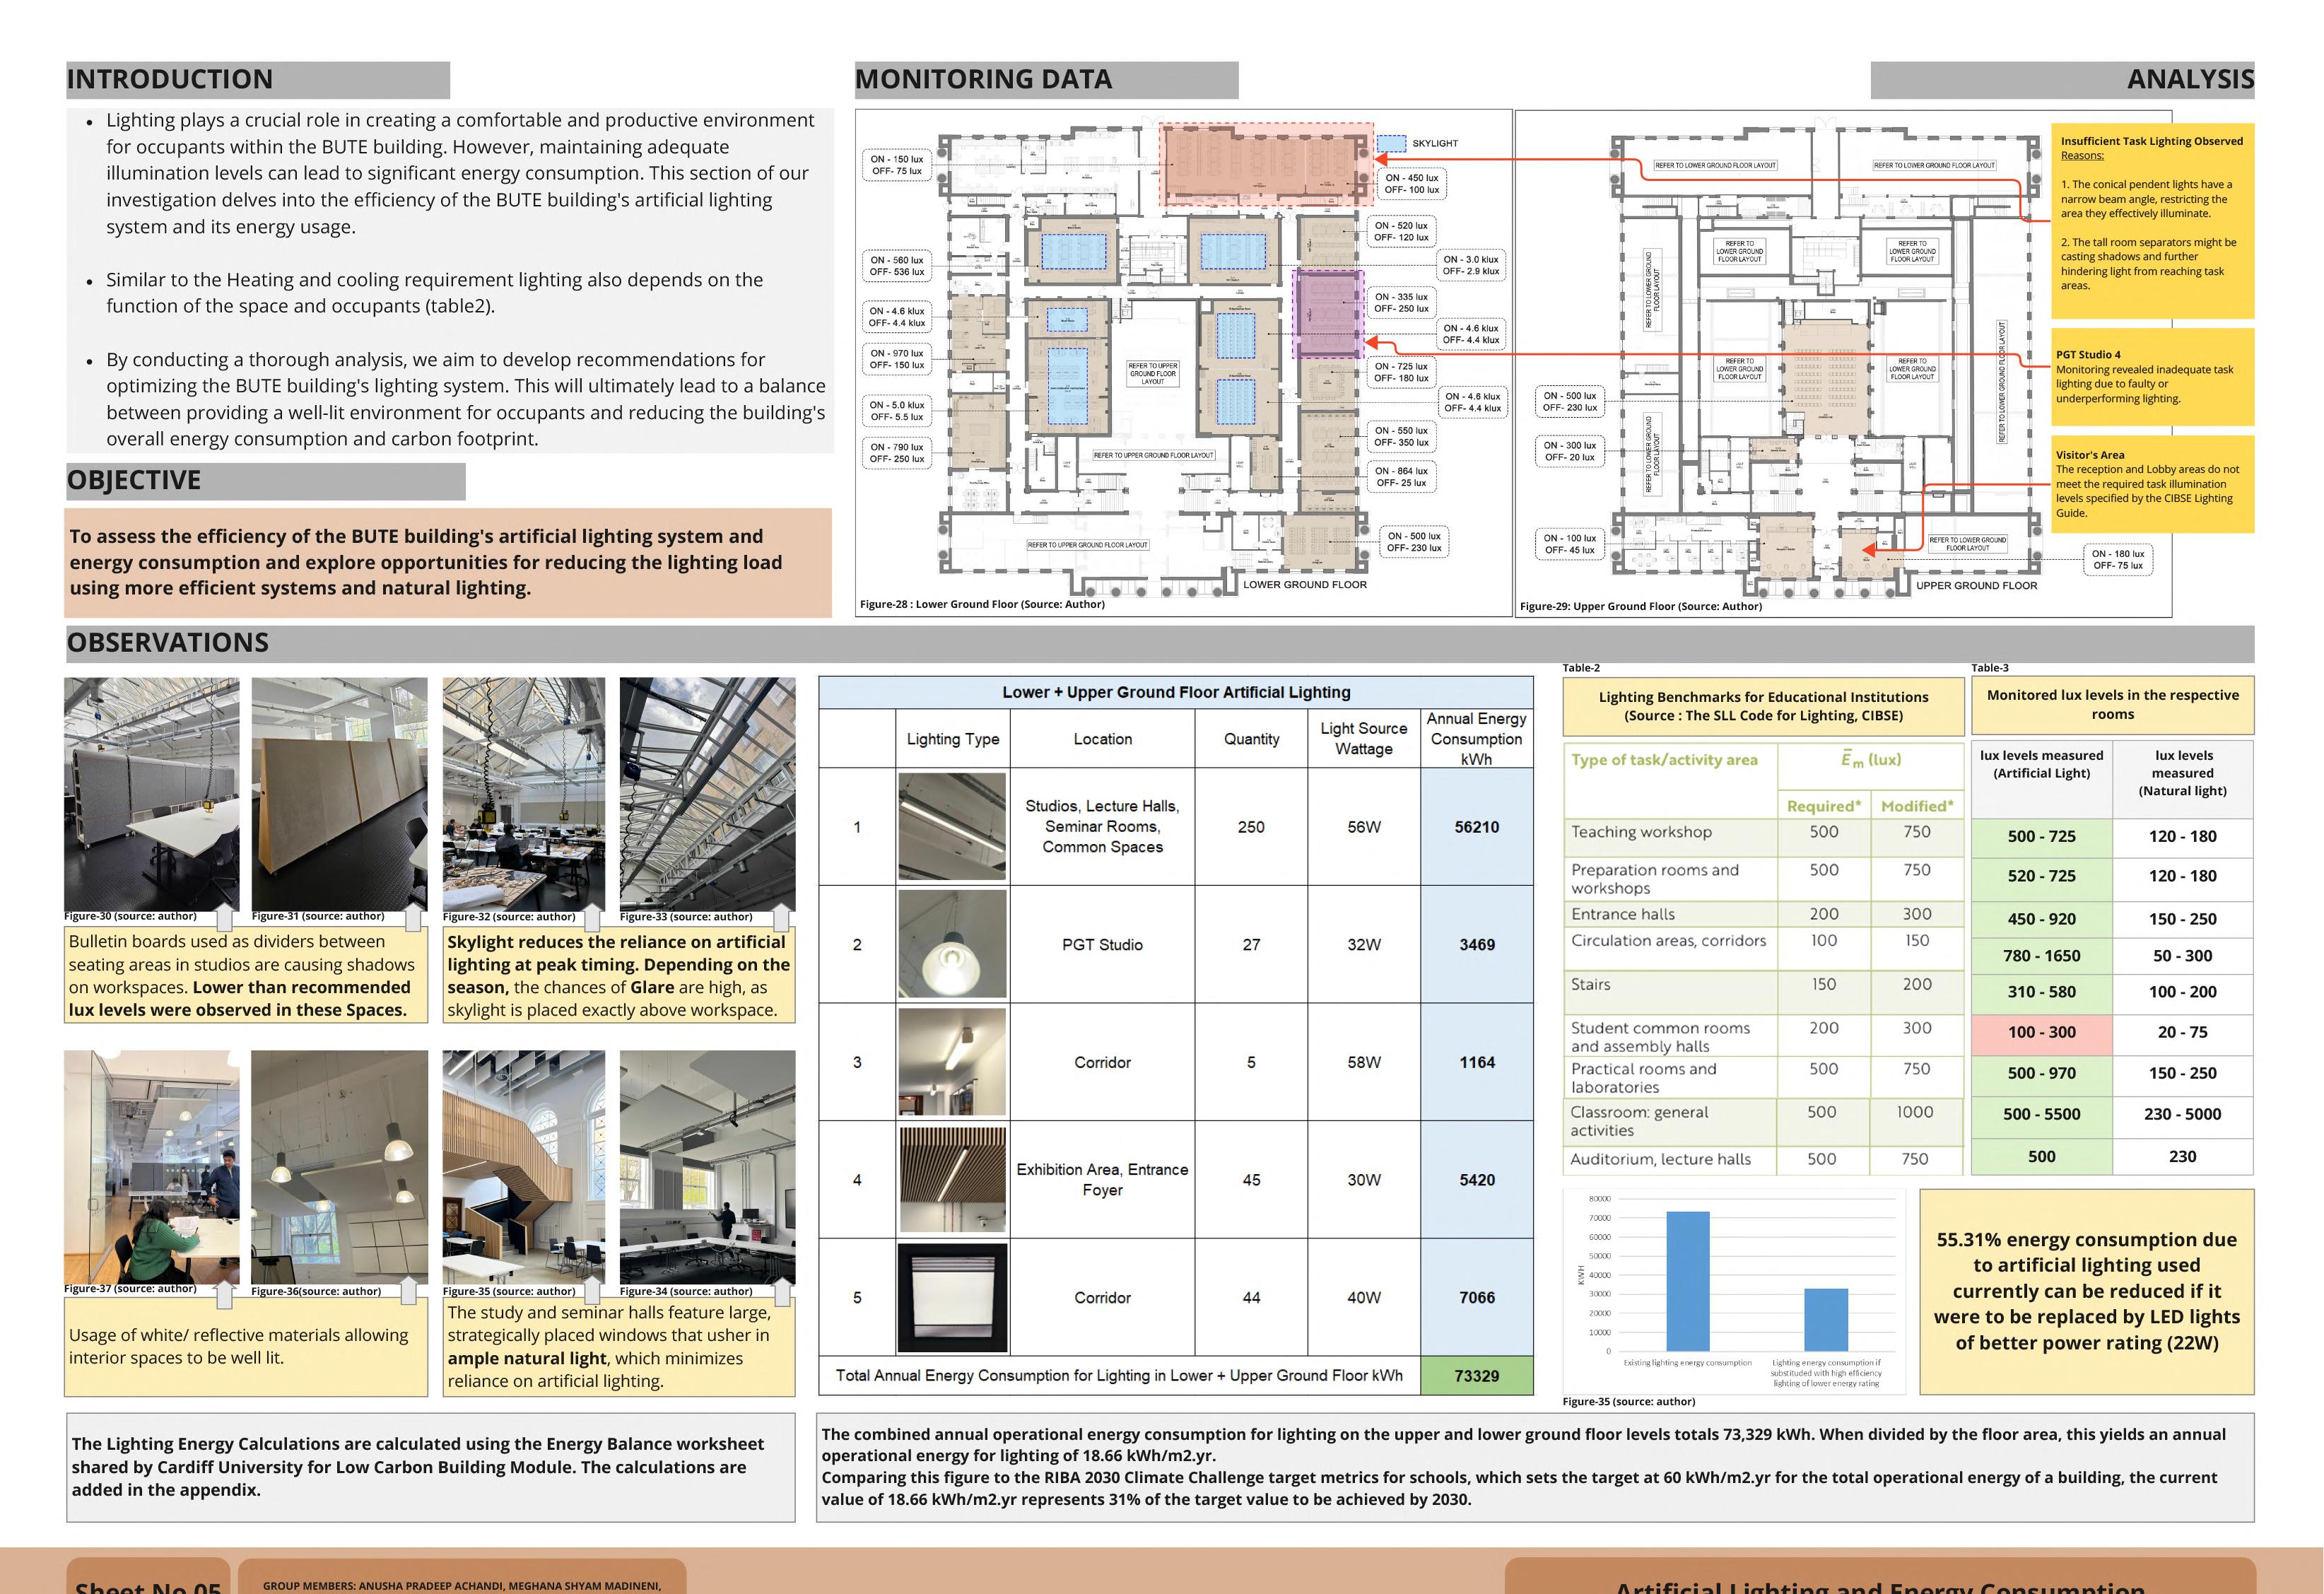
Phase 1: This phase will involve iterative evaluations using different lighting fixtures and power densities This means we will explore various lighting options and their corresponding energy consumption to find the most efficient combination.
Phase 2: Building upon the findings from phase 1, we will re-evaluate the window-to-wall ratio (WWR) of the building. The goal of this phase is to determine if adjustments to the natural daylighting strategy can further optimize overall energy consumption while maintaining adequate occupant comfort.
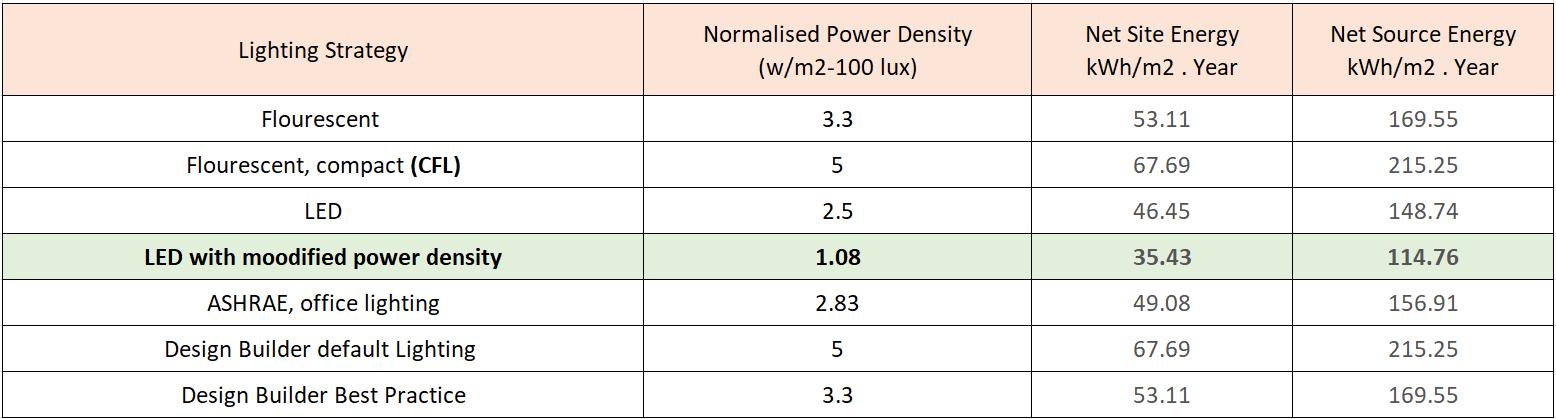
The analysis identified LED lighting with a normalized power density of 1.08 W/m²-100 lux as the most energy-efficient option. This selection helps us achieve Passive House energy efficiency standards, where source energy consumption remains below 120 kWh/m² per year. (Pracki, 2020) suggests a range of 1.08‒3.42 W/m² per 100 lx for normalized power density in office settings.
Given the current 35% WWR, analysis indicates insufficient daylight penetration to meet the required task illuminance levels for office work (typically between 300 and 700 lux, with an average of 400 lux for general office work as per CIBSE Lighting Guide). This necessitates adjustments to the window-to-wall ratio (WWR) to improve natural daylighting. In this phase, we will explore increasing the WWR to two alternative values: 65% and 95%. We will then evaluate the impact on overall energy efficiency to determine the optimal balance between daylighting benefits and potential heat gain.
The increased WWR significantly reduced lighting loads and improved overall energy efficiency, which was an unexpected finding. In Phase 2, a 35% WWR emerged as the most energy-efficient option without an HVAC system (Passive Design). However, with the addition of an HVAC system in Phase 3, a higher WWR of 95% became the most efficient. This suggests that the increased natural daylight from the larger windows outweighed the potential downsides, such as additional heating or cooling loads managed by the HVAC system.
RENEWABLES
Phase 1: Re-evaluating HVAC Systems for Renewable Options
We will revisit the air-source heat pump (ASHP) and ground-source heat pump (GSHP) options initially considered during the preliminary HVAC evaluations. Re-evaluating these options with a focus on renewable energy integration will allow us to determine the most sustainable and efficient HVAC system for the building.
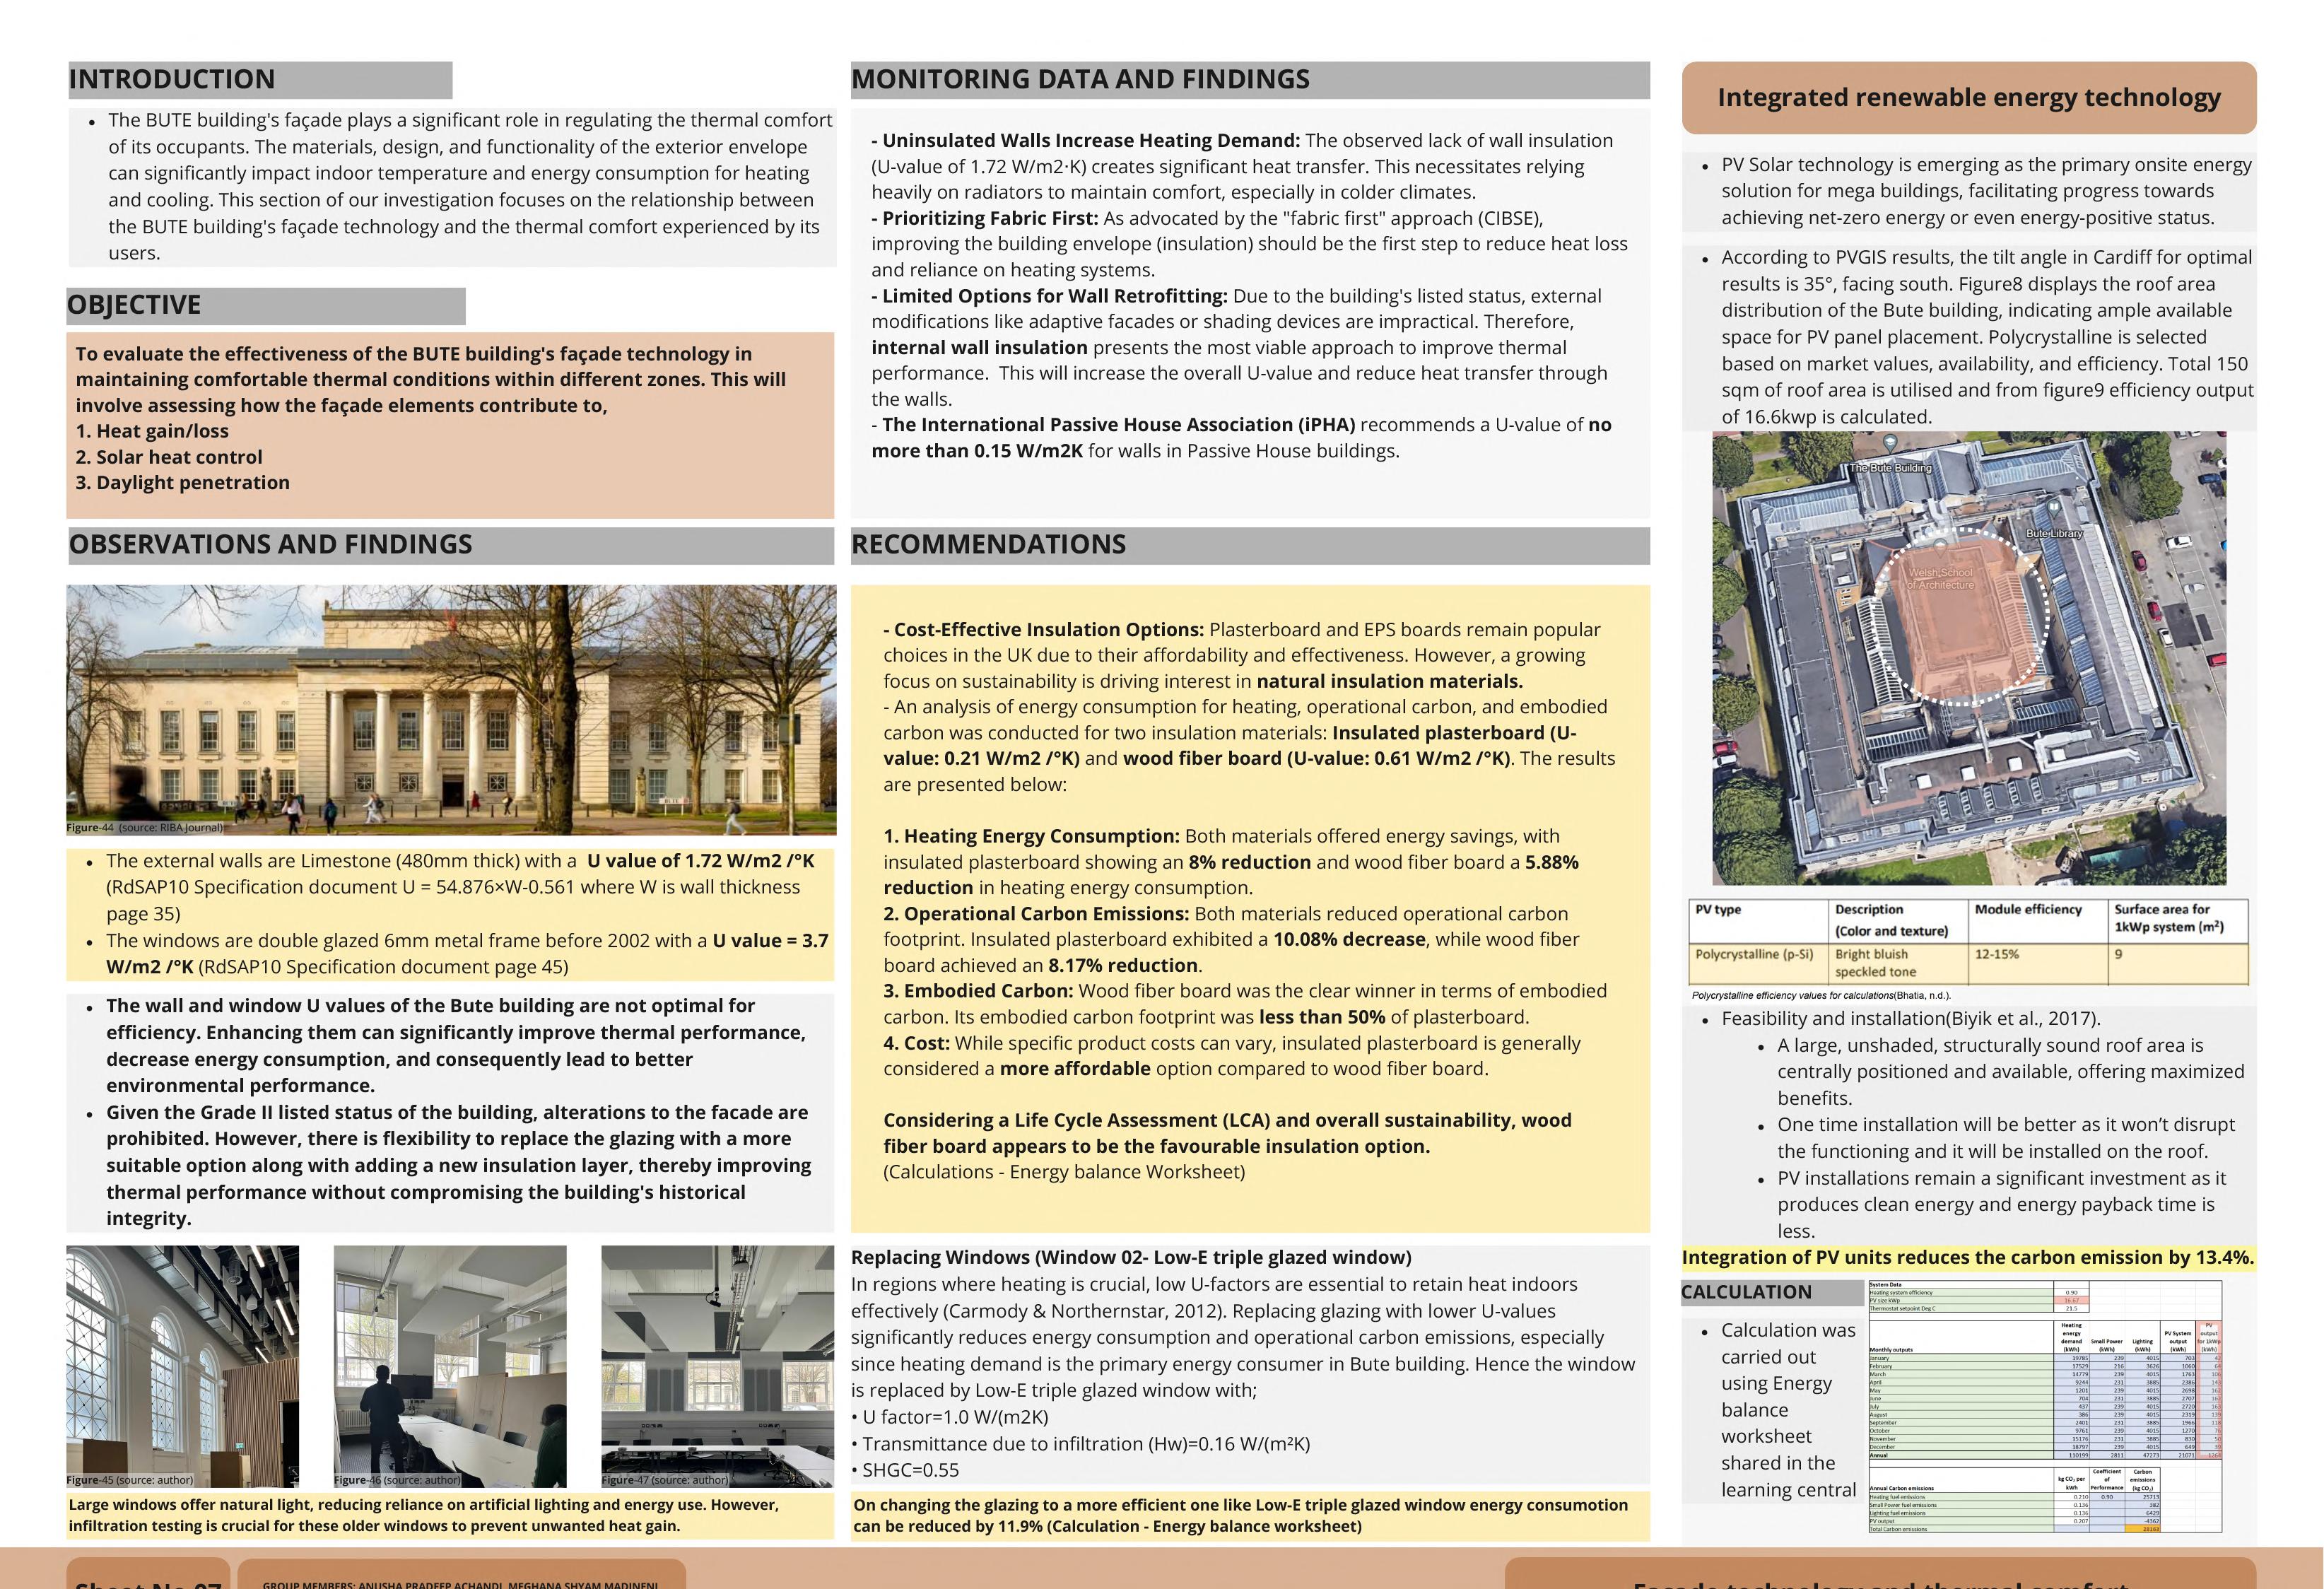
Phase 2: Incorporating Photovoltaic (PV) Systems
The second stage of this phase will involve integrating a photovoltaic (PV) system into the building's design. Solar panels will be strategically placed on the rooftop to capture solar energy and convert it into electricity. This will help offset the building's overall energy consumption and contribute to a more sustainable design.
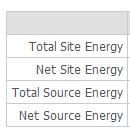
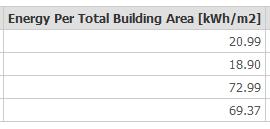
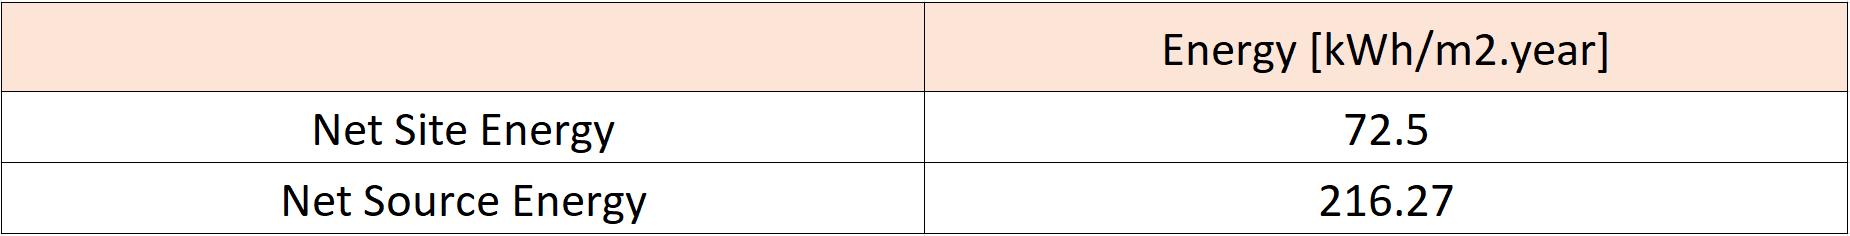
The Total Source Energy after ASHP and PV panles on the rooftop is 72.99 kWh/m2.year.
LOW CARBON RETROFIT
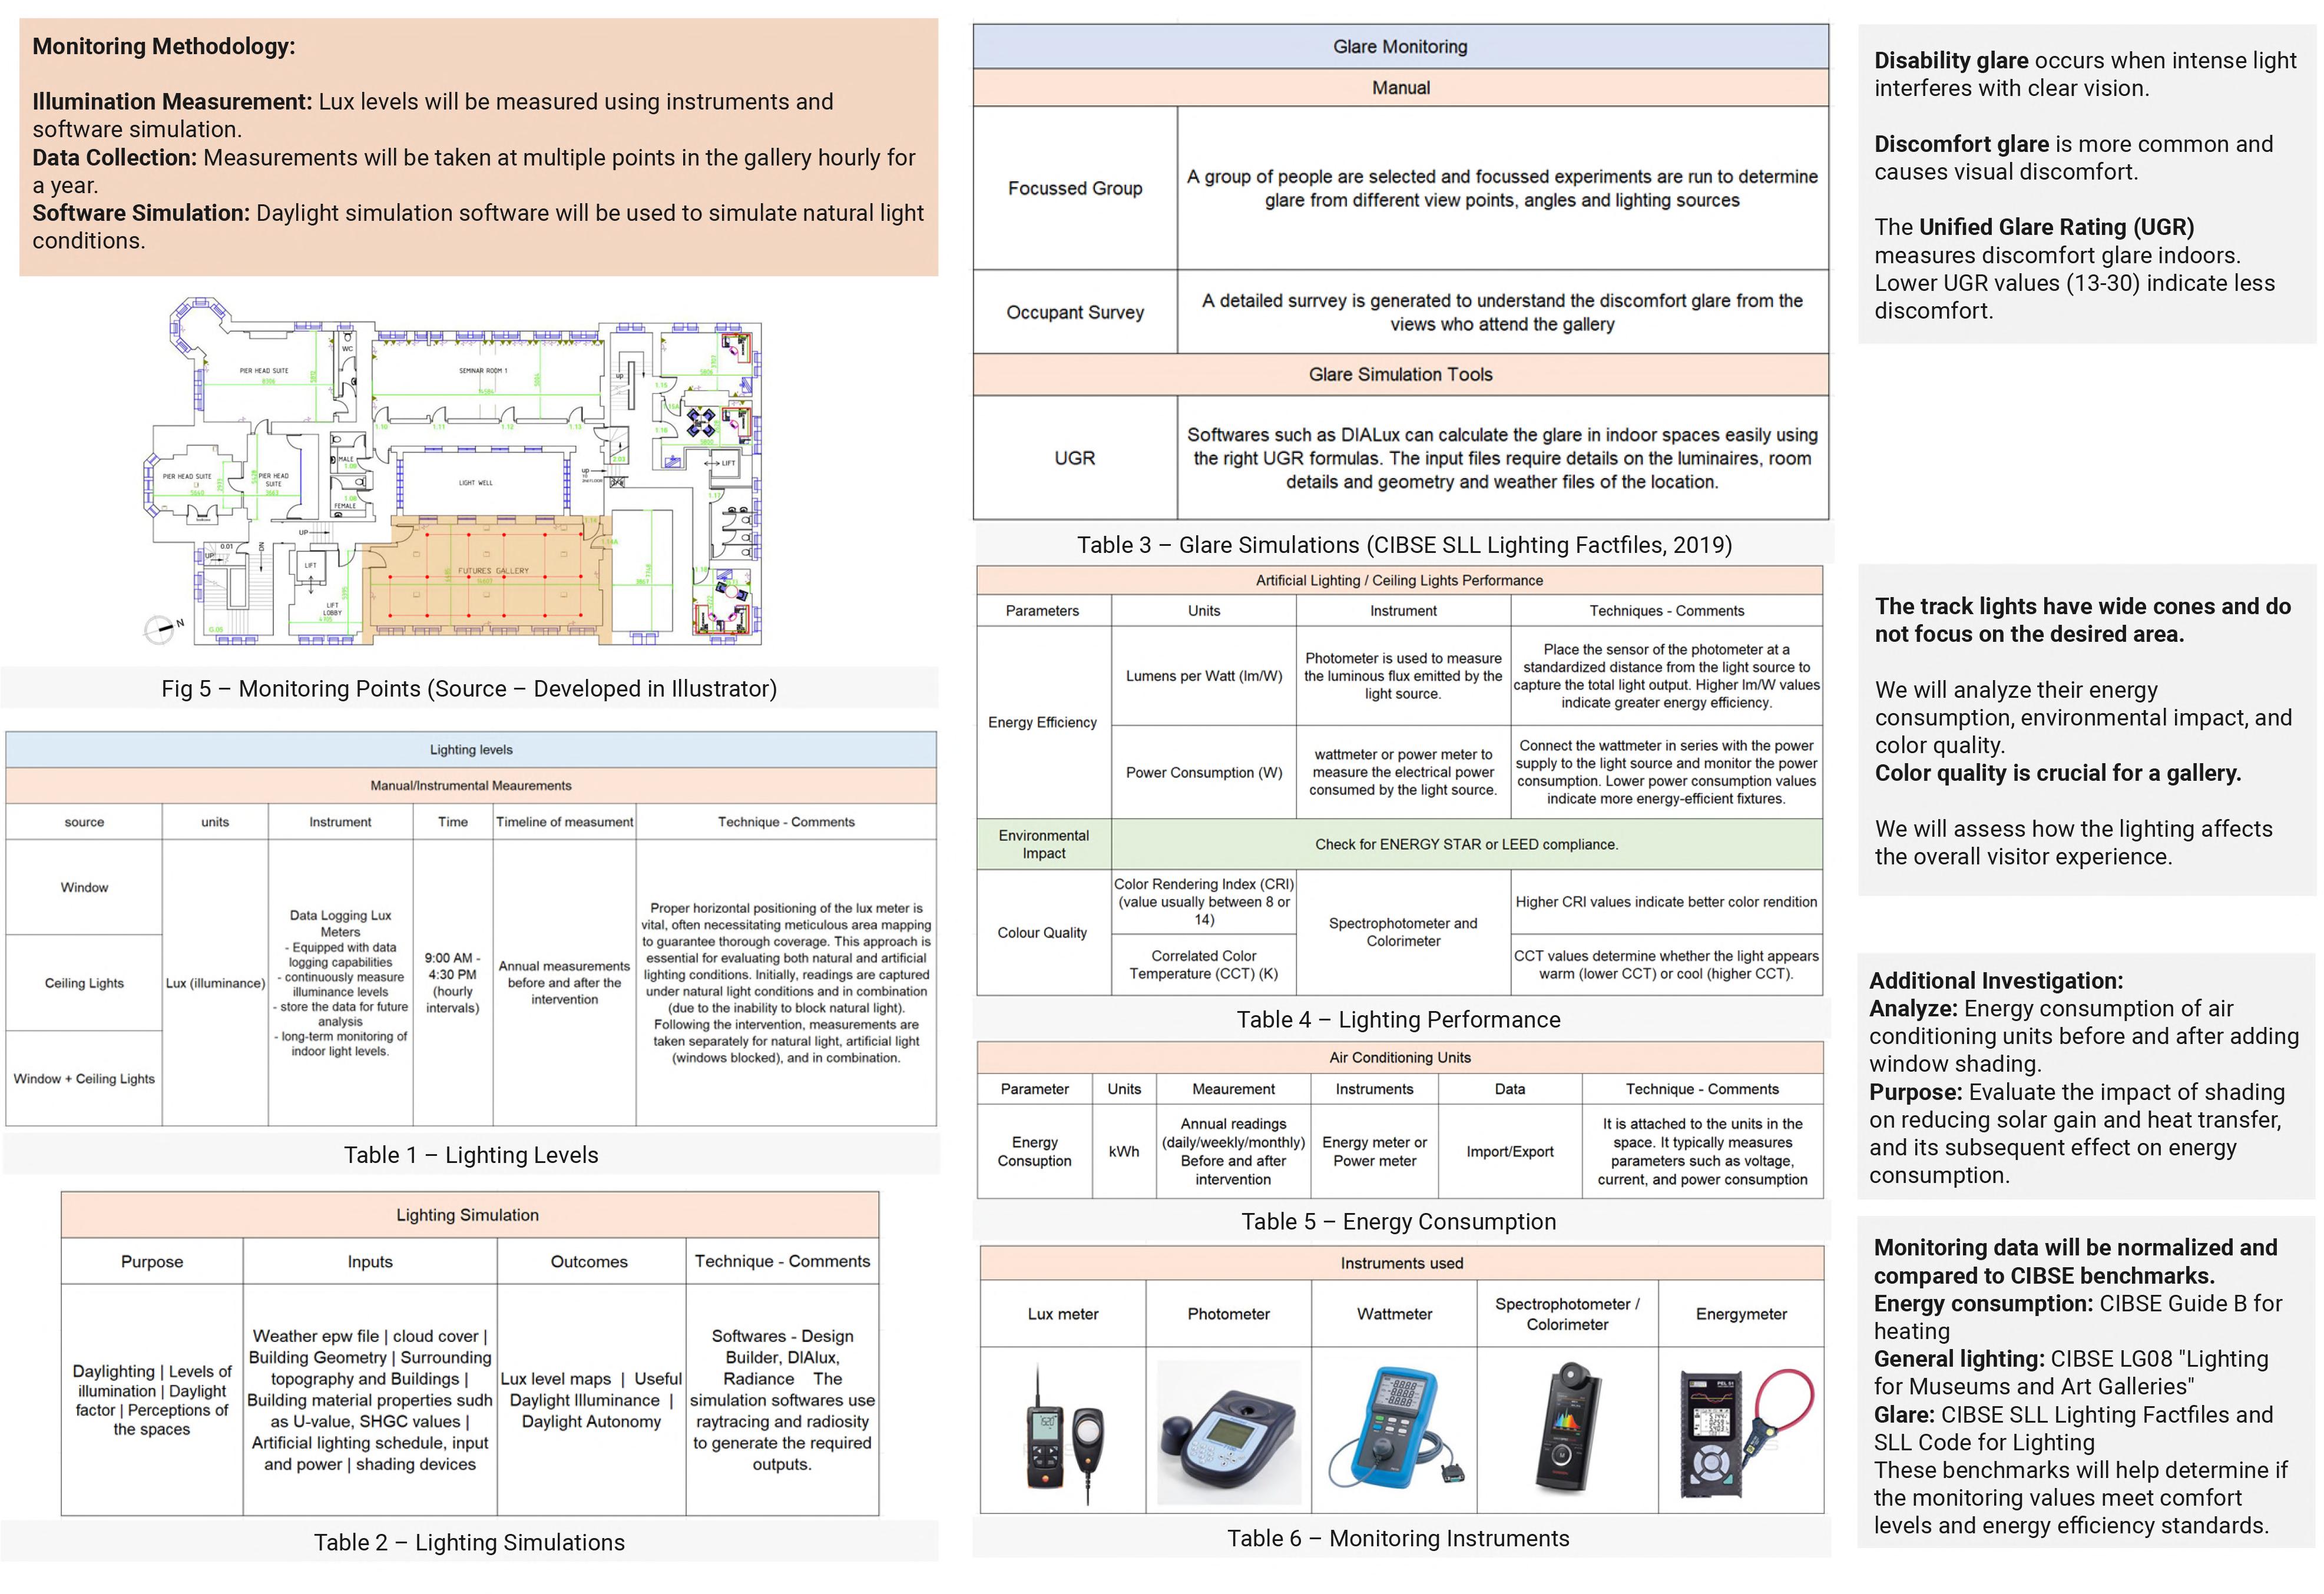
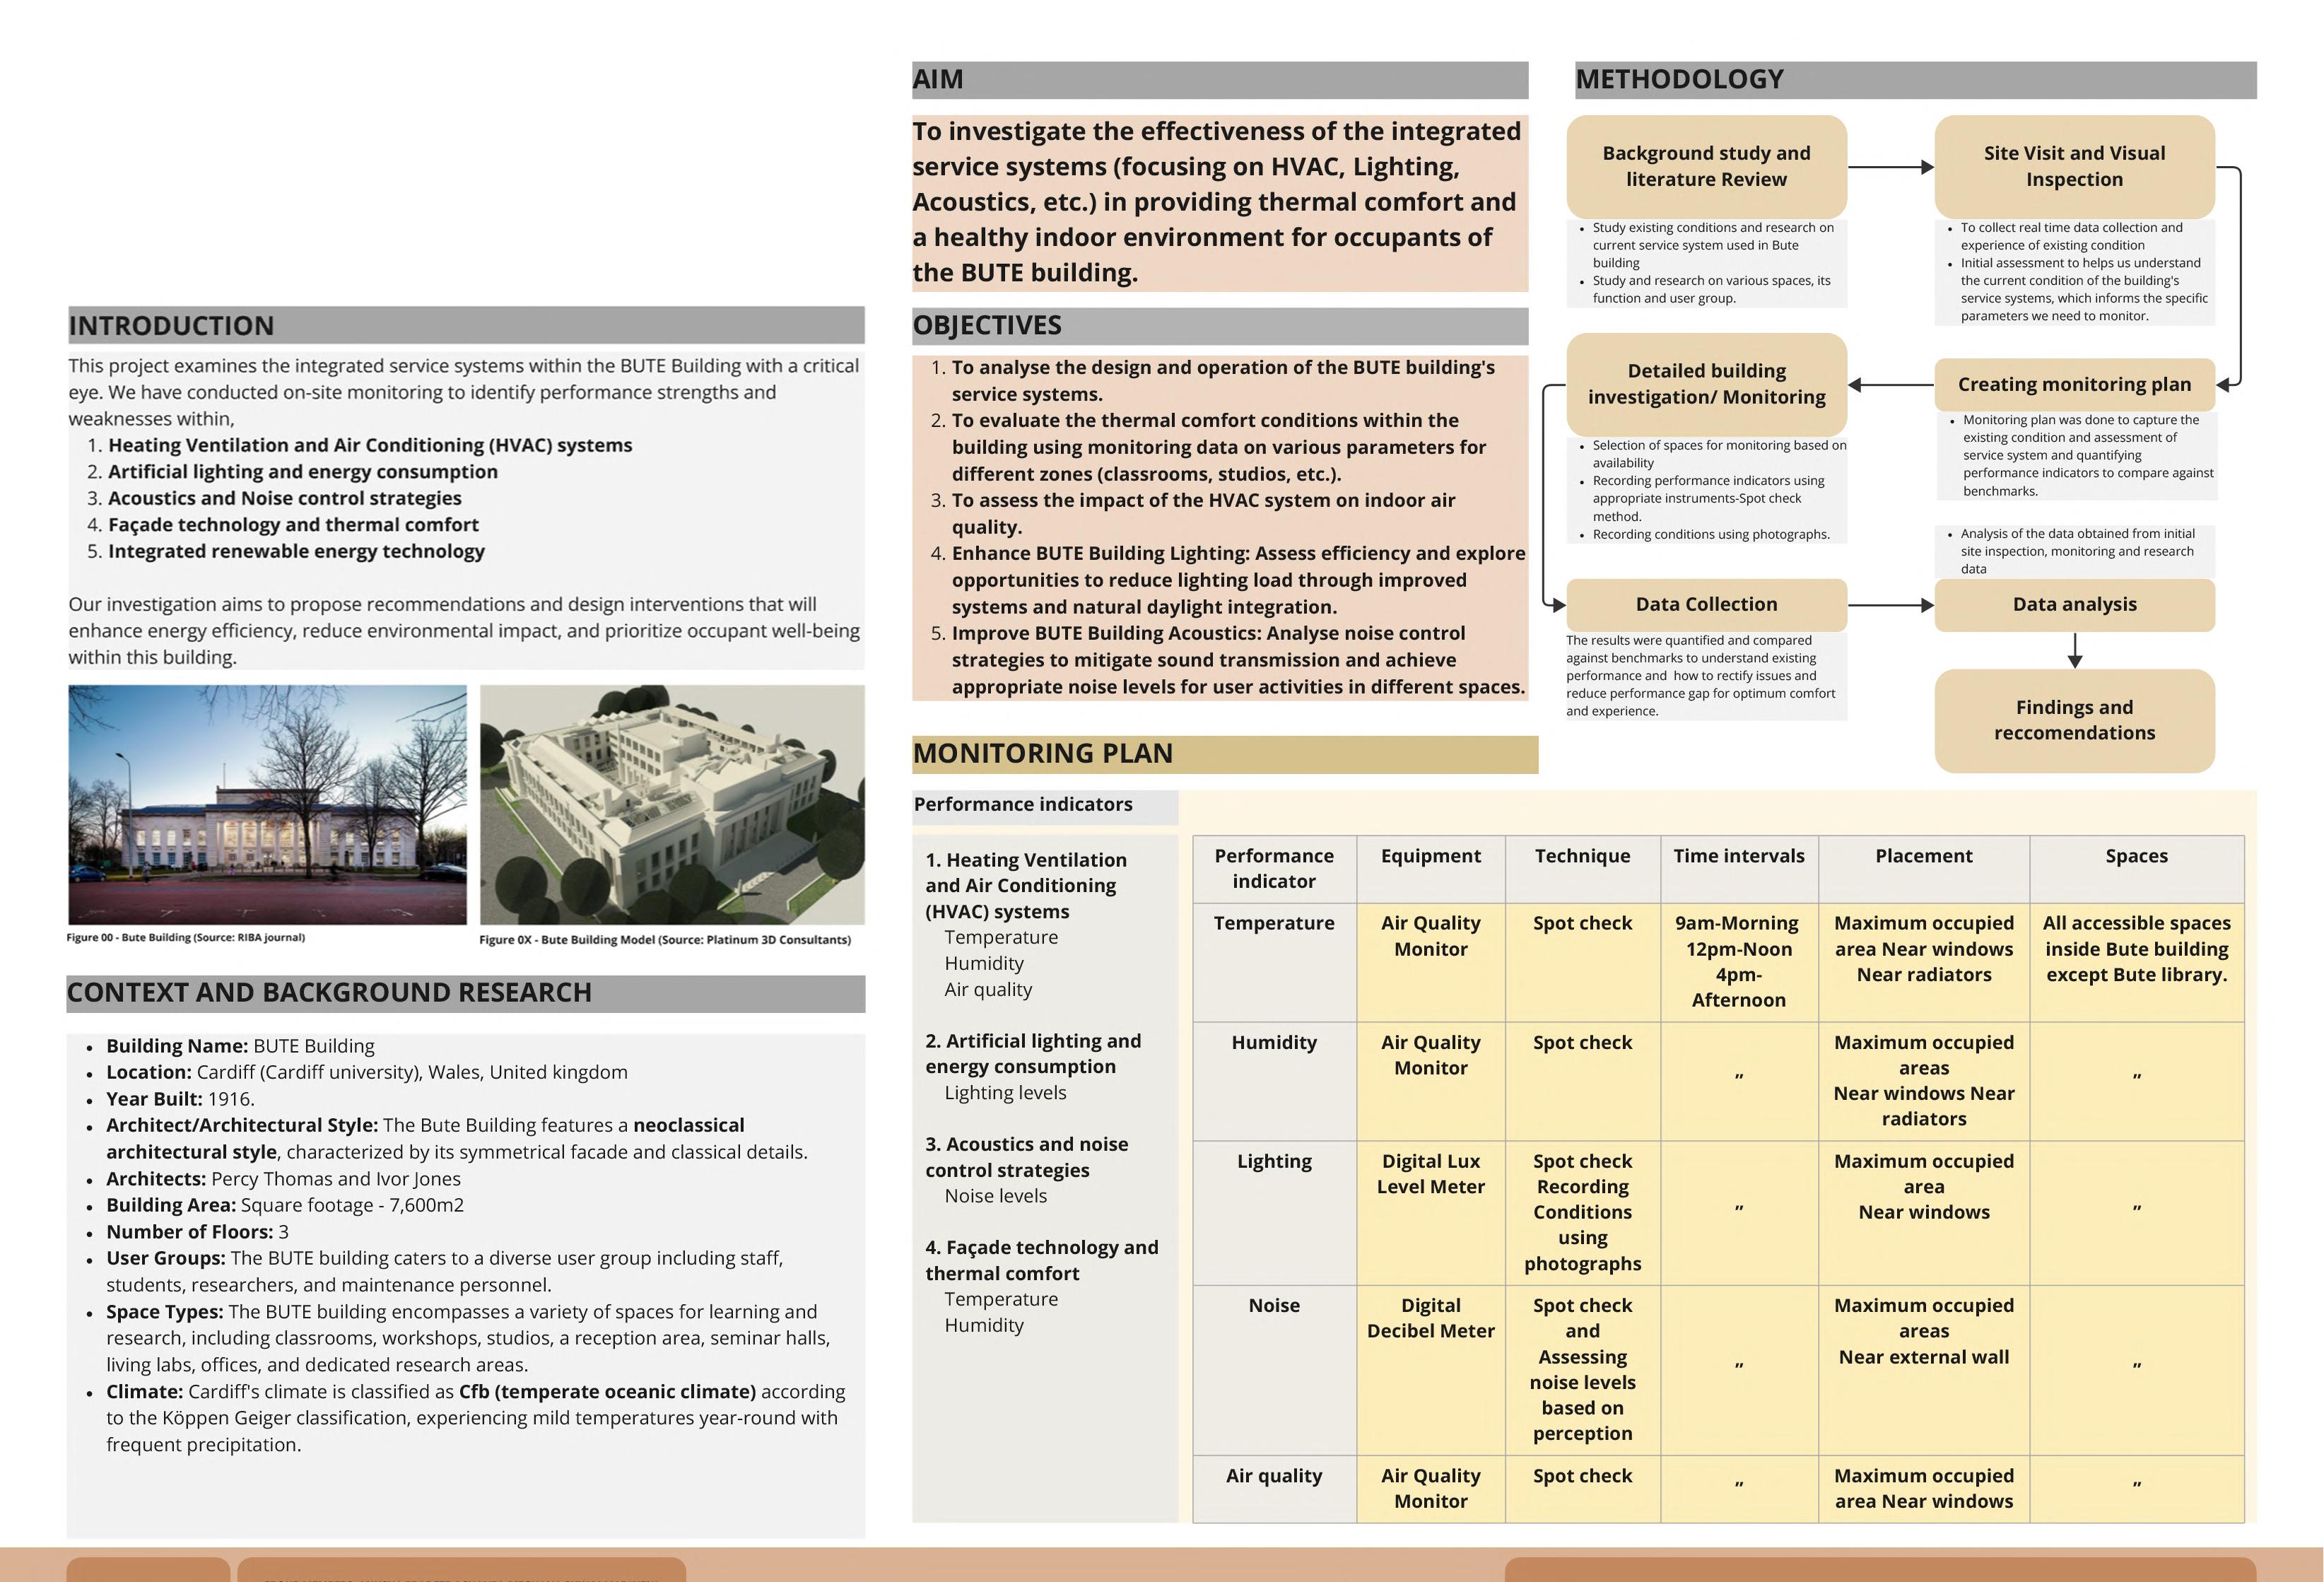
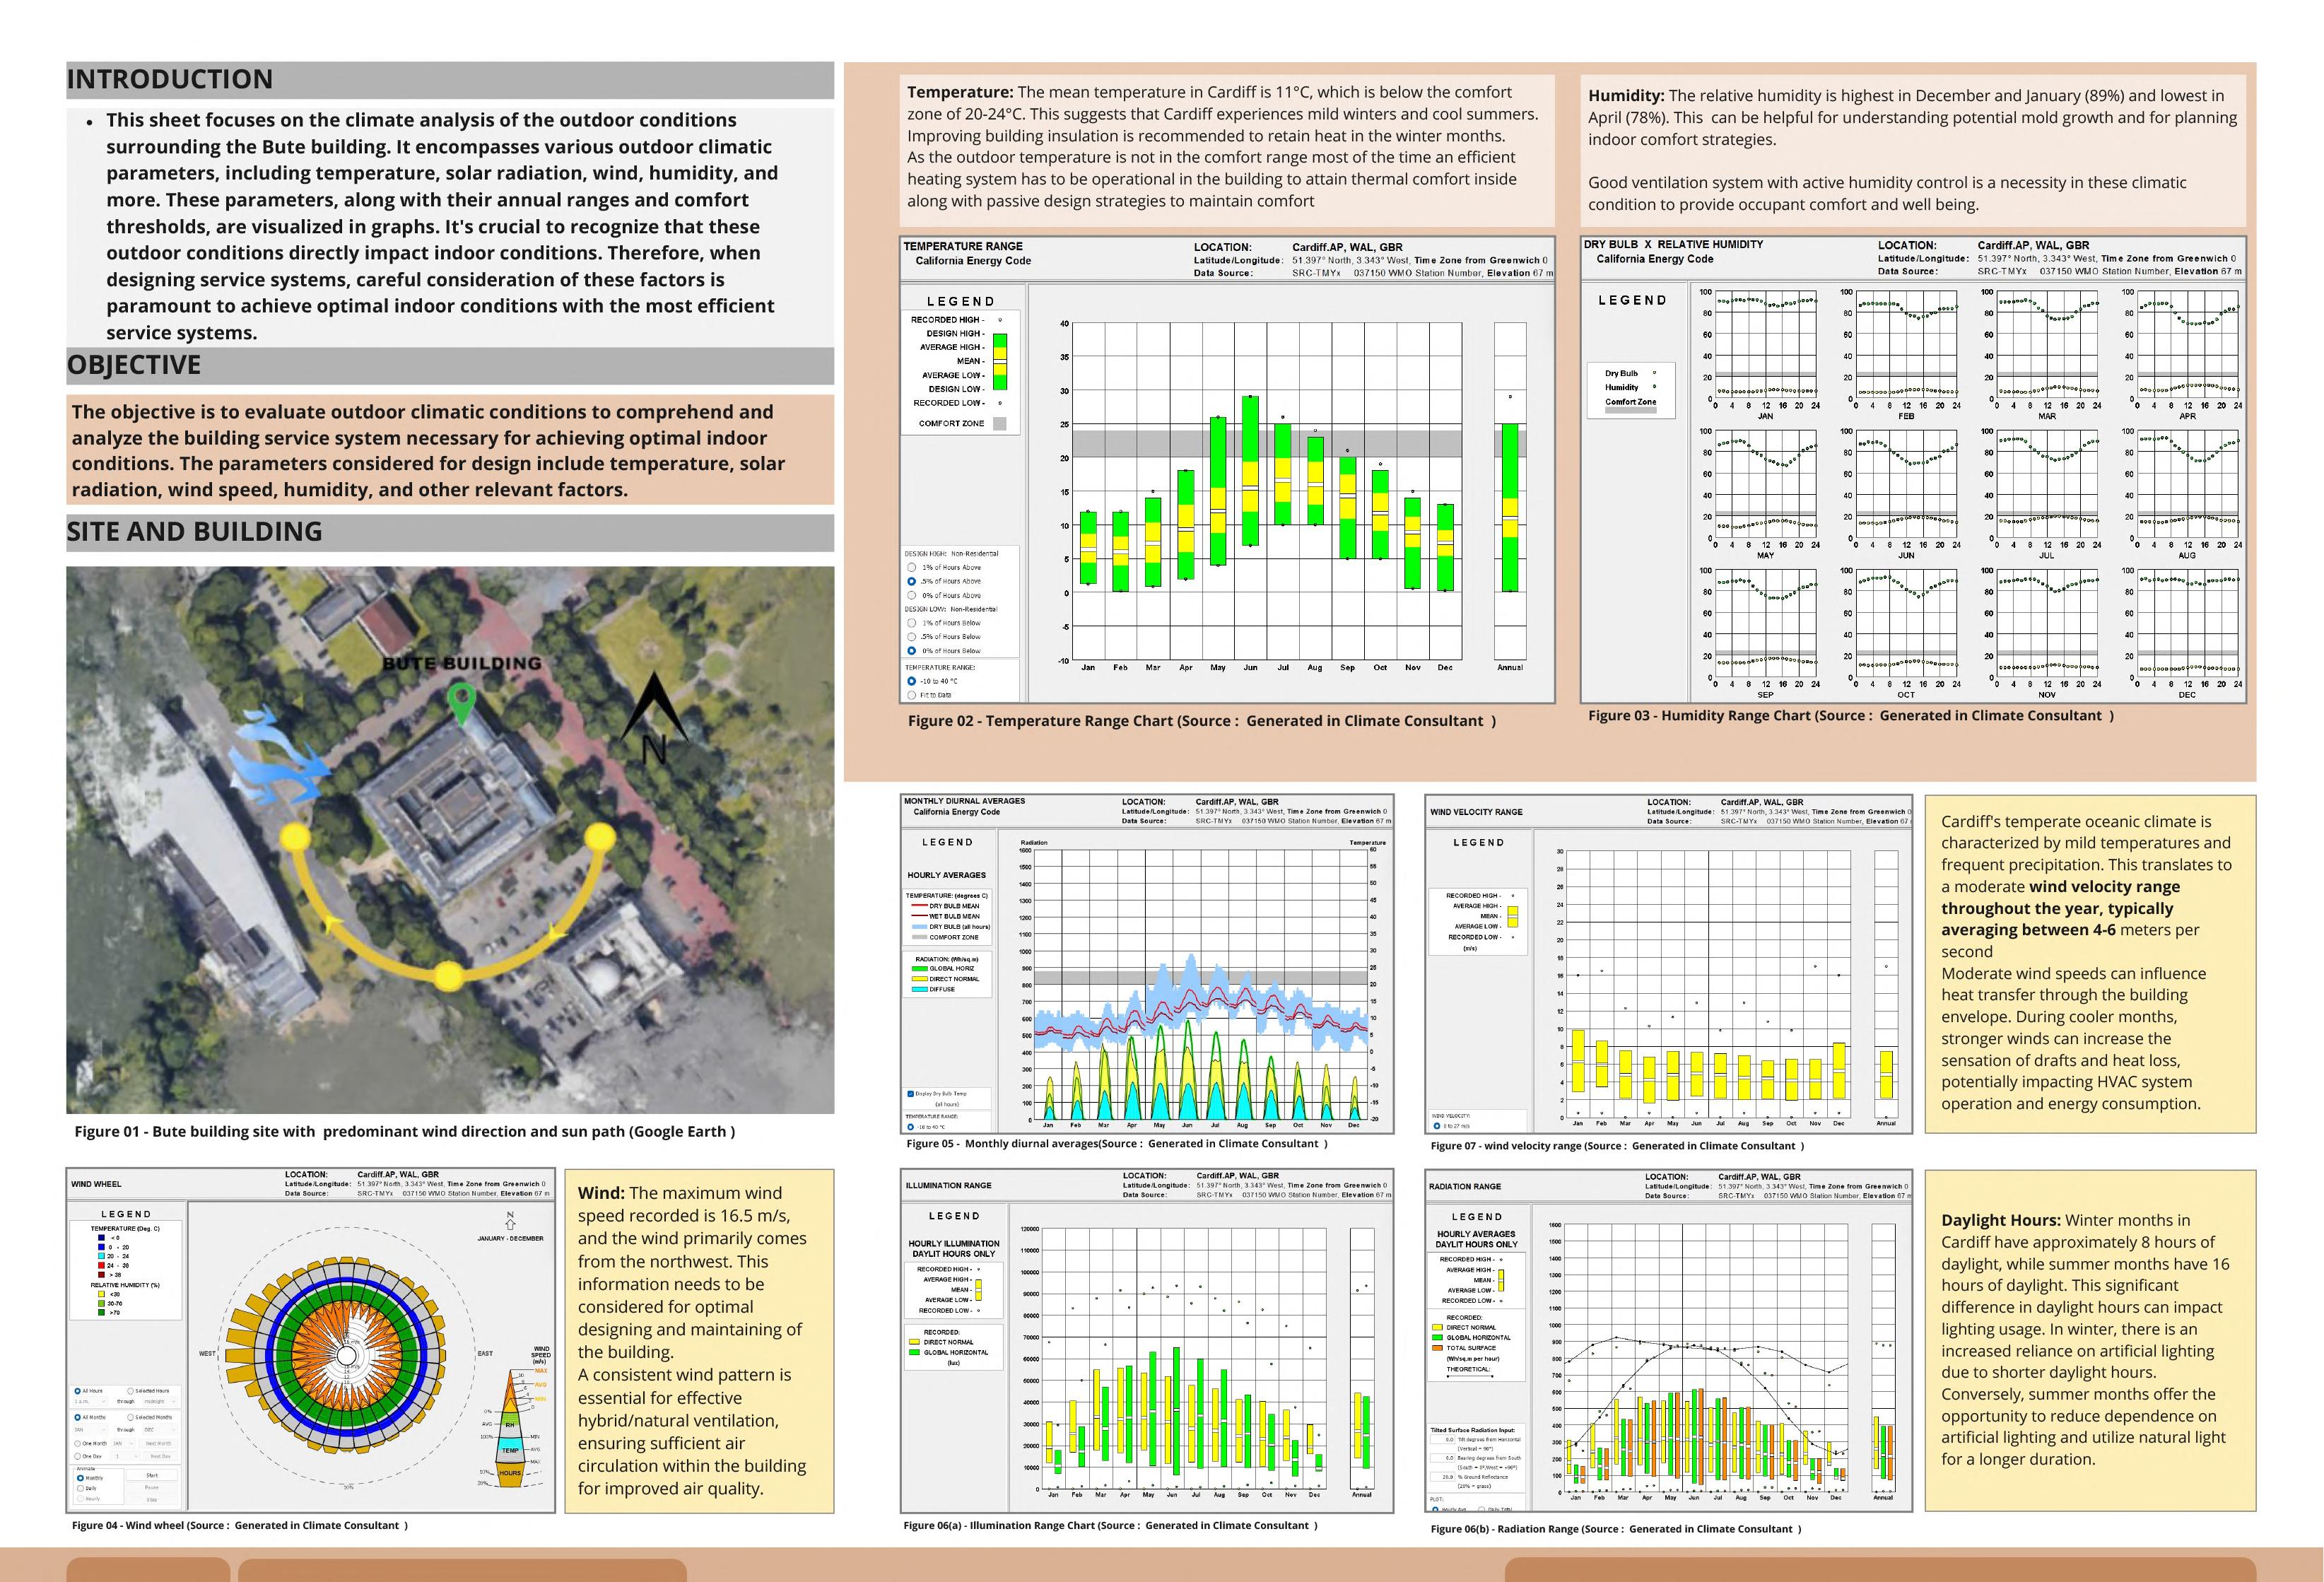
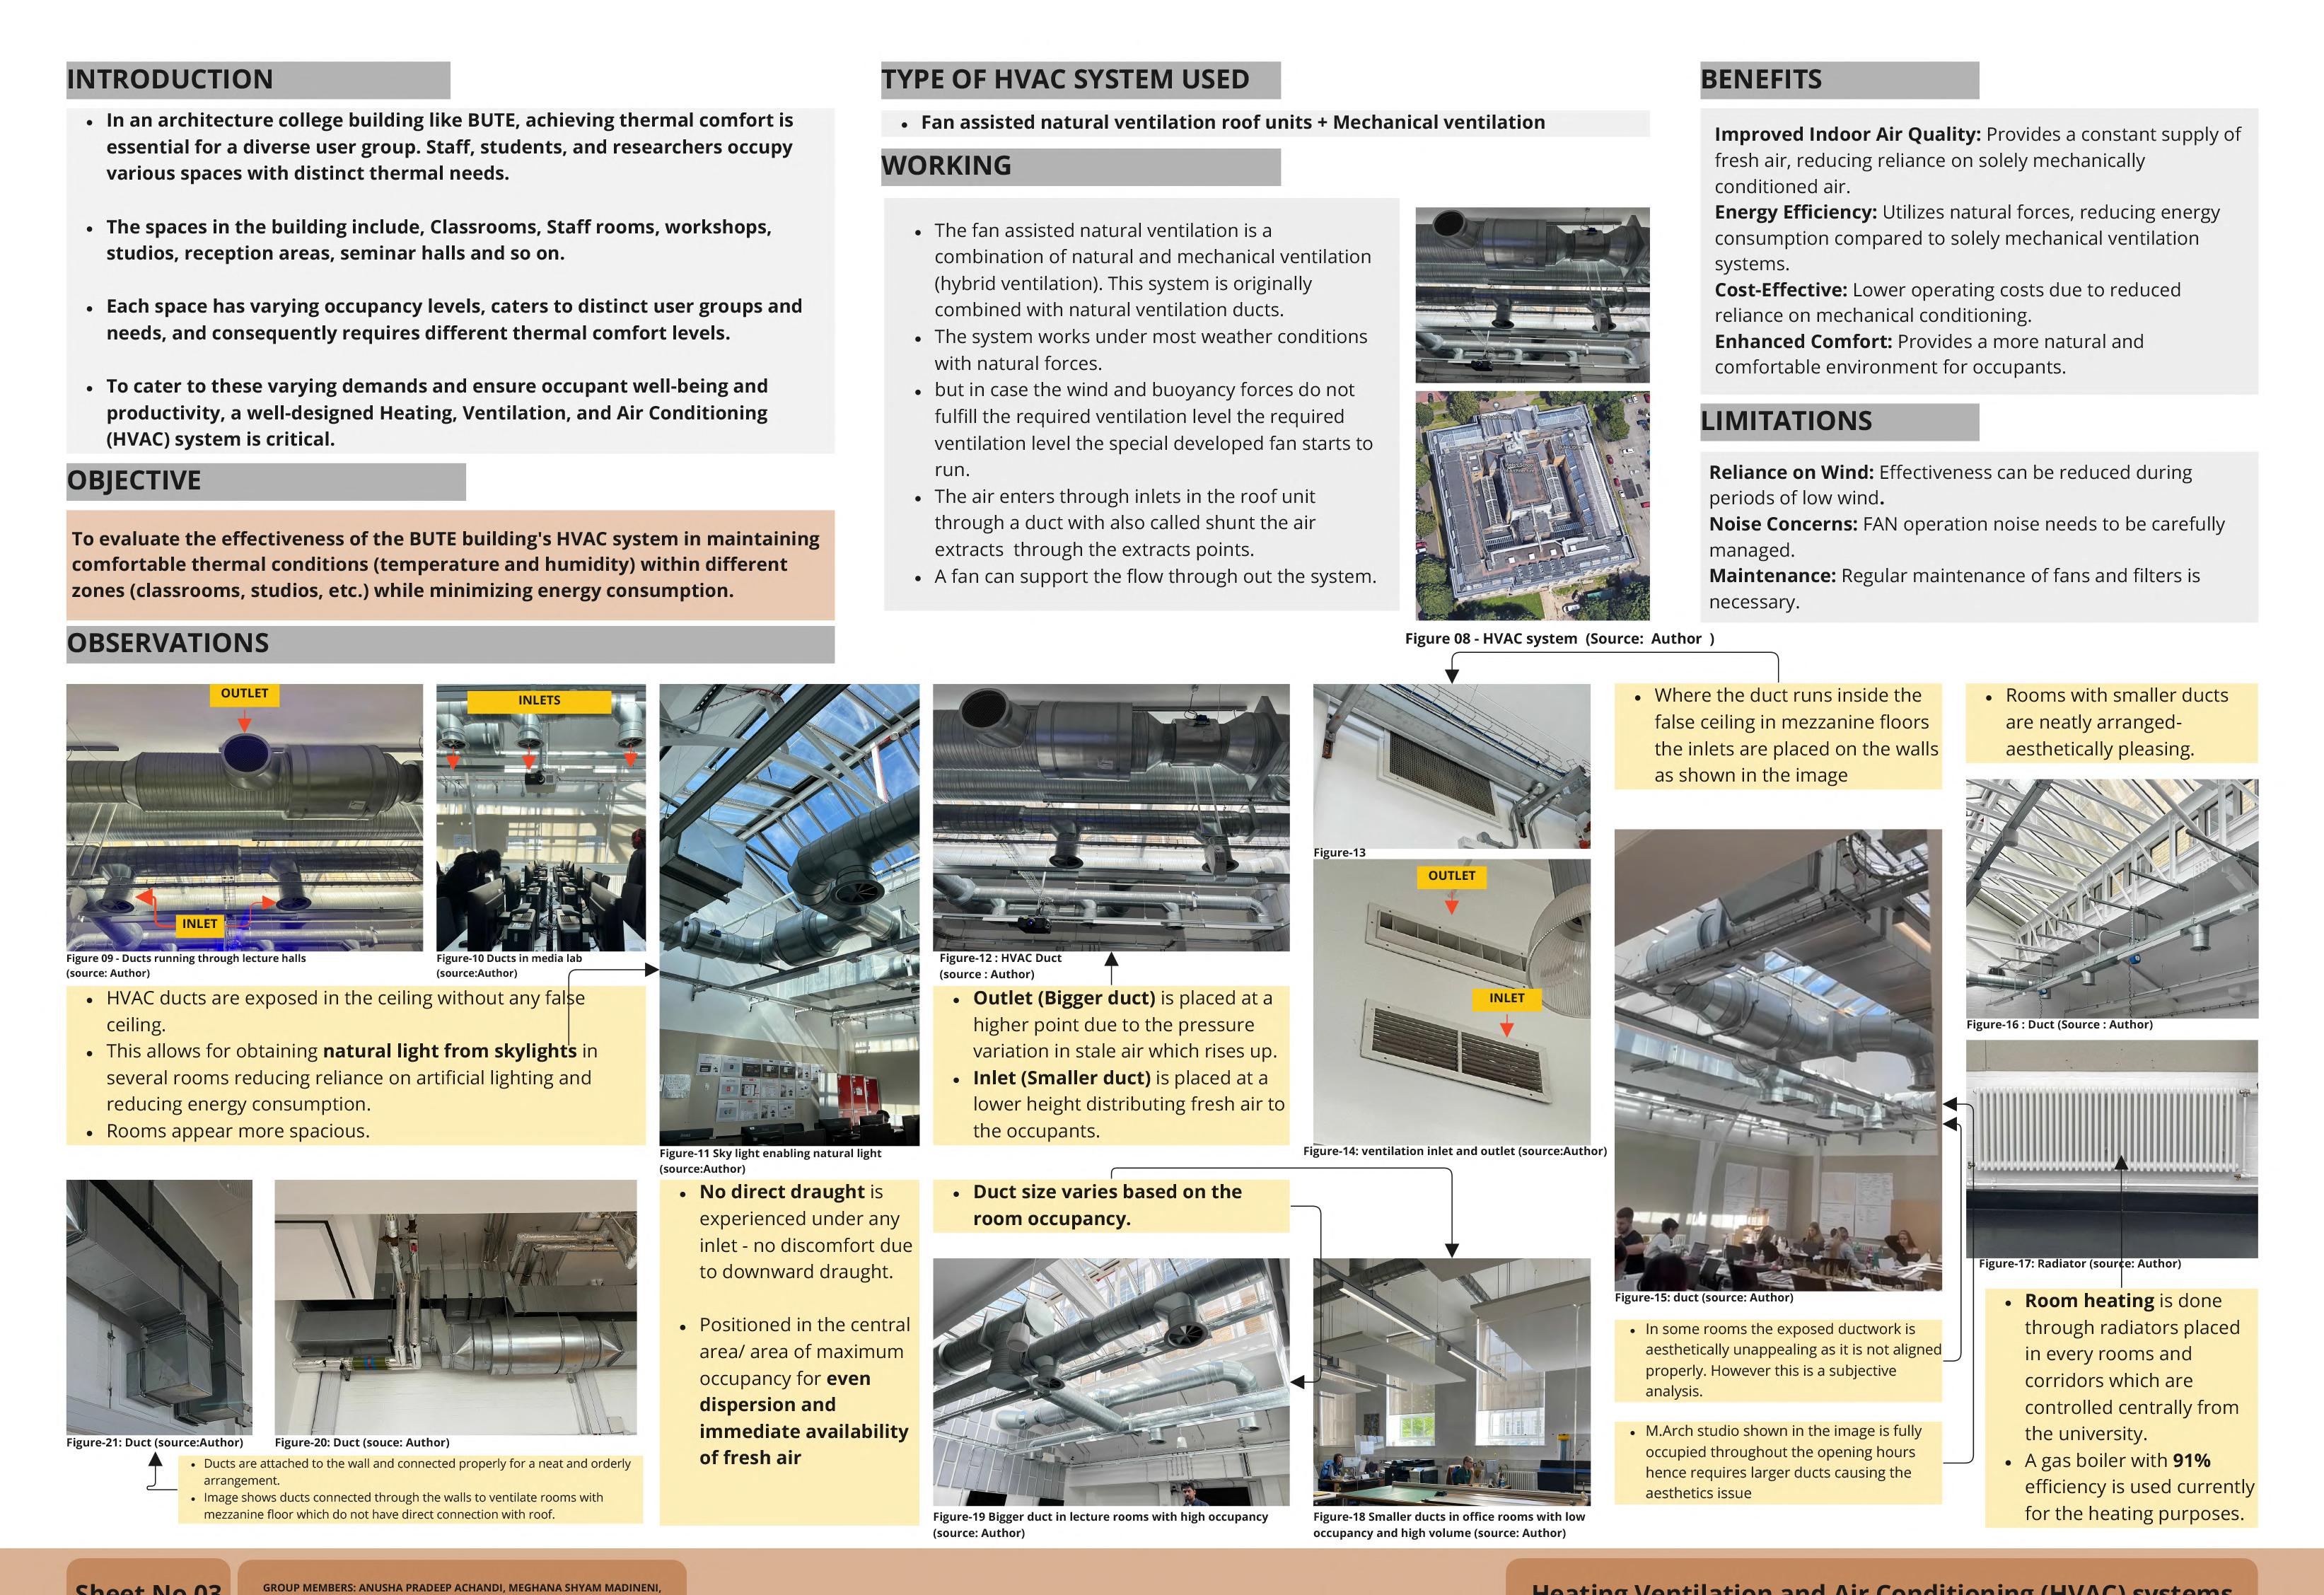
BUILDING INVESTIGATION AND MONITORING